process of debonding in rc beams shear-strengthened with...
TRANSCRIPT

Process of debonding in RC beams shear-strengthened with FRP U strips or side strips
G.M. Chen1; J.G. Teng2; J.F. Chen3
Abstract: Reinforced concrete (RC) beams may be strengthened for shear using externally bonded fibre reinforced polymer (FRP) composites in the form of side bonding, U-jacketing or complete wrapping. The shear failure of almost all RC beams shear-strengthened with side bonded FRP and the majority of those strengthened with FRP U-jackets, is due to debonding of the FRP. The bond behaviour between the externally-bonded FRP reinforcement (referred to as FRP strips for simplicity) and the concrete substrate therefore plays a crucial role in the failure process of these beams. Despite extensive research in the past decade, there is still a lack of understanding of how debonding of FRP strips in such a beam propagates and how the debonding process affects its shear behaviour. This paper presents an analytical study on the progressive debonding of FRP strips in such strengthened beams. The complete debonding process is modelled and the contribution of the FRP strips to the shear capacity of the beam is quantified. The validity of the analytical solution is verified by comparing its predictions with numerical results from a finite element analysis. This analytical treatment represents a significant step forward in understanding how interaction between FRP strips, steel stirrups and concrete affects the shear resistance of RC beams shear-strengthened with FRP strips. Keywords: FRP; Concrete; Bond; Interface; Interfacial stress; Strengthening; Shear failure; Shear resistance; Stress distribution; Strain distribution; Bond-slip model; Debonding ___________________________________ 1 Postdoctoral Fellow, Department of Civil and Structural Engineering, The Hong Kong Polytechnic University, Hong Kong,
China; Email: [email protected].
2 Chair Professor of Structural Engineering., Department of Civil and Structural Engineering, The Hong Kong Polytechnic
University, Hong Kong, China (Corresponding author); Email: [email protected].
3 Reader, Institute for Infrastructure and Environment, School of Engineering, The University of Edinburgh, Edinburgh,
United Kingdom; Email: [email protected].
1
This is the Pre-Published Version.

1. Introduction The shear resistance of reinforced concrete (RC) beams can be enhanced using externally bonded fibre-reinforced polymer (FRP) reinforcement. The FRP reinforcement can be bonded around the entire section (complete wrapping), to the two sides as well as the soffit of the beam (U-jacketing), and to the two sides of the beam only (side bonding) (Teng et al. 2002). Without loss of generality, the FRP shear reinforcement is assumed to be in the form of discrete strips in this paper; a continuous sheet can be represented as discrete strips with a zero net gap between strips (Chen and Teng 2003a). Extensive research has been conducted on the shear strengthening of RC beams with externally bonded FRP in the past decade (e.g. Triantafillou 1998; Khalifa and Nanni 2000, 2002; Taljsten 2003; Chen and Teng 2003a, 2003b; Islam 2005; Pellegrino and Modena 2002, 2006; Bousselham and Chaallal 2004,2006a, 2006b, 2008; Monti and Liotta 2007; Teng et al. 2009), but several aspects of the behaviour of such strengthened beams are still not well understood (Teng et al. 2002, 2004; Bousselham and Chaallal 2004, 2008; Chen 2010). Examples of these aspects include shear interaction between the different components of the shear resistance (e.g. Mohamed Ali et al. 2005; Teng et al. 2009; Chen et al. 2010a), the effect of beam size (e.g. Leung et al. 2007), and the effect of shear span-to-depth ratio (e.g. Bousselham and Chaallal 2004). Almost all RC beams shear-strengthened with FRP side strips (side-bonding), and most of those strengthened with U-strips (U-jacketing) fail due to the debonding of FRP strips from the beam sides (Chen and Teng 2003a; Teng and Chen 2009). This failure mode is usually brittle so that the width of the critical shear crack is limited when debonding occurs. As a result, not all steel stirrups intersected by the critical shear crack may reach yielding at the shear failure of the beam (Teng et al. 2002, 2004; Li et al. 2002; Carolin and Taljsten 2005; Mohamed Ali et al. 2006; Pellegrino and Modena 2002, 2006; Monti and Liotta 2007; Bousselham and Chaallal 2008). Consequently, the steel shear reinforcement may not be fully mobilized and may contribute less than what is predicted by existing shear strength models when beam shear failure occurs due to debonding (Chen 2010). Chen et al. (2010a) has recently demonstrated that adverse interaction between external FRP shear reinforcement and internal steel shear reinforcement may significantly affect the effectiveness of FRP shear strengthening for the debonding failure mode, especially when side strips are used. However, the effect of such shear interaction is not appropriately reflected in existing shear strength models for RC beams shear-strengthened with FRP (Chen 2010). To quantitatively assess the effect of shear interaction, it is necessary to understand the development of shear resistance contributed by both the external FRP and the internal steel shear reinforcements as the critical shear crack widens. The development of shear contribution of steel stirrups with the crack width has been numerically investigated by Chen et al. (2010a). This paper presents a closed-form solution for the entire debonding process of FRP U-strips or side strips used to enhance the shear resistance of RC beams, allowing the different stages of debonding to be clearly explained and understood. A particularly important outcome of the solution is the closed-form expressions that describe the development of shear contribution of externally bonded FRP shear reinforcement to the shear resistance of an RC beam as the critical shear crack widens. While the FRP shear reinforcement is assumed to be in the form of discrete strips, the discrete FRP strips are smeared into an equivalent continuous FRP sheet as a convenient approximation for analytical treatment. As a result, the analytical solution is exact
2

for FRP shear reinforcement in the form of a continuous FRP sheet or discrete FRP strips with zero net gaps, but is approximate for discrete FRP strips with non-zero gaps. The solution is developed based on an analytical solution for the full-range behavior of FRP-to-concrete bonded joints, and the assumption of a linear crack shape. The validity of the solution is demonstrated by comparing its predictions with finite element (FE) predictions. An important merit of the closed-form solution is that it can be directly employed in investigating the effect of shear interaction on the shear strength of FRP shear-strengthened RC beams (Chen et al. 2010). It also provides valuable insight into the debonding failure process of RC beams shear-strengthened with FRP. Monti et al. (2004) [see also Liotta (2006)] were probably the first to present a closed-form solution for the shear contribution of shear-strengthening FRP as a function of the shear crack width. They made the following two assumptions: (1) the crack width varies linearly from the crack tip to the crack end; and (2) the slips at the two sides of the shear crack are symmetrical and equal to half of the crack width. The first assumption is also adopted in the present study because it has been shown that a linear crack width variation is the most critical among the many different crack width shapes examined by Chen et al. (2010b). The slips between FRP and concrete at the two sides of the shear crack can be very different, particularly for FRP U-strips as clearly demonstrated in Chen et al. (2010a). Consequently, the slip symmetry assumption is inaccurate as shown in the Appendix. Therefore, the slips at the two sides of the shear crack are rigorously determined in this study. The present solution also differs from that of Monti et al. (2004) in the following aspects: (1) The present solution is strictly based on an analytical solution for FRP-to-concrete bonded
joints with different end anchorage conditions, whilst Monti et al.’s (2004) solution is based on a simplified solution for FRP-to-concrete bonded joints. This leads to substantially different predictions of the FRP shear contribution at the ultimate state especially for FRP side strips as shown in the Appendix.
(2) The present solution includes the full-range behaviour for the development of FRP shear contribution with the shear crack width, while Monti et al. (2004) only aimed to obtain the maximum effective stress in FRP strips and hence the FRP contribution to the shear capacity of the strengthened beam at the ultimate state (see Appendix).
(3) The present study considers bonded areas of FRP as found in practical beams. Monti et al. (2004) considered only an idealized triangular bonded area of FRP, neglecting the bonded areas above the crack tip and beneath the crack end.
2. Full-range behavior of FRP-to-concrete bonded joints Only the bond behavior in the fiber direction of the FRP is considered in this study. This means that an FRP strip bonded to the side of a beam can be represented by an FRP strip bonded to a concrete prism (i.e. an FRP-to-concrete bonded joint) as shown in Fig. 1. With this assumption, the FRP-to-concrete bond behaviour can be examined by studying two types of FRP-to-concrete bonded joints: type A joint in which the FRP strip is free at the far end and type B joint in which the FRP strip is fixed at the far end (Figs 1c and 1d). A side-bonded FRP strip can be modelled using two type A joints representing the interfaces above and below the critical shear crack (Figs 1b and 1c). An FRP U-strip is generally wrapped around a rounded corner and extended to the beam soffit. It can be represented by one type A joint for the interface above, and one type B joint for the interface below the critical shear crack, by treating the end of the FRP strip at the beam bottom as fixed (Figs 1b and 1d). It should be noted that
3

the beam corner may have an effect on the effective FRP rupture strain (Teng et al. 2002) but is unlikely to affect the debonding strain. For simplicity and without loss of generality, a linearly softening bond-slip model as shown in Fig. 2 is adopted to obtain the full-range behavior of both type A and type B joints following Chen et al. (2007). The linearly softening bond-slip model as shown in Fig. 2 is characterized by the maximum interfacial shear stress maxτ and the interfacial slip fδ at which the interfacial stress is reduced to zero, giving the interfacial fracture energy max 2f fG τ δ= . It should be noted that an accurate bond-slip model should have a nonlinear ascending branch and a nonlinear softening branch and a bilinear model can provide a close approximation (Lu et al. 2005). However, it is much more involved to obtain a closed-form solution using such a more complex bond-slip model. Furthermore, Chen et al. (2007) compared the solutions based on a bilinear bond-slip model and a linearly softening bond-slip model respectively and showed that the latter leads to a simple yet sufficiently accurate solution for FRP-to-concrete bonded joints if the fracture energy is the same in both bond-slip models.
2.1 Behaviour of an FRP-to-concrete bonded joint with a free far end (type A joint)
Chen et al. (2007) presented an analytical solution for an FRP-to-concrete bonded joint with both ends of the FRP strip subjected to a tensile force. A type A bonded joint (Fig. 1c) is a special case of this joint with the tensile force equal to zero at one end. Therefore, an analytical solution for the full range load-displacement behaviour of a type A joint can be obtained from Chen et al.’s (2007) solution. A summary of this solution is presented here but further details can be found in Chen (2010). A typical full range load-displacement response of the bonded joint can be characterized by four key points O, A, B and C when the FRP bond length L is larger than the effective bond length (Fig. 3). Accordingly, the curve features three segments, namely segmentsua OA , AB
and BC , which represent the ascending, plateau, and linearly unloading regions of the load-displacement response respectively. The force P, and the displacement (slip between the FRP and the concrete) Δ at the loaded end of the FRP strip for the three segments are as follows. For segmentOA :
(P = sinf fba)
τλ
λ (1)
( ) = 1 cosf aδ ⎡Δ −⎣ λ ⎤⎦ (2) and hence
( )( )
sinP =
1 cosf f
f
b aa
τ λλδ λ
Δ−
(3)
where 1f
f f fE tτ
λδ
= (4)
For segment AB :
4

P = f fbτλ
(5)
= f f dδ δ λΔ + (6) where
0 ud L a≤ ≤ − (7)
= 2ua π
λ (8)
For segment BC :
( ) ( f = + uu
u
P PP
δ−
Δ Δ − Δ )u (9)
where
( )sin =
f fu
uf f
u
bL L a
Pb
L a
τλ
λτ
λ
⎧≤⎪⎪
⎨⎪ >⎪⎩
(10)
( )( )
1 cos =
- f
uf f u u
L L a
L a L a
δ λ
δ δ λ
⎧ ⎡ ⎤− ≤⎪ ⎣ ⎦Δ ⎨+ >⎪⎩
u (11)
In Eqs (1)-(11), is the maximum force that can be carried by the FRP strip with a bond length of
uPL , is the displacement at the loaded end corresponding to , uΔ uP fb , ft and fE are
the width, thickness, and modulus of elasticity of the FRP strip respectively, is the mobilized bond length, beyond which the interfacial shear stress is zero (Chen et al. 2007), is the effective bond length beyond which an increase of
aua
L does not increase , and d is the debonded length of the FRP-to-concrete interface starting from the loaded end.
uP
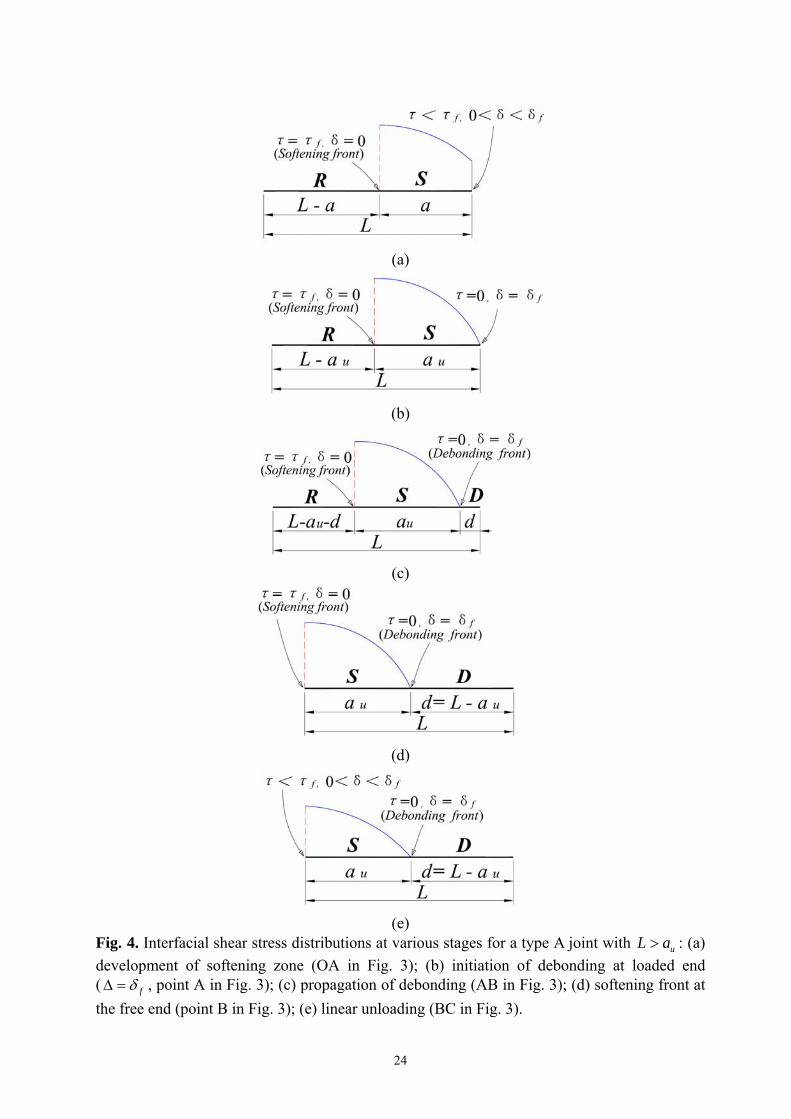
The interfacial shear stress distributions experienced by the FRP-to-concrete interface of a type A joint during the loading process are schematically shown in Figs 4 and 5 for two cases of
and respectively, corresponding to the different stages of the curve in Fig. 3. In Figs 4 and 5, the letters “R”, “S” and “D” stand for rigid (intact), softening and debonded parts of the interface respectively.
uL a> uL a≤ - P Δ
It should be noted that when , point merges with point uL a≤ 'A 'B and segment ' 'A B vanishes. Based on the response of a type A joint (Fig. 3), the following observations can be made: - P Δ(1) For the ascending branch of the - P Δ curve, there is a unique relationship between and
, regardless of the value of the bond lengthP
Δ L . This implies that for an FRP side-bonded strip intersected by a critical shear crack (Figs 1a and 1b), the slips on the two sides of the critical shear crack are symmetrical about the critical shear crack before the maximum FRP stress is reached, regardless of the actual FRP bond length above or below the critical shear crack.
(2) On the plateau (when the bond length L is greater than the effective bond length ), the above unique relationship is no longer valid as the displacement is not unique for the same maximum load . This means that the slips on the two sides of the critical shear crack can
ua
uP
5
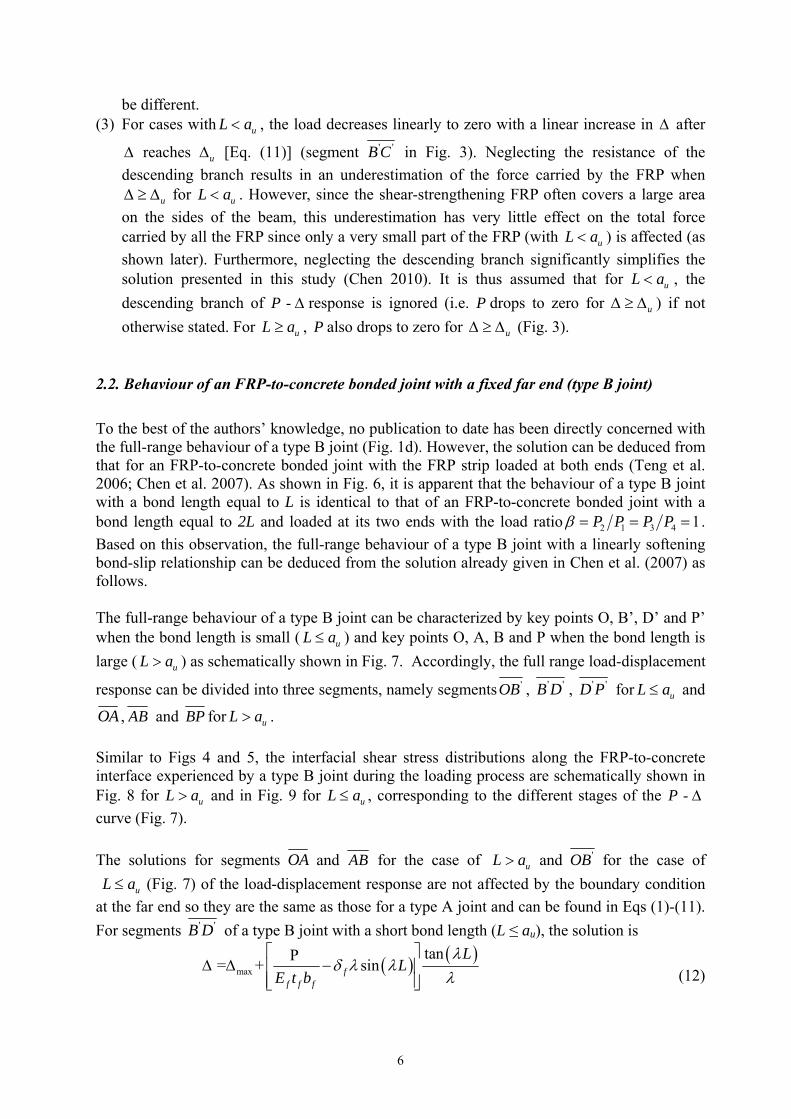
be different. (3) For cases with , the load decreases linearly to zero with a linear increase in uL a< Δ after
reaches [Eq. (11)] (segment Δ uΔ ' 'B C in Fig. 3). Neglecting the resistance of the descending branch results in an underestimation of the force carried by the FRP when
for . However, since the shear-strengthening FRP often covers a large area on the sides of the beam, this underestimation has very little effect on the total force carried by all the FRP since only a very small part of the FRP (with ) is affected (as shown later). Furthermore, neglecting the descending branch significantly simplifies the solution presented in this study (Chen 2010). It is thus assumed that for L , the descending branch of response is ignored (i.e. P drops to zero for ) if not otherwise stated. For , also drops to zero for
uΔ ≥ Δ uL a<
uL a<
ua< - P Δ uΔ ≥ Δ
uL a≥ P uΔ ≥ Δ (Fig. 3).
2.2. Behaviour of an FRP-to-concrete bonded joint with a fixed far end (type B joint) To the best of the authors’ knowledge, no publication to date has been directly concerned with the full-range behaviour of a type B joint (Fig. 1d). However, the solution can be deduced from that for an FRP-to-concrete bonded joint with the FRP strip loaded at both ends (Teng et al. 2006; Chen et al. 2007). As shown in Fig. 6, it is apparent that the behaviour of a type B joint with a bond length equal to L is identical to that of an FRP-to-concrete bonded joint with a bond length equal to 2L and loaded at its two ends with the load ratio 2 1 3 4 1P P P Pβ = = = . Based on this observation, the full-range behaviour of a type B joint with a linearly softening bond-slip relationship can be deduced from the solution already given in Chen et al. (2007) as follows. The full-range behaviour of a type B joint can be characterized by key points O, B’, D’ and P’ when the bond length is small ( ) and key points O, A, B and P when the bond length is large ( ) as schematically shown in Fig. 7. Accordingly, the full range load-displacement
response can be divided into three segments, namely segments
uL a≤
uL a>'OB , ' 'B D , ' 'D P for and uL a≤
OA , AB and BP for . uL a> Similar to Figs 4 and 5, the interfacial shear stress distributions along the FRP-to-concrete interface experienced by a type B joint during the loading process are schematically shown in Fig. 8 for and in Fig. 9 for uL a> uL a≤ , corresponding to the different stages of the - P Δ curve (Fig. 7). The solutions for segments OA and AB for the case of and uL a> 'OB for the case of
(Fig. 7) of the load-displacement response are not affected by the boundary condition at the far end so they are the same as those for a type A joint and can be found in Eqs (1)-(11). For segments
uL a≤
' 'B D of a type B joint with a short bond length (L ≤ au), the solution is
( ) ( )max
tanP = + sin
ff f f
LL
E t bλ
δ λ λλ
⎡ ⎤Δ Δ −⎢
⎢⎣⎥⎥⎦ (12)
6

( )max = 1 cosf Lδ λ⎡Δ −⎣ ⎤⎦ (13) At the end of this stage (i.e. at point ), the displacement ∆ and the corresponding force P at the loaded end are
'D
fδΔ = (14)
( )fcos ( ) 1P = sin( )+tan( ) sin
f ff f f
bLE t b LL L
τλλδ λλ λ λ
⎡ ⎤=⎢ ⎥
⎣ ⎦ (15)
The solution for segment BP of a type B joint with a long bond length ( ) is the same as
that for segment uL a>
' 'D P for a short bond length ( uL a≤ ) and is given by
( )1P =
sin 'f fb
aτ
λ λ (16)
( )'
- ' =
sin( )f
f
L aa
δ λδ
λΔ + (17)
where is the length of the softening part of the FRP-to-concrete interface at this stage (Figs 8e and 9d). If the debonded length of the interface is represented by d ( 0 ), a can be related to the debonded length through
'a d L≤ ≤ '
dLa −=' (18) Note that approaches zero (i.e. approaches'a d L ) when the FRP-to-concrete interface approaches the state of complete debonding. Accordingly, the slope of the load-displacement curve is
( )( )' ' 20 0
'
1sin '
lim = lim = - '
sin( )
f f
f fP
a a f ff
bbaPK
L a La
ττλ λ
δ λ λ δδ
λ
−Δ−> −>
=Δ
+ (19)
Substituting Eq. (4) into Eq. (19) gives
f f fP
E b tK
L−Δ = (20)
which represents the slope of the asymptote of the load-displacement curve of a type B joint (Fig. 7). For an FRP-to-concrete bonded joint with the FRP strip equally loaded at both ends, there is no complete debonding based on the idealized model as demonstrated by Teng et al. (2006) and Chen et al. (2007) so the upper limit of the load should be controlled by the FRP rupture strength. In Fig. 7, this is schematically marked as for'P uL a≤ and for . P uL a> The maximum force an FRP U-strip can resist is controlled by the bond strength above the critical shear crack which is a type A joint (see Fig. 1). When the bond capacity of the FRP
strip above the critical shear crack, = f fbP
τλ
, is reached, the FRP slip at the crack due to
deformation below the shear crack (a type B joint) Δ is greater than δf and smaller than δf + δfλ(L − au) when (i.e. it lies between A and B in Fig. 7). For L < auL a≥ u,
( ) ( ) = 1 cos 1 sin tan( ) for f f uL L L Lδ λ δ λ λ⎡ ⎤ ⎡ ⎤Δ − + − <⎣ ⎦ ⎣ ⎦ a (21)
7

which is marked as in Fig. 7. 'C 3. Shear contribution of shear-strengthening FRP Similar to Chen and Teng (2003a, b), only shear tension failure is considered herein where the shear failure process of an RC beam shear-strengthened with FRP is assumed to be dominated by the development of a single critical shear crack at θ from the beam longitudinal axis (Fig. 10). In practice, additional shear cracks are likely, but the assumption of a single crack is generally conservative for predicting FRP debonding failure (Teng et al. 2006; Chen et al. 2007). Only the contribution of the FRP strips intersected by the critical shear crack is considered here (Fig. 10). As in Chen and Teng (2003a, b), the upper end (i.e. the crack tip) of the shear crack at failure is assumed to be located at 0.1d from the compression face of the beam (Fig. 10), with d being the effective depth of the beam. The vertical distance from the upper end of the shear-strengthening FRP strips to the crack tip is assumed to be . Although the lower end of a shear crack is likely to be located at the tension face of the beam, only the portion of the shear crack between the crack tip and the centre of the steel tension reinforcement is considered in this study. The portion of the crack between the centre of the steel tension reinforcement and the tension face is not considered for reasons given in Chen and Teng (2003a, b). The intersection between the steel tension reinforcement and the critical crack is thus termed the ‘crack end’ (Fig. 10) herein and the shear crack between this crack end and the crack tip is termed the ‘effective shear crack’ (Fig. 10) hereafter. The vertical distance from the tension face of the beam to the crack end is , and that from the crack tip to the crack end is
th
bh
,f eh ( when the bonded FRP strips cover the full height of the beam).
, 0.9f eh = d
Based on vertical equilibrium consideration, the shear contribution of shear-strengthening FRP is given by (Chen and Teng 2003a, b):
( ),,
cot cot sin2 f e
f f e f ff
hV f t w
sθ β β+
= (22)
where ,f ef is the effective (average) stress in the FRP strips intersected by the effective shear crack; fw is the width of an individual FRP strip perpendicular to the fiber direction (all FRP strips are assumed to have the same fw ); fs is the centre-to-centre spacing of FRP strips measured along the longitudinal axis (the FRP strips are assumed to be evenly distributed); ft is the thickness of the FRP strips; and β is the angle between the fiber direction and the beam longitudinal axis. It should be noted that for a continuous FRP sheet/plate (or FRP strips with zero net gaps), the following relationship exists between fw and fs :
sinf fw s β= (23) Eq. (22) indicates that to evaluate the shear contribution of shear-strengthening FRP strips, it is essential to obtain the effective stress in the FRP strips ,f ef . If the development of ,f ef with the widening of the shear crack is known, the development of the shear contribution of FRP strips ( fV ) with the opening-up of a shear crack can be obtained from Eq. (22).
8

The effect of shear crack shape on FRP shear contribution was explored in Chen et al. (2010b) and it was found that a linear crack width variation is the most critical among various crack shapes studied. Therefore, it is assumed that the shear crack width increases linearly from zero at the crack tip to we at the crack end (termed as “crack end width” hereafter) in this study:
( ),
ef e
zw z wh
= (24)
where ,f eh is the vertical depth of the effective shear crack; and z is the vertical downward-coordinate starting from the crack tip (Fig. 10). Following the definition of Chen et al. (2003a, b), the effective stress in FRP ,f ef can be expressed as
( ),
0,
,
f eh
f ef e
z dzf
h
σ=
∫ (25)
where ( )zσ is the stress in the FRP strips intersected by the critical shear crack at a coordinate . Assuming that discrete FRP strips can be treated as an equivalent FRP continuous
sheet/plate, Eq. (25) is applicable to beams strengthened with either FRP discrete strips or FRP continuous sheets/plates.
z
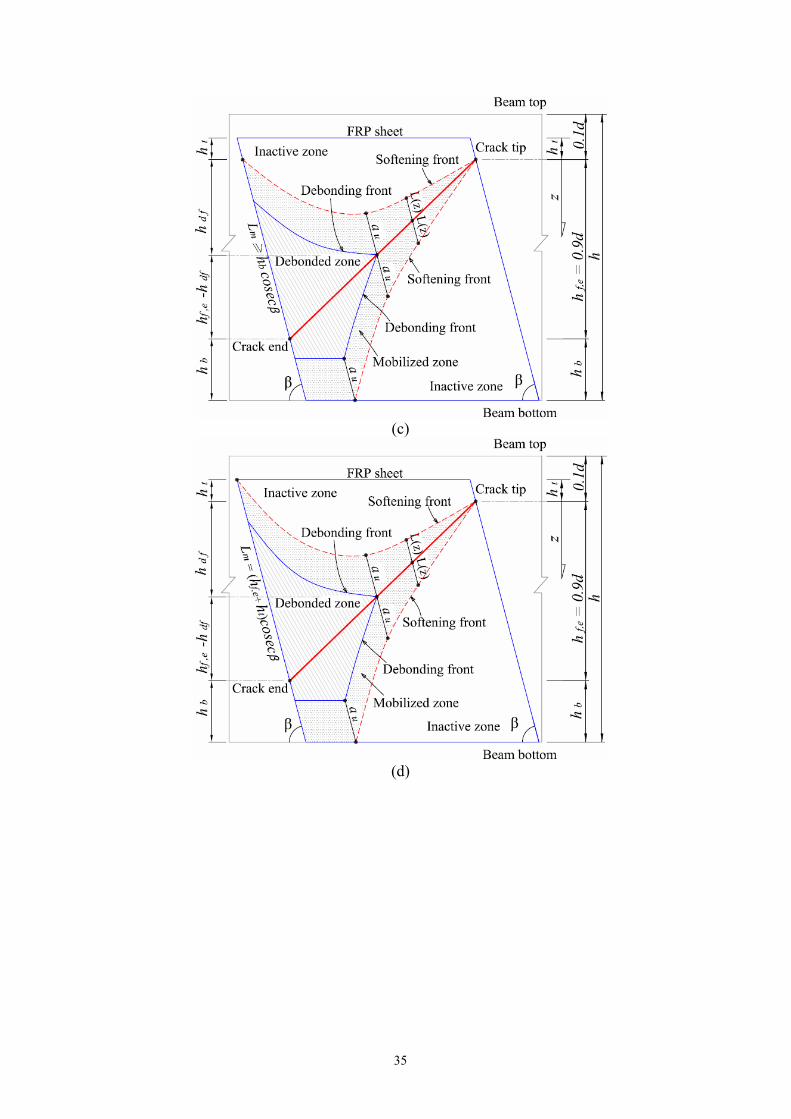
In the following two sections, the solutions for ,f ef for FRP side strips are given first, followed by those for FRP U-strips. For both strengthening schemes, two different solutions are given for the two cases of cosecbh β ≤ and ua cosecbh β > respectively as presented below. ua During the loading process, the FRP bonded area can be divided into the following three zones (schematically shown in Figs 11, 12, 13 and 14):
1. inactive zone, where the interface between FRP and concrete is not yet stressed; 2. mobilised zone, where the interface is in a softening state; and 3. debonded zone, where complete interfacial debonding has been achieved.
Zones 1 and 2 are separated by the softening front where mτ τ= and 0δ = (also see Figs 4, 5, 8 and 9). Zones 2 and 3 are separated by the debonding front where τ = 0 and δ = δf (also see Figs 4, 5, 8 and 9). 4. Development of FRP shear contribution with crack width: FRP side strips The solutions are different depending on the thickness of concrete cover relative to the effective bond length of the FRP (see Figs 11 and 12).
bh
ua 4.1. Thin concrete cover with cosecb uh aβ ≤ When cosecbh uaβ ≤ , the debonding process of FRP side strips can be divided into three stages:
a) softening stage at which no debonding has taken place. This stage is characterised by 0 cosm bL h ecβ≤ < (Fig. 11a). Here is the maximum mobilized bond length in the fibre direction from the critical shear crack to the softening front (Fig. 11);
mL
b) one-way debonding stage at which complete debonding occurs only below the critical shear crack. This stage is characterised by , cosecf e mh L uaβ ≤ < (Fig. 11b); and
9

c) two-way debonding stage at which debonding occurs both below (completely) and above (partially) the critical shear crack. This stage is characterised by (Fig. 11c).
mL a≥ u
For each of the above three stages, the effective FRP stress ,f ef and the corresponding crack end width can be deduced as follows. ew (1) Softening stage with 0 cosecm bL h β≤ < (Fig. 11a) During this stage, all the FRP strips are still bonded to the beam sides. The maximum mobilized length is located at the crack end for this stage. The slip and the mobilized bond length for a given FRP strip are the same on the two sides of the critical shear crack during this stage. Based on this consideration together with Eq. (2), the slips of the FRP strips in the fibre direction at the critical shear crack,
mL
( )L z
( )zβ
Δ , can be obtained as
( ) ( )f = 1-cos L( )z zβ
δ λ⎡Δ ⎣ ⎤⎦ (26)
where is the vertical coordinate starting from the crack tip (Fig. 11), and is the length of the mobilized zone in the fiber direction on one side of the critical shear crack (Fig. 11).
z ( )L z
Due to compatibility, the slip of an FRP strip at either side of the crack must be equal to half the crack width in the fibre direction:
( ) ( ) ( = sin2
w zz
β )θ βΔ + (27)
Substituting Eqs (26) and (27) into Eq. (24) gives the following relationship between ( )L z and : mL
( ) ( )m,
z1-cos L( ) 1-cos f e
zh
λ⎡ ⎤ ⎡=⎣ ⎦ ⎣ Lλ ⎤⎦
u
(28)
Since , according to Eq. (1), the stress in FRP at can be expressed as 0 mL a≤ < z
( ) ( ) ( ) ( )2
sin sinf f f
f f f f
G EP zz L z
b t t tτ
σ λλ
L zλ⎡ ⎤ ⎡= = = ⎤⎣ ⎦ ⎣ ⎦ (29)
Substituting Eq. (29) into Eq. (25) and applying Eq. (28) give
( ),
,,0
2sin
2 =
f e
f fh
f f ff e f
f e f
G EL z dz
t G Erpf D
h t
λ⎡ ⎤⎣ ⎦=∫ (30)
m m
m
sin( ) cos( ) 2 2cos( )frp
L L LDL
mλ λ λλ
−=
− (31)
where frpD is the stress distribution factor as defined in Chen and Teng (2003b). The corresponding shear crack width at the crack end can be expressed as
10

( )m1 cos = 2
sin( )e f
Lw
λδ
θ β−
+ (32)
(2) One-way debonding stage with cosec b mh L uaβ ≤ < (Fig. 11b) During this stage, some of the FRP strips near the crack end have debonded completely below the critical shear crack (Fig. 11b). Let the rightmost debonded fibre intersect the critical shear crack at a height above the steel tension reinforcement sodbh ( )cosecm db bL h h β= + (Fig. 11b). Following the same procedure as in deriving Eqs (28) and (30), the relationship between ( )L z and , and the effective stress in FRP strips are obtained as mL
( ) ( )m,
z1-cos L( ) 1-cos f e db
zh h
λ⎡ ⎤ ⎡=⎣ ⎦ ⎣−Lλ ⎤⎦ (33)
,
2 = f f
f ef
G Efrpf D
t (34)
where
[ ]m m m
m ,
sin( ) cos( ) 12 1 cos( )
dbfrp
f e
hL L LDL h
λ λ λλ
⎛ ⎞−= ⎜⎜− ⎝ ⎠
⋅ − ⎟⎟ (35)
The corresponding crack end width can be expressed as
( ) ,m
,
1 cos = 2
sin( )f e
e ff e db
hLw
h hλ
δθ β
−⋅
+ − (36)
(3) Two-way debonding stage with (Fig. 11c) m uL a≥ During this stage, the height of the debonded FRP area continues to increase as increases following the relationship of
dbh mL( )cosecm db bL h h β= + and Eq. (26) can be rewritten as
( ) ( ) [e
, ,
z = sin + = 1 (2 f m
f e f e db
w zz Lh h hβ
θ β δ λΔ−
])ua+ − (37)
The point of intersection between the debonding front and the critical shear crack, where
, dfz h= ( ) uL z a= , and thus ( ) fzβ
δΔ = , ( ) 2 cos ( )fw z ecδ θ β= + [see Fig. 11(c)], can be
obtained from the following condition:
( ) = df
fz h
zβ
δ=
Δ (38)
Substituting Eq. (38) into Eq. (37) gives
( ),
m1f e db
dfu
h hh
L aλ−
=+ −
(39)
The stress in the FRP strips is constant with ( )2 f f
f
G Ez
tσ = within the debonded zone with
(Fig. 11c). The effective (average) stress in the FRP strips intersected by the ,df f e dbh z h h≤ ≤ −
11

critical shear crack can be found as
( ),
,, ,0
2 2sin
2 = + =
df f e db
df
f f f fh h h
f f f ff e frp
f e f e fh
G E G EL z dz dz
t t G Ef D
h h
λ −⎡ ⎤⎣ ⎦
∫ ∫ t (40)
In which
, ,
14
df db dffrp
f e f e
h hD
h hπ ⎛ ⎞+
= ⋅ + −⎜⎜⎝ ⎠
h⎟⎟ (41)
The corresponding crack end width can be expressed as
( ) ,m
,
1 = 2
sin( )f eu
e ff e db
hL aw
h hλ
δθ β
+ −⋅
+ − (42)
4.2. Thick concrete cover with cosecb uh aβ > For the case of cosecbh uaβ > , the debonding process of FRP side strips can also be divided into three stages, including the softening stage ( 0 mL au≤ < ), the two-way partial debonding stage ( cosecu m ba L h β≤ < ) and the two-way debonding stage (with one side being partial debonded and the other side being completely debonded) ( cosecm bL h β≥ ), as shown in Figs 12a, 12b and 12c respectively. The last stage features a debonded FRP height of measured from the crack end (Fig. 12c). Eqs (26)-(42) can be used for these three stages either directly or with slight modifications as follows.
dbh
(1) Softening stage with (Fig. 12a) 0 mL a≤ < u
For this stage, Eqs (30)-(32) apply directly. (2) Two-way partial debonding stage with cosecu m ba L h β≤ < (Fig. 12b) For this stage, the solution is given by Eqs (39)-(42) with slight modifications. Since the FRP strips have not completely debonded yet, the crack end width can be expressed as [based on Eq. (11)]
1 ( )=2sin( )
m ue f
L aw λδθ β
+ −+
(43)
From Eqs (24) and (27), the slip in the fibre direction on each side of the crack is
( ) ( ) [, ,
z= sin + = 1 (2
ef m
f e f e
w z ])uz L ah hβ
θ β δ λΔ + − (44)
Substituting Eq. (44) into Eq. (38) gives
( ),
m1f e
dfu
hh
L aλ=
+ − (45)
The effective stress in the FRP is
12

( ),
,, ,0
2 2sin
2 = + =
df f e
df
f f f fh h
f f f ff e frp
f e f e fh
G E G EL z dz dz
t t G Ef D
h h
λ⎡ ⎤⎣ ⎦
∫ ∫ t (46)
where
, ,
14
df dffrp
f e f
h hD
h hπ ⎛ ⎞
= ⋅ + −⎜⎜⎝ ⎠e
⎟⎟ (47)
(3) Two-way debonding stage with cosecm bL h β≥ (Fig. 12c) The debonded FRP height is and dbh ( )cosecm db bL h h β= + for this stage. The solution is the same as Eqs (39)-(42).
5. Development of FRP shear contribution with crack width: FRP U-strips As discussed earlier, the behaviour of an FRP U-strip in a shear-strengthened RC beam can be represented by a type A joint representing the interface above the effective shear crack, connected to a type B joint representing the interface below the effective shear crack (Fig. 1). Because the load-displacement relationship of a type A joint (Fig. 3) is very different from that of a type B joint (Fig. 7), the debonding process of FRP U-strips is more complicated than that of FRP side strips. Normally, the slips between FRP and concrete at the two sides of the critical shear crack are different for an FRP U-strip (see the Appendix for more details). To simplify the analysis without compromising the accuracy of the solution, a number of additional assumptions are introduced during the derivation process as detailed below. Similar to FRP side strips, the solutions are different depending on the concrete cover thickness relative to the effective bond length. 5.1. Thin concrete cover with cosecb uh aβ ≤ For a thin concrete cover with cosecbh uaβ ≤ , the debonding process of FRP U-strips can be divided into three stages which include a softening stage ( 0 mL au≤ < ) (Figs 13a and 13b), a partial debonding stage [ ,( )coseu m f e ta L h h cβ≤ ≤ + ] (Figs 13c and 13d), a descending stage ( 0 ) (Fig. 13e) as explained next. dbh ≥ (1) Softening stage with (Figs 13a and 13b) 0 mL a≤ < u
During the softening stage (Figs 13a and 13b), the crack end width is very small and the stress in FRP increases with . The length of the mobilized zone
ew
ew ( )L z is also very small. This stage ends when the maximum mobilized length ( ), which is located at the crack end, reaches a
mLu. If the concrete cover thickness is small relative to the effective bond length so that
cosecb mh L uaβ ≤ < is satisfied (Fig. 13b), the lengths of the softening zones of the FRP-to-concrete interface, and thus the slips of the interface, on the two sides of the critical shear crack are not the same. However, this asymmetry is assumed to be insignificant and thus neglected in this initial stage of loading in this study, i.e., the slips below the critical shear crack are
13

assumed to be the same as those above it and the latter are used in the analysis. This assumption greatly simplifies the solution for the case of cosecb mh L uaβ ≤ < , but results in very small errors in the prediction of the effective FRP stress ,f ef according to a more accurate analysis presented in Chen (2010) mainly because the affected area is very small compared with the total bonded area of FRP. The errors due to this simplification are further explored later in this paper by comparing the current closed-from solution with FE predictions where this assumption is not used. Based on the above simplification, Eqs (30)-(32) can be used directly for this stage. (2) Partial debonding stage with ,( )coseu m f e ta L h h cβ≤ ≤ + (Figs 13c and 13d) The partial debonding stage (Figs 13c and 13d) starts when the leftmost fibre intersected by the critical shear crack starts to debond so that the softening length mL au= there, corresponding to . This stage ends when the leftmost fibre debonds completely from the beam sides
[i.e.,df f eh h=
( ), cosecm f e tL h h β= + ] (Fig. 13d). The maximum FRP contribution to shear capacity is usually reached at this time (Chen et al. 2010a), with ,df df uh h= and ,e ew w u= . When the leftmost fibre debonds completely, i.e. ,( )cosem f e tL h h cβ= + , the crack end width is equal to the slip of the FRP strip below the shear crack plus that above it. These two parts can be determined from Eqs (11) and (21) respectively, giving
( ) [ ] [ ]f f , f f,
cosec + 1-cos( cosec ) + 1-sin( cosec ) tan( cosec )=
sin( )f e t u b b b
e u
h h a h h hw
δ δ λ β δ λ β δ λ β λ β
θ β
⎡ ⎤+ + −⎣ ⎦+
(48)
Noting that ( )
,f=
df uz hz
βδ
=Δ at where the FRP-to-concrete interface just reaches the
full bond strength (and where the debonding front intersects the critical shear crack), the crack width at this position can be found as
,df uz h=
( ),
f2= sin( )df uz h
w z δθ β= +
(49)
From Eq. (24), the crack width at can also be expressed as ,df uz h=
( ),
,,
,
= df u
df ue uz h
f e
hw z w
h= (50)
Substituting Eq. (50) into Eq. (49) gives
,,
,
2sin( )
f e fdf u
e u
hh
wδθ β
=+
(51)
The effective FRP stress ,f ef in this stage can be obtained as:
( ),
,, ,0
2 2sin
2 = + =
df f e
df
f f f fh h
f f f ff e frp
f e f e fh
G E G EL z dz dz
t t G Ef D
h h
λ⎡ ⎤⎣ ⎦
∫ ∫ t (52)
14

where
, ,
14
df dffrp
f e f
h hD
h hπ ⎛ ⎞
= ⋅ + −⎜⎜⎝ ⎠e
⎟⎟ (53)
From Eqs (24) and (38), the corresponding crack end width during this stage can be expressed as:
( ), f2
= sin
f ee
df
hw
hδ
θ β+ (54)
(3) Descending stage with (or ) (Fig. 13e) 0dbh ≥ ,e ew w≥ u
u
The descending stage starts when the leftmost fibre intersected by the critical shear crack has debonded completely from the beam side with ,e ew w= and ,df df uh h= . This stage is characterized by an FRP debonded height (Fig. 13e) and usually corresponds to the descending branch of the
dbh
f eV w− response (Chen et al. 2010a). The effective FRP stress ,f ef can be obtained with reference to the “two-way debonding stage” of FRP side-strips [see Fig. 11c and Eqs (37)-(42)], as explained below. During this stage, all the FRP strips left to the position with ,f e dz h h= − b
,
(i.e.
,f e db fh h z h− ≤ ≤ e ) have completely debonded above the critical crack (Fig. 13e). Following the same procedure of deriving Eq. (48), the shear crack width at ,f e dz h h b= − can be found as
( )
( ) ( )
( ) ( ) ( )
( ) ( )
,
f f . f
uf
f f , u
+ cosec - + 1-cos cosec
if cosec a + 1-sin cosec tan cosec
2 + cosec 2 if cosec a
f e db
t f e db u b db
b dbb db b dbdb db z h h
f e b t u b db
h h h a h h
h bh h h hw w z
h h h a h b
δ δ λ β δ λ β
βδ λ β λ β
δ δ λ β β
= −
⎧ ⎡ ⎤ ⎡ ⎤⎡ ⎤+ − +⎣ ⎦⎣ ⎦⎣ ⎦+ ≤⎡ ⎤⎡ ⎤ ⎡ ⎤+ +⎣ ⎦ ⎣ ⎦⎣ ⎦= = ⎨
⎡ ⎤+ + − +⎣ ⎦
⎪⎪⎪
⎪⎪⎪⎩ >
(55) From Eq. (24), the crack end width is
,
,
= f ee
f e db
hw
h h− dbw (56)
Following the same procedure of deriving Eq. (51), the location where the FRP-to-concrete interface just reaches the full bond strength [and where the debonding front intersects the critical shear crack, with ( ) 2 cosec( )fw z δ θ β= + , ( ) fz
βδΔ = ] can be found as
,2sin( )
f e fdf
e
hh
wδ
θ β=
+ (57)
The effective FRP stress ,f ef can be obtained as
( ),
,, ,0
2 2sin
2 = + =
df f e db
df
f f f fh h h
f f f ff e frp
f e f e fh
G E G EL z dz dz
t t G Ef D
h h
λ −⎡ ⎤⎣ ⎦
∫ ∫ t (58)
15

where
, ,
14
df db dffrp
f e f e
h hD
h hπ ⎛ ⎞+
= ⋅ + −⎜⎜⎝ ⎠
h⎟⎟ (59)
5.2. Thick concrete cover with cosecb uh aβ > When the concrete cover is thick relative to the effective bond length so cosecb uh aβ > , the debonding process of FRP U-strips can be divided into four stages which include a softening stage ( ) (Fig. 14a), stage 1 of two-way partial debonding with 0 mL a≤ < u cosecu m ba L h β≤ < (Fig. 14b), stage 2 of two-way partial debonding with ,cosec ( )cosecb m f e th L h hβ β≤ ≤ + (Figs 14c and 14d) and a descending stage ( ) (Fig. 14e). Equations (30)-(32), (43)-(47), (48)-(54) and (55)-(59) can be used for these four stages directly or with slight modifications as detailed below.
0dbh ≥
(1) Softening stage with (Fig. 14a) 0 mL a≤ < u
u
The solution for this stage is exactly the same as that for the corresponding stage of FRP side strips in the case of a thick concrete cover with 0 mL a≤ < (Fig. 12a) and consequently, Eqs (30)-(32) apply directly. (2) Stage 1 of two-way partial debonding with cosu m ba L h ecβ≤ < (Fig. 14b) During this partial debonding stage, the fixed end condition of U-strips does not affect the solution, i.e., the lower softening front is above the fixed lower boundary. This stage is the same as the corresponding stage for FRP-side strips, so the solution for this stage is exactly the same as that for the two-way partial debonding stage with , cosecu m f ea L h β≤ < for FRP side strips (Fig. 12b) and consequently, Eqs (43)-(47) apply directly. The stage ends when the softening front below the critical shear crack reaches the beam bottom (i.e. cosecm bL h β= ) where FRP is assumed be fixed (Fig. 14b). (3) Stage 2 of two-way partial debonding with ,cosec ( )cosecb m f e th L h hβ β≤ ≤ + (Figs 14c
and 14d) During this second partial debonding stage, the softening front intersects with the fixed bottom boundary. The position where the debonding front intersects the critical shear crack ( ) at the start of this stage can be determined from the condition that the softening front just reaches the fixed bottom boundary by substituting
dfz h=
cosm bL h ecβ= into Eq. (45):
( ),
1 cosf e
dfb u
hh
h ec aλ β=
+ − (60)
The crack end width at end of this stage [ew ,( )cosem f e tL h h cβ= + ] is obtained from Eqs (11) and (21) following the same principle as in deriving Eq. (48) as:
( ), f f ,= 2 + cos 2e u f e t b uw h h h ecδ δ λ β⎡ + + −⎣ a ⎤⎦ (61)
16

The solution for this stage is exactly the same as that for the partial debonding stage of FRP U-strips ( ,( )coseu m f e ta L h h cβ≤ ≤ + ) for the case of a thin concrete cover as presented earlier. Consequently, Eqs (49)-(54) apply directly here but the expression of (at which this stages ends) should be determined from Eq. (61) instead of Eq. (48).
,e uw
(4) Descending stage with (or ) (Fig. 14e) 0dbh ≥ ,e ew w≥ u
u ua
The solution for this stage is exactly the same as that for the descending stage of FRP U-strips ( ) in the case of a thin concrete cover (,e ew w≥ cosecbh β ≤ ). Accordingly, Eqs (55)-(59) apply directly here.
6. Verification of the closed-form solution To validate the closed-form solution presented above, its predictions are compared with FE predictions in this section. The same FE model as presented in Chen et al. (2010b) was adopted where the continuous FRP sheet is represented by 20 discrete FRP strips. The following parameters were used in both the analytical and FE analyses unless otherwise stated: concrete cylinder compressive strength fc
’ = 30 MPa [with an equivalent cube strength of 37 MPa according to CEB-FIP (1993)]; elastic modulus of FRP Ef = 2.3×10⁵ MPa; and tensile strength of FRP ff = 3900 MPa. In the analytical solution, the maximum interfacial shear stress fτ and interfacial facture energy fG were calculated according to Lu et al.’s (2005) bond-slip model. The maximum interfacial slip fδ was calculated from 2f f fGδ τ= (see Fig. 2). In the FE analyses, both the linearly softening bond-slip model (Fig. 2) and the accurate nonlinear bond-slip model of Lu et al. (2005) were used. The results of the linearly softening bond-slip model (FEM1) are used to verify the accuracy of the analytical solution, and those of the nonlinear bond-slip model (FEM2) are used mainly to demonstrate the effect of approximation introduced by the linearly softening bond-slip model. The shear crack end was assumed to be at 50 mm from the beam soffit (i.e. 50 mmbh = ) which is in the practical range as explained in Chen et al. (2010a, b) (Figs 10-14). It was further assumed that the beam sides are fully covered with FRP (and thus , 9t f eh h= , see Figs 10-14) with all fibres oriented vertically (β = 90°) and the angle of the shear crack is θ = 45°.
Analyses were conducted for a series of cases in which the beam height varies in the range of mm and the FRP thickness varies in the range of t,f e 300 600h = − 0.11- 0.88f = mm. Close
agreement was observed between the closed-form solution and the FE predictions for all the cases examined. Figs 15a-15c show the comparisons for three typical cases: (a) ,f eh = 600 mm,
ft = 0.11 mm; (b) ,f eh = 300 mm, ft = 0.11mm; and (c) ,f eh = 300 mm, ft = 0.88 mm. It can be seen that the ascending branch of the -f eV w curve predicted by the closed-form solution is nearly identical to the FE prediction for all three cases regardless of the FRP configuration (i.e. FRP side strips and U-strips), beam height and FRP thickness. After the peak, the FE analysis predicts stepwise drops, with each drop representing the complete debonding of an individual FRP strip [see Chen et al. (2010a) for a more detailed explanation]. The closed-form solution, being the solution for an equivalent continuous FRP sheet, generally passes through the mid-
17

point of each stepwise drop on the FE curve. It is only in the last stage that the closed-form solution deviates significantly from the FE prediction (point F in Fig. 15). This is because, after about one half of the FRP strips have debonded, the remaining FRP strips debond in a much more abrupt manner mainly as the critical bond length (for the bonded area above the shear crack) now varies in a manner similar to that of the crack width. As a result, the assumption adopted in the closed-form solution that debonding proceeds sequentially from the crack end to the crack tip is not consistent with the FE prediction for this final stage of debonding failure. A more detailed discussion about this phenomenon can be found in Chen et al. (2010a). This discrepancy should affect neither the applicability nor the accuracy of the closed-form solution in any significant way as it occurs only in the very last stage of FRP debonding failure as can be seen from Fig. 15.
The location of point F where the closed-form solution fails to capture the abrupt debonding of several FRP strips may be estimated from the condition where FRP debonding along the critical shear crack from the left to the right reaches a point (featured by a debonded FRP height hdb,f ) where the bond length above the critical shear crack equals to that below it (see Figs 10-14), i.e.
, ,db f b f e t db fh h h h h+ = + − , (62)
Rearranging Eq. (62) gives
,, 2
f e t bdb f
h h hh
+ −= (63)
Substituting ( )m , cosecdb f bL h h β= + (the maximum mobilized bond length in the fibre
direction) into Eq. (42) gives the crack end width at point F [the same expression can be obtained from Eqs (55)-(56)]:
ew
( )( ),,
,,
2 cos2sin( )
2f f f e b t uf ee f
f e b t
h h h ec ahw
h h h
δ δ λ β
θ β
⎡ ⎤+ + + −⎣ ⎦= ⋅++ −
(64)
It should be noted that when the FRP membrane stiffness is very large (e.g. when Eftf > 2×10⁵ N/mm), the closed-form solution may deviate slightly from the mid-heights of the FE predicted stepwise drops before point F (Fig. 15c). Further analyses showed that this is because some FRP strips close to the crack tip may debond before is reached, but this is not duly considered in the analytical solution for simplicity as the effect of FRP debonding near the crack tip is insignificant when
,db fh
,f e uh a is in its practical range (see Appendix for details). Figure 15 also shows that the closed-form solution slightly overestimates fV when compared with the second FE model (FEM2) based on Lu et al.’s (2005) accurate nonlinear bond-slip model, but this overestimation is very limited. For example, the differences are 4.68 % and 4.69 % for FRP side strips and FRP U-strips respectively when ft = 0.88 mm and ,f eh = 300 mm. All methods predict very similar slops of the descending branch of the -f eV w curve, but
at point F as determined from Eq. (64) is generally larger than that predicted by FEM 2 at which
ew
fV experiences an abrupt drop. For example, when ft = 0.11mm and ,f eh = 300 mm, ew
18
determined from Eq. (64) is 2.85 mm which is about 14% larger than that predicted by FEM2 (about 2.5 mm).
7. Concluding remarks This paper has presented a closed-form analytical solution for the entire debonding process of FRP U-strips or side strips used to enhance the shear resistance of RC beams, allowing the different stages of debonding to be clearly explained and understood. The solution is based on a closed-form analytical solution for the full-range behavior of FRP-to-concrete bonded joints based on a linearly softening bond-slip model and the assumption of a linear shear crack shape. A particularly important outcome of the solution is the closed-form expressions that describe the development of shear contribution of externally bonded FRP shear reinforcement to the shear resistance of an RC beam as the critical shear crack widens. The closed-form solution has been validated by comparing its predictions with finite element predictions. A major benefit among many others of the closed-form solution is that it can be used directly to evaluate the effect of shear interaction between external FRP strips and internal steel stirrups on the shear strength of RC beams shear-strengthened with FRP. Such exploitation of the present analytical solution will be discussed in a forthcoming paper (Chen et al. 2011) for the development of an advanced shear strength model for RC beams shear-strengthened with FRP. The present closed-formed solution also provides valuable insight into the debonding failure process of RC beams shear-strengthened with FRP.
References Bousselham, A., Chaallal, O., 2004. Shear strengthening reinforced concrete beams with fiber-
reinforced polymer: Assessment of influencing parameters and required research. ACI Structural Journal, 101(2), 219-227.
Bousselham, A., Chaallal, O., 2006a. Behavior of RC T beams strengthened in shear with CFRP: An experimental study. ACI Structural Journal, 103(3), 339-347.
Bousselham, A., Chaallal, O., 2006b. Effect of transverse steel and shear span on the performance of RC beams strengthened in shear with CFRP. Composites Part B: Engineering, 37(1), 37–46.
Bousselham, A., Chaallal, O., 2008. Mechanisms of shear resistance of concrete beams strengthened in shear with externally bonded FRP. Journal of Composites for Construction, ASCE, 12(5), 499-512.
Carolin, A., Taljsten, B., 2005. Experimental study of strengthening for increased shear bearing capacity. Journal of Composites for Construction, ASCE, 9(6), 488–496.
CEB-FIP 1993. CEB-FIP Model Code 1990. Thomas Telford, London, UK. Chen, G.M., Teng, J.G., Chen, J.F., Rosenboom, O.A., 2010a. Interaction between steel
stirrups and shear-strengthening FRP strips in RC Beams. Journal of Composites for Construction, ASCE, 14(5), 498-509.
Chen, G.M., Teng, J.G. ,Chen, J.F., 2010b. RC beams shear-strengthened with FRP: shear resistance contributed by FRP. Magazine of Concrete Research, 62(4), 301-311.
Chen, G.M., 2010. Shear Behaviour and Strength of RC Beams Shear-Strengthened with Externally Bonded FRP Reinforcement. PhD Thesis, The Hong Kong Polytechnic University, China.
19

Chen, G.M., Teng, J.G. ,Chen, J.F., 2011. Shear strength model for FRP-strengthened RC beams accounting for FRP-steel interaction. (in preparation)
Chen, J.F., Teng, J.G., 2003a. Shear capacity of FRP strengthened RC beams: Fibre reinforced polymer rupture. Journal of Structural Engineering, ASCE, 129(5), 615-625.
Chen, J.F., Teng, J.G., 2003b. Shear capacity of FRP-strengthened RC beams: FRP debonding. Construction and Building Materials, 17(1), 27-41.
Chen, J.F., Yuan, H., Teng, J.G., 2007. Debonding failure along a softening FRP-to-concrete interface between two adjacent cracks in concrete members. Engineering Structures, 29(2), 259-270.
Islam, M.R., Mansur, M.A., Maalej, M. 2005. Shear strengthening of RC deep beams using externally bonded FRP systems. Cement & Concrete Composites, 27(3), 413-420.
Khalifa, A., Nanni, A., 2000. Improving shear capacity of existing RC T-section beams using CFRP composites. Cement & Concrete Composites, 22(3), 165–174.
Khalifa, A., Nanni, A., 2002. Rehabilitation of rectangular simply supported RC beams with shear deficiencies using CFRP composites. Construction and Building Materials, 16(3), 135–146.
Leung, C.K.Y., Chen, Z., Lee, S., Ng, M., Xu, M., Tang, J., 2007. Effect of size on the failure of geometrically similar concrete beams strengthened in shear with FRP strips. Journal of Composites for Construction, ASCE, 11(5), 487–496.
Li, A., Diagana, C., Delmas, Y., 2002. Shear strengthening effect by bonded composite fabrics on RC beams. Composites Part B: Engineering, 33(3), 225–239.
Lu, X.Z., Teng, J.G., Ye, L.P., Jiang, J.J., 2005. Bond-slip models for FRP sheets/plates bonded to concrete. Engineering Structures, 27(6), 381-389.
Loitta, M.A., 2006. FRP Shear Strengthening in Shear Tests and Design Equations. PhD Thesis, University of Rome ‘‘La Sapienza’’, Italy.
Mohamed Ali, M.S., Oehlers, D.J., Seracino, R., 2006. Vertical shear interaction model between external FRP transverse plates and internal steel stirrups. Engineering Structures, 28(3), 381-389.
Monti, G., Loitta, M.A., 2007. Tests and design equations for FRP-strengthening in shear. Construction and Building Materials, 21(4), 799–809.
Monti, G., Santinelli, F., Liotta, M.A., 2004. Mechanics of FRP shear strengthening of RC beams. Proceedings, 11th European Conference on Composite Materials (ECCM 11), Rhodes, Greece, May.
Pellegrino, C., Modena, C., 2002. Fiber reinforced polymer shear strengthening of RC beams with transverse steel reinforcement. Journal of Composite for Construction, ASCE, 6(2), 104–111.
Pellegrino, C., Modena, C., 2006. Fiber-reinforced polymer shear strengthening of reinforced concrete beams: Experimental study and analytical modeling. ACI Structural Journal, 103(5), 720–728.
Taljsten, B., 2003. Strengthening concrete beams for shear with CFRP sheets. Construction and Building Materials, 17(1), 15–26.
Teng, J.G., Chen, J.F., 2009, Mechanics of debonding in FRP-plated RC beams. Proceedings of the Institution of Civil Engineers – Structures and Buildings, 162(5), 335-345.
Teng, J.G., Chen, J.F., Smith, S.T., Lam, L., 2002. FRP-Strengthened RC Structures. John Wiley and Sons, UK.
Teng, J.G., Chen, G.M., Chen, J.F., Rosenboom, O.A., Lam, L., 2009. Behavior of RC beams shear strengthened with bonded or unbonded FRP wraps. Journal of Composites for Construction, ASCE, 13(5), 394-404.
Teng, J.G., Lam, L., Chen, J.F., 2004. Shear strengthening of RC beams using FRP composites, Progress in Structural Engineering and Materials, 6(3), 173-184.
Teng, J.G., Yuan, H., Chen, J.F., 2006. FRP-to-concrete interfaces between two adjacent cracks:
20

Theoretical model for debonding failure. International Journal of Solids and Structures, 43(18-19), 5750-5778.
Triantafillou, T.C., 1998. Shear strengthening of reinforced concrete beams using epoxy-bonded FRP composites. ACI Structural Journal, 95(2), 107–115.
Yuan, H., Teng, J.G., Seracino, R., Wu, Z.S., Yao, J., 2004. Full-range behavior of FRP-to-concrete bonded joints. Engineering Structures, 26(5), 553-565.
21

Support
Crack tip
Crack end
θ
FRP strip
Shear crack h
(a)
FRP U-strip
h
Concrete
AdhesiveFRP side strip
h
Concrete l /
Adhesive
Location of shear crack
Concrete
Concrete l /
Type A joint
Type A joint
Type A joint
Type B joint
(b)
FRP strip
FRP strip
tc
bc bf
tf
Concrete prism
Adhesive
L
P
P
Concrete prism
Free far end
Free far end Elavation
Plan
FRP strip
FRP strip
tc
bc bf
tf
Concrete prism
Adhesive
L
P
P
Concrete prism
Fixed far end
Fixed far end Elavation
Plan (c) (d)
Fig. 1. RC beam shear-strengthened with FRP strips: (a) elevation; (b) cross-section; (c) type A joint; (d) type B joint.
22

τf
τ
δf δ - δ f
-τf
Gf
Gf
Fig. 2. Linearly softening bond-slip model.
Displacement at the loaded end ∆
Loa
d P
A B
CO
A' & B'
L< a u
L > a u
fδ
Fig. 3. Full-range behavior of FRP-to-concrete bonded joint with a free far end (type A joint).
23
(a)
(b)
(c)
(d)
(e)
Fig. 4. Interfacial shear stress distributions at various stages for a type A joint with : (a) development of softening zone (OA in Fig. 3); (b) initiation of debonding at loaded end (
uL a>
fδΔ = , point A in Fig. 3); (c) propagation of debonding (AB in Fig. 3); (d) softening front at the free end (point B in Fig. 3); (e) linear unloading (BC in Fig. 3).
24

(a)
(b)
(c)
Fig. 5. Interfacial shear stress distributions at various stages for a type A joint with : (a) development of softening zone (OA’ in Fig. 3); (b) softening front at the free end (point B’ in Fig. 3); (c) linear unloading (B’C in Fig. 3).
uL a≤
25

P1 P2 Line of symmetry
P
FRP strip
FRP strip
Concrete prism
Fixed end tf
tc
Concrete prism LL
β= P2/P1= P3/P4=1
P
tf
P3 P4
Adhesive
Adhesive tc
Fig. 6. Relationship between a type B joint and an FRP-to-concrete bonded joint loaded at both ends (Teng et al. 2006; Chen et al. 2007).
Displacement at the loaded end ∆
Loa
d P
B'
D'
O
B
PP'
A
Failure load controled by FRP rupture
K P -∆
C'
K P -∆
L<a u L>a u
( )f f uL aδ δ λ+ −fδ
Fig. 7. Full-range behavior of an FRP-to-concrete bonded joint with a fixed far end (type B joint).
26

(a)
(b)
(c)
(d)
(e)
Fig. 8. Interfacial shear stress distribution at various stages for a type B joint with : (a) development of softening zone; (b) initiation of debonding at the loaded end (point A in Fig. 7); (c) propagation of debonding (AB in Fig. 7); (d) softening front at the fixed end (point B in Fig. 7); (e) final propagation of debonding ( BP in Fig. 7).
uL a>
27

(a)
(b)
(c)
(d)
Fig. 9. Interfacial shear stress distributions at various stages for a type B joint with : (a) development of softening zone (OB’ in Fig. 7); (b) softening front at the fixed end (point B’ in Fig. 7); (c) initiation of debonding at the loaded end (point D’ in Fig. 7); (d) final propagation of debonding ( D’P’ in Fig. 7).
uL a≤
28

Fig. 10. Notation for a general shear strengthening scheme.
29

(a)
(b)
(c)
Fig. 11. Debonding process of an FRP side strips for a thin concrete cover ( cosb uh ec aβ ≤ ): (a) 0 cosm bL h ecβ≤ < ; (b) cosb m uh ec L a< m uL a≥; (c) . β ≤
30

(a)
(b)
(c)
Fig. 12. Debonding process of an FRP side strips for a thick concrete cover ( cosb uh ec aβ > ): (a) 0 ; (b)mL a≤ < u cosu m ba L h ecβ≤ < ; (c) cosm bL h ecβ≥ .
31

(a)
(b)
(c)
32

(d)
(e)
Fig. 13. Debonding process of an FRP U-strips for a thin concrete cover ( cosb uh ec aβ ≤ ): (a) 0 cosecm bL h β≤ < ; (b) cosecb m u ( )h L a< ; (c)β ≤ , cosecu m f e ta L h h β≤ < + ;
(d) , ,( )cosec (i.e. )m f e t e e uL h h w wβ= + = ; (e) . 0dbh ≥
33

(a)
(b)
34
(c)
(d)
35

(e)
Fig. 14. Debonding process of an FRP U-strips for a thick concrete cover ( cosb uh ec aβ > ):
(a) ; (b)0 mL a≤ < u cosecu m ba L h β≤ < ; (c) ( ),cosec cosecb m f e th L h hβ β≤ < + ;
(d) , ,( )cosec (i.e. )m f e t e e uL h h w wβ= + = ; (e) . 0dbh ≥
36

0
10
20
30
40
50
60
70
80
0 0.5 1 1.5 2 2.5 3 3.5 4 4.5 5 5.5 6 6.5 7Crack end width w e (mm)
Shea
r fo
rce (
kN)
U-strips (Analytical)
Side strips (Analytical)
Side strips (FEM1)
U-strips (FEM1)
F
Side strips (FEM2)
U-strips (FEM2)
(a)
0
5
10
15
20
25
30
35
0 0.5 1 1.5 2 2.5 3 3.5Crack end width w e (mm)
Shea
r fo
rce (
kN)
4
U-strips (Analytical)
Side strips (Analytical)
Side strips (FEM1)
U-strips (FEM1)
F
Side strips (FEM2)
U-strips (FEM2)
(b)
37

0
10
20
30
40
50
60
70
80
90
0 0.2 0.4 0.6 0.8 1 1.2Crack end width w e (mm)
Shea
r fo
rce (
kN) U-strips (Analytical)
Side strips (Analytical)
Side strips (FEM1)
U-strips (FEM1)
F
Side strips (FEM2)
U-strips (FEM2)
(c)
Fig. 15. Closed-form solution versus FE predictions: (a) , 600 mmf eh = , ; (b) , ; (c)
0.11 mmft =
, 300 mmf eh = 0.11 mmft = , 300 mmf eh = , 0.88 mmft = .
38

Appendix Comparison of the present solution with Monti et al.’s (2004) solution
The present solution is compared with Monti et al.’s (2004) solution in this Appendix in terms of the relationship between the FRP shear resistance and the crack end width (i.e. the
f eV w− curve) and the corresponding debonding sequence of FRP strips. The same material properties (strength of concrete '
cf , FRP elastic modulus fE and FRP tensile strength ff ) as those for the example beams in the main body of the paper are adopted. In the present solution, the maximum interfacial stress fτ and the interfacial facture energy fG are determined according to Lu et al.’s (2006) bond-slip model. In Monti et al.’s (2004) solution, the bond parameters including the effective bond length , the interfacial fracture energy eL fG and the bond strength of FRP-to-concrete joints fddf are determined following Liotta (2006) which provides a more detailed presentation of the solution. It is assumed that the beam sides are fully covered with FRP with all fibers oriented vertically (β = 90°) and the angle of the shear crack θ =45°. The comparison here is made for two beam heights: , 300 mm and 600 mmf eh = . For both cases it is assumed that (see Figs 11-14) which is also assumed in Monti et al.’s (2004) solution and mm.
0t bh h= =0.11ft =
Fig. A.1 compares the f eV w− curves from the two solutions. The FE predictions for a linearly softening bond-slip model are also shown for reference. It may be noted that Monti et al.’s (2004) solution only gives part of the f eV w− curve because it is subjected to several limiting conditions [e.g. for both FRP side strips and U-strips, where is the governing FRP bond length at the location z , defined as the FRP bond length above the critical shear crack for FRP U-strips and the smaller FRP bond lengths above and below the critical shear crack for FRP side strips].
( )bl z L≥ e ( )bl z
For FRP U-strips, the maximum FRP shear contribution predicted by Monti et al.’s (2004) solution is very close to that from the present solution and both are close to the FE prediction. When and
,maxfV
, 300 mmf eh = 0.11 mmft = , the former predicts kN which is only about 3% higher than that predicted by the latter, 32.4 kN; both are close to the FE prediction of 31.5 kN. However, the crack end width corresponding to (i.e. ) predicted by the former is significantly larger than the value predicted by the present solution. These values are respectively 1.86 mm and 1.26 mm for the case of and
, and 3.72 mm and 2.63 mm for the case of
,max 33.2fV =
,maxfV ,e uw
, 300 mmf eh =
0.11 mmft = , 600 mmf eh = and , with the former being respectively 47.6% and 41.4% higher than the latter for the two cases. The present predictions are again close to the FE predictions of 1.13 mm and 2.63 mm for the two cases. The significant difference in between the two closed-form solutions is mainly caused by the assumption adopted by Monti et al. (2004) that the slips at both sides of the shear crack are symmetrical, as further discussed below. The difference in the predicted value is not important if interaction between internal steel reinforcement, external FRP shear reinforcement and concrete is not considered, but would have a significant consequence if this interaction is considered.
0.11 mmft =
,e uw
ew
39

For FRP side strips, the value predicted by Monti et al.’s (2004) solution is generally slightly smaller than that predicted by the present solution. The difference between the two solutions decreases with an increase of
,maxfV
,f eh . For example, this difference is 8.3% for and reduces to 4.1% for , 300 mmf eh = , 600 mmf eh = . The corresponding predicted by
Monti et al.’s (2004) solution is generally larger than that from the present solution. For example, the two predictions are respectively 0.87mm and 0.62mm for the case of
and
,e uw
, 300 mmf eh = 0.11 mmft = , with the former being 40% larger than the latter. The difference reduces to 33.3% for the case of , 600 mmf eh = and 0.11 mmft = . Further analyses showed that these differences are mainly caused by the different FRP-to-concrete bond-slip laws adopted in the two solutions. Monti et al. (2004) assumed that the slip at the loaded end of the FRP-to-concrete joint at the onset of deboning 1 0.33u = mm when for the case of FRP sheet [and
( )bl z L= e
( )1 1( )b b eu l l L u= for ( )bl z Le< ], which is considerably larger than the value of about 0.2 mm calculated using Lu et al.’s (2005) bond-slip model. Fig. A.2 shows the distribution of the maximum crack width at coordinate z , , beyond which the FRP strip at this location is fully debonded, along the shear crack (in terms of coordinate ) for FRP U-strips. In Monti et al.’s (2004) solution, is determined by the governing bond length . In the present solution, can be calculated respectively from Eqs (32) and (43) (by setting
( )dbw z
z ( )dbw z( )bl z ( )dbw z
sinmL z β= ) for ,0 sin 2f ez hβ≤ ≤ and from Eq. (55) (by setting ) for 0t bh h= = , 2 sin ,f eh z hf eβ< ≤ .Also shown in Fig. A.2 is the assumed linear crack width distribution determined by the following equation (Monti et al. 2004) which is an alternative expression of Eq. (24):
( ) / sinw z zα θ= (A1) where α is the crack opening angle of the shear crack (in radians). In Fig. A2, the sequence of debonding of FRP strips can be determined by comparing and . When
( )dbw z( )w z α increases continuously from zero, debonding will occur at locations where
. From Fig. A.2 it is clear that, if symmetrical slips at both sides of the shear crack are assumed as in Monti et al. (2004), debonding will start from a location near the crack tip and propagate towards the crack end as the shear crack widens (
( ) ( )dbw z w z>
α increases); at the crack end (i.e. w
( )w ze) corresponding to the initiation of FRP debonding is 1.86 mm and 3.72mm
respectively for and , 300 mmf eh = , 600 mmf eh = , with the corresponding α being 0.00439 for both cases. The present study (in which the above assumption is removed) predicts that debonding starts from the crack end and propagates towards the crack tip as α increases. The
values corresponding to the initiation of FRP debonding are 1.26mm (α=0.00297) and 2.63 mm (α=0.00311) respectively for
ew
, 300 mmf eh = and 600 mm respectively. It should be noted that a small portion of FRP near the crack tip is predicted to debond nearly at the same time as the initiation of FRP debonding at the crack end especially for the case of but this is due to the simplifying assumption of a brittle post-peak response of the curve of the type A joint as explained in the main body of the paper. If the descending branch is considered, then debonding near the crack tip does not occur when w(z)<0.4mm for any bond length (Fig A.2). In the present analytical solution, the consequence of the simplification is counter-balanced by the assumption that debonding is a sequential process from the crack end to the crack tip, so early debonding near the crack tip is not considered. This observation may
, 300 mmf eh =P − Δ
40
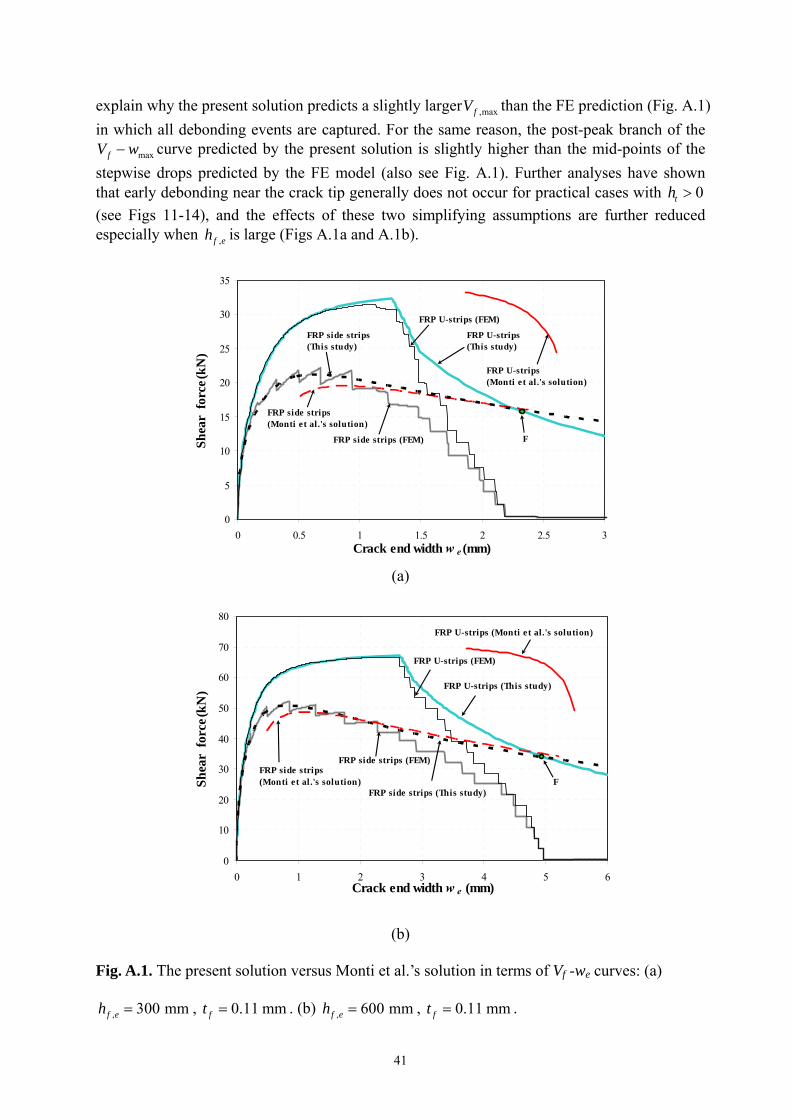
explain why the present solution predicts a slightly larger than the FE prediction (Fig. A.1) in which all debonding events are captured. For the same reason, the post-peak branch of the
curve predicted by the present solution is slightly higher than the mid-points of the stepwise drops predicted by the FE model (also see Fig. A.1). Further analyses have shown that early debonding near the crack tip generally does not occur for practical cases with (see Figs 11-14), and the effects of these two simplifying assumptions are further reduced especially when
,maxfV
maxfV w−
0th >
,f eh is large (Figs A.1a and A.1b).
0
5
10
15
20
25
30
35
0 0.5 1 1.5 2 2.5Crack end width w e (mm)
Shea
r fo
rce (
kN)
3
FRP side strips (FEM) F
FRP side strips(Monti et al.'s solution)
FRP U-strips (FEM)
FRP U-strips (Monti et al.'s solution)
FRP side strips(This study)
FRP U-strips(This study)
(a)
0
10
20
30
40
50
60
70
80
0 1 2 3 4 5 6Crack end width w e (mm)
Shea
r fo
rce (
kN)
FRP side strips (This study)
FRP side strips (FEM)
FRP U-strips (FEM)
FFRP side strips (Monti et al .'s solution)
FRP U-strips (Monti e t al.'s solution)
FRP U-strips (This study)
(b)
Fig. A.1. The present solution versus Monti et al.’s solution in terms of Vf -we curves: (a)
, . (b) , 300 mmf eh = 0.11 mmft = , 600 mmf eh = , 0.11 mmft = .
41

0
0.5
1
1.5
2
2.5
3
0 30 60 90 120 150 180 210 240 270 300z (mm)
Cra
ck w
idth
(m
m)
0.4 ,0db uw mm z a= ≤ ≤
( ) 0.00439 ( . ' )w z at Monti et al s solutionα =
( ) 0.00297 ( )w z at This studyα =
( ) ( )dbw z This study
( ) ( .' )dbw z Monti et al s solution
(a)
0
1
2
3
4
5
6
0 100 200 300 400 500 600z (mm)
Cra
ck w
idth
(m
m)
0.4 ,0db uw mm z a= ≤ ≤
( ) at 0.00439 ( . ' )w z Monti et al s solutionα =
( ) at 0.00311 ( )w z This studyα =
( ) ( . ' )dbw z Monti et al s solution
( ) ( )dbw z This study
(b)
Fig. A.2. Comparison of debonding sequence between Monti et al.’s (2004) solution and the
present solution for FRP U-strips: (a) , 300 mmf eh = , 0.11 mmft = . (b) ,
.
, 600 mmf eh =
0.11 mmft =
42