process modelling and economic evaluation of waste tyres
TRANSCRIPT

Process modelling and economic evaluation of waste tyres to
limonene via pyrolysis by
Lusani Mulaudzi
Thesis presented in partial fulfilment of the requirements for the Degree
of
MASTER OF ENGINEERING (CHEMICAL ENGINEERING)
in the Faculty of Engineering at Stellenbosch University
Supervisor
Professor Percy van der Gryp
Co-Supervisor/s
Professor Cara Schwarz
December 2017

i
DECLARATION
By submitting this thesis electronically, I declare that the entirety of the work contained therein is my
own, original work, that I am the sole author thereof (save to the extent explicitly otherwise stated), that
reproduction and publication thereof by Stellenbosch University will not infringe any third party rights
and that I have not previously in its entirety or in part submitted it for obtaining any qualification.
Signature: Lusani Mulaudzi
Date: December 2017
Copyright © 2017 Stellenbosch University
All rights reserved
Stellenbosch University https://scholar.sun.ac.za

ii
ABSTRACT
It is estimated that there are 60 million waste tyres disposed of across South Africa, with approximately
11 million waste tyres added each year. Most of the waste tyres end up being dumped in landfills and
stockpiles; the dumps and stockpiles present a series of environmental and human health problems.
Processes such as incineration, material recovery, re-treading and energy recovery have mostly been used
as current pathways to deal with the waste tyre problem. Current processes have shown to be
environmentally unfriendly and/or economically unattractive due to emissions, low demand and low
market prices of their associated products.
Pyrolysis has emerged as a potential process that can be used to tackle the problem of waste tyre disposal
by valorisation through conversion into gas, liquid, and char products. The liquid product of tyre pyrolysis
contains compounds like limonene, benzene, toluene, xylene, and styrene, which could be valuable
chemical feedstock due to their market values. Pyrolysis processes that focus on recovery of valuable
products are greatly desired to improve the economics of waste tyre pyrolysis.
The main objective of this study was to investigate the economic feasibility of using the pyrolysis
technology for upgrading low-value waste tyres to high-value chemicals. Limonene was chosen as the
valuable compound of interest in this study. Using literature sources, a seven-step/level hierarchical
method with mostly Douglas approach logic was used to develop and evaluate the process for upgrading
the waste tyres into limonene.
A literature-based Aspen Plus® simulation model was developed to evaluate the technical performance
of the process, and the model was also used as a tool to ascertain the economic feasibility of the process.
The PR-BM and NRTL property models were used for conventional components in the simulation model,
with the UNIFAC property model used to estimate missing binary parameters for the NRTL model. The
HCOALGEN and DCOALIGT property models were used for non-conventional components in the
simulation model.
The discounted cash flow method was used to evaluate the economic feasibility of a 30 tons/day waste
tyres to limonene process, producing limonene at a rate of 672 kg/day and a purity of 95 wt.%. The
residual TDO from the waste tyres to limonene process (at 523 L/hr) was also sold to generate income.
The waste tyres to limonene process was then compared with a 30 tons/day conventional process of tyre
Stellenbosch University https://scholar.sun.ac.za

iii
pyrolysis for TDO production on the basis of economic performance. The tyres to limonene process was
found to be more economically feasible than the tyres to TDO process at the end of a 10 year plant life.
The tyres to limonene process had an IRR of 30%, NPVs of 6.3 and 1.1 MM$ at 12% and 25% discount rates
respectively, and a payback period of just under 3 years, at a current limonene selling price of $12/kg. The
process had capital investment requirements of 7.6 MM$. Sensitivity analysis showed that the process is
most sensitive to changes in the cost of distillation columns, limonene selling price, and the yield of
limonene. To achieve 25% IRR for economic attractiveness, a maximum column cost of 2.5 MM$, a
minimum limonene selling price of $10/kg, or a minimum limonene yield of 2.1 wt.% are required. For the
process to achieve the minimum required IRR of 12% to ensure feasibility, a maximum column cost of 5.3
MM$, a minimum limonene selling price of $5/kg, or a minimum limonene yield of 1.1 wt.% are required.
The tyres to TDO process showed that an IRR of 17% can be achieved, with a payback period of 4.4 years
and an NPV of 0.71 MM$ at 12% discount rate, at a current TDO selling price of $0.27/L. A capital
investment of 3.3 MM$, and annual total operating cost of $525 323 will be required for the process.
Keywords: Waste tyres, Pyrolysis, Limonene, Aspen Plus® simulation, Economic feasibility, NPV, IRR.
Stellenbosch University https://scholar.sun.ac.za

iv
OPSOMMING
Dit word beraam dat daar 60 miljoen bande bestaan regoor Suid-Afrika en elke jaar word daar ongeveer
11 miljoen afval bande bygevoeg. Meeste van die afval bande beland in stortingsterreine; hierdie
stortingsterreine veroorsaak n reeks van omgewings- en menslike gesondheidsprobleme. Prosesse soos
verbranding, die herwinning van materiale, “re-treading” en die herwinning van energie word huidiglik
uitgelig as behandelingsmetodes van afval bande. Dit is wel bewys dat huidiglike prosesse, as gevolg van
emissies, lae vraag en lae markpryse van verwante produkte, onaantreklik is vanaf beide n omgewings en
ekonomiese standpunt.
Pirolise word uitgelig as n potensiele proses om die afval band probleem te behandel deur die omskakeling
daarvan na n gas, vloeistof of “char” produkte. Die vloeistof produk vanaf die pirolise van bande bevat
potensiele waardevolle verbindings soos limonene, benseen, tolueen, xileen en stireen as gevolg van hul
hoe markwaardes. Die winsgewendheid van die pirolise van afval bande word verbeter deur fokus te
verskuif na die herwinning van waardevolle produkte.
Die hoofdoel van hierdie studie was om die ekonomies vatbaarheid van pirolise tegnologie te ondersoek
vir die opgradering van afval bande na waardevolle chemikaliee. Die verbinding van belang vir hierdie
studie was gekies as limonene. Die opgraderingsproses van afval bande na limonene was ontwikkel en
ondersoek deur gebruik te maak van n sewe-stap/vlak hierargiese metode, gebaseer op die Douglas
benadering.
Die tegniese en ekonomiese vatbaarheid van die proses was evalueer deur gebruik te maak van n
literatuur-gebaseerde Aspen Plus® simulasie model. Die PR-BM en NRTL eienskap modelle was gebruik vir
die bepaling van konvensionele komponente in the die simulasie model. Die UNIFAC eienskap model was
gebruik om die onbekende parameters in die NRTL eienskap model te bepaal. Die HCOALGEN en
DCOALIGT eienskap modelle was gebruik vir die bepaling van onkonvensionele komponente in die
simulasie model.
Die ekonomiese vatbaarheid van die afval band na limonene proses was evalueer deur die ‘discounted
cash flow method’ met a voer- en produksietempo van onderskeidelik 30 ton/dag en 672 kg/day, met a
suiwerheid van 95 wt%. Die TDO oorblyfsel (523 L/hr) vanaf die afval band na limonene proses was
verkoop teen n wins. Die proses was vergelyk met die konvensionele proses van TDO produksie deur afval
Stellenbosch University https://scholar.sun.ac.za

v
band verbranding vanaf n ekonomiese perspektief. Dit was bevind dat vanuit n ekonomiese oogpunt, die
omskakeling van afval bande na limonene haalbaar was aan die einde van n 10 jaar aanleg leeftyd.
Dit was bevind dat die afval band na limonene proses n IOK van 30%, n NPV van 6.3 en 1.1 MM$ het teen
n afslagkoers van 12% en 25%, onderskeidelik, en n terugbetaal periode van net onder 3 jaar met die
huidiglike limonene verkoopsprys van $12/kg. Die proses vereis n kapitalbelegging van 7.6 MM$. Dit was
bewys deur sensitiwiteitsanalise dat die proses meer sensitief is teenoor veranderinge in the prys van
distillasiekolomme, die verkoopsprys van limonene en die proses opbrengs van limonene. Ekonomiese
aantreklikheid deur n 25% IRR kan bereik word, deur n maksimum kolom koste van 2.5 MM$, n minimum
limonene verkoopsprys van $10/kg, of n minimum limonene proses opbrengs van 2.1 wt.% te vereis. Vir
die proses om vatbaarheid te verseker deur a minimum IRR van 12% te bereik, n maksimum kolom koste
van 5.3 MM$, n minimum limonene verkoopsprys van $5/kg, of n minimum limonene proses opbrengs
van 1.1 wt.% word vereis.
Daar was bevind dat die pirolise van bande vir die produksie van TDO n IOK van 17% en n NPV van 0.71
MM$ kan behaal met n terugbetaal periode van 4.4 jaar met die huidiglike TDO verkoopsprys van $0.27/L.
Hierdie proses vereis n kapitaalbelegging van 3.3 MM$ en n total bedryfskoste van $525 323.
Sleutelwoorde: Afval bande, Pirolise, Limonene, Aspen Plus® simulasie, Ekonomiese vatbaarheid, NPV,
IOK.
Stellenbosch University https://scholar.sun.ac.za

vi
ACKNOWLEDGEMENTS
I would like to sincerely thank the following people for their enormous contribution towards the success
of this study:
• The Lord Jesus Christ for the provision of life, sustaining me up to this point and the countless
favours.
• My supervisors, Professor Percy van der Gryp and Professor Cara Schwarz for their patience,
guidance, support and critical evaluation of my work throughout.
• The Recycling and Economic Development Initiative of South Africa (REDISA), the National
Research Foundation (NRF) and the Technology and Human Resources for Industry Programme
(THRIP) for financial support.
• Dr Somayeh Farzad for her immense assistance with the development of Aspen simulation
models, economic evaluation and for the countless consultations we had. Your assistance is
highly appreciated.
• Dr Bart Danon for his assistance in the early stages of the project especially in selecting the right
literatures to use for my simulations. Your assistance is highly appreciated.
• The REDISA research group for their inputs and suggestions during the progress meetings.
• My mom for her love, continuous support and encouragement during the tough times.
• Family and friends for their continuous encouragement.
• Aspen Technology.
• All the many postgrad colleagues from whom I would seek assistance from time to time.
Stellenbosch University https://scholar.sun.ac.za

vii
DEDICATION
To my mom Vho-Azwitamisi Joyce Ndiitwani for her love and continual support
Mmawe, heyi ndi yavho!!!!
Stellenbosch University https://scholar.sun.ac.za

viii
TABLE OF CONTENTS
Declaration ............................................................................................................................................... i
Abstract .................................................................................................................................................. ii
Opsomming ............................................................................................................................................ iv
Acknowledgements ................................................................................................................................ vi
Dedication ............................................................................................................................................. vii
Table of contents .................................................................................................................................. viii
Nomenclature ....................................................................................................................................... xiii
Chapter 1: INTRODUCTION ................................................................................................................ 1
1.1. Background and motivation ..................................................................................................... 1
1.2. Aims and objectives ................................................................................................................. 4
1.3. Scope of study and thesis layout .............................................................................................. 4
Chapter 2: FRAMEWORK AND METHODOLOGY.................................................................................. 7
Overview ............................................................................................................................................. 7
2.1. Synthesis approach and process evaluation .............................................................................. 7
2.2. Methodology as used in this study ........................................................................................... 9
2.3. Summary ............................................................................................................................... 13
Chapter 3: LITERATURE REVIEW ....................................................................................................... 15
Overview ........................................................................................................................................... 15
3.1. Waste tyre problem ............................................................................................................... 15
3.1.1. Waste tyre generation .................................................................................................... 15
3.1.2. Disposal of waste tyres ................................................................................................... 15
3.1.3. Current methods for treating waste tyres and their challenges ....................................... 16
3.1.3.1. Materials recovery and recycling ............................................................................. 17
3.1.3.2. Thermal treatment with energy recovery ................................................................ 19
3.1.3.3. Conclusions on current methods evaluated............................................................. 21
3.2. Tyre composition ................................................................................................................... 21
3.2.1. Constituents of a tyre ..................................................................................................... 21
3.2.2. Characterisation of a tyre ............................................................................................... 24
Stellenbosch University https://scholar.sun.ac.za
ix
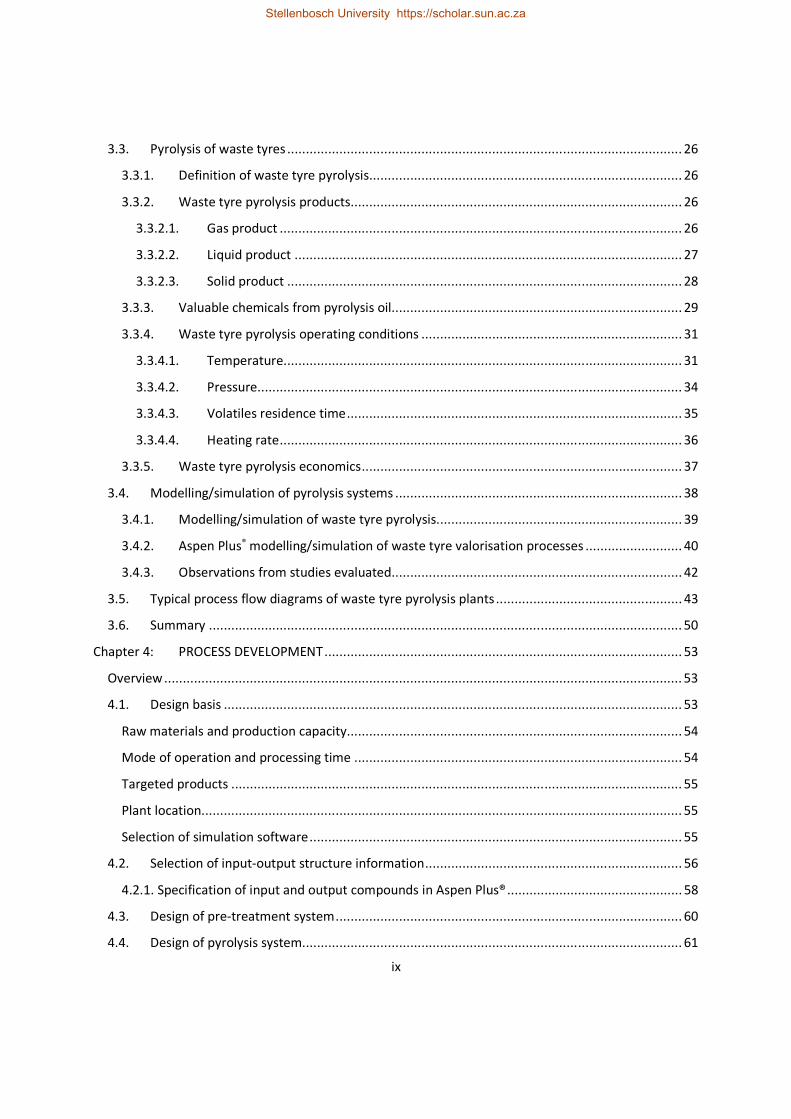
3.3. Pyrolysis of waste tyres .......................................................................................................... 26
3.3.1. Definition of waste tyre pyrolysis .................................................................................... 26
3.3.2. Waste tyre pyrolysis products ......................................................................................... 26
3.3.2.1. Gas product ............................................................................................................ 26
3.3.2.2. Liquid product ........................................................................................................ 27
3.3.2.3. Solid product .......................................................................................................... 28
3.3.3. Valuable chemicals from pyrolysis oil.............................................................................. 29
3.3.4. Waste tyre pyrolysis operating conditions ...................................................................... 31
3.3.4.1. Temperature ........................................................................................................... 31
3.3.4.2. Pressure .................................................................................................................. 34
3.3.4.3. Volatiles residence time .......................................................................................... 35
3.3.4.4. Heating rate ............................................................................................................ 36
3.3.5. Waste tyre pyrolysis economics ...................................................................................... 37
3.4. Modelling/simulation of pyrolysis systems ............................................................................. 38
3.4.1. Modelling/simulation of waste tyre pyrolysis.................................................................. 39
3.4.2. Aspen Plus® modelling/simulation of waste tyre valorisation processes .......................... 40
3.4.3. Observations from studies evaluated.............................................................................. 42
3.5. Typical process flow diagrams of waste tyre pyrolysis plants .................................................. 43
3.6. Summary ............................................................................................................................... 50
Chapter 4: PROCESS DEVELOPMENT ................................................................................................ 53
Overview ........................................................................................................................................... 53
4.1. Design basis ........................................................................................................................... 53
Raw materials and production capacity .......................................................................................... 54
Mode of operation and processing time ........................................................................................ 54
Targeted products ......................................................................................................................... 55
Plant location ................................................................................................................................. 55
Selection of simulation software .................................................................................................... 55
4.2. Selection of input-output structure information ..................................................................... 56
4.2.1. Specification of input and output compounds in Aspen Plus® ............................................... 58
4.3. Design of pre-treatment system ............................................................................................. 60
4.4. Design of pyrolysis system...................................................................................................... 61
Stellenbosch University https://scholar.sun.ac.za

x
4.4.1. Selection of reactor operating conditions ....................................................................... 62
4.4.2. Reactor product distribution........................................................................................... 63
4.4.2.1. Correlation equations for yield prediction ..................................................................... 64
4.4.3. Model validation ............................................................................................................ 64
4.4.4. Aspen Plus® simulation of the pyrolysis system ............................................................... 68
4.4.4.1. Selection and validation of thermodynamic model ........................................................ 68
Validation of thermodynamic model .......................................................................................... 68
4.4.4.2. Description of the pyrolysis system flowsheet ............................................................... 71
4.5. Design of separation system................................................................................................... 73
Brief description of the separation system ................................................................................. 74
4.5.1. Determination of EX-102 operating temperature ............................................................ 77
Comparison of scenario 1 and 2 ................................................................................................. 80
4.5.2. Aspen Plus® simulation of the separation system ............................................................ 82
4.5.2.1. Selection and validation of thermodynamic model ........................................................ 82
Validation of thermodynamic model .......................................................................................... 82
4.5.2.2. Description of the separation system flowsheet ............................................................ 86
Sensitivity analysis for T-101 parameters at base case number of stages .................................... 91
Determination of T-101 parameters to achieve 99% recovery at various number of stages ........ 91
Operation of T-101..................................................................................................................... 96
Operation of T-102................................................................................................................... 100
Determination of T-103 parameters to achieve 95% limonene purity at various number of stages
................................................................................................................................................ 101
Operation of T-103................................................................................................................... 106
Operation of T-104................................................................................................................... 109
4.6. Design of energy recovery system ........................................................................................ 110
4.6.1. Aspen Plus® simulation of the heat recovery system ..................................................... 112
4.7. Final PFD of the waste tyres to limonene process ................................................................. 114
4.8. Summary ............................................................................................................................. 119
Chapter 5: EVALUATION AND COMPARISON .................................................................................. 121
Overview ......................................................................................................................................... 121
5.1. Economic model used in this study....................................................................................... 121
Stellenbosch University https://scholar.sun.ac.za

xi
5.1.1. Main assumptions ........................................................................................................ 122
5.1.2. Key economic indicators (KEI) ....................................................................................... 124
5.2. Capital cost estimation ......................................................................................................... 124
5.3. Operating cost estimation .................................................................................................... 127
5.3.1. Variable operating costs ............................................................................................... 127
5.3.2. Fixed operating costs .................................................................................................... 128
5.4. Estimation of revenue .......................................................................................................... 129
5.5. Profitability analysis ............................................................................................................. 131
5.6. Scenario analysis and comparison ........................................................................................ 132
5.7. Sensitivity analysis ............................................................................................................... 135
5.8. Summary ............................................................................................................................. 141
Chapter 6: CONCLUSIONS AND RECOMMENDATIONS .................................................................... 143
6.1. Conclusions .......................................................................................................................... 143
6.2. Recommendations ............................................................................................................... 146
REFERENCES ........................................................................................................................................ 147
APPENDIX A: LIST OF COMPONENTS IN CURRENT SIMULATIONS ......................................................... 169
APPENDIX B: ADDITIONAL INFORMATION FOR PYROLYSIS SECTION ..................................................... 171
B.1. Mass balance equations ............................................................................................................ 171
B.2. Correlation equations for yield prediction ................................................................................. 173
B.3. Selection of thermodynamic model .......................................................................................... 174
Thermodynamic model for pyrolysis section, normal distillation and heat recovery ..................... 175
Eric Carlson method ................................................................................................................. 175
Bob Seader method ................................................................................................................. 176
Aspen Plus® guideline .............................................................................................................. 177
Literature recommendations ................................................................................................... 177
Recommended property method ............................................................................................. 178
Thermodynamic model for extractive distillation ......................................................................... 178
APPENDIX C: SENSITIVITY ANALYSIS OF SEPARATION COLUMNS .......................................................... 179
C.1. Determination of initial parameters for T-101 using DSTWU column model .............................. 179
C.2. T-101 sensitivity analysis ........................................................................................................... 180
Sensitivity analysis at base case number of stages ....................................................................... 180
Stellenbosch University https://scholar.sun.ac.za
xii
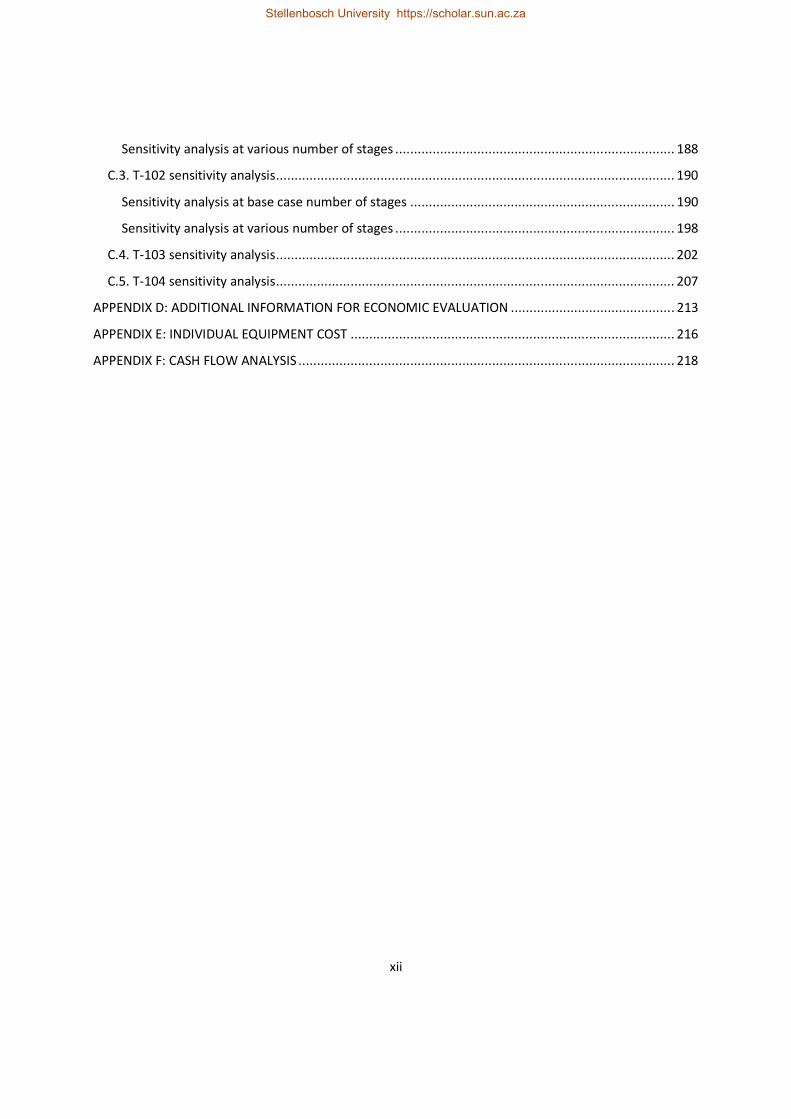
Sensitivity analysis at various number of stages ........................................................................... 188
C.3. T-102 sensitivity analysis ........................................................................................................... 190
Sensitivity analysis at base case number of stages ....................................................................... 190
Sensitivity analysis at various number of stages ........................................................................... 198
C.4. T-103 sensitivity analysis ........................................................................................................... 202
C.5. T-104 sensitivity analysis ........................................................................................................... 207
APPENDIX D: ADDITIONAL INFORMATION FOR ECONOMIC EVALUATION ............................................ 213
APPENDIX E: INDIVIDUAL EQUIPMENT COST ....................................................................................... 216
APPENDIX F: CASH FLOW ANALYSIS ..................................................................................................... 218
Stellenbosch University https://scholar.sun.ac.za

xiii
NOMENCLATURE
Abbreviation Definition
BM Boston-Mathias alpha function
BFD Block flow diagram
BR Butadiene rubber
BTX Benzene, toluene and xylene
CB Carbon black
CEPCI Chemical Engineering plant cost index
CPR Chloroprene rubber
DCFROR Discounted cash flow rate of return
DCOALGEN Coal density model
DCOALIGT IGT coal density model
DEG Diethylene glycol
DTG Derivative thermogravimetric
EOS Equation of state
EU European union
HCOALGEN General coal enthalpy model
HETP Height equivalent to theoretical plate
HFO Heavy fuel oil
IRR Internal rate of return
ISBL Inside battery limits
KEI Key economic indicator
LLE Liquid-liquid-equilibrium
LK-PLOCK Lee-Kesler-Plocker
MM Million
Mt Million tons
MT Metric tons
Stellenbosch University https://scholar.sun.ac.za

xiv
Abbreviation Definition
NOx Nitrogen oxides
NPV Net present value
NR Natural rubber
NRTL Non-random two-liquid
NTR Nitrile rubber
OL Operating labour
OPEX Operating expenditure
PAHs Polycyclic aromatic hydrocarbons
PBD Polybutadiene rubber
PBP Payback period
PCT Passenger car tyre
Pet-coke Petroleum coke
PFD Process flow diagram
PPC Pretoria Portland Cement
PR Peng-Robinson
PENG-ROB Peng-Robinson
REDISA Recycling and development initiative of South Africa
RGIBBS Equilibrium reactor
RKS Redlich-Kwong-Soave
RK-SOAVE Redlich-Kwong-Soave
RPLUG Plug flow reactor
RSTOIC Stoichiometric reactor
RYIELD Yield reactor
SBR Styrene-butadiene rubber
SOx Sulphur oxides
SSE Sum of square of errors
Stellenbosch University https://scholar.sun.ac.za

xv
Abbreviation Definition
STMC Scrap Tire Management Council
TAC Total annualised costs
TCI Total capital investment
TDC Total direct cost
TDF Tyre derived fuel
TDO Tyre derived oil
TFCI Total fixed capital investment
TGA Thermogravimetric analysis
TIC Total indirect costs
TT Truck tyre
UNIFAC Universal function activity coefficient
USA United States of America
VLE Vapour-liquid-equilibrium
VLLE Vapour-liquid-liquid-equilibrium
VOCs Volatile organic compounds
WC Working capital
WT Waste tyres
Stellenbosch University https://scholar.sun.ac.za
xvi
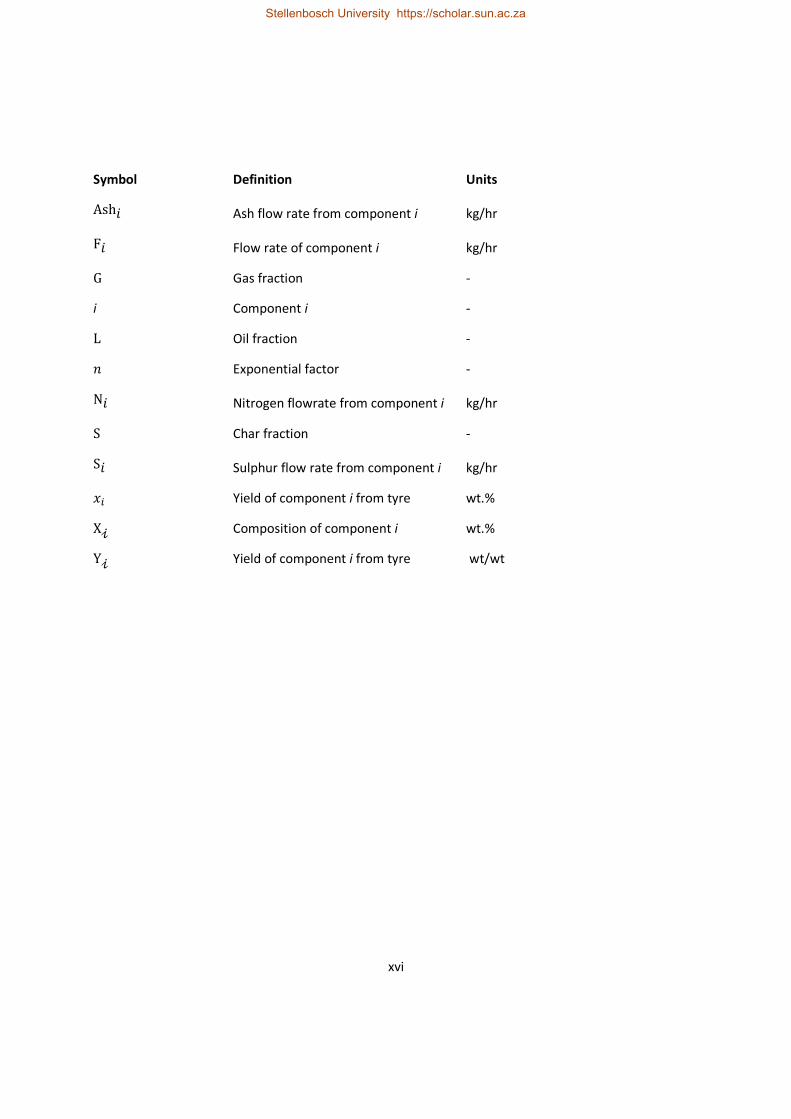
Symbol Definition Units
Ash� Ash flow rate from component i kg/hr
F� Flow rate of component i kg/hr
G Gas fraction -
i Component i -
L Oil fraction -
� Exponential factor -
N� Nitrogen flowrate from component i kg/hr
S Char fraction -
S� Sulphur flow rate from component i kg/hr
�� Yield of component i from tyre wt.%
X� Composition of component i wt.%
Y� Yield of component i from tyre wt/wt
Stellenbosch University https://scholar.sun.ac.za

xvii
Stellenbosch University https://scholar.sun.ac.za

1
CHAPTER 1: INTRODUCTION
1.1. Background and motivation
The increase in the demand for tyres has led to a subsequent increase in the amount of tyres reaching
their end-of-life. The annual global production of tyres is approximately 1.5 billion with just as many
reaching their end-of-life (Williams, 2013; Pilusa et al., 2014; Danon et al., 2015). The United States of
America (USA) generated 500 million waste tyres in 2007 whereas the European Union (EU) generated
289 million waste tyres in 2010 (Quek and Balasubramanian, 2013; Danon et al., 2015). In South Africa,
annual waste tyre generation is estimated at 11 million tyres (REDISA, 2012; Pilusa et al., 2014).
Most of the waste tyres end up being dumped in landfills and stockpiles and they resist degradation due
to their make-up (Martinez et al., 2013; Hita et al., 2016; Wang et al., 2016). The waste tyre dumps and
stockpiles present a serious threat to both the environment and human health as they promote the
growth of pests and disease carrying insects. Dumps and stockpiles also present a risk of explosive gases
as the tyres trap gases while disposed of in landfills (Leung and Wang, 2003; Quek and Balasubramanian,
2013). Waste tyre dumps also present a potential risk of fires that could be difficult to extinguish which
would have serious environmental implications (Islam et al., 2011; Choi et al., 2014; Wang et al., 2016).
Different methods have been used as possible pathways for dealing with the problem of waste tyres.
Waste tyres have been used in processes like incineration, civil engineering applications, material
recovery, re-treading, energy recovery and pyrolysis (Islam et al., 2011; Pilusa et al., 2014). Incineration
has drawbacks associated with the disposal of ash, production of toxic emissions and the production of
soot (Sharma et al., 2000; Islam et al., 2011). Material recovery methods have drawbacks associated with
high energy consumption and a limited market for the associated products (Amari et al., 1999; Sharma et
al., 2000; Quek and Balasubramanian, 2013). Re-treading is mainly limited by quality demands, reliability
and intricate technical conditions set by the world market (Amari et al., 1999; Sharma et al., 2000;
Muzenda and Popa, 2015).
The use of waste tyres as tyre-derived-fuel (TDF) for energy recovery is the major route currently used for
treating waste tyres with the majority of TDF used in cement kilns. There are drawbacks associated with
this application such as emissions control, product quality control and modifications needed to
accommodate TDF (Barlaz et al., 1993; Amari et al., 1999; Giugliano et al., 1999; Conesa et al., 2008).
Stellenbosch University https://scholar.sun.ac.za

2
Environmental concerns, low product demand and low market value of the products are the main
limitations and drawbacks associated with the current methods for dealing with waste tyres. These
limitations and drawbacks lead to the current pathways being unable to greatly reduce the billions of tyres
currently in stockpiles and landfills.
Pyrolysis is a method that could be used to valorise the waste tyres through conversion into valuable
products.
Pyrolysis of waste tyres has been gaining popularity as an attractive (alternative) method of recycling
waste tyres (Lopez et al., 2010; Islam et al., 2011; Muzenda and Popa, 2015). Pyrolysis is a thermal process
that decomposes an organic material into low molecular weight compounds under inert conditions
(Cunliffe and Williams, 1998a; Amari et al., 1999). During waste tyre pyrolysis, the organic rubber material
is broken down into a gas (pyrolysis gas), liquid (pyrolysis oil/tyre derived oil (TDO)) and a solid product
(pyrolysis char) (Kyari et al., 2005; Lopez et al., 2010; Islam et al., 2011; Wang et al., 2016). Waste tyres
have a high volatile content, which gives high yields of pyrolysis gas and pyrolysis oil (Williams and Besler
1995; Kyari et al., 2005; Martinez et al., 2013).
The pyrolysis gas has a high calorific value and it is mostly used as alternative fuel for the pyrolysis process
(Kyari et al., 2005; Olazar et al., 2008). The pyrolysis char contains the inorganic matter of the tyre (ash,
zinc oxide, steel, silicates etc.) and non-volatile carbon black (Amari et al., 1999; Li et al., 2004). The char
product can either be used as activated carbon (after activation and upgrading), as a solid fuel or re-used
as carbon black in the tyre manufacturing process after upgrading (Wojtowicz and Serio, 1996; Amari et
al., 1999). Of the pyrolysis products, the pyrolysis oil/TDO is the most interesting fraction.
TDO is a complex mixture of aliphatic and aromatic compounds which can be attributed to a wide variety
of formulations used in tyre manufacturing (Cunliffe and Williams, 1998a; Kyari et al., 2005; Choi et al.,
2014). TDO has a high calorific value (about 40-44 MJ/kg) and it has primarily been used as an alternative
fuel either directly (in its raw form) or blended with diesel fuel (Muragan et al., 2008; Aydin and Ilkilic,
2012; Martinez et al., 2013; Frigo et al., 2014). However, using TDO as fuel results in low TDO selling prices
as raw TDO is generally sold as the equivalence of heavy fuel oil (HFO), which is a very low cost liquid fuel
(Pilusa and Muzenda, 2013; Pilusa et al., 2014).
TDO has also been shown to be a potential source of chemical feedstock as it contains valuable chemicals
like benzene, toluene, xylene, styrene, ethylbenzene and limonene. These are chemicals that have wide
Stellenbosch University https://scholar.sun.ac.za

3
industrial applications (Williams and Brindle, 2003a; Li et al., 2004; Lopez et al., 2010; Choi et al., 2014).
The presence of these various compounds in TDO makes waste tyre pyrolysis an excellent
method/pathway for upgrading waste tyres to valuable chemicals.
The low market value of pyrolysis products results in low selling prices, which yields low returns; this could
render waste tyre pyrolysis commercially unattractive (Wojtowicz and Serio, 1996; Amari et al., 1999). As
such, a process that focuses on recovery of high market value (value-added) products would greatly
improve the economic attractiveness of waste tyre pyrolysis (Wojtowicz and Serio, 1996). One interesting
valuable chemical of the ones contained in TDO is limonene, and it is the chemical that this study will
focus on. The current demand for limonene is mostly catered for by citrus-derived limonene, and the price
of citrus-derived limonene can range between 8 and 25 US$ per kilogram depending on product purity
(Florida Chemicals Co., 1991a,b,c; Pakdel et al., 2001; Stanciulescu and Ikura, 2007; Danon et al., 2015). It
can therefore be expected that targeting the recovery of limonene would improve the economic
attractiveness of waste tyre pyrolysis given the potential high selling price of limonene.
Limonene is a monoterpene that is a dimer of two isoprene molecules, and can be obtained from the
thermal decomposition of the polyisoprene contained in the tyre according to the reaction scheme
represented in Figure 1.
Random scission of β bond (with respect to
double bonds)
Polyisoprene Intramolecular cyclisation and scission
Allylic radicals Limonene
Figure 1: Reaction scheme of limonene formation from polyisoprene (from Chien and Kiang, 1979; Danon et
al., 2015)
Limonene is a major component of TDO with common yields of between 2.5 and 5 wt.% on the basis of a
steel-free tyre (Lopez et al., 2010; Danon et al., 2015). Limonene has wide industrial applications, and has
been used in the formulation of industrial solvents, terpene resins and adhesives, as a cleaning agent, as
a dispersing agent for pigment and in the manufacturing of flavouring agents, fragrances and pesticides
(Pakdel et al., 2001; Stanciulescu and Ikura, 2007; Williams, 2013; Danon et al., 2015).
This study, therefore, seeks to investigate the economic feasibility of using the pyrolysis technology for
upgrading low-value waste tyres to high-value chemicals such as limonene.
Stellenbosch University https://scholar.sun.ac.za

4
1.2. Aims and objectives
Different methods/processes that are currently used for dealing with the problem of waste tyres have
shown to be economically unfeasible due to different limitations and drawbacks associated with them
and the products they produce. One of the main drivers for recommendation of pyrolysis as a method for
dealing with the waste tyre problem is the fact that it produces chemicals that are of high market value
(Li et al., 2004; Lopez et al., 2010). It has also been shown that a process that focuses on the recovery of
valuable chemicals from waste tyres could greatly improve the economics of waste tyre pyrolysis
(Wojtowicz and Serio, 1996). Limonene has been shown to be a high value chemical product of waste tyre
pyrolysis with a wide range of industrial applications. Literature studies that have been done on the
economics of waste tyres have not focused on the analysis of converting waste tyres into valuable
chemicals by pyrolysis. As such, there exists a gap in literature which indicates the economic feasibility of
recovering valuable chemicals from waste tyre pyrolysis.
Therefore, this study aims to evaluate the economic viability of different pyrolysis and separation process
scenarios that can be used for recovering valuable chemicals from waste tyres.
In order to achieve the aim of this study, four main objectives are defined as follows:
• Objective 1: Investigate current technologies available to convert waste tyres into various
valuable chemicals.
• Objective 2: Propose and develop various conceptual process scenarios for converting waste tyres
into targeted valuable chemicals.
• Objective 3: Develop Aspen Plus® models/simulations for the scenarios of objective 2.
• Objective 4: Evaluate the different scenarios from techno-economic and energy utilisation
viewpoints.
1.3. Scope of study and thesis layout
The scope of this study is graphically outlined in Figure 2. This thesis is subdivided into six chapters
(including this one) that are set out to achieve the objectives as listed in section 1.2.
Chapter 2 provides details on the methodology that was used to achieve the objectives of this study.
Firstly, a brief review of the methodologies commonly used to address process conceptualisation tasks in
Stellenbosch University https://scholar.sun.ac.za

5
literature is provided. Thereafter, focus is then placed on selecting and/or developing a methodology that
is specific to this study. Details of the activities performed in each methodology step are presented.
Chapter 3 offers a review of the available literature that has been published with respect to the waste
tyre problem. Objective 1 of the study is addressed in this chapter. A general overview of the waste tyre
problem and the different methods/processes used to deal with the waste tyres is presented. Pyrolysis of
waste tyres as a possible solution to the waste tyre problem is discussed and the valuable chemicals that
can be obtained from waste tyre pyrolysis are highlighted. Economics of waste tyre pyrolysis are also
discussed. Thereafter, the focus is shifted to the review of modelling/simulation work that has been done
for pyrolysis systems in general and in relation to waste tyres. Typical pyrolysis process flow diagrams are
also reviewed and a block flow diagram proposed for this study is presented.
Chapter 4 details the development of a proposed base case process scenario for converting waste tyres
into a valuable chemical (limonene) through pyrolysis technology. Focus is placed on detailing the
development of different sections of the proposed process i.e. pre-treatment, pyrolysis, separation and
energy recovery sections. Development of each section of the proposed process is detailed from a
technical evaluation and Aspen Plus® modelling/simulation point of view. A complete (combined) process
flow diagram of the proposed process is also provided. Objectives 2 and 3 of the study are addressed in
this chapter.
Chapter 5 focuses on evaluation of the proposed process developed in chapter 4 from an economic
viewpoint thereby addressing objective 4 of the study. An economic model is developed which serves as
a guideline for economic evaluation after which results of economic evaluation of the proposed process
are presented. Results of economic evaluation of other pre-treatment scenarios (with respect to pre-
treatment configuration of the process proposed in chapter 4), energy recovery scenario and the waste
tyres to TDO scenario are also presented. Comparison of economic results of the scenario developed in
chapter 4 with the other scenarios is performed, after which, sensitivity analysis of the best performing
scenario is performed.
Chapter 6 Provides a summary of the main findings of this study and gives recommendations for future
work.
Stellenbosch University https://scholar.sun.ac.za

6
Scope of Study
Literature review Process development
Waste tyres pyrolysis
Here the focus is on understanding waste tyre pyrolysis in terms of:
- Current methods of converting tyres into valuable chemicals- Operating conditions- Valuable products produced- Product specifications and applications of targeted valuable products- Product distribution- Process modelling requirements- Process economics- Typical process flow diagrams
Objective 1 is addressed in this sectionEconomic comparison
The base case scenario is compared with other pre-treatment scenarios, energy recovery scenario and the process scenario for converting waste tyres into TDO on the basis of economic feasibility and economic performance.
CHAPTER 3, CHAPTER 4
PFD development
Here the focus is on developing a PFD for a base case scenario for converting waste tyres into limonene by combining different process steps from literature.
Each process step independently developed and combined to produce a single process. Technical evaluation of each process steps was detailed.
Objective 2 is addressed in this section
Aspen Plus® simulation
Simulation models for the different process steps of the PFD were developed and evaluated. Optimisation of different unit operations was performed where necessary.
Objective 3 is addressed in this section
CHAPTER 4
Evaluation
Economic evaluation
Here the focus is on performing an economic evaluation to determine the economic feasibility of the process developed in chapter 4. The following items are considered for economic evaluation:
- capital cost estimation- operating costs estimation- revenue- profitability analysis- sensitivity analysis Objective 4 is addressed in this section
CHAPTER 5
Design basis
A design basis is generated based on information obtained from literature review.
Figure 2: Graphical representation of the scope of this study
Stellenbosch University https://scholar.sun.ac.za
Stellenbosch University https://scholar.sun.ac.za

7
CHAPTER 2: FRAMEWORK AND METHODOLOGY
Overview
In this chapter, the methodology that was used to accomplish the objectives of this study is outlined.
This chapter is subdivided into 3 sections. Section 2.1 gives a brief review of common literature
methodologies used to develop conceptual processes and the most common ways of evaluating
conceptual processes. In section 2.2, the methodology used in this study is outlined and the activities
carried out in each step of the methodology are provided. Section 2.3 gives a summary of the chapter.
2.1. Synthesis approach and process evaluation
Mapamba (2012) mentioned that according to John Curry (2010), when a problem and its objectives
are known, an engineering method can be applied for problem solving. There then exists three key
steps between the problem and the solution, which are: generation of possible solutions, testing the
solutions, and implementing the most viable solution. For problems that are of a process
conceptualisation nature, the three steps can be translated to: identification of candidate processes,
evaluation of the candidate processes and presentation of the most viable option. A conceptual design
can then be developed for each of the possible/candidate processes. In order to generate an
appropriate process configuration for each candidate process, many process flowsheets have to be
generated and evaluated during process synthesis to identify those exhibiting better performance
indicators (Sanchez and Cardona, 2012). As such, a systematic approach to problem-solving then
becomes vital in order to achieve the set objectives (Mapamba, 2012). For problems that involve
process simulation, a systematic approach becomes even more important in order to avoid the output
from the simulation being misleading or meaningless (Oden et al., 2006).
For design of conceptual processes, there exists a range of process synthesis approaches that have
been proposed which are classified into two main approaches i.e. mathematical/optimisation-based
approaches and knowledge-based/heuristic approaches (Alqahtani et al., 2007; Sanchez and Cardona,
2012).
Optimisation-based approaches involve the formulation of flowsheet synthesis in the form of an
optimisation problem and requires explicit representation of a superstructure of process flowsheets
from which the optimal solution is selected (Li and Kraslawski, 2004). According to Grossmann et al.
(2000), there are three main classes of optimisation-based models i.e. aggregated models, short-cut
models and rigorous models. Two common features that characterise optimisation-based approaches
are formal and mathematical representation of the problem and the subsequent use of optimisation
Stellenbosch University https://scholar.sun.ac.za

8
(Li and Kraslawski, 2004). The main advantage of optimisation-based approaches is the provision of a
systematic framework for handling a variety of process synthesis problems, and more rigorous analysis
of features such as structure interactions and capital costs (Li and Kraslawski, 2004). The main
drawbacks associated with optimisation-based approaches are the lack of ability to automatically
generate a flowsheet superstructure, the need for huge computational effort and guarantee of
solution optimality only with respect to alternatives that have been considered a priori (Grossmann
et al., 2000; Li and Kraslawski, 2004).
Knowledge-based (heuristic) approaches have their bases on long-term engineering and research
experience and they combine heuristics with an evolutionary strategy for process design (Li and
Kraslawski, 2004; Sanchez and Cardona, 2012). The main feature of knowledge-based approaches is
the decomposition of the synthesis task into various decision levels for which solutions are separately
generated and then combined into a single flowsheet (Grossmann et al., 2000; Li and Kraslawski,
2004). The main advantages of knowledge-based approaches are generation of various alternatives
that can be economically evaluated using short-cut methods and screening of alternatives which
avoids detailed evaluation of each alternative (Grossmann et al., 2000; Sanchez and Cardona, 2012).
The main disadvantages of knowledge-based approaches include the inability to rigorously produce
optimal designs (despite various alternatives generated) and the improper management of
interactions between different decision levels (Grossmann et al., 2000; Li and Kraslawski, 2004;
Sanchez and Cardona, 2012).
Ever since Siirola and Rudd (1971) first made an attempt to develop a systematic heuristic approach
for synthesis of a separation sequence for a multicomponent process, several
methodologies/approaches have been developed targeting a range of chemical processes (Li and
Kraslawski, 2004). Examples include those approaches proposed/developed by Douglas (1988),
Jaksland et al. (1995), Smith (1995), Seider et al. (2004), Alqahtani et al. (2007) and Turton et al. (2009).
Of these knowledge-based approaches, the commonly used approach methods are those of Douglas
(1988) and Smith (1995).
The Douglas method is a hierarchical method which breaks down a large complex problem into smaller
easier to handle steps (Kusiak and Finke, 1987; Douglas, 1988; Emets et al., 2006). The Douglas method
starts by determining the mode of operation and then progresses through various design “hierarchy”
levels of the particular mode of operation (Douglas, 1988; Emets et al., 2006).
The method developed by Smith (1995) involves creation of an irreducible structure. The irreducible
structure approach creates a structure in its basic form and is based on the “onion” model with each
Stellenbosch University https://scholar.sun.ac.za
9
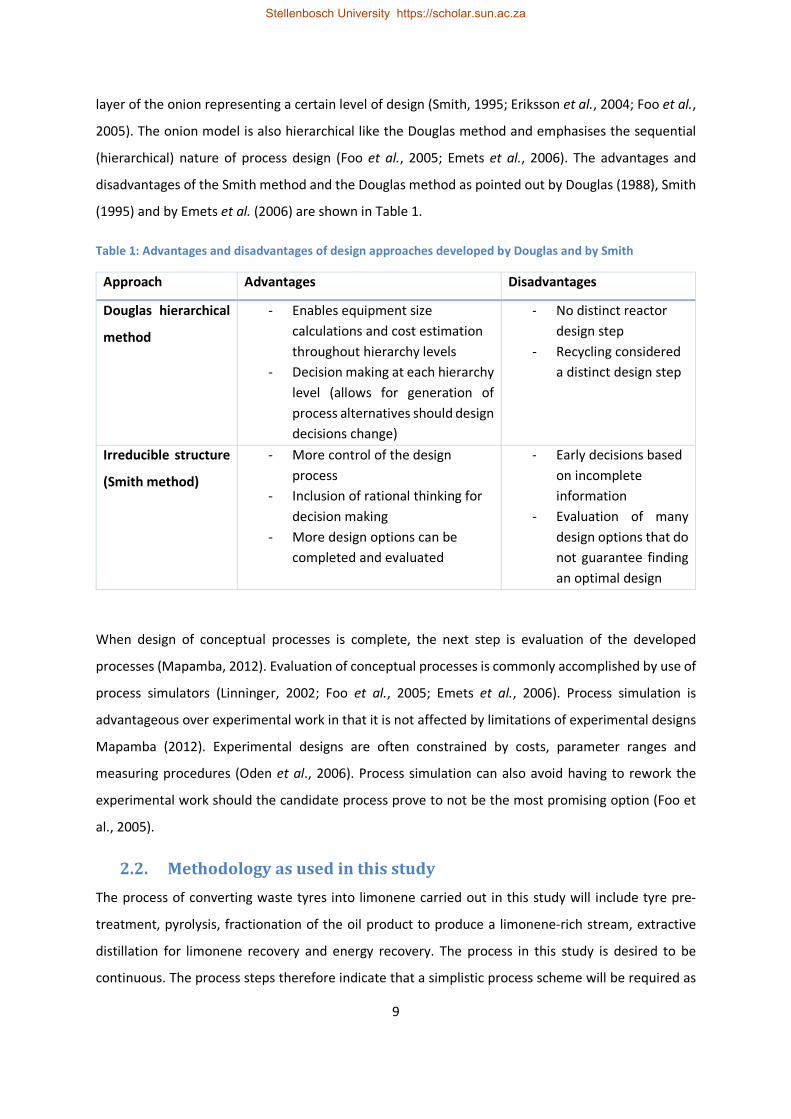
layer of the onion representing a certain level of design (Smith, 1995; Eriksson et al., 2004; Foo et al.,
2005). The onion model is also hierarchical like the Douglas method and emphasises the sequential
(hierarchical) nature of process design (Foo et al., 2005; Emets et al., 2006). The advantages and
disadvantages of the Smith method and the Douglas method as pointed out by Douglas (1988), Smith
(1995) and by Emets et al. (2006) are shown in Table 1.
Table 1: Advantages and disadvantages of design approaches developed by Douglas and by Smith
Approach Advantages Disadvantages
Douglas hierarchical
method
- Enables equipment size
calculations and cost estimation
throughout hierarchy levels
- Decision making at each hierarchy
level (allows for generation of
process alternatives should design
decisions change)
- No distinct reactor
design step
- Recycling considered
a distinct design step
Irreducible structure
(Smith method)
- More control of the design
process
- Inclusion of rational thinking for
decision making
- More design options can be
completed and evaluated
- Early decisions based
on incomplete
information
- Evaluation of many
design options that do
not guarantee finding
an optimal design
When design of conceptual processes is complete, the next step is evaluation of the developed
processes (Mapamba, 2012). Evaluation of conceptual processes is commonly accomplished by use of
process simulators (Linninger, 2002; Foo et al., 2005; Emets et al., 2006). Process simulation is
advantageous over experimental work in that it is not affected by limitations of experimental designs
Mapamba (2012). Experimental designs are often constrained by costs, parameter ranges and
measuring procedures (Oden et al., 2006). Process simulation can also avoid having to rework the
experimental work should the candidate process prove to not be the most promising option (Foo et
al., 2005).
2.2. Methodology as used in this study
The process of converting waste tyres into limonene carried out in this study will include tyre pre-
treatment, pyrolysis, fractionation of the oil product to produce a limonene-rich stream, extractive
distillation for limonene recovery and energy recovery. The process in this study is desired to be
continuous. The process steps therefore indicate that a simplistic process scheme will be required as
Stellenbosch University https://scholar.sun.ac.za

10
opposed to large complex systems including many process steps required to produce, recover, and
purify a wide range of products. In addition to process design, economic feasibility and energy
utilisation evaluations will be performed in the current study.
As such, a hierarchical stepwise approach with mostly modified Douglas approach logic is chosen as
the methodology to achieve the objectives set out for this study. The need for rational decision making
at each level of design and the sequential nature of progression are the main contributing factors to
the choice of methodology in this study. Each (major) step in the task of addressing the objectives of
this study can then just be represented as a hierarchical level with the hierarchy extended beyond the
design phase. The adapted hierarchical and stepwise methodology used in this study is shown in Figure
3. Iterative loops are incorporated in the methodology to account for the iterative nature of using
knowledge-based approaches in process design.
Step 1
Literature review
Step 2
Design basis and input-output structure
Step 3
Design of pre-treatment system
Step 4
Design of pyrolysis system
Step 6
Design of energy recovery system
Step 5
Design of separation system
Step 7
Economic evaluation
Iterative loop
Iterative loop
Iterative loop
Iterative loop
Iterative loop
Iterative loop
Figure 3: Methodology adopted for use in this study
Stellenbosch University https://scholar.sun.ac.za

11
Details of the activities carried out in each step of the hierarchical sequence shown in Figure 3 are
provided in Table 2.
Table 2: Details of methodology steps used in this study
Activity Sectioned applied Objectives addressed
Step 1: Literature review
(a) Current methods of valorising waste tyres 3.1.3 1
(b) Input information 3.2.2 2 and 3
(c) Valuable chemicals from tyre pyrolysis 3.3.3 1
(d) Pyrolysis operating conditions 3.3.4 2
(e) Product distribution 3.3.4 2
(f) Tyre pyrolysis process modelling 3.4.1 3
(g) Typical tyre pyrolysis process flow diagram 3.5 1 and 2
Step 2: Design basis and input-output information
(a) Design basis 4.1 2 and 3
a.1. Raw materials and production capacity
a.2. Mode of operation
a.3. Product target specification
a.4. Selection of simulation software
(b) Input-output structure 4.2 2 and 3
b.1. Component selection 4.2 2
b.2. Component specification in Aspen Plus® 4.2.1 3
Step 3: Design of pre-treatment system
(a) Size reduction requirements and PFD 4.3 2
Step 4: Design of pyrolysis system
(a) Objective and PFD of the system 4.4 2 and 3
(b) Reactor operating conditions 4.4.1 2 and 3
(c) Reactor product distribution 4.4.2 2 and 3
c.1. Reactor mass balance 4.4.2
c.2. Yield prediction by correlation equations 4.4.2.1
Stellenbosch University https://scholar.sun.ac.za

12
Table 2 continued: Details of methodology steps used in this study
Activity Sectioned applied Objectives addressed
Step 4: Design of pyrolysis system
(d) Validation 4.4.3 3
(e) Aspen Plus® simulation 4.4.4 3
e.1. Selection of thermodynamic model 4.4.4.1
e.2. Flowsheet description 4.4.4.2
Step 5: Design of separation system
(a) Objective and PFD of the system 4.5 2
(b) Oil feed temperature determination 4.5.1 2 and 3
(c) Aspen Plus® simulation 4.5.2 3
c.1. Selection of thermodynamic model 4.5.2.1
c.2. Flowsheet description 4.5.2.2
c.3. Column optimisation
Step 6: Design of energy recovery system
(a) Objective and PFD of the system 4.6 2
(b) Steam generation 4.6 2 and 4
(c) Aspen Plus® simulation 4.6.1 3 and 4
Step 7: Economic evaluation
(a) Economic model 5.1 4
a.2. Economic assumptions 5.1.1
a.1. Key economic indicators 5.1.2
(b) Capital costs estimation 5.2
b.1. Aspen Plus® Economic analyser
b.2. Supplier quotation
b.3. bare module costing
b.4. Scale up (sixth-tenths-factor)
Stellenbosch University https://scholar.sun.ac.za

13
Table 2 continued: Details of methodology steps used in this study
Activity Sectioned applied Objectives addressed
Step 7: Economic evaluation
(c) Operating costs 5.3 4
c.1. Variable costs 5.3.1
c.2. Fixed costs 5.3.2
(d) Revenue 5.4
(e) Profitability analysis (DCFROR) 5.5
(f) Scenario analysis and comparison 5.6
Base case, energy recovery, other pre-treatment
scenarios, TDO production scenario
(g) Sensitivity analysis 5.7
TCI, limonene price, limonene yield, OPEX, TDO
price, interest rate, exchange rate
2.3. Summary
Chapter 2 discussed development of the methodology that was used to achieve the objectives of this
study. The methodologies developed by Douglas and by Smith were found to be the most common
approaches for design of conceptual processes. Evaluation of conceptual processes is typically
achieved by use of processes simulators.
A hierarchical and stepwise methodology with mostly modified Douglas approach logic was developed
to achieve the objectives of this study. Literature review forms the basis of conceptual process design
in this study, after which, evaluation of the designed conceptual process is achieved by a process
simulator. A review of literature with regards to the waste tyre problem, current alternative methods
of dealing with waste tyre problem, waste tyre pyrolysis, process modelling of waste tyre valorisation
systems and typical process flow diagrams is presented in chapter 3.
Stellenbosch University https://scholar.sun.ac.za

14
Stellenbosch University https://scholar.sun.ac.za

15
CHAPTER 3: LITERATURE REVIEW
Overview
In this chapter, a literature review of upgrading waste tyres to valuable chemicals via pyrolysis will be
presented. This chapter aims to address objective 1 of this study (investigation of current technologies
available to convert waste tyres into various valuable chemicals). The chapter is subdivided into 6
sections. Section 3.1 discusses the problems that waste tyres pose and the methods that have been
used to tackle the problem. Section 3.2 discusses the components that tyres are made of. In section
3.3, pyrolysis of waste tyres is discussed with respect to operating conditions, valuable chemicals
produced and the product distribution. A review of current economics of waste tyre pyrolysis is also
provided. Section 3.4 discusses the modelling/simulation work that has been done in literature for
waste tyre pyrolysis systems. A review of literature on Aspen Plus® modelling/simulation of waste tyre
valorisation processes is also provided in section 3.4 and linked to the current study. Section 3.5 gives
an overview of typical process flow diagrams of waste tyre pyrolysis processes after which a proposed
process for the current study is presented. Section 3.6 gives a summary of the chapter.
3.1. Waste tyre problem
3.1.1. Waste tyre generation
Approximately 1.5 billion new tyres are sold each year worldwide and just as many are categorised as
having reached their end-of-life (Williams, 2013). Hita et al. (2016) reported that European regulations
define end-of-life tyres as those that should either be recycled, valorised or have their usefulness
extended (if the intention is to use them again) owing to their physical state and security regulations.
The increase in population coupled with economic growth of many nations promote the growth of the
automotive industry which in turn increases the number of tyres and subsequently the number of
waste tyres discarded annually (Raj et al., 2013). In 2010, 289 million waste tyres were generated in
the European Union (EU); 500 million waste tyres were generated in 2007 by the United States of
America (USA) and 52.5 million waste tyres were generated in Australia in the years 2007-2008 (Quek
and Balasubramanian, 2013; Danon et al., 2015). From a South African context, it is estimated that
there are 60 million waste tyres disposed of across the country with approximately 11 million waste
tyres added each year (REDISA, 2012; Pilusa et al., 2014).
3.1.2. Disposal of waste tyres
Most of the waste tyres generated end up being dumped in stockpiles and landfills (some illegally); it
is estimated that in the developed world 1 car tyre per person is discarded each year (Martinez et al.,
Stellenbosch University https://scholar.sun.ac.za

16
2013). It is also estimated that 4 billion waste tyres are currently in landfills and stockpiles worldwide
(Martinez et al., 2013).
Tyres are designed to withstand harsh mechanical and weather conditions (such as ozone, light and
bacteria) and their complex nature makes them difficult to recycle and/or process further (Adhikari et
al., 2000; Leung and Wang, 2003; Raj et al., 2013). Due to their design, waste tyres resist degradation
(non-biodegradable) when in landfills and their bulky nature makes them take up a lot of landfilling
space (Quek and Balasubramanian, 2013; Pilusa et al., 2014). Waste tyres dumps present a serious
threat to both the environment and human health as they promote the growth of pests and disease
carrying insects. Waste tyres also pose a high risk of fires that can be difficult to extinguish and could
have environmental impacts due to uncontrolled emissions of potentially harmful compounds into the
atmosphere, soil and groundwater (Islam et al., 2011). Tyre fires produce toxic gases which contain
carcinogenic and mutagenic chemicals, this makes the waste tyre dumps highly undesirable (Quek and
Balasubramanian, 2013). Landfilling and stockpiling are thus currently the easiest forms of dealing
with waste tyres. However, landfilling and stockpiling fail to utilise the material, energy and chemical
potential in waste tyres.
3.1.3. Current methods for treating waste tyres and their challenges
Various processes or methods have been used as alternative pathways for dealing with the problem
of waste tyre generation. These pathways are: direct disposal, material recovery and recycling and
thermal treatment with energy recovery. Direct disposal includes landfilling and stockpiling. Material
recovery and recycling includes processes such as crumbing, milling/grinding, re-treading,
devulcanisation, and civil engineering applications (Adhikari et al., 2000; Sharma et al., 2000; Islam et
al., 2011; Pilusa et al., 2014). Thermal treatment with energy recovery includes incineration,
gasification and pyrolysis (Adhikari et al., 2000; Sharma et al., 2000).
Table 3 shows some of the ways which have been used to deal with waste tyres in several countries.
Most of the pathways in Table 3 (except landfilling and stockpiling) are aimed at reducing the amount
of waste tyres discarded by converting them into re-usable products or energy.
Table 3: Several methods used for treating waste tyres in different countries (Adhikari et al., 2000)
Country Re-treading (%) Recycling (%) Energy (%) Landfilling (%) Export (%)
France (1996) 20 16 15 45 4
Germany (1996) 17.5 11.5 46.5 4 16
Italy (1996) 22 12 23 40 2
Stellenbosch University https://scholar.sun.ac.za

17
Table 3 continued: Several methods used for treating waste tyres in different countries (Adhikari et al., 2000)
Country Re-treading (%) Recycling (%) Energy (%) Landfilling (%) Export (%)
UK (1996) 31 16 27 23 2.5
Belgium (1996) 20 10 30 5 25
Netherlands
(1996)
60 12 28 0 N/A
Sweden (1996) 5 12.5 64 5 7
USA (1994) - 28 72 - -
The direct disposal pathways (landfilling and stockpiling) were discussed in section 3.1.2. In this
section, material recovery and recycling and thermal treatment with energy recovery will be briefly
discussed. The discussions will highlight the products from each pathway and their common end uses.
The drawbacks/limitations associated with the processes in each pathway are highlighted as these
bring about the necessity to explore the possibility of using waste tyre pyrolysis for recovery of
valuable chemicals. Materials recovery and recycling will be discussed first followed by thermal
treatment with energy recovery. The pyrolysis process of thermal treatment will be discussed in detail
in section 3.3.
3.1.3.1. Materials recovery and recycling
End-of-life tyres are a potential source of raw materials and as such, several processes have been used
for material recovery and recycling from waste tyres. The processes involved in material recovery and
recycling ensure conversion of waste tyres into materials that can be used to produce new goods or
used for utilitarian purposes (Sienkiewicz et al., 2012; Dabic-Ostojic et al., 2014). In these processes,
the waste tyres can undergo size reduction to give products that are similar to the original rubber
materials or the tyres can be used as whole (Adhikari et al., 2000; Sharma et al., 2000). Material
recovery and recycle processes take advantage of the fact that used tyres are relatively similar to new
tyres in composition with slightly less rubber (Sharma et al., 2000; Lebreton and Tuma, 2006). The
different processes of material recovery and recycling are briefly discussed below.
Crumbing, milling/grinding
The processes of crumbing and milling/grinding are achieved by mechanical means where rotary
blades are used to reduce the size of the tyres, and also help to separate the rubber from other parts
of the tyre (Sharma et al., 2000). Tyre crumb rubber (of different sizes) and ground tyre rubber are
Stellenbosch University https://scholar.sun.ac.za

18
produced from these processes based on intended final use (Adhikari et al., 2000; Sharma et al., 2000;
Scrap Tire News, 2016). Crumbing is the most common method of waste tyre recycling in South Africa
(Nkosi et al., 2013).
Crumb rubber is mainly used in applications such as tyre manufacturing, creation of sports surfaces
and a range of civil engineering applications where it has been used as a mixing ingredient with asphalt
for highway construction (Amari et al., 1999; Pilusa et al., 2014; Jacob et al., 2014). Ground rubber is
mainly used for applications such as filler material in the production of tread and sidewall of new tyres,
production of flooring materials, surfacing of recreational facilities, as an additive for asphalt
pavement etc. (Amari et al., 1999; Quek and Balasubramanian, 2013; Muzenda and Popa, 2015).
The main drawbacks associated with these size reduction processes is the energy intensity of the
processes, the high operational costs and the limited market for the products produced (Sharma et
al., 2000; Lebreton and Tuma, 2006).
Re-treading
Re-treading is a process in which the old worn out rubber of the tread section of the tyre is replaced
with a new tread section, which regenerates the tyre (Bender, 2007; Zebala et al., 2007). Re-treading
is the most resource efficient method of used tyre recovery as the old tyre carcass is not thrown away
but only a new tread fused to the old carcass by vulcanisation provided the carcass is not damaged
(Amari et al., 1999; Sharma et al., 2000; Jacob et al., 2014). The resource efficiency of re-treading can
be seen in the fact that re-treading only consumes about 30% of the energy and 25% of the material
needed to produce a new tyre (Lebreton and Tuma, 2006; Sienkiewicz et al., 2012; Dabic-Ostojic et
al., 2014).
The use of re-treaded tyres is mainly limited to trucks, buses, airplanes and other heavy vehicles
(Sienkiewicz et al., 2012; Dabic-Ostojic et al., 2014). The limitation in use of re-treaded tyres is due to
the fact that large re-treaded tyres have a higher quality to price ratio than new tyres of the same
class. For passenger car tyres, the quality to price ratio of re-treaded tyres makes them uncompetitive
when compared with new tyres as they have been shown to be of lower quality, reliability and safety
at high speeds (Sharma et al., 2000; Zebala et al., 2007; Sienkiewicz et al., 2012). Re-treaded products
are also faced with a stagnant demand (Xiao et al., 2008). The overall combined effect of the
drawbacks discussed above is a low selling price for the associated products.
Stellenbosch University https://scholar.sun.ac.za

19
Devulcanisation
Devulcanisation is a method used to recycle waste tyres by converting the thermoset rubber of tyres
into a softer plastic like thermoplastic rubber similar in most properties to virgin rubber. The
devulcanised rubber can then be vulcanised again if used in manufacturing of other tyres or it can be
mixed with other thermoplastics to produce tougher products (Adhikari et al., 2000; Garcia et
al., 2015).
Devulcanisation processes are primarily divided into physical and chemical devulcanisation. Physical
devulcanisation employs the use of external energy (thermal and mechanical) where the tyre is
crumbed or ground and then converted into devulcanised products. In other instances, liquid nitrogen
is required to obtain a fine rubber powder (Adhikari et al., 2000; Seghar et al., 2015). Physical
devulcanisation is faced with a drawback of high energy demand as the tyre has to be reduced in size
(crumb and ground rubber), and the thermal energy needed to achieve the devulcanisation process is
provided externally. The liquid nitrogen required to obtain a fine rubber powder could also add to
operational costs (Adhikari et al., 2000).
Chemical devulcanisation agents (mainly organic disulphides or mercaptans) are required for chemical
devulcanisation and this poses an economic drawback with the associated costs of the chemicals
involved (Adhikari et al., 2000). Another major drawback could be the limitation in the amount of
vulcanised rubber that can be mixed with fresh rubber due to quality concerns of the final product
e.g. tensile strength, resilience, tear resistance etc. (Adhikari et al., 2000; Garcia et al., 2015; Edwards
et al., 2016).
Civil engineering applications
Waste tyres can be utilised in civil engineering applications in a reduced size form (as discussed for
crumb and ground products) or as whole. Civil engineering applications include the use of tyres in road
and rail foundations, creation of motorway crash barriers, embankments bunds, marine docks etc.
(Barlaz et al., 1993; Amari et al., 1999; Islam et al., 2011; Pilusa et al., 2014).
3.1.3.2. Thermal treatment with energy recovery
Waste tyres present a possible energy stream by recovering the energy contained in tyres. Tyres have
calorific values of around 31 000 kJ/kg, which makes them an attractive source of energy generation
(Adhikari et al., 2000; Pipilikaki et al., 2005; Lebreton and Tuma, 2006). Technologies that are usually
used to recover energy from waste tyres include incineration, pyrolysis and gasification (Sharma et al.,
2000; Jacob et al., 2014). Thermal treatment has the ability to fully destroy the waste tyres, nett
Stellenbosch University https://scholar.sun.ac.za

20
energy production and the possible reduction of some harmful organic compounds (Amari et al., 1999;
Sharma et al., 2000). As mentioned before, in this section, only incineration and gasification will be
discussed. Waste tyre pyrolysis is extensively discussed in section 3.3.
Incineration
Incineration of waste tyres involves combustion of the tyres at high temperatures to convert the
combustible matter into energy and inert residue (Sharma et al., 2000; Jacob et al., 2014). Waste tyres
have been incinerated for energy generation in various applications such as cement kilns, pulp and
paper mills, power plants, industrial boilers etc. (Amari et al., 1999; Lebreton and Tuma 2006; Pilusa
et al., 2014). Figure 4 shows the market distribution of TDF (use of tyres as a direct energy source) in
USA for the year 1996, as reported by Amari et al. (1999).
Figure 4: Market distribution of tyre derived fuel in the USA, 1996 (re-drawn from Amari et al., 1999)
The major route for waste tyre incineration has been in use as supplementary fuel in cement kilns
(Conesa et al., 2008; Martinez et al., 2013; Jacob et al., 2014). In South Africa, tyres are not yet really
used for energy in cement kilns, and only about 6% are recycled (Mahlangu, 2009). The cement
manufacturing company Pretoria Portland Cement Limited (PPC Ltd) has an agreement with REDISA
to source waste tyres as supplementary fuel for their plant in De Hoek in the Western Cape (PPC Ltd,
2014).
Tyres are a favourable alternative fuel in cement kilns as they have a high energy content compared
to some coals. Coal heating values range between 26 000 and 31 000 kJ/kg whereas the heating value
30%
23%
19%
13%
1%4%
10%
Cement kilns
Pulp and paper mills
Utility boilers
Industrial boilers
Lime kilns
Waste to energy plants
Dedicated tyre to energy plants
Stellenbosch University https://scholar.sun.ac.za

21
of tyres is about 31 000 kJ/kg (Barlaz et al., 1993). Higher temperatures and longer residence times in
cement kilns favour the transformation of the tyres, even the combustion of carbon black (Barlaz et
al., 1993; Olazar et al., 2008). The residue of the steel contents of the tyres serves as an iron source,
which is required for cement production (Pipilikaki et al., 2005, Lebreton and Tuma, 2006).
The major drawback in using tyres as supplemental fuel is the limitation on the percentage of fuel that
can be replaced, due to concerns around cement product quality, emissions, and damage to
equipment (Sharma et al., 2000; Pipilikaki et al., 2005; Olazar et al., 2008). The limitation in the amount
of tyres that can be used presents an opportunity for utilising the available waste tyres for conversion
into high value chemicals.
Gasification
In waste tyre gasification, the tyres are converted to a primarily gaseous product at high temperatures
of around 700 °C – 800 °C using reactive agents such as air, steam or oxygen (Raman et al., 1981; Leung
and Wang, 2003). Temperatures of as low as 350 °C have been employed at lab scale to study the
effects of temperature (Leung and Wang et al., 2003; Xiao et al., 2008). The main product of
gasification is syngas even though a carbon black product is also produced (Xiao et al., 2008). The
syngas produced is an intermediate product that can be used for energy by combustion or in gas
turbines and as a raw material for fuels and chemicals production (Raman et al., 1981).
3.1.3.3. Conclusions on current methods evaluated
From the discussions of section 3.1.3, it can be seen that the current methods used for dealing with
the waste tyre problem have not adequately dealt with the problem due to low product quality, low
market demands for products and subsequent low selling prices for the products. None of the
processes discussed have shown to be a pathway for converting the waste tyres into high value
products. This, therefore, presents an opportunity to utilise the waste tyres available for conversion
into high value chemicals. This study seeks to address the feasibility of this opportunity.
3.2. Tyre composition
3.2.1. Constituents of a tyre
Tyres contain vulcanised rubber (60-65 wt.%), carbon black (CB) (25-35 wt.%) and the remainder
comprises of accelerators, fillers, reinforcing textile cords, fabric belts, steel wire reinforcing beads
etc. that are added during the manufacturing process (Kyari et al., 2005; Martinez et al., 2013). These
components have varying properties and composition and are individually added to achieve a final
tyre product. Each component will give a specific property to the tyre or to the tyre manufacturing
Stellenbosch University https://scholar.sun.ac.za

22
process (Hita et al., 2016). Table 4 shows different elements of the final tyre product and Figure 5
shows the different components that make up a tyre.
Table 4: Typical elements of a tyre and their constituent materials (from Hita et al., 2016)
Element Composition
Liner Inner coating of synthetic rubber
Plies Layers of rubber, nylon and metal reinforced
rubber piled together
Bead heel Ringed steel wires surrounded by hard rubber
Sidewall Natural and synthetic rubber mixed with small
amounts of carbon black and additives
Tread Natural and synthetic rubber
Figure 5: Various components that make up a tyre (Courtesy of CARiD™)
Different natural and synthetic rubber formulations are used for the production of passenger and
truck tyres; the tyres are mainly a blend of both rubbers (Kyari et al., 2005; Martinez et al., 2013). The
rubbers used in tyre manufacturing are thermoset polymers (Leung and Wang, 2003). The most
commonly used of the synthetic rubbers is styrene-butadiene copolymer (SBR) with a styrene content
of about 25 wt.%. Other rubbers used in tyre manufacturing are natural rubber (NR) (polyisoprene),
polybutadiene rubber (PBD), nitrile rubber (NTR) and chloroprene rubber (CPR) (Mastral et al., 2000).
The different rubbers used yield different compounds as degradation products. Isoprene and
dipentene (limonene) are the main degradation products of natural rubber whereas styrene, 4-
vinylcyclohexene, ethylbenzene and cumene are main degradation products of styrene-butadiene
Stellenbosch University https://scholar.sun.ac.za

23
rubber (Chen and Qian, 2002; Seidelt et al., 2006; Danon et al., 2015). It can then be concluded that
tyre formulations that have a high content of natural rubber are desirable for pyrolysis if limonene is
to be targeted as a compound of interest. Truck tyres (TT) generally contain more natural rubber
content than passenger car tyres (PCT) and the amount of each component added varies from region
to region as shown in Table 5.
Carbon black is an amorphous carbon of quasi-graphitic structure and is used in tyre manufacturing
to provide strength and aid abrasion resistance of the rubber in the tyre (Mastral et al., 2000; Kyari et
al., 2005; Martinez et al., 2013). It is primarily produced by partial combustion of fossil hydrocarbons
like petroleum residue (Martinez et al., 2013).
Table 5: Typical composition of passenger and truck tyres (adopted from Hita et al., 2016)
Material (wt.%) PCT TT
USA EU USA EU
Natural rubber 14 22 27 30
Synthetic rubber 27 23 14 15
Carbon black 28 28 28 20
Steel 14-15 13 14-15 25
Othersa 16-17 14 16-17 10
a Nylon, fillers, accelerators and sulphur amongst others
An extender oil (a mixture of aromatic hydrocarbons) is added to the tyre during manufacturing to
soften and improve workability of the rubber (Kyari et al., 2005). The amount of extender oils added
depends on the tyre formulation as shown in Table 6 and Table 7. The constituents (and composition)
shown in Table 6 and Table 7 represent just two particular formulations out of a variety of
formulations used in tyre manufacturing. It can then be concluded that the amount of extender oil in
tyre formulation will have an effect on the quantities of potentially valuable chemicals obtained from
pyrolysis as the oil decomposes during pyrolysis.
An accelerator (typically an organo-sulphur compound) is added as a catalyst for the vulcanisation
process. Typically, zinc oxide and stearic acid are also added as these compounds control the
vulcanisation process and enhance the physical properties of the rubber (Kyari et al., 2005). The
different additives can be a variety of compounds as shown in Table 6 and Table 7, however, they still
fulfil the same purpose.
Stellenbosch University https://scholar.sun.ac.za

24
Sulphur is added to the tyre to form cross-links between the rubber polymer chains thus also
hardening the rubber to prevent excessive deformation at elevated temperatures (Martinez et al.,
2013; Hita et al., 2016). The cross-linking of the elastomers gives the rubber materials their thermoset
characteristics; the sulphur content is normally up to 1.5 wt.% (Mastral et al., 2000;
Martinez et al., 2013).
Table 6: Constituents of a particular tyre formulation (from Kar, 2011)
Component Composition (wt.%)
SBR 43.5
Carbon black 32.6
Extender oil 21.7
ZnO and sulphur 2.2
Table 7: Constituents of a specific tyre formulation (from Lopez et al., 2010)
Component Composition (wt.%)
Natural rubber (SMR 5CV) 29.59
Styrene-butadiene rubber (SBR 1507) 29.59
Carbon black (ISAF N220) 29.59
Stearic acid 0.59
IPPD (n-isopropyl-n’-phenyl-p-phenylendiamine) 0.89
Zinc oxide 2.96
Phenolic resin 2.37
Sulphur 0.89
CBS (n-cyclohexyl-2-benzothiazol-
sulphenamide)
0.89
H-7 (hexamethylentetramine) 0.18
PVI (n-cyclohexylthiol-phthalimide) 0.12
Aromatic oil 2.37
3.2.2. Characterisation of a tyre
In literature, tyres are normally characterised using the proximate and ultimate (elemental) analyses.
Depending on the intention of the specific literature, calorific values of the tyre can also be included.
Stellenbosch University https://scholar.sun.ac.za

25
Table 8 and Table 9 show the proximate and ultimate analyses of some tyres in literature. It can be
seen that the characterisation will depend on the type of tyre material evaluated. The variation in the
different components is also a result of different tyre formulation from various tyre brands. A tyre
with a high volatile matter content is desirable for pyrolysis processes aiming to recover valuable
chemicals from waste tyres, as is explained in section 3.3. For this study, the importance of tyre
characterisation is for tyre definition purposes in Aspen Plus® simulation as will be explained in section
3.4 and chapter 4.
Table 8: Typical proximate analysis of a waste tyre
Component (wt.%) Literature source
Cunliffe and
Williams (1998b)
Rodriguez et al.
(2001)
Conesa et al.
(2004)
Choi et al. (2014)a
Moisture 1.3 0.9
Volatile matter 62.2 58.8 65.5 73.9
Fixed carbon 29.4 27.7 29.4 21.8
Ash 7.1 3.9 3.7 4.3
Steel 9.6
Calorific value
(MJ/kg)
40 31.8
aDry basis
Table 9: Typical ultimate analysis of a waste tyre
Element (wt.%) Literature source
Cunliffe and
Williams (1998b)
Rodriguez et al.
(2001)
Conesa et al.
(2004)
Choi et al. (2014)b
C 86.4 74.2 89.4 89.2
H 8 5.8 7 7.7
N 0.5 0.3 0.2 0.5
S 1.7 1.5 2 2.6
O 3.4 4.7
Ash 2.4 13.5a
aIncludes steel, bdry and ash free basis
Stellenbosch University https://scholar.sun.ac.za
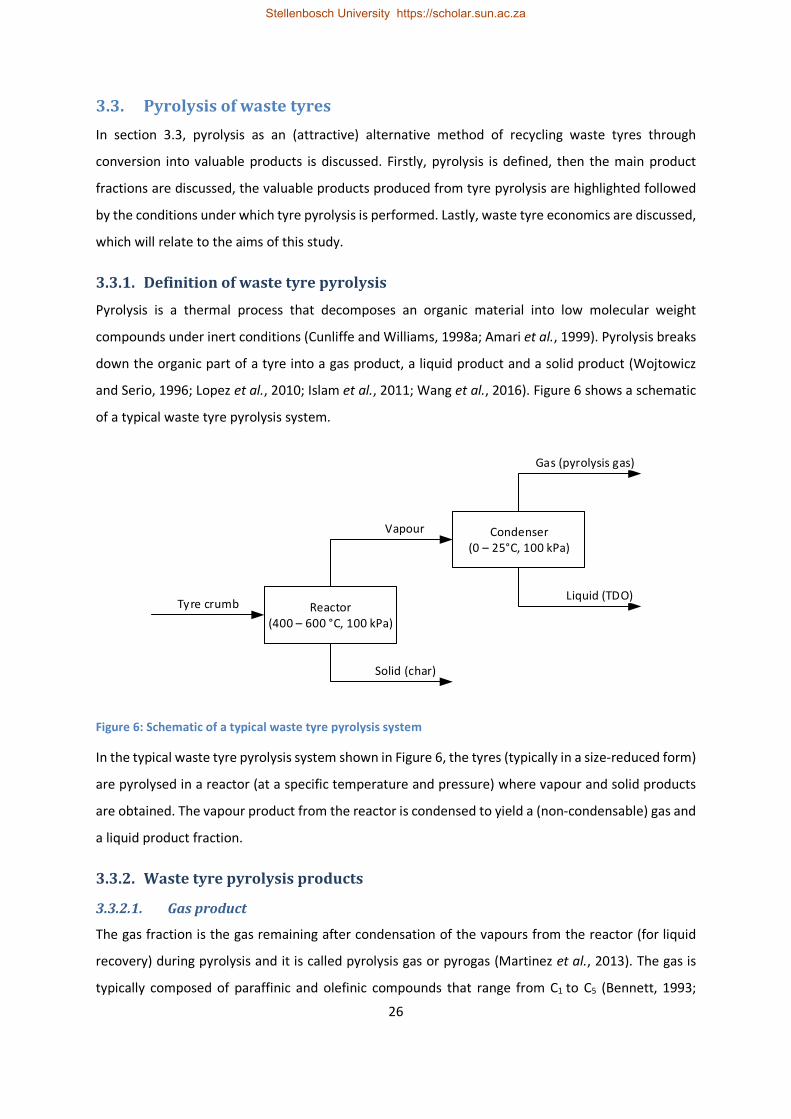
26
3.3. Pyrolysis of waste tyres
In section 3.3, pyrolysis as an (attractive) alternative method of recycling waste tyres through
conversion into valuable products is discussed. Firstly, pyrolysis is defined, then the main product
fractions are discussed, the valuable products produced from tyre pyrolysis are highlighted followed
by the conditions under which tyre pyrolysis is performed. Lastly, waste tyre economics are discussed,
which will relate to the aims of this study.
3.3.1. Definition of waste tyre pyrolysis
Pyrolysis is a thermal process that decomposes an organic material into low molecular weight
compounds under inert conditions (Cunliffe and Williams, 1998a; Amari et al., 1999). Pyrolysis breaks
down the organic part of a tyre into a gas product, a liquid product and a solid product (Wojtowicz
and Serio, 1996; Lopez et al., 2010; Islam et al., 2011; Wang et al., 2016). Figure 6 shows a schematic
of a typical waste tyre pyrolysis system.
Reactor(400 – 600 °C, 100 kPa)
Tyre crumb
Condenser(0 – 25°C, 100 kPa)
Solid (char)
Vapour
Liquid (TDO)
Gas (pyrolysis gas)
Figure 6: Schematic of a typical waste tyre pyrolysis system
In the typical waste tyre pyrolysis system shown in Figure 6, the tyres (typically in a size-reduced form)
are pyrolysed in a reactor (at a specific temperature and pressure) where vapour and solid products
are obtained. The vapour product from the reactor is condensed to yield a (non-condensable) gas and
a liquid product fraction.
3.3.2. Waste tyre pyrolysis products
3.3.2.1. Gas product
The gas fraction is the gas remaining after condensation of the vapours from the reactor (for liquid
recovery) during pyrolysis and it is called pyrolysis gas or pyrogas (Martinez et al., 2013). The gas is
typically composed of paraffinic and olefinic compounds that range from C1 to C5 (Bennett, 1993;
Stellenbosch University https://scholar.sun.ac.za
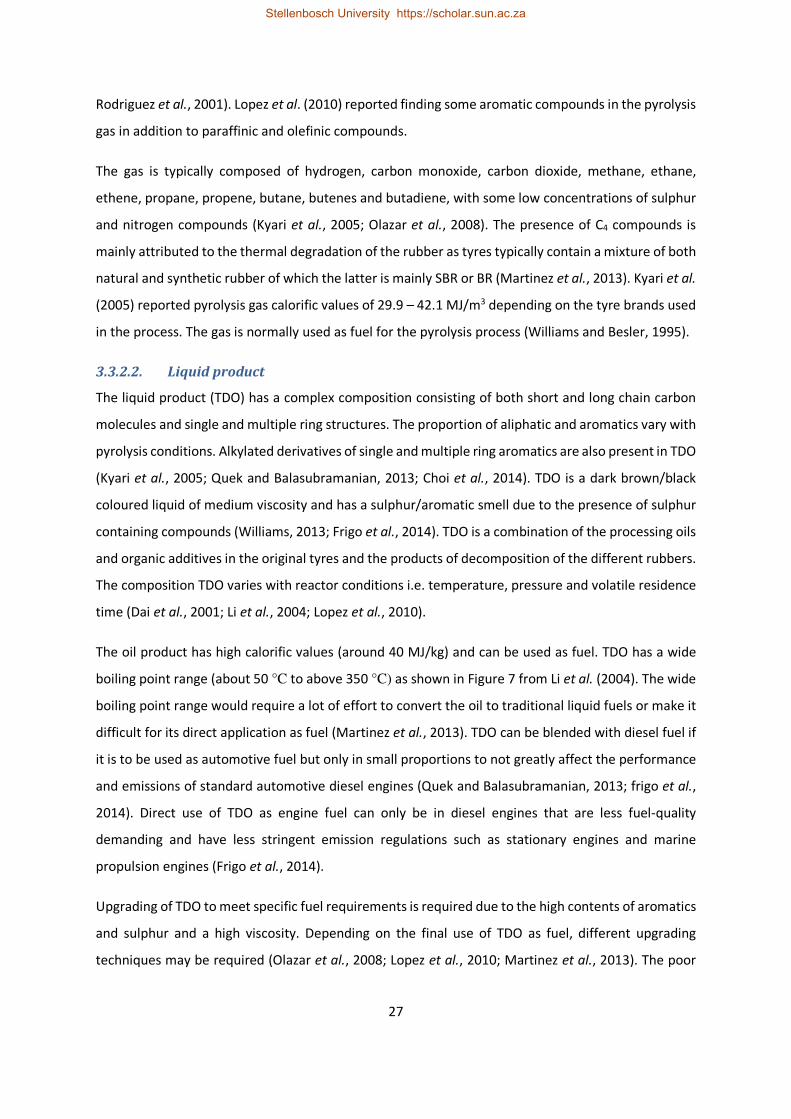
27
Rodriguez et al., 2001). Lopez et al. (2010) reported finding some aromatic compounds in the pyrolysis
gas in addition to paraffinic and olefinic compounds.
The gas is typically composed of hydrogen, carbon monoxide, carbon dioxide, methane, ethane,
ethene, propane, propene, butane, butenes and butadiene, with some low concentrations of sulphur
and nitrogen compounds (Kyari et al., 2005; Olazar et al., 2008). The presence of C4 compounds is
mainly attributed to the thermal degradation of the rubber as tyres typically contain a mixture of both
natural and synthetic rubber of which the latter is mainly SBR or BR (Martinez et al., 2013). Kyari et al.
(2005) reported pyrolysis gas calorific values of 29.9 – 42.1 MJ/m3 depending on the tyre brands used
in the process. The gas is normally used as fuel for the pyrolysis process (Williams and Besler, 1995).
3.3.2.2. Liquid product
The liquid product (TDO) has a complex composition consisting of both short and long chain carbon
molecules and single and multiple ring structures. The proportion of aliphatic and aromatics vary with
pyrolysis conditions. Alkylated derivatives of single and multiple ring aromatics are also present in TDO
(Kyari et al., 2005; Quek and Balasubramanian, 2013; Choi et al., 2014). TDO is a dark brown/black
coloured liquid of medium viscosity and has a sulphur/aromatic smell due to the presence of sulphur
containing compounds (Williams, 2013; Frigo et al., 2014). TDO is a combination of the processing oils
and organic additives in the original tyres and the products of decomposition of the different rubbers.
The composition TDO varies with reactor conditions i.e. temperature, pressure and volatile residence
time (Dai et al., 2001; Li et al., 2004; Lopez et al., 2010).
The oil product has high calorific values (around 40 MJ/kg) and can be used as fuel. TDO has a wide
boiling point range (about 50 °C to above 350 °C) as shown in Figure 7 from Li et al. (2004). The wide
boiling point range would require a lot of effort to convert the oil to traditional liquid fuels or make it
difficult for its direct application as fuel (Martinez et al., 2013). TDO can be blended with diesel fuel if
it is to be used as automotive fuel but only in small proportions to not greatly affect the performance
and emissions of standard automotive diesel engines (Quek and Balasubramanian, 2013; frigo et al.,
2014). Direct use of TDO as engine fuel can only be in diesel engines that are less fuel-quality
demanding and have less stringent emission regulations such as stationary engines and marine
propulsion engines (Frigo et al., 2014).
Upgrading of TDO to meet specific fuel requirements is required due to the high contents of aromatics
and sulphur and a high viscosity. Depending on the final use of TDO as fuel, different upgrading
techniques may be required (Olazar et al., 2008; Lopez et al., 2010; Martinez et al., 2013). The poor
Stellenbosch University https://scholar.sun.ac.za

28
fuel-quality characteristics of TDO oil results in limited application and low selling prices for the oil as
compared to traditional fuels from crude oil (Pilusa et al., 2014).
Figure 7: True boiling point curve of TDO obtained at 500 °C (estimation from graph by Li et al., 2004)
TDO can also be used as a source of chemical feedstock due to its various constituent compounds
(Li et al., 2004; Kyari et al., 2005). The chemical feedstock potential of TDO is discussed in section 3.3.3.
The limited application of TDO as fuel (in its crude form), potentially expensive investment for
upgrading TDO to match diesel fuel and consequent low selling price of the oil present an opportunity
for converting waste tyres into the high value chemicals found in the oil.
3.3.2.3. Solid product
The solid product is called pyrolysis char; it contains the inorganic matter of the tyre (ash, zinc oxide,
steel, silicates etc.) and the non-volatile carbon black added during tyre manufacture (Amari et al.,
1999; Li et al., 2004). Sulphur from vulcanisation is mainly retained in this product fraction. Tyre
composition and pyrolysis conditions determine the composition of the char product (Lopez et al.,
2010; Martinez et al., 2013). Coking or the deposition of degraded tyre material on the carbon black
can also form part of the char product, this would be indicated by an amount of char higher than the
sum of the carbon black and inorganics in the original tyre (Lopez et al., 2010). The quality of char
obtained under vacuum is better than that under atmospheric conditions due to vacuum minimising
coking that would block the pores of the char thus minimising its surface area (Lopez et al., 2010).
The char product obtained can be upgraded for use as activated carbon for different applications, as
a solid fuel or re-used as carbon black in the tyre manufacturing process. The char product however
0
10
20
30
40
50
60
70
80
90
100
0 50 100 150 200 250 300 350 400
Am
ou
nt
dis
till
ed
(w
t.%
)
Temperature (°C)
Stellenbosch University https://scholar.sun.ac.za
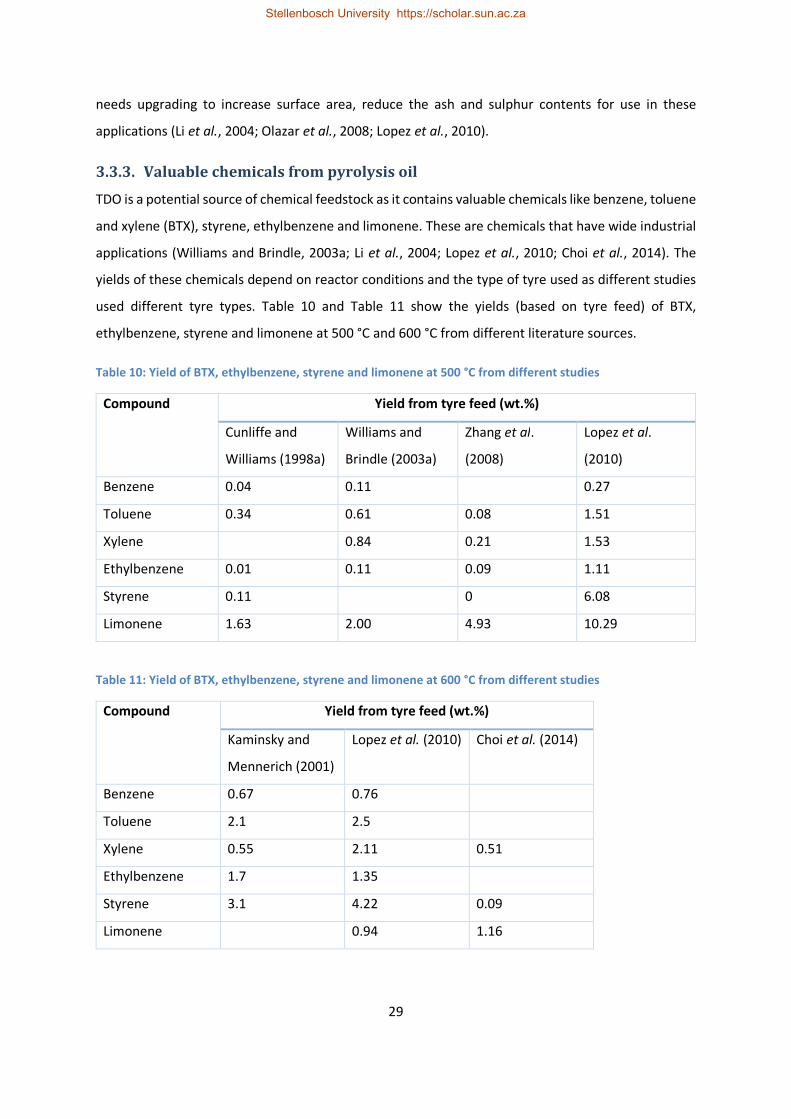
29
needs upgrading to increase surface area, reduce the ash and sulphur contents for use in these
applications (Li et al., 2004; Olazar et al., 2008; Lopez et al., 2010).
3.3.3. Valuable chemicals from pyrolysis oil
TDO is a potential source of chemical feedstock as it contains valuable chemicals like benzene, toluene
and xylene (BTX), styrene, ethylbenzene and limonene. These are chemicals that have wide industrial
applications (Williams and Brindle, 2003a; Li et al., 2004; Lopez et al., 2010; Choi et al., 2014). The
yields of these chemicals depend on reactor conditions and the type of tyre used as different studies
used different tyre types. Table 10 and Table 11 show the yields (based on tyre feed) of BTX,
ethylbenzene, styrene and limonene at 500 °C and 600 °C from different literature sources.
Table 10: Yield of BTX, ethylbenzene, styrene and limonene at 500 °C from different studies
Compound Yield from tyre feed (wt.%)
Cunliffe and
Williams (1998a)
Williams and
Brindle (2003a)
Zhang et al.
(2008)
Lopez et al.
(2010)
Benzene 0.04 0.11 0.27
Toluene 0.34 0.61 0.08 1.51
Xylene 0.84 0.21 1.53
Ethylbenzene 0.01 0.11 0.09 1.11
Styrene 0.11 0 6.08
Limonene 1.63 2.00 4.93 10.29
Table 11: Yield of BTX, ethylbenzene, styrene and limonene at 600 °C from different studies
Compound Yield from tyre feed (wt.%)
Kaminsky and
Mennerich (2001)
Lopez et al. (2010) Choi et al. (2014)
Benzene 0.67 0.76
Toluene 2.1 2.5
Xylene 0.55 2.11 0.51
Ethylbenzene 1.7 1.35
Styrene 3.1 4.22 0.09
Limonene 0.94 1.16
Stellenbosch University https://scholar.sun.ac.za

30
As can be seen from Table 10 and Table 11, the potentially valuable chemicals are present in TDO in
sufficient quantities given the wide variety of compounds that are present in TDO. Weitkamp et al.
(2001) reported that in 1999, 6.9 Mt of benzene, 2.3 Mt of toluene and 1.9 Mt of xylenes were
produced in Western Europe, and looked at ways of converting BTX into valuable products. BTX
compounds are a high value feedstock for the plastic/polymer industry, and the demand for xylene in
the industry is growing (Li et al., 2004; Lopez et al., 2010).
Another valuable chemical from waste tyre pyrolysis is limonene, and it is the target chemical in this
study. Limonene is a monoterpene that is a dimer of isoprene molecules and can be obtained from
the thermal decomposition of the polyisoprene contained in the tyre. The polyisoprene could either
be from natural or synthetic rubber (Pakdel et al., 2001; Danon et al., 2015). Limonene is a major
component of TDO with common yields of between 2.5 and 5 wt.% on the basis of a steel-free tyre
although yields as high as 27 wt.% have been reported (Lopez et al., 2010; Danon et al., 2015).
Limonene has wide industrial applications and has been used in the formulation of industrial solvents,
terpene resins and adhesives, as a cleaning agent, as a dispersing agent for pigment and in the
manufacturing of flavouring agents, fragrances and pesticides (Pakdel et al., 2001; Stanciulescu and
Ikura, 2007; Williams, 2013; Danon et al., 2015).
The current demand for limonene is mostly catered for by citrus-derived limonene (Danon et al.,
2015). The global production of citrus limonene was estimated at over 70 000 tons in 2013, with both
the demand and supply expected to increase constantly in future (Ciriminna et al., 2014). Citrus
harvest is a seasonal activity and as such, a drop in supply of citrus-derived limonene can be expected
when the citrus season ends. The supply of citrus limonene is subject to agricultural vulnerabilities,
which could bring volatility to the price of limonene (Ciriminna et al., 2014). Production and recovery
of tyre-derived limonene then become vital to close the potential limonene supply gap given the wide
industrial use of limonene.
The price of citrus limonene can range between 8 and 25 US$ per kilogram based on purity (Florida
Chemicals Co., 1991a, b, c; Pakdel et al., 2001; Stanciulescu and Ikura, 2007; Danon et al., 2015). To
this author’s knowledge, there currently is no information available on the price of tyre-derived
limonene. Impurities in tyre-derived limonene that were identified by Pakdel et al. (2001) include light
aromatics and undesirable sulphur containing compounds such as thiophene and benzothiazole. As
such, it is necessary to obtain sufficient purity for tyre-derived limonene to minimise the undesirable
impurities and to attain a high selling price.
Stellenbosch University https://scholar.sun.ac.za

31
The yields of the valuable chemicals discussed above vary with pyrolysis conditions and the tyre
material used. Therefore, it is necessary to optimise the reactor conditions depending on the type of
chemical desired. Section 3.3.4 will discuss various important pyrolysis reactor conditions and their
effects on reactor product distribution while linking it to limonene as the desired chemical.
3.3.4. Waste tyre pyrolysis operating conditions
Waste tyre pyrolysis is influenced by a variety of parameters with some having a direct and others
having an indirect effect. The parameters that mainly influence waste tyre pyrolysis are temperature,
pressure, residence time of volatiles in the hot reaction zone and heating rate (Gonzalez et al., 2001;
Dai et al., 2001; Leung and Wang, 2003).
3.3.4.1. Temperature
The reactor temperature is an important parameter that has to maintained in order to ensure a
constant supply of the heat required to effectively degrade the tyres into various products; it is the
main variable affecting pyrolysis (Gonzalez et al., 2001; Diez et al., 2004; Martinez et al., 2013).
Waste tyre pyrolysis has been performed at temperatures ranging from as low as 300 °C to as high as
1000 °C (Williams et al., 1993; Rodriguez et al., 2001; Conesa et al., 2004; Frigo et al., 2014).
Thermogravimetric analysis (TGA) studies for most tyre samples that have a combination of different
rubber types have shown that initial devolatilisation of the different oils, plasticizers and additives in
the tyre occurs in the temperature range of 150 °C to 350 °C. The final weight loss is observed at
temperatures of around 450 °C - 500 °C. This has necessitated the opinion that pyrolysis should start
around 350 °C and be complete at 500 °C (Williams and Besler, 1995; Leung and Wang, 1998; Senneca
et al., 1999; Choi et al., 2014). A study by Rodriguez et al. (2001) found that between 300 °C and 400°C,
the pyrolysis yields of char were higher than the TGA char results, and the char obtained had a gummy
sticky nature. Rodriguez et al. (2001) concluded that pyrolysis had not been completed between
300 °C and 400 °C.
Waste tyre pyrolysis is most commonly performed at temperatures of 425 °C to 600 °C, with 500 °C
the most commonly used in the range (Benallal et al., 1995; Li et al., 2004; Choi et al., 2014; Wang et
al., 2016). Most literature studies have performed their investigations using a range of temperatures
depending on the intention of the study. Pyrolysis temperatures of between 400 °C and 500 °C are the
most ideal for production of limonene; maximum yields of limonene are mostly obtained in this
temperature range (Cunliffe and Williams, 1998a; Zhang et al., 2008; Choi et al., 2014; Danon et al.,
2015). Selection of the pyrolysis temperature used in this study is discussed in section 4.4.1.
Stellenbosch University https://scholar.sun.ac.za

32
Effects of temperature on product distribution
An increase in temperature generally results in the increase in gas yield at the expense of the oil yield.
This is attributed to the occurrence of secondary thermal cracking reactions of the oil compounds into
non-condensable gas compounds at higher temperatures (Williams et al., 1993; Lopez et al., 2010;
Choi et al., 2014). In some instances, it has been found that this generic trend is only observed after
certain pyrolysis temperatures have been reached. Cunliffe and Williams (1998a) observed that the
oil yield increased and reached a maximum at 475 °C when the pyrolysis temperature was increased
from 450 °C up to 475 °C. The oil yield from the study by Cunliffe and Williams (1998a) then decreased
with temperature from 475 °C up to 600 °C with a corresponding increase in gas yield. This was also
attributed to the secondary reactions of breaking down the higher molecular species into gaseous
products.
Temperature does not have a significant effect on the yield of char, which will mostly remain at an
almost constant value, provided that full devolatilisation has occurred (Lee et al., 1995; Rodriguez et
al., 2001). The yield of char can increase slightly with temperature (above the value of original carbon
black and inorganics) due to increased deposition of condensed polyaromatic hydrocarbons on the
char surface (Lopez et al., 2010). Figure 8 shows the typically observed trends of the effect
temperature has on yield of pyrolysis product fractions.
Figure 8: Yields of pyrolysis products with temperature (Choi et al., 2014)
0
5
10
15
20
25
30
35
40
45
500 550 600 650 700 750 800 850
Yie
ld (
wt.
%)
Temperature (°C)
Gas
Oil
Char
Stellenbosch University https://scholar.sun.ac.za

33
In addition to the effects on the yields of main product fractions, the reactor temperature will also
have an effect on composition of each of the product fractions (gas, oil, and char). In the gas fraction,
the yield of light gases such as methane and hydrogen increases with temperature while the yield of
heavier gas components decreases with an increase in temperature. This is attributed to the
decomposition (cracking) of heavier hydrocarbons into lighter hydrocarbons and hydrogen (Lee et al.,
1995; Dai et al., 2001; Lopez et al., 2010). An increase in temperature also generally results in an
increase of the yield of unsaturated hydrocarbon gases at the expense of saturated hydrocarbon, as
consequence of thermal cracking of the saturated hydrocarbons (Lee et al., 1995; Dai et al., 2001). The
change in gas composition has an effect on the calorific value of the gas fraction. The calorific value of
the gas would increase with temperature due to the subsequent increase in composition of lighter
hydrocarbons and hydrogen (Rodriguez et al., 2001).
Reactor temperature also has an effect on the composition of the TDO product and the valuable
chemicals in the oil. An increase in temperature results in an increase of the aromatic fraction whereas
the aliphatic fraction decreases. This is attributed to higher temperatures favouring aromatic
formation reactions like the Diels-Alder reaction, recombination of aliphatics and aromatics free
radicals, and the cyclisation of aromatic chains (Williams and Brindle, 2003c; Lopez et al., 2010; Choi
et al., 2014; Hita et al., 2016).
An increase in temperature results in a decrease in limonene yield with a noticeable increase in
aromatic compounds like BTX. Limonene is unstable at temperatures of above 500 °C and decomposes
to form aromatics such as benzene, xylene, toluene, trimethylbenzene, m-cymene and indane (Pakdel
et al., 2001; Williams and Brindle, 2003c; Danon et al., 2015). A schematic representation of formation
and decomposition of limonene is shown in Figure 9. Some of these aromatic compounds such as
cymene, trimethylbenzene and indane have boiling points similar to that of limonene. An increase in
the yields of these compounds decreases the purity of the limonene fraction which makes recovery of
limonene even more difficult (Pakdel et al., 2001). Figure 10 shows the yield (from tyre feed) of
limonene and BTX aromatics with temperature from literature.
Stellenbosch University https://scholar.sun.ac.za
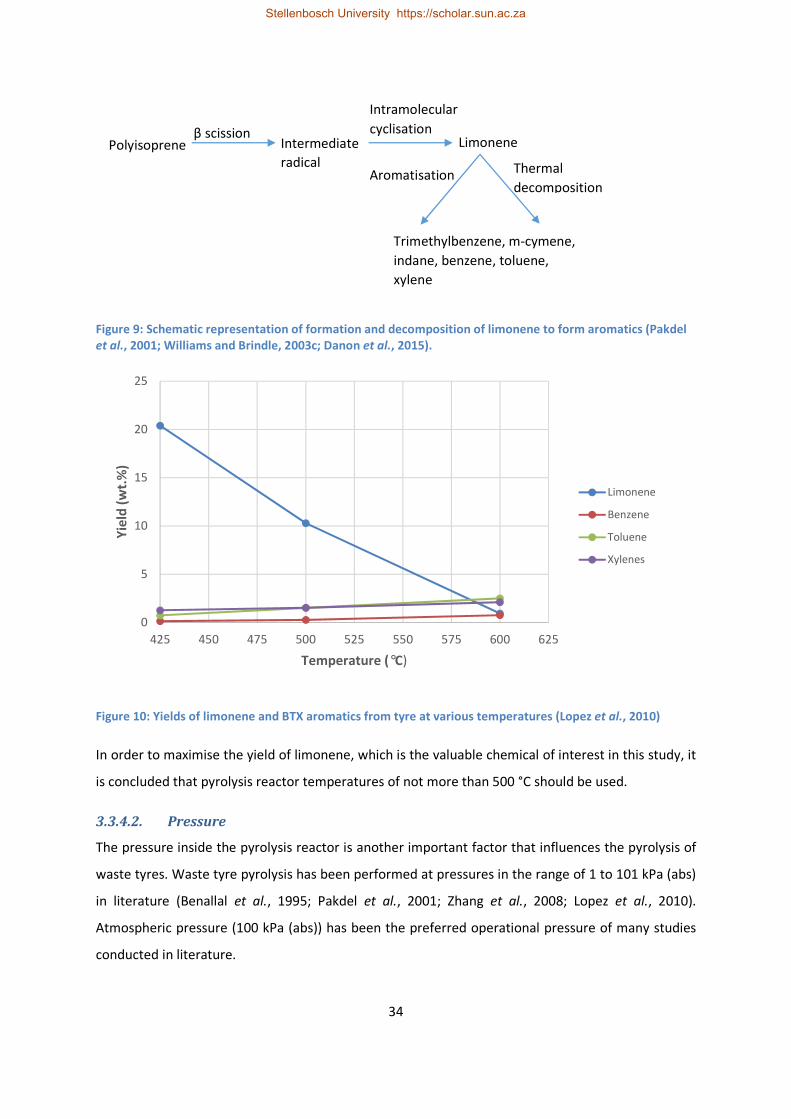
34
Polyisoprene β scission
Intermediate
radical
Intramolecular
cyclisation Limonene
Trimethylbenzene, m-cymene,
indane, benzene, toluene,
xylene
Thermal
decomposition Aromatisation
Figure 9: Schematic representation of formation and decomposition of limonene to form aromatics (Pakdel
et al., 2001; Williams and Brindle, 2003c; Danon et al., 2015).
Figure 10: Yields of limonene and BTX aromatics from tyre at various temperatures (Lopez et al., 2010)
In order to maximise the yield of limonene, which is the valuable chemical of interest in this study, it
is concluded that pyrolysis reactor temperatures of not more than 500 °C should be used.
3.3.4.2. Pressure
The pressure inside the pyrolysis reactor is another important factor that influences the pyrolysis of
waste tyres. Waste tyre pyrolysis has been performed at pressures in the range of 1 to 101 kPa (abs)
in literature (Benallal et al., 1995; Pakdel et al., 2001; Zhang et al., 2008; Lopez et al., 2010).
Atmospheric pressure (100 kPa (abs)) has been the preferred operational pressure of many studies
conducted in literature.
0
5
10
15
20
25
425 450 475 500 525 550 575 600 625
Yie
ld (
wt.
%)
Temperature (°C)
Limonene
Benzene
Toluene
Xylenes
Stellenbosch University https://scholar.sun.ac.za

35
The reactor pressure has an influence on the diffusion of volatiles formed within the tyre particle. This
has an effect on the residence time of the volatiles formed, which in turn affects the product
distribution (Lopez et al., 2010; Martinez et al., 2013). Pyrolysis under vacuum (pressures lower than
100 kPa (abs)) reduces the residence time of volatiles in that it enhances diffusion of the volatiles
towards the outside of the tyre particle owing to the positive pressure gradient created (Zhang et al.,
2008; Lopez et al., 2010). The enhanced diffusion causes a rapid removal of volatiles from the reaction
zone which reduces the occurrence of secondary decomposition reactions of the products (Mirmiran
et al., 1992; Benallal et al., 1995).
Vacuum pyrolysis is preferable for limonene production as the faster removal of volatiles from the
reaction zone prevents the secondary cracking reactions which degrade limonene. The typically lower
operational temperatures of vacuum pyrolysis also reduce the possibility of limonene degradation
(Mirmiran et al., 1992). In a study done by Pakdel et al. (2001), vacuum operation was said to improve
the yield of limonene at the expense of aromatics due to the rapid removal of volatiles and reduced
pyrolysis temperatures, which reduced the occurrence of Diels-Alder type of aromatisation.
Vacuum operation does not have a significant effect on the yield of char (provided pyrolysis is
complete) but does have an effect on the quality of the char produced. This is due to the fact that
repolymerisation and carbonisation of primary products is minimised under vacuum, which reduces
deposition of carbonaceous product material on the char surface (Lopez et al., 2010; Martinez et al.,
2013).
3.3.4.3. Volatiles residence time
The residence time of volatiles is influenced by factors such as the flow rate of carrier gas (gas used to
sweep pyrolysis vapours from the reaction zone) and the type of reactor used (Martinez et al., 2013).
An increase in carrier gas flow rate decreases the volatiles residence time as volatiles are removed
faster; the opposite is observed for a decrease in carrier gas flow rate (Martinez et al., 2013). The
residence time can also be reduced by operating at vacuum as the positive diffusion gradient around
the tyre particle created by vacuum allows for faster removal of volatiles (Pakdel et al., 2001).
Product distribution within the pyrolysis system is also affected by volatiles residence times. Longer
residence times favour the occurrence of secondary reactions which have an effect on the final
product distribution (Aylon et al., 2008; Martinez et al., 2013). An increase in residence time leads to
an increase in the gas yield at the expense of the oil yield due to longer residence times encouraging
the occurrence of secondary reactions and cracking of the oil product into gas (Dai et al., 2001; Aylon
et al., 2008; Islam et al., 2008). Increasing the volatiles residence time can also lead to a decrease in
Stellenbosch University https://scholar.sun.ac.za

36
char yield due to long contact times between the char product and volatiles, which could lead to
secondary reactions like the Boudouard reaction (reaction between carbon and carbon dioxide to yield
carbon monoxide) (Dai et al., 2001; Aylon et al., 2008; Islam et al., 2008).
Figure 11 shows the effect of residence time on the yields of pyrolysis products (yield values are
estimates from published graph). It can be seen that shorter volatile residence times are preferred for
maximising the yield of the liquid fraction, which contains the valuable chemicals that can be targeted
for recovery (Mimiran et al., 1992; Pakdel et al., 2001). Shorter residence times are thus preferable
for limonene production as occurrence of secondary reactions leading to decomposition of limonene
is minimised (Pakdel et al., 2001; Aylon et al., 2008; Martinez et al., 2013).
Figure 11: Effect of volatiles residence time on yields of pyrolysis products (re-drawn from Islam et al., 2008)
3.3.4.4. Heating rate
Heating rate is a key variable of pyrolysis as it affects the reaction rate and determines the
temperature profile within the particles (Martinez et al., 2013). An increase in heating rate generally
increases the temperature at which maximum devolatilisation occurs, which increases the
degradation rate (Williams et al., 1990; Leung and Wang, 2003). The shift to higher temperatures of
maximum devolatilisation and increased degradation rate is indicated by broadening of the derivative
thermogravimetric (DTG) profile with respect to temperature and shrinking of the DTG profiles with
respect to time (Senneca et al., 1999). Shifting of thermal decomposition to higher temperatures with
an increase in heating rate can be attributed to the combined effects of heat transfer and changes in
0
10
20
30
40
50
60
0 5 10 15 20 25
Yie
ld (
wt.
%)
Residence time (s)
Gas
Oil
Char
Stellenbosch University https://scholar.sun.ac.za

37
the kinetics of devolatilisation which result in delayed decomposition (Williams and Besler, 1995;
Martinez et al., 2013).
Operating at higher heating rates leads to higher pyrolysis temperatures, which can result in an
increase in the gas yield at the expense of the oil yield due to the occurrence of secondary reaction
(Alsaleh and Sattler, 2014). An increase in heating rate increases the yield of primary devolatilisation
products at the expense of secondary devolatilisation as maximum devolatilisation is moved to higher
temperatures (Senneca et al., 1999).
Dipentene is a major product of primary degradation of natural rubber and it is degraded by
occurrence of secondary reactions that form aromatic compounds (Williams and Besler, 1995; Choi et
al., 2014). Heating rate has an effect on the characteristics of primary vapour products. Increasing the
heating rate increases the yield of aliphatic products while a decrease in the yield of aromatic products
occurs (Williams et al., 1990). In order to minimise occurrence of secondary reactions that would crack
the oil product and convert primary volatiles into aromatics, faster removal of primary volatiles is
essential (Leung and Wang, 1998; Mastral et al., 2000; Naim et al., 2017).
It therefore implies that higher heating rates are favourable for formation of limonene as the rate of
reaction is increased, however, faster removal of primary volatiles is required in order to minimise the
occurrence of secondary reactions that degrade limonene (shown in Figure 9).
3.3.5. Waste tyre pyrolysis economics
Wojtowicz and Serio (1996) performed a preliminary economic feasibility study for converting waste
tyres into carbon black by partial combustion of the oil produced from pyrolysis. They reported that
major pyrolysis projects have failed to gain commercial success due to the low market value of the
pyrolysis oil and char produced. Wojtowicz and Serio (1996) therefore deemed it necessary to produce
carbon black which had a higher market value than pyrolysis oil in order to improve the economics of
their process. The preliminary feasibility study by Wojtowicz and Serio (1996) used a tyre flow rate of
100 tons/day and found that the process was economical over a 5 year project life. The process yielded
20% gas, 35% char and 45% oil. The saleable products were carbon black, activated char and Boudard
carbon with a tipping fee also adding to the revenue stream. Wojtowicz and Serio (1996) concluded
that waste tyre pyrolysis processes are only economical if high value products are produced and
recommended recovery of valuable chemicals as a pathway to make waste tyre pyrolysis economically
feasible.
Stellenbosch University https://scholar.sun.ac.za

38
Shelly and El-Halwagi (1999) conducted an economic feasibility study for a waste tyre pyrolysis process
that converts the pyrolysis oil into a synthetic crude product. The pyrolysis oil obtained was upgraded
(hydrotreating and hydrocracking) to produce the synthetic crude product. The study by Shelly and El-
Halwagi (1999) found that the process considered was economical having used a tyre feed rate of 100
tons/day. The saleable products from the process were synthetic crude, carbon black and steel; a
tipping fee also contributed to the revenue stream. No information was provided about the yields of
the different products that were sold. It was however noted by Shelly and El-Halwagi (1999) that a
tyre feed rate of 100 tons/day could be difficult to obtain due to transportation costs and/or
scheduling conflicts. There is therefore a need to look at waste tyre pyrolysis economic feasibility at
lower tyre feed rates. Higher feed rates might have more costs savings due to the effect of economies
of scale, however, more realistic flow rates need to be used. The study by Shelly and El-Halwagi (1999)
also highlighted the need for upgrading pyrolysis primary products in order to improve process
economics.
Pilusa et al. (2014) conducted a preliminary economic feasibility study for conversion of waste tyres
into fuel in South Africa over a 5 year project life. Similarly to the current study, the study by
Pilusa et al. (2014) assumed a constant supply of waste tyres from REDISA. The pyrolysis oil obtained
was fractionated to produce tyre-derived fuel and heavy fuel oil. The process yielded 10% steel, 45 %
oil, 37% char and 8% gas. The saleable products from the process were light diesel-equivalent fuel,
refined carbon black, steel and sodium sulphite (a product of scrubbing the flue gases generated in
the process using sodium hydroxide solution). The process used a tyre feed rate of 30 tons/day and it
was found to be economically feasible. The study by Pilusa et al. (2014) highlighted the necessity for
upgrading of the pyrolysis primary products to more valuable products in order to achieve economic
feasibility for waste tyre pyrolysis processes. Pilusa et al. (2014) also concluded that a continuous
product market demand is required for economic success of pyrolysis processes.
The economic studies evaluated in this section have highlighted the need for waste tyre pyrolysis
processes that are focused on production of high value products as opposed to selling the primary
products. The economic evaluation of the current study is therefore focused on the feasibility of
recovering valuable products from waste tyres.
3.4. Modelling/simulation of pyrolysis systems
For a lot of processes, numerical simulations become necessary to help identify feasible operating
conditions that improve the process performance (Mitta et al., 2006). Process modelling using
simulation software provides powerful engineering tools to evaluate the mass and energy balances,
Stellenbosch University https://scholar.sun.ac.za

39
to perform thermodynamic assessment and to optimise the processes (He et al., 2013; Kong et al.,
2014). In this section, a general review of process simulation/modelling work that has been done in
literature for waste tyre pyrolysis systems is provided.
This section will also provide a review of simulation/modelling of waste tyre valorisation processes
using Aspen Plus® simulation package. Aspen Plus® is the simulation package used in the current
study. The review of waste tyre valorisation processes will focus on determining the information
required to successfully simulate the pyrolysis process in this study using Aspen Plus®. The required
information that the review will focus on is: definition/representation of feed material; type of reactor
model used; property method used; estimation of reactor product distribution; and model validation.
The gaps that currently exist with regards to process modelling of waste tyre pyrolysis processes will
also be highlighted.
Aspen Plus® simulation package is a commercial software that has been widely used for modelling,
design and process optimisation of steady-state processes of chemical engineering systems including
pyrolysis. Aspen Plus® contains various modules, thermodynamic method databases, and extensive
physical property models capable of simulating the wide range of chemical process conditions suitable
for the pyrolysis process (Yang et al., 2012; Taylor et al., 2013; Visconti et al., 2015). Aspen Plus® has
been used to simulate pyrolysis processes of several feedstock such as tyres, coal, biomass, plastics
etc. (Yan and Zhang, 1999; Al Amoodi et al., 2013; Hammer et al., 2013; Altayeb, 2015). Therefore,
while Aspen Plus® is not the only simulation package available, it is highly suitable for simulation of
waste tyre pyrolysis processes.
3.4.1. Modelling/simulation of waste tyre pyrolysis
The open literature has limited work on modelling and simulation of waste tyre pyrolysis systems.
During the course of this study, only 2 literature sources that dealt with modelling/simulation of
pyrolysis systems were encountered. These sources were a modelling and simulation study for
production of liquid fuels by Altayeb (2015) and a study by Ismail et al. (2017) where a simulation
model was developed to predict yields of various pyrolysis products under varying operating
temperatures. Both Altayeb (2015) and Ismail et al. (2017) simulated their processes using Aspen
Plus®. As such, they will be discussed in section 3.4.2. The acronyms associated with Aspen Plus® used
in this study are briefly described in Table 12. According to the knowledge of the author of this current
study, no other waste tyre pyrolysis process simulation studies are available in the open literature.
Stellenbosch University https://scholar.sun.ac.za

40
Table 12: Description of Aspen Plus® acronyms used in section 3.4.2
Acronym Description
DCOALIGT Density model for coal
FORTRAN User model for unit operation
HCOALGEN Enthalpy model for coal
RGIBBS Multiphase equilibrium reactor model
RPLUG Reactor model based on plug flow with rate based kinetics
RSTOIC Reactor model based on reaction stoichiometry
RYIELD Reactor model based on product yields
3.4.2. Aspen Plus® modelling/simulation of waste tyre valorisation processes
Various studies in literature have developed simulation models for different processes aimed at
valorising waste tyres; pyrolysis and gasification are the waste tyre valorisation processes that have
commonly been modelled in the open literature using Aspen Plus® (Mitta et al., 2006; Altayeb, 2015;
Ismail et al., 2017). In developing simulation models of these valorisation processes,
definition/specification of the feed material (tyre) and determination of suitable property models are
typically amongst the first challenges to be addressed.
Due to the tyre not having a defined molecular structure/formula, and as such, not being in the Aspen
Plus® component database, it is characterised as non-conventional, and it is defined using the
proximate and ultimate analyses (Taylor et al., 2013; Ismail et al., 2017). There has not been much
report of the property models that have been used for these processes in literature. The Peng-
Robinson with Boston-Mathias alpha function (PR-BM) property model has however been used to
calculate physical properties of conventional components by Altayeb (2015). Altayeb (2015) also
estimated the density and enthalpy of non-conventional components using the DCOALIGT and
HCOALGEN models respectively.
With regards to modelling of the pyrolysis processes, the pyrolysis step is typically divided into 3 steps,
which are to simplify the rather complex phenomenon that is tyre pyrolysis (Altayeb, 2015; Ismail et
al., 2017). Altayeb (2015) divided their pyrolysis reactor into drying, tyre decomposition, and pyrolysis
reaction. From the model developed by Altayeb (2015), the drying step was used to reduce the
moisture content of the tyre feed. The tyre decomposition step was used to convert (decompose) the
non-conventional tyre into its elemental constituents by specifying the output yield of each
component based on the ultimate analysis. Finally, Altayeb (2015) used the pyrolysis reaction step to
Stellenbosch University https://scholar.sun.ac.za

41
generate the actual final pyrolysis products of their study using the Gibbs free energy minimisation
approach. Ismail et al. (2017) used a similar approach to that of Altayeb (2015), where they divided
the pyrolysis step of their model into decomposition, kinetic reactions, and combustion. From the
model of Ismail et al. (2017), the decomposition step performed a similar purpose to that in the model
of Altayeb (2015), and the kinetic reaction step was used to generate the actual pyrolysis products
using kinetic data obtained from literature. Ismail et al. (2017) used the combustion step to generate
the heat required for the pyrolysis reactor by combusting part of the char product in a furnace.
For representation of each different step in Aspen Plus®, various reactor models are used, largely
depending on the availability of input information required for each reactor model. The reactor
models that were used to represent each of the respective 3 steps, and pyrolysis conditions of the
models by Altayeb (2015) and by Ismail et al. (2017) are shown it Table 13.
Table 13: Aspen Plus® reactor models and pyrolysis conditions of several tyre pyrolysis models in literature
Item Altayeb (2015) Ismail et al. (2017)
Drying step RSTOIC
Decomposition step RYIELD RYIELD
Pyrolysis reaction RGIBBS RPLUG
Combustion step RGIBBS
Pyrolysis conditions 450 °C 300 – 700 °C
For modelling of the waste tyre gasification systems, the actual gasification process (in the gasifier) is
also typically divided into 2 – 3 independent steps/stages that represent several phenomena that are
hypothesised to be occurring at various points along the gasifier length (Mitta et al., 2006; Taylor et
al., 2013).
Mitta et al. (2006) divided the gasifier of the model in their study into 3 stages as follows: drying,
devolatilisation/decomposition, and gasification-combustion. The drying step in the model of Mitta et
al. (2006) represented instantaneous moisture removal of the tyre particles, and the devolatilisation
step represented decomposition of the non-conventional tyre into its elemental constituents. Finally,
the gasification-combustion step in the model of Mitta et al. (2006) represented formation of the
actual expected gasifier products (compounds in the syngas produced) using Gibbs free energy
minimisation. Similarly to Mitta et al. (2006), Taylor et al. (2013) included the decomposition and
gasification steps to represent the actual gasification process in the model of their study. The only
Stellenbosch University https://scholar.sun.ac.za
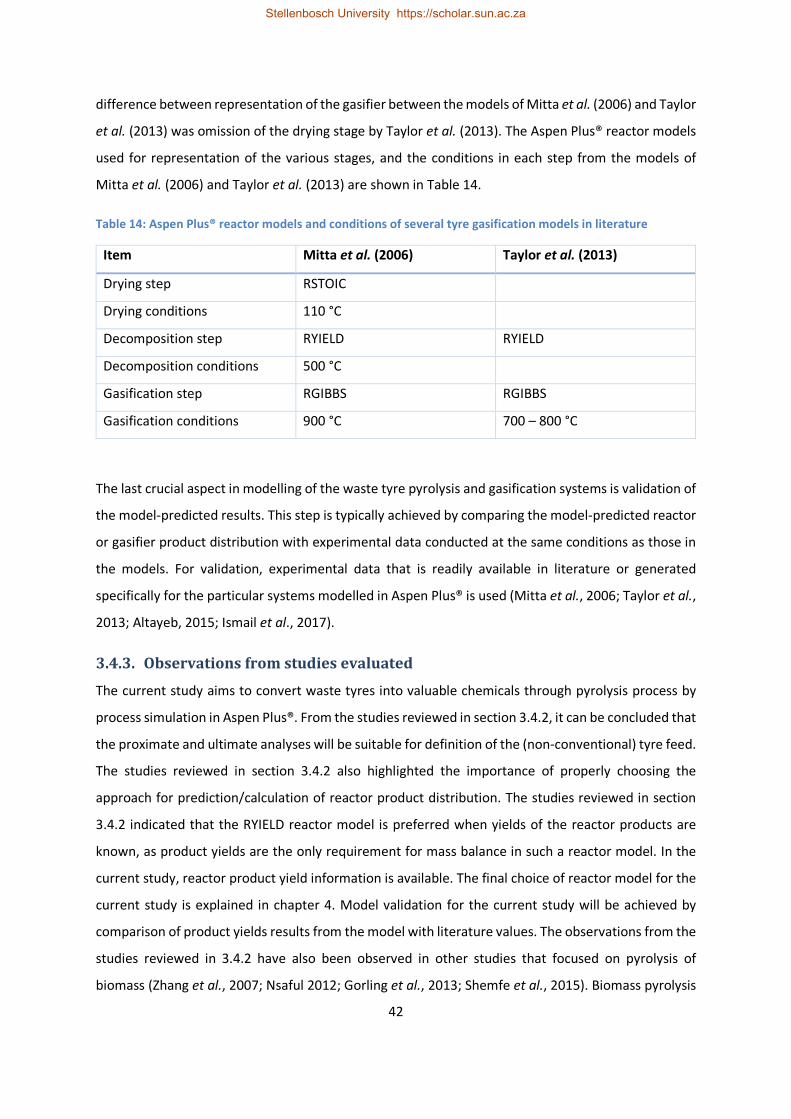
42
difference between representation of the gasifier between the models of Mitta et al. (2006) and Taylor
et al. (2013) was omission of the drying stage by Taylor et al. (2013). The Aspen Plus® reactor models
used for representation of the various stages, and the conditions in each step from the models of
Mitta et al. (2006) and Taylor et al. (2013) are shown in Table 14.
Table 14: Aspen Plus® reactor models and conditions of several tyre gasification models in literature
Item Mitta et al. (2006) Taylor et al. (2013)
Drying step RSTOIC
Drying conditions 110 °C
Decomposition step RYIELD RYIELD
Decomposition conditions 500 °C
Gasification step RGIBBS RGIBBS
Gasification conditions 900 °C 700 – 800 °C
The last crucial aspect in modelling of the waste tyre pyrolysis and gasification systems is validation of
the model-predicted results. This step is typically achieved by comparing the model-predicted reactor
or gasifier product distribution with experimental data conducted at the same conditions as those in
the models. For validation, experimental data that is readily available in literature or generated
specifically for the particular systems modelled in Aspen Plus® is used (Mitta et al., 2006; Taylor et al.,
2013; Altayeb, 2015; Ismail et al., 2017).
3.4.3. Observations from studies evaluated
The current study aims to convert waste tyres into valuable chemicals through pyrolysis process by
process simulation in Aspen Plus®. From the studies reviewed in section 3.4.2, it can be concluded that
the proximate and ultimate analyses will be suitable for definition of the (non-conventional) tyre feed.
The studies reviewed in section 3.4.2 also highlighted the importance of properly choosing the
approach for prediction/calculation of reactor product distribution. The studies reviewed in section
3.4.2 indicated that the RYIELD reactor model is preferred when yields of the reactor products are
known, as product yields are the only requirement for mass balance in such a reactor model. In the
current study, reactor product yield information is available. The final choice of reactor model for the
current study is explained in chapter 4. Model validation for the current study will be achieved by
comparison of product yields results from the model with literature values. The observations from the
studies reviewed in 3.4.2 have also been observed in other studies that focused on pyrolysis of
biomass (Zhang et al., 2007; Nsaful 2012; Gorling et al., 2013; Shemfe et al., 2015). Biomass pyrolysis
Stellenbosch University https://scholar.sun.ac.za

43
is the most simulated process in Aspen Plus® amongst pyrolysis processed of carbonaceous materials
and the observations were found to be applicable to this study.
3.5. Typical process flow diagrams of waste tyre pyrolysis plants
This section gives a brief review of some of the process flow diagrams (PFDs) that have been developed
in literature for pyrolysis of waste tyres. The intention of this section is to demonstrate the different
process steps that are typically involved during waste tyre pyrolysis; the different process steps will
serve as part of a guideline/basis for development of the waste tyres-to-limonene process discussed
in chapter 4 of this study.
Wojtowicz and Serio (1996) developed a conceptual PFD of a proposed process for pyrolysis of waste
tyres to carbon black, activated char and Boudard carbon. Details about the tyre feed rate and yields
of primary products have been discussed in section 3.3.6 and will not be repeated here. The PFD of
the process proposed by Wojtowicz and Serio (1996) is shown in Figure 12. In the process shown in
Figure 12, tyres are shredded (pre-treatment) before feeding into a pyrolysis reactor (fluidised-bed
reactor) operating at 600 °C. A cyclone is required after the reactor in order to separate the volatiles
from the char product. The volatiles are condensed to obtain a non-condensable gas product and an
oil product. The non-condensable gas product is returned to the reactor as a fluidising medium and as
fuel for reactor heating while the oil product is sent to a furnace for conversion into carbon black by
partial combustion at 1400 - 1650 °C. The char product from the process in Figure 12 is activated by
carbon dioxide at 900 °C to produce activated carbon; the carbon monoxide produced during
activation is sent to a Boudard reactor where it is converted to Boudard carbon at 500 - 527 °C.
Fels and Pegg (2009) developed a PFD for evaluation of waste tyre pyrolysis plants operating in
Shanghai and Taiwan that process 8000 tons of tyres per year at an estimated operational time of
7680 hours/year. The products from the plants evaluated in the study by Fels and Pegg (2009) are
pyrolysis gas, pyrolysis oil, pyrolysis char and steel at yields of 10%, 45%, 35% and 10% respectively.
The PFD of the process developed by Fels and Pegg (2009) is shown in Figure 13. It can be seen that
shredding of the tyres into 3cm2 chips is the only major pre-treatment step involved before the tyres
are fed into a pyrolysis reactor operating at 425 °C. The volatiles produced in the reactor are cooled
in a condenser whereby an oil product is obtained and separated from the non-condensable gases.
The oil product is sold as feedstock for an oil refinery. The non-condensable gas product is either
combusted for reactor heating (40%), combusted to generate heat for drying (30%) and the remainder
is burned in a flare stack. A magnetic separation step is used to separate the steel and the char product
that are obtained from the reactor.
Stellenbosch University https://scholar.sun.ac.za

44
Shredder
Pyrolyser
Tyre shreds Hot cycloneVolatiles& Char
Char activator
Char
VolatilesCondenser
Recycled for fluidisation
Gas
Combusted for reactor heating
Furnace
Oil
Air
Carbon black
Boudard reactor
CO
CO2
Activated carbon
Boudard carbon
Whole tyres
Figure 12: PFD of the process by Wojtowicz and Serio (1996)
Stellenbosch University https://scholar.sun.ac.za
Stellenbosch University https://scholar.sun.ac.za
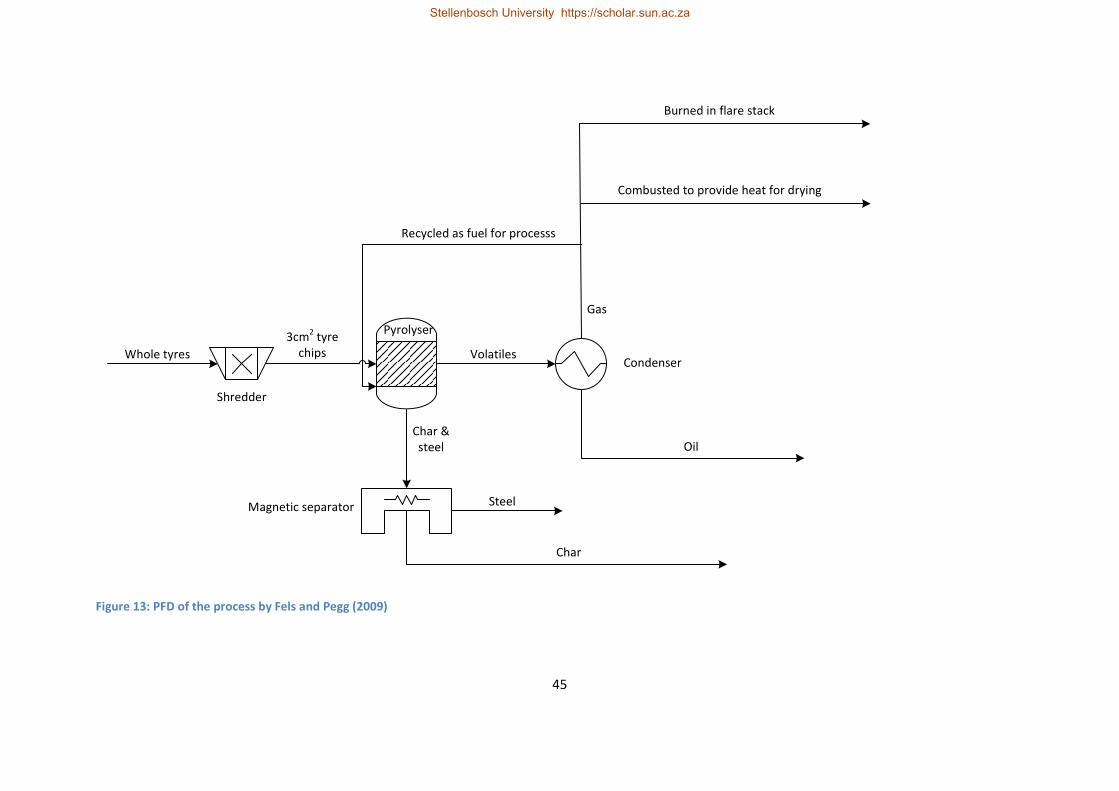
45
Shredder
Pyrolyser3cm
2tyre
chips VolatilesCondenser
Oil
Gas
Recycled as fuel for processs
Burned in flare stack
Magnetic separator
Char &
steel
Char
Whole tyres
Steel
Combusted to provide heat for drying
Figure 13: PFD of the process by Fels and Pegg (2009)
Stellenbosch University https://scholar.sun.ac.za
Stellenbosch University https://scholar.sun.ac.za

46
Pilusa et al. (2014) developed a conceptual PFD for a proposed plant that produces tyre-derived fuel
(TDF), refined carbon black, steel and sodium sulphite. Details about process flow rate and reactor
product yields have already been discussed in section 3.3.5. The PFD developed by Pilusa et al. (2014)
is shown in Figure 14. Pre-treatment in Figure 14 includes extraction of the high-tensile bead wires
(from trimmed tyre rings) and shredding of the tyres to produce 10-15mm tyre chips. The tyre chips
are fed into a pyrolysis reactor operating at 570 °C to produce volatiles, char and steel products. The
reactor volatiles are cooled in a condenser to obtain an oil product and a non-condensable gas
product. A portion of the non-condensable gas product is combusted for reactor heating and the
remaining fraction is compressed and used to run the fork lifts. The oil product from the condenser is
sent to a fractionation column where a light diesel-equivalent fuel and an HFO-equivalent fuel are
obtained. The light diesel-equivalent fuel is sold and the HFO-equivalent fuel is mixed with diesel and
used as fuel for a generator. The char product obtained from the reactor is milled, thickened and filter
pressed to produce a refined carbon black product that is sold. The steel obtained from the reactor is
also sold together with the steel obtained from pre-treatment. Sodium sulphite is obtained from
treatment of the flue gases generated in the process with sodium hydroxide.
From the PFDs reviewed in this section, it can be observed that a PFD of a waste tyre pyrolysis process
will depend on the targeted final products. It can also be observed that major differences in the PFDs
of tyre pyrolysis plants are mostly due to upgrading of the primary products into the desired final
products; minor differences are observed in the PFDs up to recovery of primary products. The major
process steps in a PFD of a waste tyre pyrolysis process are pre-treatment (typically shredding),
pyrolysis, condensing of reactor volatiles and separation of the resulting oil and non-condensable
gases, and separation of the steel from the char product. The PFDs of the processes reviewed in this
section have also indicated that while the oil and char products can typically be upgraded to various
secondary products, the non-condensable gas is typically combusted for reactor heating and/or is
flared.
Stellenbosch University https://scholar.sun.ac.za

47
Shredder
Whole tyres
Pyrolyser
Trimmed
tyres
Volatiles
Condenser
Wire extractor
Steel
10-15 mm
Tyre chips
Steel
Super micro-miller
Char
Water Classifier &
Thickener
Filter press
Thickened char
Water recycle
Refined carbon black
Gas
Recycled for reactor heating
To compressor
Gas compressor
Compressed gas
Oil distillation column
Oil
Light diesel-equivalent fuel
HFO-equivalent fuel
Milled char
Figure 14: PFD of the process by Pilusa et al. (2014)
Stellenbosch University https://scholar.sun.ac.za
Stellenbosch University https://scholar.sun.ac.za

48
In this study, a PFD of one main process scenario will be developed, which will serve as the base case
scenario for converting waste tyres to limonene by pyrolysis. The main process scenario that will be
developed in this study will include de-beading and shredding of whole tyres to tyre chips (pre-
treatment), pyrolysis, magnetic separation of the char and steel, condensation of the reactor volatiles,
fractional distillation, extractive distillation using a solvent, and solvent regeneration. The process
steps (de-beading and shredding, pyrolysis, condensation and magnetic separation) involved up to
recovery of primary products (oil, char, non-condensable gas and steel) are based on the PFDs
reviewed in section 3.5 and what has been done in other studies (Shelly and El-Halwagi, 1999). In this
study, the process steps of fractional distillation, extractive distillation using a solvent and solvent
regeneration are adapted from a study done by Ngwetjana (2017) who investigated the recovery of
limonene from TDO. The process of limonene recovery from TDO using diethylene glycol (DEG) as the
solvent, developed by Ngwetjana (2017), is used in this study. A block flow diagram (BFD) of the
proposed main process scenario that will be developed in this study is shown in Figure 15.
An alternative of the process shown in Figure 15 would be a process scenario in which the oil obtained
from the condenser is not further upgraded to recover limonene but sold as low value fuel (raw TDO).
The use of TDO as low value fuel is currently the most common application. The process scenario of
tyre pyrolysis for fuel production purposes would be similar to Figure 15 but without the fractional
distillation, extractive distillation and solvent regeneration steps. The process scenario for converting
tyres to TDO will be used for purposes of economic comparison (in chapter 5) with the main process
scenario in Figure 15 to determine the benefits of upgrading the oil to recover limonene.
Other literature studies have developed processes that include shredding and crumbing of whole tyres
to produce steel-free tyre crumbs that are then used as feed to the reactor (Ko et al., 2004, Altayeb,
2015). The pre-treatment to crumb variation of Figure 15 will only be considered for economic
comparison in chapter 5 to determine the economic benefits of pre-treating whole tyres to either
chips or crumb. Another pre-treatment variation to the one in Figure 15 would be a scenario in which
purchased crumb is used as feed for the process (no pre-treatment required). The crumb-purchase
variation will also be considered for economic comparison with the main process in Figure 15 to
determine if there is any benefit to having no pre-treatment step.
Stellenbosch University https://scholar.sun.ac.za

49
De-beading and
Shredding
Whole tyresPyrolysis Condenser Fractional distillation
Tyre chips
Extractive distillation
Solvent regeneration
Magnetic separation
Volatiles
Non-condensable gases
Oil
Lights
Heavies
Limonene-rich cut
DEG-rich
Limonene
DEG make-up
Aromatics
DEG recycle
Char & steel
Char
Steel
Steel
Figure 15: Proposed BFD of the main process scenario for converting waste tyres to limonene in current study
Stellenbosch University https://scholar.sun.ac.za
Stellenbosch University https://scholar.sun.ac.za

50
3.6. Summary
In chapter 3, a literature study was conducted with regards to waste tyres and process modelling of
waste tyre pyrolysis systems. Landfilling and stockpiling have been shown to be the simplest methods
for disposing the waste tyres generated, however, they present serious environmental and human
health threats. Several alternative methods that are currently used to deal with the problem of waste
tyre produce products that either have low market demands or low market prices mainly due to
quality concerns. The current alternative methods have as such failed to greatly reduce the amount
of waste tyres in stockpiles and landfills.
Pyrolysis is an attractive alternative method of reducing the amount of waste tyres available. The
products of pyrolysis can be independently stored and used as alternative fuels or upgraded to
secondary products. Most waste tyre pyrolysis projects have been limited to laboratory or pilot scales
with most focus placed on the use of pyrolysis products as alternative fuels.
The literature review also revealed that waste tyre pyrolysis projects have failed to gain commercial
success due to low quality of products obtained which results in low selling prices. As such, recovery
of high value chemicals from waste tyre pyrolysis is required in order to improve the economics of
waste tyre pyrolysis. The current study will address this requirement by performing economic
feasibility evaluation of an industrial process aimed at recovering limonene from waste tyre via the
pyrolysis process. The feasibility evaluation will demonstrate whether recovering chemicals from
waste tyre pyrolysis really has the potential to improve the economic of waste tyre pyrolysis or not.
Pyrolysis seems to be a potential pathway for converting waste tyres into valuable chemicals as the
pyrolysis oil contains compounds like limonene, BTX etc. that could command high selling prices
should they be recovered. Limonene has been targeted for recovery in this study due to its wide range
of industrial applications and potential high selling prices. It was revealed that there currently is a gap
with regards to processes being used as pathways for production and recovery of valuable chemicals
from waste tyre pyrolysis.
There is limited work in the open literature with regards to process modelling of waste tyre pyrolysis.
Aspen Plus® is a simulation software capable of performing process modelling for waste tyre
valorisation process such as pyrolysis and gasification. For simulation of waste pyrolysis using Aspen
plus®, an RYIELD reactor model is preferred when information about product distribution is available,
like in the current study. Process modelling using simulation software can be used as a predictive tool
for product distribution at varying reactor conditions. As such, experimental data is always necessary
to validate the model-predicted results.
Stellenbosch University https://scholar.sun.ac.za

51
The current study will try to close the literature gap by developing a conceptual base case process
scenario aimed at conversion of waste tyres to limonene by pyrolysis using PFDs that have been
developed in literature as guideline. The current study will also make a contribution towards the field
of process modelling of waste tyre pyrolysis as there currently exists a gap in that particular field.
Development of the conceptual base case process scenario (including process simulation in Aspen
plus®) is detailed in chapter 4.
Stellenbosch University https://scholar.sun.ac.za

52
Stellenbosch University https://scholar.sun.ac.za
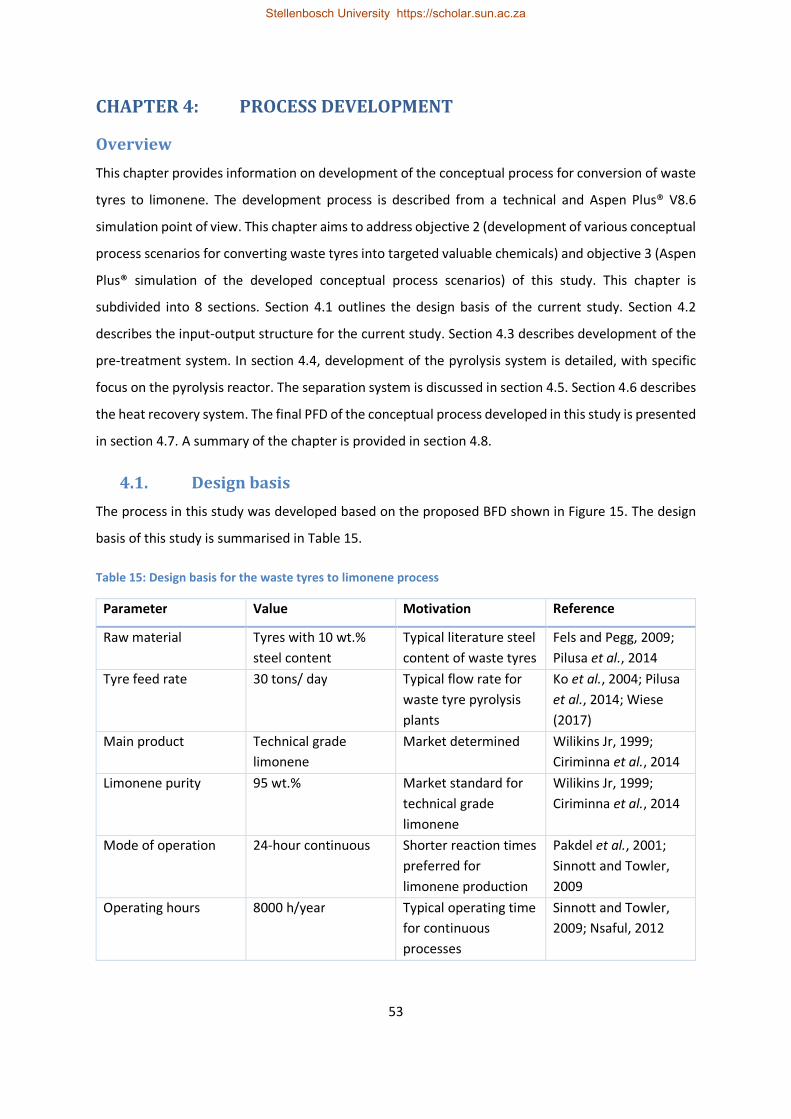
53
CHAPTER 4: PROCESS DEVELOPMENT
Overview
This chapter provides information on development of the conceptual process for conversion of waste
tyres to limonene. The development process is described from a technical and Aspen Plus® V8.6
simulation point of view. This chapter aims to address objective 2 (development of various conceptual
process scenarios for converting waste tyres into targeted valuable chemicals) and objective 3 (Aspen
Plus® simulation of the developed conceptual process scenarios) of this study. This chapter is
subdivided into 8 sections. Section 4.1 outlines the design basis of the current study. Section 4.2
describes the input-output structure for the current study. Section 4.3 describes development of the
pre-treatment system. In section 4.4, development of the pyrolysis system is detailed, with specific
focus on the pyrolysis reactor. The separation system is discussed in section 4.5. Section 4.6 describes
the heat recovery system. The final PFD of the conceptual process developed in this study is presented
in section 4.7. A summary of the chapter is provided in section 4.8.
4.1. Design basis
The process in this study was developed based on the proposed BFD shown in Figure 15. The design
basis of this study is summarised in Table 15.
Table 15: Design basis for the waste tyres to limonene process
Parameter Value Motivation Reference
Raw material Tyres with 10 wt.%
steel content
Typical literature steel
content of waste tyres
Fels and Pegg, 2009;
Pilusa et al., 2014
Tyre feed rate 30 tons/ day Typical flow rate for
waste tyre pyrolysis
plants
Ko et al., 2004; Pilusa
et al., 2014; Wiese
(2017)
Main product Technical grade
limonene
Market determined Wilikins Jr, 1999;
Ciriminna et al., 2014
Limonene purity 95 wt.% Market standard for
technical grade
limonene
Wilikins Jr, 1999;
Ciriminna et al., 2014
Mode of operation 24-hour continuous Shorter reaction times
preferred for
limonene production
Pakdel et al., 2001;
Sinnott and Towler,
2009
Operating hours 8000 h/year Typical operating time
for continuous
processes
Sinnott and Towler,
2009; Nsaful, 2012
Stellenbosch University https://scholar.sun.ac.za

54
Table 15 continued: Design basis for the waste tyres to limonene process
Parameter Value Motivation Reference
Simulation software Aspen Plus® Widely used for
simulation of pyrolysis
systems of various
carbonaceous
feedstock
Yan and Zhang, 1999;
Hammer et al., 2013;
Altayeb, 2015
Plant location Cape Town Close proximity to
established network
of tyre depots,
transporters,
processors and
potential ease of
product distribution
GoIndustry DoveBid,
2016; REDISA, 2016
Raw materials and production capacity
The raw material used for the process in this study is tyres with a steel content of 10 wt.%; truck tyres
are preferred in this study as they typically contain more natural rubber content than passenger car
tyres. It is assumed that the tyres will be supplied by REDISA. The tyre steel content of 10 wt.% was
chosen as it is commonly used in literature for waste tyre pyrolysis studies of both operational and
conceptual processes (Fels and Pegg, 2009; Pilusa et al., 2014; Muzenda and Popa, 2015).
The process in this study is based on a tyre feed rate of 30 tons/day. A tyre feed rate of 30 tons/day
was chosen based on information obtained from two operational REDISA-affiliated waste tyre
pyrolysis plants in South Africa that process an average of 20 - 30 tons/day each. A flow rate of 30
tons/day has also been used in several literature waste tyre pyrolysis feasibility studies (Ko et al., 2004;
Fels and Pegg, 2009; Pilusa et al., 2014). A continuous supply of waste tyres is necessary to ensure
sustainability of waste tyre pyrolysis plants (Muzenda and Popa, 2015). As such, a tyre flow rate of 30
tons/day was deemed sufficient to ensure sustainability and to sufficiently perform a realistic
economic feasibility evaluation.
Mode of operation and processing time
Continuous operation was preferred for the process in this study as lower reaction times are preferred
for limonene production and lower residence times will be preferred for the separation steps due to
the heat sensitive nature of hydrocarbons (Turton et al., 2009; Martinez et al., 2013). Continuous
operation also normally involves less operating and labour costs, and easier control of equipment (due
to automation) and product quality (Peters and Timmerhaus, 1991; Sinnott and Towler, 2009).
Stellenbosch University https://scholar.sun.ac.za

55
Continuous operation has also been used for other waste tyre pyrolysis systems in literature (Ko et al.,
2004; Fels and Pegg, 2009).
Plant operating times of 7200 - 7900 hours/year have been used in literature studies of waste tyre
pyrolysis plants (Ko et al., 2004; Fels and Pegg, 2009; Pilusa et al., 2014). According to Sinnott and
Towler (2009), continuous plants usually have 90 - 95% availability, which translates to 7884 - 8332
operating hours/year; 8000 hours were chosen for this study.
Targeted products
The targeted product in the process developed in this study is 95 wt.% purity technical (non-food)
grade limonene (main product), with a targeted overall limonene recovery of ±95%. The process also
produces TDO, crude char, and steel as by-products, which are sold as well. Limonene purity of 95
wt.% is targeted in this study in order to meet market specifications for technical grade limonene,
which is typically 95 wt.% (Wilikins Jr, 1999; Ciriminna et al., 2014). In this study, the remaining 5 wt.%
is expected to be compounds such as trimethylbenzene, p-cymene, indene, methylstyrene,
butylbenzene etc. that have boiling points similar to, or close to that of limonene. A minimum
limonene recovery of ±95% is targeted to ensure high limonene product flow rate given that limonene
yields are typically only 2 - 5 wt.% of the tyre feed on a steel-free basis.
Plant location
In this study, it is assumed that the plant will be located in Cape Town as there is an established
network of tyre depots, transporters and tyre processors. It is assumed that the close proximity of the
plant to tyre depots and availability of transporters will ensure continuous access of raw materials
which will ensure sustainability. Cape Town has a major port in South Africa, and it is assumed that
the existing goods distribution network/system in Cape Town will enable the products from the
process in this study to reach customers.
Selection of simulation software
Various simulation software such as Aspen Plus®, ProSim®, Pro/II®, Hysys®, WinSim DESIGN II®,
ProMax® and ChemCAD® are commonly used for simulation of chemical processes (WinSim Inc, 2012;
Mocke, 2013; Shoaib et al., 2014). Mocke (2013) reported that according to WinSim Inc (2012), there
is little difference between the commonly used chemical engineering simulation software with regards
to features such as component libraries, thermodynamic options and recycle convergence. Aspen
Plus® is a widely used commercial simulation software and it has also been widely used for simulation
of pyrolysis processes of several carbonaceous feedstock such as tyres, coal, biomass etc. (Yan and
Zhang, 1999; Al Amoodi et al., 2013; Hammer et al., 2013; Altayeb, 2015). Aspen Plus® offers various
Stellenbosch University https://scholar.sun.ac.za

56
modules, thermodynamic databases and extensive physical property models capable of simulating the
wide range of chemical process conditions suitable for the pyrolysis process (Yang et al., 2012; Taylor
et al., 2013; Visconti et al., 2015). The Aspen Plus® simulation software will be used for simulation of
the base case process scenario developed in this study.
The design basis developed in this section will be expanded on by detail description of development
of each section of the proposed BFD shown in Figure 15. Description of how each section of the BFD
shown in Figure 15 was developed is detailed in sections 4.3 - 4.6 starting with development of pre-
treatment in section 4.3. Development of each section of the proposed base case process scenario
will include details about the technical information considered and development of the particular
section in Aspen Plus®. The flow of discussion in sections 4.3 - 4.6 follows the hierarchical and stepwise
methodology developed in chapter 2.
4.2. Selection of input-output structure information
The input-output structure (Figure 16) shows the main process streams (Linninger, 2002).
t t t t Waste tyre to
limonene plant
Waste tyres (1250 kg/h) Limonene (28 kg/h)
TDO (523 L/h)
Steel (125 kg/h)
Char (406 kg/h)
DEG (465 kg/h)
Figure 16: Input-output structure of the waste tyres to limonene process in this study
Compounds that make up the feed or products for the process scenario developed in this study were
adopted from studies by Rodriguez et al. (2001), Choi et al. (2014) and Ngwetjana (2017). The study
by Choi et al. (2014) was chosen as the base-literature from which feed and product information was
adapted. The studies by Rodriguez et al. (2001), and by Ngwetjana (2017) were used to provide
necessary additional information not available from the study by Choi et al. (2014).
In selecting the base-literature source to provide input and output information, a criterion was
followed that was twofold: (i) the literature source should have sufficient information necessary for
modelling in Aspen Plus® (feed and product characterisation, product distribution and reactor
Stellenbosch University https://scholar.sun.ac.za

57
operating conditions) (ii) the literature source should also have a reported limonene yield of 2 -5 wt.%
on the basis of a steel-free tyre feed. The limonene yield criterion is a result of what has been shown
in various literature studies that the yield of limonene is typically between 2 and 5 wt.% (Cunliffe and
Williams, 1998a; Qu et al., 2006; Frigo et al., 2014; Danon et al., 2015). The study by Choi et al. (2014)
was found to meet the criteria best as characterisation of both the tyre feed and reactor products was
reported. Most importantly, 74 – 79% characterisation of the oil product was reported from the study
by Choi et al. (2014); significant characterisation of the pyrolysis oil product is rare in literature due to
the complexity of pyrolysis oil. The study conducted by Choi et al. (2014) was as such deemed suitable
for use as the base-literature for input and output information in this study.
The tyre used in the study by Choi et al. (2014) was used as reactor feed for the process developed in
this study. The char product and the compounds identified in the oil product from the study by Choi
et al. (2014) were considered as reactor output for this study. All the oxygen and phosphorous
containing compounds identified in the oil product from the study by Choi et al. (2014) were not
considered as reactor output in this study, as the ultimate analysis of the tyre feed used by Choi et al.
(2014) did not include oxygen and phosphorus.
In a tyre particle, oxygen is normally present due to the moisture contained in the tyre, or the oxygen-
containing compounds that are used in tyre manufacturing. Ultimate analyses of various studies have
shown the moisture content to typically be a maximum of 1 wt.%, whereas the ultimate analyses show
an oxygen content of typically 3 – 5 wt.% on a dry basis (Gonzalez et al., 2001; Laresgoiti et al., 2004;
Banar et al., 2012). During pyrolysis, oxygen-containing products can be formed as decomposition
products of the organic and inorganic components contained in the tyre such as stearic acid, calcium
carbonate, and various other metal oxides (Dai et al., 2001; Rodriguez et al., 2001). In the pyrolysis
gas product, carbon dioxide and carbon monoxide are the most common oxygen-containing
compounds, whereas compounds such as stearic acid, 5,5-dimethylhexanal, phthalimide, etc. have
been identified in TDO by various authors (Conesa et al., 2004; Choi et al., 2014; Frigo et al., 2014).
Various authors that have identified and quantified oxygen-containing compounds amongst their
products have shown that the total combined yield of all these oxygen-containing compounds is
mostly less than 1 wt.% on the basis of the tyre feed (Williams and Brindle, 2002; Berrueco et al., 2005;
Lopez et al., 2010). From the study by Choi et al. (2014), the oxygen and phosphorous containing
compounds identified in the oil accounted for a combined 0.35 wt.% (of the tyre feed) at most, within
the temperature range considered. It is as such expected that omission of these compounds would
have negligible effect on overall reactor product distribution in this study.
Stellenbosch University https://scholar.sun.ac.za

58
The study conducted by Choi et al. (2014) did not report on the characterisation of the (non-
condensable) gas fraction (only the gas yield was reported). Gas characterisation from the study
conducted by Rodriguez et al. (2001) was adapted to represent the gas fraction in this study. The study
conducted by Rodriguez et al. (2001) was chosen to represent the gas fraction of the study by Choi et
al. (2014), as similar reactor configurations were used in those studies. All the oxygen-containing gas
compounds from the study of Rodriguez et al. (2001) were not considered in this study, and the
compositions of remaining gas compounds were normalised to represent 100%. The gas compounds
from the study of Rodriguez et al. (2001) adopted for use in this study were all considered as reactor
output.
In this study, benzene and phenanthrene were chosen to represent the uncharacterised fraction of oil
and n-eicosane was chosen to represent the distillate residue fraction reported by Choi et al. (2014).
Benzene was chosen on the basis of high aromatic content of the oil fraction from the study by Choi
et al. (2014) and that the uncharacterised fraction of oil represented only ±25%. It was assumed that
benzene will be a model compound for all unidentified single-ring aromatic compounds.
Phenanthrene is chosen as the model compound for all unidentified polycyclic aromatic hydrocarbons
(PAHs) in the oil. Cunliffe and Williams (1998a) identified phenanthrenes as having the highest
concentration in the oil amongst PAHs that they extensively characterised. As such, phenanthrene was
deemed sufficient to represent unidentified PAHs in the oil. n-Eicosane was chosen to represent the
distillate residue on the basis that eicosanes were the highest carbon number hydrocarbons identified
by Lopez et al. (2010) who extensively characterised oil compounds up to C20+. Benzene, phenanthrene
and n-eicosane were all considered reactor output compounds as well.
All compounds that form part of the input-output structure for the process in this study are show in
Table A.1 and Table A.2 in appendix A, together with Aspen Plus® reactor yields. Table A.2 also shows
the original and normalised gas compositions from the study conducted by Rodriguez et al. (2001).
4.2.1. Specification of input and output compounds in Aspen Plus®
For the purpose of modelling in Aspen Plus®, tyre and char are regarded as non-conventional
components in this study, since they do not have a defined molecular formula; they were defined
based on their proximate and ultimate analyses. The proximate and ultimate analyses of tyre and char
are shown in Table 16.
Stellenbosch University https://scholar.sun.ac.za
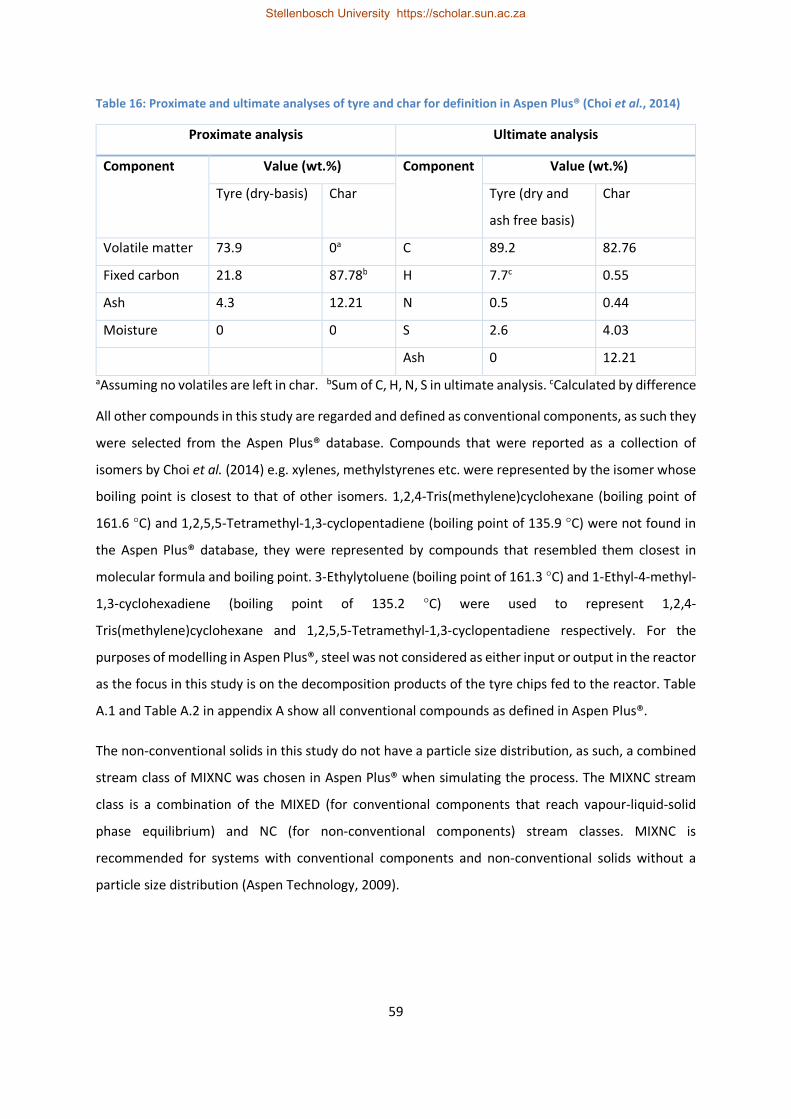
59
Table 16: Proximate and ultimate analyses of tyre and char for definition in Aspen Plus® (Choi et al., 2014)
Proximate analysis Ultimate analysis
Component Value (wt.%) Component Value (wt.%)
Tyre (dry-basis) Char Tyre (dry and
ash free basis)
Char
Volatile matter 73.9 0a C 89.2 82.76
Fixed carbon 21.8 87.78b H 7.7c 0.55
Ash 4.3 12.21 N 0.5 0.44
Moisture 0 0 S 2.6 4.03
Ash 0 12.21
aAssuming no volatiles are left in char. bSum of C, H, N, S in ultimate analysis. cCalculated by difference
All other compounds in this study are regarded and defined as conventional components, as such they
were selected from the Aspen Plus® database. Compounds that were reported as a collection of
isomers by Choi et al. (2014) e.g. xylenes, methylstyrenes etc. were represented by the isomer whose
boiling point is closest to that of other isomers. 1,2,4-Tris(methylene)cyclohexane (boiling point of
161.6 °C) and 1,2,5,5-Tetramethyl-1,3-cyclopentadiene (boiling point of 135.9 °C) were not found in
the Aspen Plus® database, they were represented by compounds that resembled them closest in
molecular formula and boiling point. 3-Ethylytoluene (boiling point of 161.3 °C) and 1-Ethyl-4-methyl-
1,3-cyclohexadiene (boiling point of 135.2 °C) were used to represent 1,2,4-
Tris(methylene)cyclohexane and 1,2,5,5-Tetramethyl-1,3-cyclopentadiene respectively. For the
purposes of modelling in Aspen Plus®, steel was not considered as either input or output in the reactor
as the focus in this study is on the decomposition products of the tyre chips fed to the reactor. Table
A.1 and Table A.2 in appendix A show all conventional compounds as defined in Aspen Plus®.
The non-conventional solids in this study do not have a particle size distribution, as such, a combined
stream class of MIXNC was chosen in Aspen Plus® when simulating the process. The MIXNC stream
class is a combination of the MIXED (for conventional components that reach vapour-liquid-solid
phase equilibrium) and NC (for non-conventional components) stream classes. MIXNC is
recommended for systems with conventional components and non-conventional solids without a
particle size distribution (Aspen Technology, 2009).
Stellenbosch University https://scholar.sun.ac.za

60
4.3. Design of pre-treatment system
The aim of the pre-treatment section is to reduce whole tyres that are used as process feed into tyre
chips, which will be fed to the pyrolysis reactor. The pre-treatment section in this study consists of a
tyre de-beader and a shredder. The PFD of the pre-treatment section is shown in Figure 17.
ST-101S101
S102
DB-101
S103 S104
Figure 17: PFD of the pre-treatment system
Following what was done in the study by Pilusa et al. (2014), the de-beader (DB-101) in this study is
used to remove high tensile reinforcement steel (bead-wire) before the tyres are shredded, so as to
prolong the lifespan of shredding equipment. The steel cords removed by the de-beader (S102) are
sold as scrap steel. In the shredder (ST-101), whole tyres (S103) are shredded down to 50mm x 50mm
chips (S104), which is a tyre chips size commonly used for pyrolysis (Shelly and El-Halwagi, 1999).
The pre-treatment section is not modelled in Aspen Plus® in this study, however, the equipment cost
and power requirements of the de-beader and the shredder are taken into account for economic
evaluation in chapter 5. Table 17 shows the cost and power requirement of each pre-treatment
equipment.
Table 17: Cost and power requirements for pre-treatment equipment
Equipment Cost ($) Power requirements (kW) Reference
DB-101 8000 11 Jiangyin Xinda Machinery (2016)
ST-101 52 200 95 Jiangyin Xinda Machinery (2016)
In terms of energy usage in the pre-treatment section, the shredder accounts for most of the power
requirements (86%) due to the energy intensity of tyre size reduction applications. The pre-treatment
section accounts for 83% of the overall process power requirements, which could be expected to
increase if the tyres chips were to be further reduced in size. It can then be concluded that in order to
Stellenbosch University https://scholar.sun.ac.za
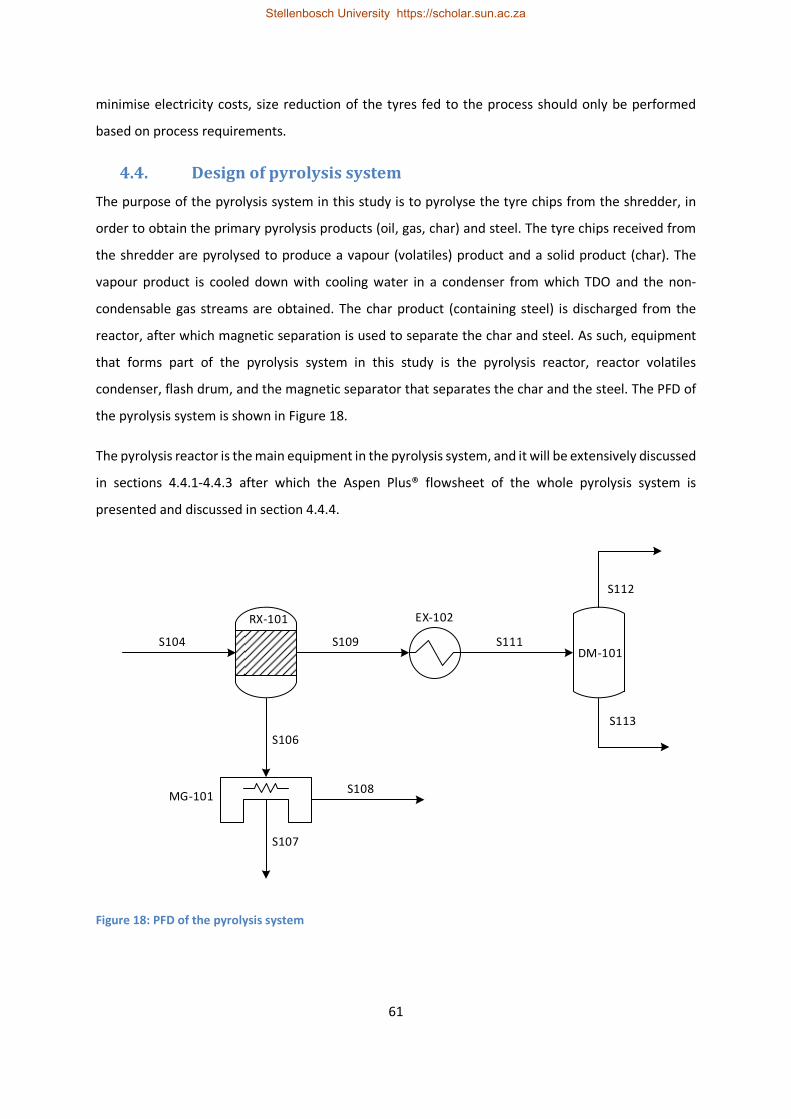
61
minimise electricity costs, size reduction of the tyres fed to the process should only be performed
based on process requirements.
4.4. Design of pyrolysis system
The purpose of the pyrolysis system in this study is to pyrolyse the tyre chips from the shredder, in
order to obtain the primary pyrolysis products (oil, gas, char) and steel. The tyre chips received from
the shredder are pyrolysed to produce a vapour (volatiles) product and a solid product (char). The
vapour product is cooled down with cooling water in a condenser from which TDO and the non-
condensable gas streams are obtained. The char product (containing steel) is discharged from the
reactor, after which magnetic separation is used to separate the char and steel. As such, equipment
that forms part of the pyrolysis system in this study is the pyrolysis reactor, reactor volatiles
condenser, flash drum, and the magnetic separator that separates the char and the steel. The PFD of
the pyrolysis system is shown in Figure 18.
The pyrolysis reactor is the main equipment in the pyrolysis system, and it will be extensively discussed
in sections 4.4.1-4.4.3 after which the Aspen Plus® flowsheet of the whole pyrolysis system is
presented and discussed in section 4.4.4.
RX-101
MG-101
S107
EX-102
DM-101
S113
S112
S104 S109 S111
S108
S106
Figure 18: PFD of the pyrolysis system
Stellenbosch University https://scholar.sun.ac.za

62
4.4.1. Selection of reactor operating conditions
The reactor operating conditions in this study are adopted from the base-literature by Choi et al.
(2014); these were chosen as a temperature of 500 °C and a pressure of 100 kPa (atmospheric
pressure).
The intention of this study was to recover limonene, and as such, reactor temperatures that generally
result in high limonene yields (on the basis of the tyre feed) had to be considered. In literature, various
authors that have varied reactor temperature in their studies have observed maximum limonene
yields at varying temperatures that were within the 400 °C - 500 °C range (Cunliffe and Williams,
1998a; Laresgoiti et al., 2004; Lopez et al., 2010; Choi et al., 2014). At even lower pyrolysis
temperatures such as 300 °C, the yield of limonene (on the basis of tyre feed) is usually low due to low
oil yields, as decomposition of the rubber material would most likely have just begun (Rodriguez et
al., 2001).
The maximum limonene yields obtained within the 400 °C - 500 °C temperature range have indicated
that most authors obtained their highest yields at the lowest temperature used in their studies,
provided that it was higher than 400 °C. It is however also evident that some authors obtained
maximum limonene yields that were higher than maximum yields obtained at temperatures lower
than their corresponding “optimum” temperatures (Cunliffe and Williams, 1998a; Li et al., 2004; Choi
et al., 2014). This could be due to a combination of other variables that affect product distribution
(besides temperature), tyre formulation etc., as pointed out by Danon et al. (2015).
The study by Choi et al. (2014) reported a maximum limonene yield at 500 °C (the lowest in their
temperature range), which is higher than maximum yields obtained at temperatures lower than 500 °C
in other studies such as those by Laresgoiti et al. (2004), Li et al. (2004) etc. Based on what is currently
available in literature, the temperature of 500 °C was chosen as the reactor temperature for use in
this study. Several TGA studies have also indicated that tyre samples with a combination of different
rubber types show final weight loss at temperatures of 450 °C - 500 °C, which has necessitated the
opinion that pyrolysis should be complete at 500 °C (Leung and Wang, 1998; Senneca et al., 1999; Choi
et al., 2014). It also on the back of this information that 500 °C was selected.
The pressure of 100 kPa was chosen to remain consistent with the pressure at which the experimental
results were obtained by Choi et al. (2014). A pyrolysis pressure of 100 kPa has also been the preferred
operating pressure for several studies in literature (Cunliffe and Williams, 1998a; Rodriguez et al.,
2001; Conesa et al., 2004; Frigo et al., 2014).
Stellenbosch University https://scholar.sun.ac.za

63
4.4.2. Reactor product distribution
Reactor product distribution was determined by calculating the yields of all compounds regarded as
reactor output in section 4.2. The yields of compounds considered as reactor output were based on
the yields of the main pyrolysis product fractions reported by Choi et al. (2014), shown in Table 18.
The experimental study conducted by Choi et al. (2014) also reports on characterisation of the oil
fraction and the composition of the different compounds identified in the oil. The compositions of
some of the compounds in the oil and the yield of oil (at 500 °C) were used to calculate the mass yields
of the particular compounds (from tyre) for the base case temperature of 500 °C. The yield of oil was
calculated using correlation equations that are explained in section 4.4.2.1. The yield of n-eicosane
(distillation reside) was used as reported in Table 18 at 500 °C. The yield of char was also calculated
from correlation equations that are described in section 4.4.2.1. The normalised gas composition
adapted from the study by Rodriguez et al. (2001) and the yield of gas from Table 18 were used to
calculate the mass yields of gas compounds (except hydrogen sulphide) from tyre at 500 °C.
The yields of benzothiazole and hydrogen sulphide were calculated by performing elemental mass
balances for nitrogen and sulphur respectively. Benzothiazole and hydrogen sulphide had the highest
mass fractions of nitrogen and sulphur respectively, amongst all nitrogen and sulphur compounds
identified. Manipulating the respective yields of benzothiazole and hydrogen sulphide for elemental
mass balance calculations would result in minimal deviation from their respective experimentally
determined yields. The yield of phenanthrene was specified as 0.0097 (wt/wt) which was the total
PAH concentration at 500 °C from the study conducted by Cunliffe and Williams (1998a). The yield of
benzene was calculated by closing the overall mass balance within the reactor. The equations used for
calculation of the reactor product distribution are shown in appendix B.1.
Table 18: Yields of pyrolysis products with temperature (Choi et al., 2014)
Reaction
temperature (°C)
Yields (wt.%)
Char Oil Gas Distillation residue
500 36.7 38.3 22.6 2.42
600 36.6 30.9 28.7 3.79
700 37.1 30.5 29.5 3.00
800 36.9 29.8 30.1 3.29
Stellenbosch University https://scholar.sun.ac.za

64
4.4.2.1. Correlation equations for yield prediction
Similarly to the studies of Yan and Zhang (1999) and Abdelouahed et al. (2012), correlation equations
were developed to express the yields of certain compounds in this study. Both Yan and Zhang (1999)
and Abdelouahed et al. (2012) developed correlation equations to describe the yields of certain
chosen compounds from the pyrolysis reactor as functions of the reactor temperature. The
experimental data which was used as input for the models of Yan and Zhang (1999) and Abdelouahed
et al. (2012) was used to generate the correlation equations. In this study, the reported composition
in product fraction and the yields of product fractions from the study by Choi et al. (2014) (shown in
Table 18) were used to generate correlation equations.
Detailed information of how the correlation equations were developed and the compounds for which
the equations were developed is provided in appendix B.2. Yields predicted by correlation equations
were compared with literature reported yields for the different compounds, the comparison was used
for model validation as is explained in section 4.4.3.
4.4.3. Model validation
Due to the complexity of pyrolysis oil(s) and wide variation in the yields of the pyrolysis products,
development of a generic model that can be used to predict the production distribution of a waste
tyre pyrolysis reactor is often difficult. The reactor model in this study is thus validated by the accuracy
of the correlation equations in predicting the yields of the particular compounds for which correlation
equations were developed, within the temperature range of 500 – 800 °C. The product yields
calculated from the correlation equations are accepted to within ±10% accuracy of the literature yields
of the respective compounds for validation in this study. The product yields predicted by the
correlation equations are compared with experimental yields from the study by Choi et al. (2014).
Results of validation of the model are shown in Figure 19 to Figure 23, and Table 19.
Stellenbosch University https://scholar.sun.ac.za

65
Figure 19: Choi et al. (2014) and model predicted yields of oil and char at various temperatures
Figure 20: Choi et al. (2014) and model predicted yields of several individual compounds at 500 °C
0
5
10
15
20
25
30
35
40
45
500 600 700 800
Yie
ld (
wt.
%)
Temperature (°C)
Oil- Choi et al. (2014) Oil- model predicted Char- Choi et al. (2014) Char- model predicted
0
0.5
1
1.5
2
2.5
3
Yie
ld (
wt.
%)
Choi et al. (2014) Model predicted
Stellenbosch University https://scholar.sun.ac.za

66
Figure 21: Choi et al. (2014) and model predicted yields of several individual compounds at 600 °C
Figure 22: Choi et al. (2014) and model predicted yields of several individual compounds at 700 °C
0
0.5
1
1.5
2
2.5Y
ield
(w
t.%
)
Choi et al. (2014) Model predicted
0
0.5
1
1.5
2
2.5
Yie
ld (
wt.
%)
Choi et al. (2014) Model predicted
Stellenbosch University https://scholar.sun.ac.za

67
Figure 23: Choi et al. (2014) and model predicted yields of several individual compounds at 800 °C
Table 19: Deviation of model-predicted yields from yields obtained by Choi et al. (2014)
Compound Yield prediction error (%)
500 °C 600 °C 700 °C 800 °C
Oil -0.95 3.51 -3.60 1.23
Char -1.77 -1.56 -0.76 0.76
Trimethylbenzene -1.64 4.25 -5.81 0.45
Naphthalene -1.99 1.33 -0.39
Dimethylstyrene 1.49 -3.56 5.62 -0.70
Dimethylquinoline 0.01 -2.60 0.83 -3.37
Dimethylnaphthalene 1.98 -9.62 6.94 -6.84
Indene -1.61 2.95 -2.26 0.75
Methylindene -5.02 7.52 -6.76 0.88
Tetramethylbenzene 1.48 -5.91 8.99 -2.78
Methylnaphthalene 1.29 -3.97 2.46 -1.99
Dimethylindane 8.20 -0.42 2.33 -1.64
From Figure 19, it can be seen that the results of model prediction fit closely with the experimental
data for all temperatures considered. It can be inferred from Figure 19 that the model can accurately
predict almost all of the product distribution of the main product fractions, as the yield of gas can then
0
0.5
1
1.5
2
2.5Y
ield
(w
t.%
)
Choi et al. (2014) Model predicted
Stellenbosch University https://scholar.sun.ac.za

68
just be calculated by difference (yield of distillate residue is small relative to yield of oil, char and gas).
Comparison of literature and model-predicted yields for all other (individual) compounds for which
correlation equations were developed is shown in Figure 20 to Figure 23 for various temperatures. It
can also be seen from Figure 20 to Figure 23 that the model gives good prediction of the yields of
those individual compounds at all temperatures considered.
From Table 19, it can be seen that the differences between all model-predicted yields and
experimental yields are within ±10% of the experimental yields, which further proves the accuracy of
model prediction. The error in Table 19 was calculated according to Equation 1.
Error = ��� , model− �� , exp �� , exp � ∗ 100
Equation 1
�� ,model is the model-predicted yield of compound i, and �� , exp is the yield of compound i from the
literature by Choi et al. (2014), both in (wt.%).
4.4.4. Aspen Plus® simulation of the pyrolysis system
For development of the simulation flowsheet of the pyrolysis system, it was assumed that the system
is at steady-state. The steady-state assumption is applied for development of simulation flowsheets
of all other sections in this study unless otherwise specified.
4.4.4.1. Selection and validation of thermodynamic model
Before a flowsheet can be developed in Aspen Plus®, a thermodynamic model has to be selected. The
Peng-Robinson with Boston-Mathias alpha function (PR-BM) thermodynamic model was chosen for
calculation of physical properties for all conventional components for the pyrolysis section. The
HCOALGEN and DCOALIGT property models were used to calculate the enthalpy and density of the
non-conventional components (tyre and char) respectively (based on the proximate and ultimate
analyses provided by Choi et al., 2014). The property models used for the pyrolysis section are also
used for all other section in this study unless otherwise specified. Detailed description of the
procedure followed for selection of the thermodynamic model(s) used in this study is provided in
Appendix B.3.
Validation of thermodynamic model
Enthalpy is an important thermodynamic property for calculation of energy balances, with heat
capacity data central to calculation of enthalpies of any given system. Cubic equations of state (EOS)
like the PR-BM model calculate fluid properties as if the fluid were composed of one (imaginary)
Stellenbosch University https://scholar.sun.ac.za
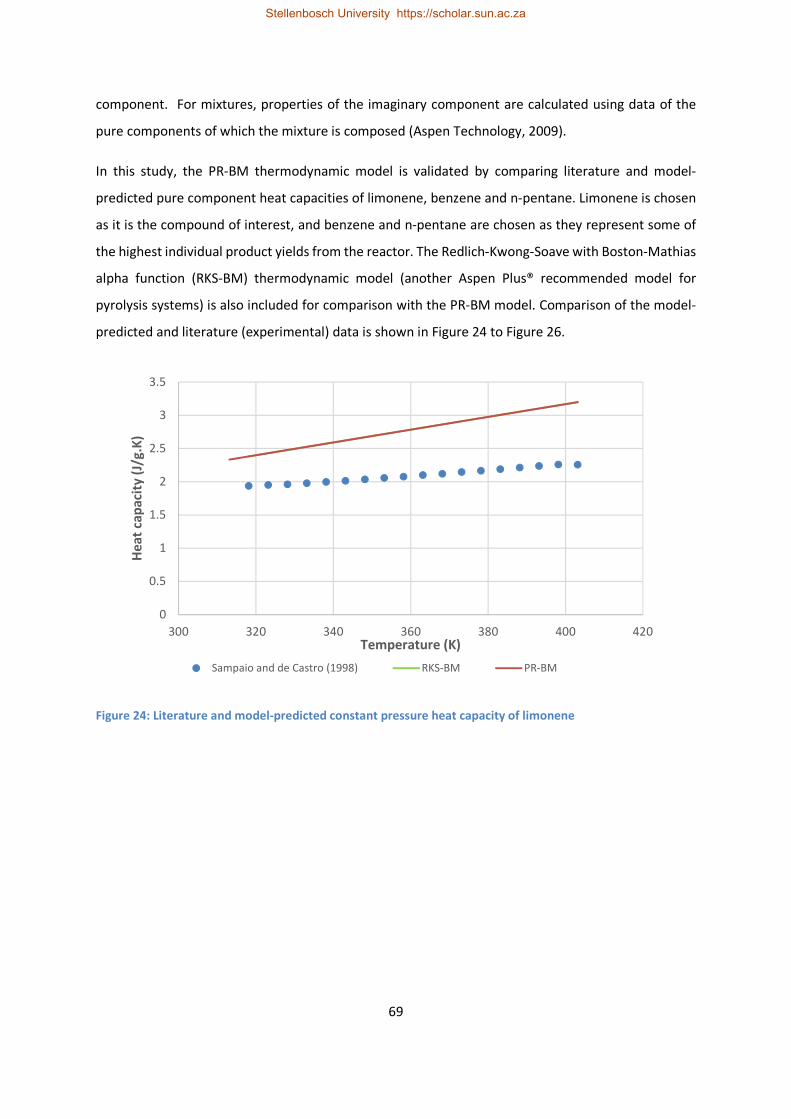
69
component. For mixtures, properties of the imaginary component are calculated using data of the
pure components of which the mixture is composed (Aspen Technology, 2009).
In this study, the PR-BM thermodynamic model is validated by comparing literature and model-
predicted pure component heat capacities of limonene, benzene and n-pentane. Limonene is chosen
as it is the compound of interest, and benzene and n-pentane are chosen as they represent some of
the highest individual product yields from the reactor. The Redlich-Kwong-Soave with Boston-Mathias
alpha function (RKS-BM) thermodynamic model (another Aspen Plus® recommended model for
pyrolysis systems) is also included for comparison with the PR-BM model. Comparison of the model-
predicted and literature (experimental) data is shown in Figure 24 to Figure 26.
Figure 24: Literature and model-predicted constant pressure heat capacity of limonene
0
0.5
1
1.5
2
2.5
3
3.5
300 320 340 360 380 400 420
He
at
cap
aci
ty (
J/g
.K)
Temperature (K)
Sampaio and de Castro (1998) RKS-BM PR-BM
Stellenbosch University https://scholar.sun.ac.za

70
Figure 25: Literature and model-predicted constant pressure heat capacity of benzene
Figure 26: Literature and model-predicted constant pressure heat capacity of n-pentane
Figure 24 to Figure 26 show that there is overestimation of heat capacities of the selected compounds
using the PR-BM thermodynamic model; errors in estimation of the pure component heat capacities
could result in inaccurate energy balance calculations. As such, the overall energy balance results from
the simulation should be used with caution. However, despite the errors in estimating the heat
capacities of the selected components, it can be seen that the PR-BM model still does give reasonable
estimation for purposes of preliminary feasibility studies such as the current study. Figure 24 to Figure
0
0.5
1
1.5
2
2.5
250 260 270 280 290 300 310 320 330 340 350
He
at
cap
aci
ty (
J/g
.K)
Temperature (K)Oliver et al. (1948) RKS-BM PR-BM
0
0.5
1
1.5
2
2.5
3
3.5
190 210 230 250 270 290 310
He
at
cap
aci
ty (
J/g
.K)
Temperature (K)Messerly et al. (1967) RKS-BM PR-BM
Stellenbosch University https://scholar.sun.ac.za
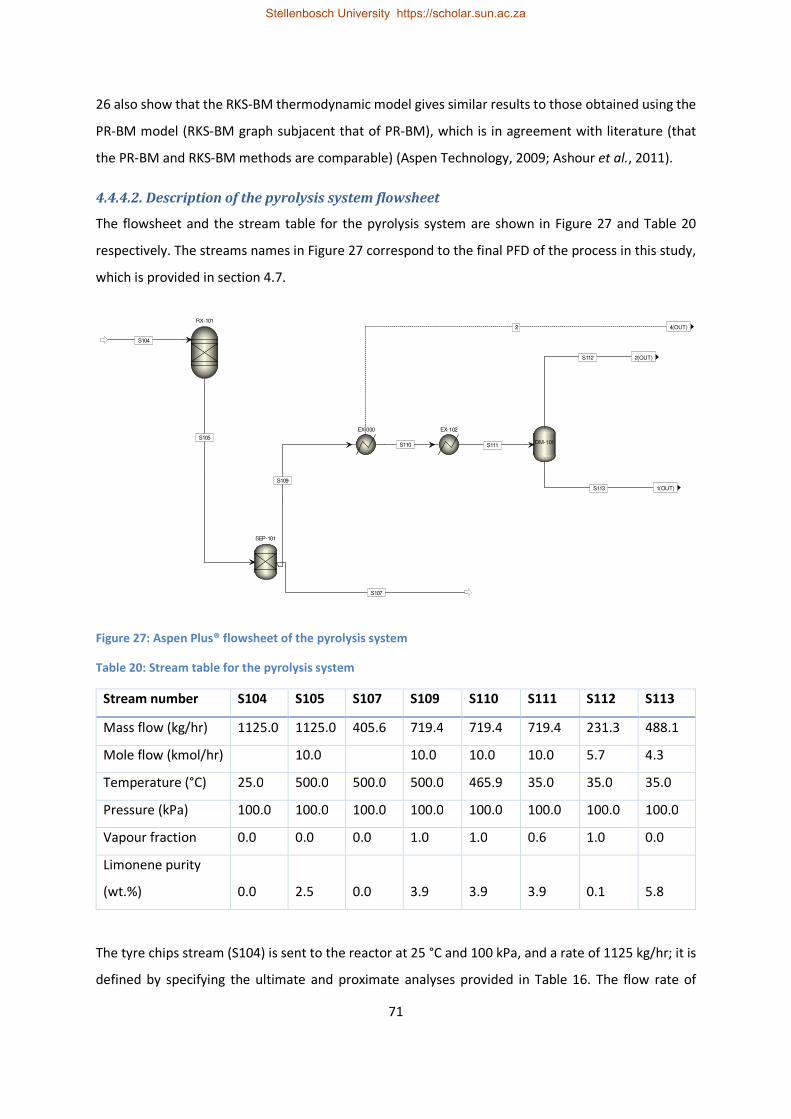
71
26 also show that the RKS-BM thermodynamic model gives similar results to those obtained using the
PR-BM model (RKS-BM graph subjacent that of PR-BM), which is in agreement with literature (that
the PR-BM and RKS-BM methods are comparable) (Aspen Technology, 2009; Ashour et al., 2011).
4.4.4.2. Description of the pyrolysis system flowsheet
The flowsheet and the stream table for the pyrolysis system are shown in Figure 27 and Table 20
respectively. The streams names in Figure 27 correspond to the final PFD of the process in this study,
which is provided in section 4.7.
Figure 27: Aspen Plus® flowsheet of the pyrolysis system
Table 20: Stream table for the pyrolysis system
Stream number S104 S105 S107 S109 S110 S111 S112 S113
Mass flow (kg/hr) 1125.0 1125.0 405.6 719.4 719.4 719.4 231.3 488.1
Mole flow (kmol/hr)
10.0
10.0 10.0 10.0 5.7 4.3
Temperature (°C) 25.0 500.0 500.0 500.0 465.9 35.0 35.0 35.0
Pressure (kPa) 100.0 100.0 100.0 100.0 100.0 100.0 100.0 100.0
Vapour fraction 0.0 0.0 0.0 1.0 1.0 0.6 1.0 0.0
Limonene purity
(wt.%) 0.0 2.5 0.0 3.9 3.9 3.9 0.1 5.8
The tyre chips stream (S104) is sent to the reactor at 25 °C and 100 kPa, and a rate of 1125 kg/hr; it is
defined by specifying the ultimate and proximate analyses provided in Table 16. The flow rate of
SEP-101
RX-101
EX-102
DM-101
EX-000
S107
S104
S105
S109
S111
S112 2(OUT)
S113 1(OUT)
S110
2 4(OUT)
Stellenbosch University https://scholar.sun.ac.za

72
stream S104 has been adjusted to represent 90% of the total tyre feed rate as steel has not been
considered for simulation purposes in this study. A very small flow rate of char was also specified in
the input sheet of stream S104 to allow activation of the component attribute tab for specification of
the proximate and ultimate analysis of char.
The tyre feed is pyrolysed in the reactor (RX-101) which operates at a temperature of 500 °C and a
pressure of 100 kPa. A total energy input of 544 kW is required in RX-101 for pyrolysis of the tyre chips
at the specified operating conditions. The heating requirements of RX-101 represents all of the heat
energy required in the pyrolysis section, and 73% of the final heat energy required by the whole
process in this study. The contribution of the pyrolysis reactor to the overall process heat energy
requirements in this study is similar to that of Pilusa et al., 2014, who mentioned that the pyrolysis
reactor (heat duty of 468 kW) accounted for 70% of the overall heating energy requirements of their
waste tyre pyrolysis process. It therefore implies that any feasible opportunity that could minimise
utility usage in RX-101 has to be taken into account in order to reduce utility costs for the process in
this study.
RX-101 has been modelled as a yield reactor block (RYIELD), which uses specified yields to determine
the product distribution. The reactor product distribution was calculated using a calculator block
(YIELDS) based on mass balance equations described in section 4.4.2. The RYIELD reactor model was
preferred for this study as it is useful when reaction stoichiometry and kinetics are unknown, and yield
distribution data or correlations are available (Aspen Technology, 2009). The following assumptions
were made for the reactor model:
• Effects of particle size are negligible (feed is of uniform size)
• Reactor is uniformly heated and feed is uniformly distributed in the reactor
• Heat and mass transfer limitations are negligible
• Reaction kinetics are not considered (pyrolysis involves complex reactions, yields are used)
• Gas products are uniformly distributed within the reactor
• No oxygenated compounds are formed (Choi et al., 2014 ultimate analysis does not report
oxygen)
• Unknown fraction of oil can be represented by benzene and phenanthrene (major oil fraction
is aromatic for temperatures reported by Choi et al., 2014. Unknown fraction only ±25%)
The RYIELD reactor model requires that the sum of all specified yields add up to 1, it is for this reason
that the yield of benzene was calculated as the remaining fraction required to add up to 1. The RYIELD
reactor model performs an atom balance of all elements specified in the ultimate analysis, elemental
Stellenbosch University https://scholar.sun.ac.za

73
mass balances were performed for sulphur and nitrogen by the calculator block. An allowance of ±5%
was given for the elemental mass balances of carbon and hydrogen to allow the overall reactor mass
balance to close in order to avoid normalisation of the product yields. As a result of the ±5% allowance,
a tolerance of 6% was specified for the reactor mass balance in Aspen Plus®.
The reactor product stream (S105) (char and volatiles) is sent for separation in SEP-101, which has
been modelled as a (SEP) separation block. The SEP block separates the feed components based on
user-specified split fractions. The non-conventional components (char) report to the char product
stream (S107) and all the conventional components report to the volatiles stream (S109). In reality,
SEP-101 is not an actual equipment but only represents exit of the volatiles and the char from the
reactor via their respective exit channels.
The volatiles stream is then slightly cooled down from 500 °C to 466 °C in EX-000 by exchanging heat
with the oil feed to T-101 (S114 in the separation section). EX-000 is in reality not a real heat
exchanger, but represents the tube side of EX-101 (shown in the separation flowsheet). The exchange
of heat between the volatiles and S114 is represented by heat stream 2, which is sent to the separation
section as stream 4(OUT). EX-000 has a heat duty of 19 kW, which means that cooling S109 by heat
exchange with S114 saves 19 kW of both cooling and heating utilities that would have additionally
been required to cool S109 and heat up S114 respectively.
The volatiles stream exiting EX-000 (S110) is then cooled down to 35 °C in EX-102, and some of the
components condense out to give the oil fraction, while the non-condensables remain in the gas
phase. Determination of the temperature at which EX-102 should operate is detailed in section 4.5.1
as EX-102 outlet temperature is influenced by the overall recovery of limonene (from the reactor) in
the limonene-rich stream in this study. EX-102 has a heat duty of -235 kW, and accounts for all cooling
requirements in the pyrolysis section whereas it accounts for 52% of the cooling requirements of the
whole process.
The oil-gas mixture stream from EX-102 (S111) is then separated out in a knockout drum (DM-101),
which has been modelled using a FLASH 2 separator block, with a specified pressure of 100 kPa and a
heat duty of 0 kW. The non-condensables stream (S112) is sent to the heat recovery section as stream
2(OUT) and the condensed oil stream (S113) is sent to the separation section as stream 1(OUT).
4.5. Design of separation system
The purpose of the separation system in this study is to upgrade the raw pyrolysis oil/TDO stream
(S113) coming from the pyrolysis section into (the high value) limonene, through various distillation
Stellenbosch University https://scholar.sun.ac.za

74
techniques. The separation system in this study would typically not be found in conventional waste
tyre pyrolysis plants that generally only focus on production of primary products. The limonene stream
produced in this study is desired to be of at least 95 wt.% purity in order to meet market standards.
Any residual liquid streams from the separation system are recombined and sold as TDO product. The
PFD and stream names of the separation system are shown in Figure 28 and Table 21 respectively. All
equipment names and stream names correspond to the final PFD, equipment list and stream names
in section 4.7.
Brief description of the separation system
The separation system is briefly described here; detailed description is presented in section 4.5.2.2,
where the Aspen Plus® model of the separation system is discussed. The separation system in this
study consists of 4 distillation columns (main unit operations), with accessory (minor) units such as
pumps and heat exchangers, in between the columns, depending on process requirements.
The temperature of the feed stream to the separation system (S113) has to be carefully selected as it
determines the amount of limonene from the reactor volatiles that gets sent to the separation system,
and also has a huge influence on operation of the first fractionation columns (T-101 and T-102). The
temperature of stream S113 was determined by a sensitivity analysis of the operating temperature of
the reactor volatiles condenser (EX-102 in Figure 27). The procedure for EX-102 sensitivity analysis is
explained in section 4.5.1.
Due to the presence of close boiling compounds to limonene in the raw TDO from the pyrolysis
reactor, a limonene-rich stream/cut is first produced using fractional distillation. The limonene-rich
cut in this study was based on the experimental work of Pakdel et al. (2001), which included
compounds within around ±8 °C of the boiling point of limonene. Production of the limonene-rich cut
is achieved using T-101 and T-102 in the process shown in Figure 28.
The raw TDO from the pyrolysis section is pumped (by PC-101), pre-heated (in EX-101), and is then fed
to T-101, where the components lighter than the limonene cut are removed as vapour and liquid
distillate streams. The bottoms stream from T-101 is then fed to T-102, where the components heavier
than the limonene cut are removed as bottoms products, and the limonene-rich cut is obtained as the
distillate product. The liquid distillate from T-101 and the bottoms from T-102 are recombined to form
part of the TDO product, which is sold to the market.
The limonene-rich stream is then pumped (by PC-102) and it is fed to an extractive distillation column
(T-103), where diethylene glycol (DEG) is introduced to remove most of the impurities, thereby
Stellenbosch University https://scholar.sun.ac.za

75
obtaining a limonene stream of (minimum) 95 wt.% limonene purity as distillate. The solvent (with the
entrained impurities) is sent to a distillation column (T-104), where it is regenerated by stripping off
the impurities entrained from T-103; the solvent is recovered as bottoms product. A fraction of the
regenerated solvent is then purged off to minimise build-up of the remaining impurities in the system.
The remaining fraction of the solvent (after purging) is combined with a (fresh) solvent make-up
stream, cooled down (in EX-103), and then recycled back for use in T-103. The distillate product from
T-104 goes to form the remaining part of the TDO product, which is cooled down in EX-104 before
storage.
Stellenbosch University https://scholar.sun.ac.za

76
T-101
T-102
S118
T-103
PC-102
S119
S121
T-104
S126
S128S120
S127
EX-103
EX-104
PC-101
EX-101
S115
S114
S117
S124
S122 S123
S130
S113
S131 S132
S116
S129
S125
Figure 28: PFD of the separation system
Stellenbosch University https://scholar.sun.ac.za
Stellenbosch University https://scholar.sun.ac.za

77
Table 21: Stream names for the separation system
Stream name Description
S111 Condensed volatiles
S112 Pyrolysis gas
S113 Raw pyrolysis oil/TDO
S114 Pressurised pyrolysis oil
S115 Warm pyrolysis oil feed
S116 T-101 vapour distillate
S117 T-101 liquid distillate
S118 T-101 bottoms product
S119 Limonene-rich stream
S120 T-102 bottoms product
S121 Pressurised limonene-rich stream
S122 DEG make-up
S123 Hot DEG feed
S124 Cool DEG feed
S125 Limonene product
S126 DEG-rich stream
S127 Aromatics product
S128 DEG product
S129 DEG purge
S130 DEG recycle
S131 Hot TDO product
S132 Cool TDO product
4.5.1. Determination of EX-102 operating temperature
For operation of EX-102, two possible scenarios were considered with respect to condenser operation:
Scenario 1: Cooling the hot reactor vapours to a specific temperature in a single condenser to obtain
pyrolysis oil, heating the oil up to a specific temperature, and then feeding the oil to the separation
columns. The PFD of scenario 1 is shown in Figure 29. The stream names in Figure 29 correspond to
those shown in Table 21.
Stellenbosch University https://scholar.sun.ac.za

78
In scenario 1, the hot pyrolysis reactor vapours are cooled down from 500 °C to a temperature range
of 35 °C to 210 °C (at 210 °C and above, no oil is condensed) in EX-102, and then the condensed
pyrolysis oil is separated from the non-condensable pyrolysis gas in DM-101. The temperature of 35 °C
was chosen as the minimum achievable temperature with cooling water, assuming inlet and outlet
temperatures of 25 °C and 40 °C respectively for the cooling water, with a 10 °C minimum temperature
approach in the heat exchangers. The condensed oil is then sent for separation in T-101 and T-102
with the intention of producing a limonene-rich stream.
The cooling water inlet temperature of 25 °C was chosen as a conservative estimate for this study
based on monthly average design wet bulb temperatures for the DF Malan and Cape Town
international airport weather stations published by ASHRAE Inc (2005; 2013). According to these
publications, the design wet bulb temperatures for the DF Malan and Cape Town international airport
weather stations are around 20 °C - 22 °C for the hottest months. For design and sizing of cooling
towers, the highest wet bulb temperatures experienced in a particular location would be used as
design reference to ensure that the cooling tower can deliver the required cooling even in the hottest
months. A cooling water inlet temperature of 25 °C has also been used in other process design studies
in literature (Diederichs, 2015). A cooling water temperature increase of 15 °C was adopted from
Seider et al. (2004).
Scenario 2: Feeding the hot reactor vapours to the separation columns without any cooling stage.
Scenario 2 is shown in Figure 30. The stream names in Figure 30 also correspond to those shown in
Table 21.
In scenario 2, the hot pyrolysis vapour are sent straight from the reactor (at the reactor temperature)
for separation in T-101 and T-102 without any cooling (EX-102 is not required in this scenario).
In both scenario 1 and 2, T-101 is used to separate the components lighter than the limonene cut
(taken as distillate) and T-102 is used to separate the components heavier than the limonene cut, with
the limonene-rich stream taken as distillate. The choice of column sequencing was based on
recommendations from Sinnott and Towler (2009) who recommend that lighter components (and
non-condensables) should be separated first. Separating lighter components and non-condensables
first avoids the use of refrigerants and high pressures in the whole separation process (Sinnott and
Towler, 2009). It is also recommended that desired products be obtained as distillate, as it is easier to
control the purity of the distillate stream (Sinnott and Towler, 2009).
Stellenbosch University https://scholar.sun.ac.za

79
RX-101
T-101
DM-101
EX 102
T-102
S104
S110
S107
S111
S112
S116
S113
S118
S117
S119
S120
Figure 29: PFD of scenario 1
RX-101
T-101
T-102
S104
S109
S107
S116
S118
S117
S119
S120
Figure 30: PFD of scenario 2
Stellenbosch University https://scholar.sun.ac.za

80
Scenario 1 and 2 were compared on the basis of limonene recovery (from reactor volatiles) fed to T-
101 (S113 in Figure 29 and S109 in Figure 30 respectively), total energy usage, preliminary estimation
of subsequent column diameters, and preliminary estimated capital and operating costs. In both
scenarios, it is desired to have as much recovery of limonene in the respective feed streams to T-101
as possible (100% ideally). The limonene recovery targets of T-101 and T-102 were similar in both
scenarios (99%), hence the recovery of limonene is considered at T-101 feed stream for comparison
purposes. A targeted recovery of 99% (in T-101 and T-102) was chosen based on guidelines from
Sinnott and Towler (2009) that recovery of key components is typically aimed at 99% for distillation
column design purposes. Energy usage for each scenario was calculated using Aspen Plus®, preliminary
column diameter sizes were calculated using column sizing guidelines from Sinnott and Towler (2009).
Preliminary column costs were calculated using the bare module costing technique from Turton et al.
(2009), and preliminary operating costs were manually calculated.
Comparison of scenario 1 and 2
The recovery of limonene in T-101 feed stream (S113 in Figure 29) with varying EX-102 temperature
for scenario 1 is shown in Figure 31. It can be seen that 99.4% of the limonene from the reactor can
be recovered in S113 at the minimum possible temperature of 35 °C, and the recovery decreases
sharply with an increase in temperature. Based on Figure 31, it can be concluded that the minimum
possible EX-102 temperature of 35 °C is thus desirable for scenario 1, as the limonene recovery is
highest at this temperature (since the aim is to maximise limonene recovery).
For scenario 2, the recovery of limonene in T-101 feed stream (S109 in Figure 30) is 100% since the
reactor volatiles are sent straight for separation as they come out of the reactor.
Stellenbosch University https://scholar.sun.ac.za

81
Figure 31: Recovery of limonene in oil stream with EX 102 temperature for scenario 1
Since all the reactor volatiles are sent to T-101 in scenario 2, one challenge becomes operation of the
column condenser in such a way that no refrigerants are required to cool the column overhead stream,
as the reactor volatiles contain non-condensable gases as well. As such, energy usage and preliminary
cost evaluation for T-101 in scenario 2 were performed with a condenser vapour fraction of 0.95,
which ensured that cooling in the condenser could be achieved with cooling water. The condenser
vapour fraction of 0.95 was determined by a sensitivity analysis of condenser outlet temperature with
varying vapour fraction using Aspen Plus®. It should also be taken into account that the high T-101
condenser vapour fraction of scenario 2 could also imply that some compounds that would normally
have been in the liquid distillate stream would be lost to the vapour distillate stream. Loss of those
compounds to the vapour distillate would mean reduced TDO product flow rate or the need for
additional equipment to recover them as liquid product.
The results of comparison between scenario 1 and scenario 2 on an energy usage and cost evaluation
basis are shown in Table 22. Similar S118 results are obtained for both scenarios, and as such, T-102
costing and energy usage is not included in Table 22. It can be observed that scenario 2 requires a
larger column (T-101), and the total cooling and heating duties for scenario 2 are higher than for
scenario 1. The larger column size for scenario 2 can be explained by the large volume of vapour sent
to T-101 in that particular scenario as the column size is dependent on the vapour flow rate (Sinnott
and Towler, 2009). Results of preliminary cost estimation show that scenario 2 requires higher capital
and operating costs due to the larger diameter and higher energy usage as compared to scenario 1.
0
10
20
30
40
50
60
70
80
90
100
35 50 65 80 95 110 125 140 155 170 185 200 215 230
Lim
on
en
e r
eco
ve
ry (
%)
Temperature (°C)
Stellenbosch University https://scholar.sun.ac.za

82
Table 22: Preliminary energy usage and cost evaluation for scenario 1 and 2
Parameter Scenario 1 Scenario 2
Column diameter (m) 0.5 0.82
Theoretical number of stages 75 66
EX 102 duty (kW) -235 0
Condenser duty (kW) -95 -410
Reboiler duty (kW) 107 203
Estimated capital cost ($) 459 034 505 000
Estimated operating costs ($/year) 214 943 276 240
Based on the recovery of limonene shown in Figure 31, and the results from Table 22, scenario 1 was
chosen as the preferred configuration in this study, and it was the configuration used for modelling in
Aspen Plus®. Description of the Aspen Plus® flowsheet for the separation system is presented in
section 4.5.2.
4.5.2. Aspen Plus® simulation of the separation system
4.5.2.1. Selection and validation of thermodynamic model
Simulation of the separation section in Aspen Plus® involved the use of two thermodynamic models.
The PR-BM thermodynamic model was used for estimation of physical properties for unit operations
involved in fractional distillation (T-101 and T-102). For the solvent recovery section (T-103 and T-104),
the non-random two-liquid (NRTL) property model has been used for prediction of thermodynamic
properties of components in this study. The universal function activity coefficient (UNIFAC) property
model was used to estimate missing binary parameters for the NRTL property model in this study.
Validation of thermodynamic model
For separation in the TDO (multi-component) system, it would ideally be desirable to accurately
account for the equilibrium phase behaviour of each component present in the TDO, and every
possible interaction between the components of the TDO. For such, experimentally determined
vapour-liquid equilibrium (VLE) and vapour-liquid-liquid equilibrium (VLLE) data would be required;
however, such VLE and VLLE data (especially for systems involving limonene) is limited in the open
literature.
In this study, the thermodynamic models chosen for the separation section are validated by comparing
the model-predicted, and readily available experimental binary VLE data of a p-cymene + limonene
Stellenbosch University https://scholar.sun.ac.za

83
system (at 101 kPa) from the work of Tong et al. (2009) (as reported by Ngwetjana, 2017). The PR-BM
and NRTL models are tested for validation, and additionally, the RKS-BM and UNIQUAC models are
also shown for comparison. For the NRTL and UNIQUAC models, binary interaction parameter
estimation is performed using the UNIFAC model. The results of VLE data comparison are shown in
Figure 32.
Accurate pure component vapour pressure estimation is also essential in determining the distribution
of various species between various phases in a given system, especially when using activity coefficient
models (for calculation of activity coefficients using Raoult’s law as a basis) (Aspen Technology, 2009).
Calculations with Raoult’s law will largely be influenced by species that have high concentrations
within a particular liquid mixture. In this study, prediction of the pure component vapour pressures of
limonene, p-cymene, and the solvent (diethylene glycol) using all the 4 models is performed and
compared with experimental data as a further validation step. The results of pure component vapour
pressure comparison are shown in Figure 33 to Figure 35.
Figure 32: Diagram of binary VLE data of p-cymene + limonene at 101 kPa
176.2
176.4
176.6
176.8
177
177.2
177.4
177.6
177.8
0 0.1 0.2 0.3 0.4 0.5 0.6 0.7 0.8 0.9 1
Te
mp
era
ture
(°C
)
p-Cymene vapour and liquid mole fraction
Tong et al. (2009) Tong et al. (2009) PR-BM RKS-BM NRTL UNIQUAC
Stellenbosch University https://scholar.sun.ac.za

84
Figure 33: Literature and model-predicted pure component vapour pressure diagram for d-limonene
Figure 34: Literature and model-predicted pure component vapour pressure diagram for p-cymene
0
25
50
75
100
125
150
175
200
225
250
300 320 340 360 380 400 420 440 460 480 500
Va
po
ur
pre
ssu
re (
kP
a)
Temperature (K)
Clara et al. (2009) Steele et al. (2002) PR-BM RKS-BM NRTL UNIQUAC
0
20
40
60
80
100
120
250 275 300 325 350 375 400 425 450 475
Va
po
ur
pre
ssu
re (
kP
a)
Temperature (K)
McDonald et al. (1959) Perry and Green (1997) PR-BM RKS-BM NRTL UNIQUAC
Stellenbosch University https://scholar.sun.ac.za

85
Figure 35: Literature and model-predicted pure component vapour pressure diagram for diethylene glycol
Figure 32 shows that there is a general over prediction of the mole fraction of p-cymene in either
fraction when using all the thermodynamic models tested; this could be attributed to estimation of
the binary interaction parameters using Aspen Plus®. It can also be seen that the error margin in
prediction is lower with activity coefficient models as compared to EOS models, which could be due
to that EOS models use less parameters to account for binary interactions (Aspen Technology, 2009).
Experimentally determined VLE data of possible binary systems within TDO would then be required to
generate accurate interaction parameters, which could be done using regression in Aspen Plus®.
However, in the absence of literature binary interaction parameters for TDO components, estimation
of binary parameters using Aspen Plus® is deemed acceptable for the purposes of this study.
From Figure 32, it can also be observed that at every temperature point, a constant equilibrium mole
fraction of p-cymene (and subsequently of limonene) is obtained in each phase, which indicates
difficulty in separating p-cymene and limonene through normal distillation. The difficulty of separating
p-cymene and limonene using normal distillation has already been demonstrated in the experimental
work of Pakdel et al. (2001). It therefore indicates that enhanced distillation techniques are required
to separate these two components, hence the use of extractive distillation for limonene recovery from
the limonene-rich stream in this study.
Figure 33 to Figure 35 show that all the thermodynamic models tested in this study give accurate pure
component vapour pressure prediction for both limonene and p-cymene, and the solvent adopted for
extractive distillation in this study. This implies that all the models tested would be able to accurately
0
20
40
60
80
100
120
140
160
180
400 420 440 460 480 500 520 540 560
Va
po
ur
pre
ssu
re (
kP
a)
Temperature (K)
Ambrose and Hall (1981) Steele et al. (2002) PR-BM RKS-BM NRTL UNIQUAC
Stellenbosch University https://scholar.sun.ac.za

86
predict the equilibrium phase distribution of each of those components in their respective individual
pure component systems. Good prediction of their vapour pressures should imply that activity
coefficients of a system consisting of these compounds should be well calculated. Experimental VLLE
data would however be required to accurately predict the equilibrium phase behaviour of a
limonene + p-cymene system when the solvent is introduced, as activity coefficient models are less
accurate in predicting ternary systems (Smith et al, 2005).
4.5.2.2. Description of the separation system flowsheet
In this section, the separation system is discussed in detailed, with focus placed on detailing the
operating conditions of each equipment, the rationale behind each unit model of the Aspen Plus®
flowsheet, and the optimisation performed before specific equipment were chosen. This section
expands on the brief description given in section 5.1. The Aspen Plus® flowsheet and stream table of
the separation system are shown in Figure 36 and Table 23 respectively. The stream names in Figure
36 correspond to those given in Table 21 and the final stream names in section 4.7. Equipment names
in Figure 36 correspond to the final equipment names in section 4.7.
In the process shown in Figure 36, the oil feed stream from the pyrolysis section (S113) is pumped to
200 kPa by PC-101 in preparation for the first stage of fractionation in T-101. The oil is pressurised
before feeding to T-101 in order to aid with flashing of the light compounds in the oil as they enter a
lower pressure zone in the column (Henley et al., 2011).
The pressurised oil from PC-101 (S114) is sent to T-101 feed pre-heater (EX-101) where it is heated to
just below its initial boiling point of 105 °C (where the vapour fraction is just above 0) also in
preparation for the first stage fractionation in T-101. The oil temperature of 105 °C was determined
by a sensitivity analysis of the resulting vapour fraction of EX-101 outlet stream (S115) with varying
EX-101 operating temperature. The heat required for pre-heating the oil in EX-101 (19 kW) is provided
by contact with the hot reactor volatiles (S109 in Figure 27) from the pyrolysis section; the heat
provided by S109 is represented by heat stream 4. A design specification (EX101-T) controls the outlet
temperature of EX-101 by varying the outlet temperature of EX-000 from Figure 27.
The pressurised and pre-heated oil stream (S115) is then sent to T-101 at 105 °C and 200 kPa, where
the process of upgrading the oil to recover limonene begins. The objective and operation of each
separation column will be explained in detail. In this study, the oil feed to the separation section (S113)
is assumed to contain no solid material that could cause either plugging or fouling of the trays or
packing material in the separation columns (no solids indicated in the oil by Choi et al., 2014). In cases
Stellenbosch University https://scholar.sun.ac.za

87
where the TDO contains such solid material, a solids removal/trapping system such as a strainer or
filtration could be required in the TDO feed line to the separation columns.
Stellenbosch University https://scholar.sun.ac.za

88
Figure 36: Aspen Plus® flowsheet of the separation system
Table 23: Stream table for the separation system
Stream number S113 S114 S115 S116 S117 S118 S119 S120 S121 S122 S123 S124 S125 S126
Mass flow (kg/hr) 488.1 488.1 488.1 14.2 187.3 286.5 71.6 214.9 71.6 10.3 464.5 464.5 28.0 508.2
Stellenbosch University https://scholar.sun.ac.za
Stellenbosch University https://scholar.sun.ac.za

89
Table 23 continued: Stream table for the separation system
Stream number S113 S114 S115 S116 S117 S118 S119 S120 S121 S122 S123 S124 S125 S126
Mole flow (kmol/hr) 4.3 4.3 4.3 0.2 2.1 1.9 0.5 1.4 0.5 0.1 4.4 4.4 0.2 4.7
Temperature (°C) 35.0 35.2 105.0 49.7 49.7 208.2 177.0 229.9 177.0 25.0 234.2 100.0 173.5 193.3
Pressure (kPa) 100.0 200.0 200.0 100.0 100.0 103.2 100.0 102.5 105.0 100.0 100.0 100.0 100.0 102.5
Vapour fraction 0.00 0.00 0.06 1.00 0.00 0.00 0.00 0.00 0.00 0.00 0.00 0.00 0.00 0.00
Limonene purity (wt.%) 5.8 5.8 5.8 0.0 0.2 9.7 38.8 0.1 38.8 0.0 0.0 0.0 95.1 0.2
Impurities (wt.%) 94.2 94.2 94.2 100.0 99.8 90.3 61.2 99.9 61.2 0.0 1.0 1.0 0.7 9.5
DEG purity (wt.%) 0.0 0.0 0.0 0.0 0.0 0.0 0.0 0.0 0.0 100.0 99.0 99.0 4.2 90.3
Table 23 continued: Stream table for the separation system
Stream number S127 S128 S129 S130 S131 S132
Mass flow (kg/hr) 49.3 458.8 4.6 454.2 451.6 451.6
Mole flow (kmol/hr) 0.4 4.3 0.0 4.3 3.9 3.9
Temperature (°C) 175.0 244.5 238.4 238.4 123.6 35.0
Pressure (kPa) 100.0 100.5 100.5 100.5 100.0 100.0
Vapour fraction 0.0 0.0 0.0 0.0 0.3 0.0
Limonene purity (wt.%) 2.4 0.0 0.0 0.0 0.3 0.3
Impurities (wt.%) 88.3 1.0 1.0 1.0 98.6 98.6
DEG purity (wt.%) 9.3 99.0 99.0 99.0 1.0 1.0
Stellenbosch University https://scholar.sun.ac.za
Stellenbosch University https://scholar.sun.ac.za

90
T-101
The purpose of T-101 is to remove the components lighter than the limonene-rich fraction from the
pressurised and pre-heated oil feed (S115). The components lighter than the limonene-rich fraction
are recovered as distillate product whereas the limonene-rich fraction and heavier components are
obtained as bottoms product.
T-101 has been modelled using a RADFRAC column model, which can perform rigorous multi-stage
distillation calculations (Aspen Technology, 2009). The final input parameters for T-101 were
determined by first modelling T-101 using a DSTWU column model, to obtain initial RADFRAC estimate
column parameters. Details of determination of DSTWU parameters are provided in Appendix C.1.
Table 24 shows the initial input parameters for T-101 (base case) RADFRAC model as obtained from
DSTWU results. The boil-up ratio was obtained by running the RADFRAC model with values obtained
from DSTWU results.
The initial RADFRAC parameters obtained from the DSTWU model were then used in a base case
sensitivity analysis to determine the parameters with the most influence on separation. Optimised
column parameters at base case were then used as input for a sensitivity analysis to obtain possible
optimum column parameters that could achieve the desired separation for different number of stages.
The desired separation in this study is 99% recovery of key components in their respective desired
streams, which were selected based on recommendations by Sinnott and Towler (2009), explained in
section 4.5.1. Economic analysis (annualised costs) was then performed for the different sets of
possible optimum column parameters to determine the final parameters for T-101.
For the RADFRAC column model sensitivity analysis at base case, important column parameters
(number of stages feed stage, reflux ratio, boil-up ratio and feed temperature) were varied to
determine the optimum parameters at different number of stages.
Table 24: Initial RADFRAC column model input parameters for T-101 (obtained from DSTWU model)
Parameter Value
Number of stages 75
Reflux ratio 1.8
Distillate to feed ratio 0.49
Feed stage 38
Boil-up ratio 4.6
Stellenbosch University https://scholar.sun.ac.za

91
Sensitivity analysis for T-101 parameters at base case number of stages
Sensitivity analysis was performed to determine the effects that variation of each parameter has on
the recoveries of key components (limonene and 2-ethyltoluene) in their desired streams. When the
effects of each parameter is investigated, all other parameters are kept at their initial values (shown
in Table 24). The intention of sensitivity analysis at the base case number of stages was to determine
the parameters that had the most significant effects on the recoveries of both key components. The
parameters with significant effects are the ones that are then used to determine various possible
number of stages to achieve the desired separation. The results of sensitivity analysis at the base case
number of stages are given in Appendix C.2.
From the results obtained for the variation of parameters at the base case number of stages, it was
concluded that reflux ratio and boil-up ratio had the most significant effect on the recovery of
limonene and 2-ethyltoulene. A column design specification was applied for T-101 at the base case
input parameters (number of stages and feed location) to maintain the recoveries of limonene (in the
bottoms stream) and 2-ethyltoluene (in the overheads) at 99% using the boil-up ratio and the reflux
ratio respectively. The resultant values of reflux ratio and boil-up ratio were 2.39 and 3.19
respectively; the optimum feed location at base case number of stages using these resultant values
was stage 38.
Determination of T-101 parameters to achieve 99% recovery at various number of stages
The optimised column parameter values (at base case number of stages) were then used as input to
perform sensitivity analysis that would determine the final column parameters that could achieve 99%
recoveries for both key components at various number of stages. For this sensitivity analysis, the reflux
ratio, boil-up ratio, and feed location were varied. Temperature showed to have negligible effect on
the recoveries of both limonene and 2-ethyltoluene at base case, so the (T-101) feed temperature of
105 °C was maintained for the sensitivity analysis. Additional sensitivity analysis results at various
number of stages are given in Appendix C.2.
The effect of reflux ratio on the recovery of limonene in the bottoms product stream at various
number of stages is shown in Figure 37. It can be seen that for all number of stages, recoveries of
more than 95% can be achieved at reflux ratios of around 2.5; over 99% recovery can be achieved with
at least 55 stages at reflux ratios of around 2.5. Below 55 stages, reflux ratios of around 3 are required
to achieve at least 99% limonene recovery.
The recovery of 2-ethyltoluene in the overheads product with varying reflux ratios is shown in Figure
38, and it can be seen that reflux ratios of below 1.5 are preferred to achieve recoveries of more than
Stellenbosch University https://scholar.sun.ac.za

92
95% for all number of stages. At 55 stages and above, recoveries of 95-99% can still be achieved at a
reflux ratios of between 2 and 2.5, with a maximum reflux ratio of 2 required to ensure 99% recovery.
Below 55 stages, the reflux ratio should be kept at a maximum of 1 to ensure that 99% recovery is
achieved.
Figure 37: Effect of reflux ratio on the recovery of limonene in the bottoms at various number of stages
Figure 38: Effect of reflux ratio on the recovery of 2-ethyltoluene in the overheads at various number of stages
0
10
20
30
40
50
60
70
80
90
100
0 2 4 6 8 10 12
Re
cov
ery
in b
ott
om
s (%
)
Reflux ratio
45 stages
50 stages
55 stages
60 stages
65 stages
70 stages
75 stages
0
10
20
30
40
50
60
70
80
90
100
0 2 4 6 8 10 12
Re
cov
ery
in o
ve
rhe
ad
s (%
)
Reflux ratio
45 stages
50 stages
55 stages
60 stages
65 stages
70 stages
75 stages
Stellenbosch University https://scholar.sun.ac.za

93
Figure 39 shows the effect of boil-up ratio on the recovery of limonene in the bottoms product at
various number of stages. It can be observed that lower boil-up ratios are preferred to achieve high
limonene recoveries at all number of stages, as vapourisation of limonene recovered in the bottom
stages is minimised. Recoveries of 99% can be achieved up to a boil-up ratio of 2.5 for all number of
stages, with a further increase in boil-up ratio requiring at least 50 stages to achieve 99% recovery.
Above a boil-up ratio of 3, 99% recovery can no longer be achieved for all number of stages.
Figure 40 shows the recovery of 2-ethyltoluene in the overheads with varying boil-up ratio. It can be
seen that in order to achieve 99% recovery for 2-ethyltoluene, a boil-up ratio of between 3.5 and 4 is
required for 50 stages and above. Below 50 stages, a boil-up ratio of between 4.5 and 5 is required to
ensure 99% recovery.
The effect of feed location on the recoveries of limonene and 2-ethyltoluene in their respective
desired streams is shown in Figure 41 and Figure 42 respectively. It can be seen from both figures that
for 45 to 55 stages, feeding around stages 30 - 32 gives the best recoveries of both compounds; feeding
around stages 34 – 36 gives the best separation for 60 - 65 stages. At 65 stages and above, the best
separation is obtained with the feed located around stage 38.
Figure 39: Effect of boil-up ratio on the recovery of limonene in bottoms product at various number of stages
0
10
20
30
40
50
60
70
80
90
100
0 2 4 6 8 10 12
Re
cov
ery
in b
ott
om
s (%
)
Boilup ratio
45 stages
50 stages
55 stages
60 stages
65 stages
70 stages
75 stages
Stellenbosch University https://scholar.sun.ac.za

94
Figure 40: Effect of boil-up ratio on the recovery of 2-ethyltoluene at various number of stages
Figure 41: Effect of feed location of recovery of limonene in bottoms product at various number of stages
0
10
20
30
40
50
60
70
80
90
100
0 2 4 6 8 10 12
Re
cov
ery
in
ov
erh
ea
ds
(%)
Boilup ratio
45 stages
50 stages
55 stages
60 stages
65 stages
70 stages
75 stages
50
55
60
65
70
75
80
85
90
95
100
0 10 20 30 40 50 60 70 80
Re
cov
ery
in b
ott
om
s (%
)
Feed stage
45 stages
50 stages
55 stages
60 stages
65 stages
70 stages
75 stages
Stellenbosch University https://scholar.sun.ac.za

95
Figure 42: Effect of feed location on recovery of 2-ethyltoluene in overheads at various number of stages
Based on observations from Figure 37 to Figure 42, the final specific reflux and boil-up ratios required
to achieve 99% recovery of both limonene and 2-ethyltoluene for each number of stages were
adjusted using a column design specification of T-101, at respective optimum feed stages. The
resulting reflux and boil-up ratios were used to determine the condenser and reboiler duties for each
number of stages; the duties were then used to calculate the operating costs at each number of stages.
The Economic Analyzer of Aspen Plus® V8.6 was used to perform column sizing, and the sizing results
were used to obtain the column installed (capital) cost for each number of stages, using the bare
module technique from Turton et al. (2009). A Similar approach is applied for all other columns.
The associated capital and operating costs at each number of stages were then used to calculate total
annualised cost for the respective number of stages using Equation 2, which was obtained from Peters
and Timmerhaus (1991). According to Peters and Timmerhaus (1991), the optimum reflux ratio occurs
at the point where the total annualised cost is minimum. The annualised costs for different number
of stages for T-101 is shown in Figure 43.
"#$ = 0.15 ∗ '��(')*��+,-ℎ'/0+1 + '��(')34+/'5��0-ℎ'/0+1
Equation 2
"#$ is the total annualised cost ($/yr), '��(')*��+,-ℎ'/0+1 is the annualised sum of the installed
cost of the column and the costs of piping, insulation and instrumentation (60% of the cost of installed
column) in $/yr; '��(')34+/'5��0-ℎ'/0+1 are the costs of cooling water and steam from the
condenser and reboiler respectively ($/yr).
50
55
60
65
70
75
80
85
90
95
100
0 10 20 30 40 50 60 70 80
Re
cov
ery
in o
ve
rhe
ad
s (%
)
Feed stage
45 stages
50 stages
55 stages
60 stages
65 stages
70 stages
75 stages
Stellenbosch University https://scholar.sun.ac.za

96
From Figure 43, it can be concluded that 65 stages will give the most economical operation for T-101,
as the total annualised costs are lowest. As such, 65 stages were chosen as the final number of stages
for T-101. The final RADFRAC column parameters for T-101 used in this study are given in Table 25.
Figure 43: Annualised costs for T-101 at different number of stages
Table 25: Final RADFRAC column model parameters for T-101
Parameter Value
Number of stages 65
Reflux ratio 2.3
Boil-up ratio 4.1
Feed stage 38
Feed temperature 105 °C
Operation of T-101
T-101 is operated at atmospheric pressure, and the condenser pressure is specified as 100 kPa.
Atmospheric pressure operation for T-101 was chosen on the basis that vacuum operation is often
costly due to maintenance requirements of the associated equipment needed to create vacuum. Most
vacuum is steam induced, which could also increase capital and operational costs. Equipment
operating under vacuum might require thicker walls, which would also increase capital cost (Sinnott
and Towler, 2009). Vacuum operation would however reduce the operating temperatures and the
subsequent duties of the condenser and reboiler.
0
20000
40000
60000
80000
100000
120000
140000
160000
180000
200000
220000
40 50 60 70 80 90 100
Co
st (
$/y
r)
Number of stages
Operating
Fixed
TAC
Stellenbosch University https://scholar.sun.ac.za

97
Based on the preliminary column sizing in section 4.5.1, and the number of theoretical stages required
from Table 25, T-101 would preferably have to be a packed column. Packed columns are
recommended for small diameters, temperature sensitive material, and for difficult separations that
could require a lot of stages (Douglas, 1998; Henley et al., 2011). Structured packings are favourable
for such operations as they can give a height equivalent to theoretical plate (HETP) of typically less
than 0.5m, and low pressure drop (around less than 100 Pa/m) (Sinnott and Towler, 2009). As such, a
stage pressure drop of 50 Pa was specified for T-101 based on these HETP and pressure drop values.
Even though the pressure drop is greatly reduced, operating at atmospheric pressure has resulted in
a reboiler temperature of around 210 °C. It is noted that in reality, with these temperatures, thermal
degradation of some compounds could be possible, which would cause fouling of the packing material.
This would reduce the separation capacity, as the effective cross-sectional area open to vapour flow
determines the capacity of a packed column (Lamprecht, 2010; Henley et al., 2011). In such cases, the
effects of hold-up will have to be taken into account (Lamprecht, 2010). Liquid hold-up is usually
considerably lower for packed columns as compared to plate columns (Sinnott and Towler, 2009).
The lighter components removed from T-101 as overheads are sent to a partial condenser with a
vapour fraction of 0.1, to flash some non-condensables, which helps in eliminating the need for
refrigerants, and reduces the condenser duty. The condenser has a duty of -91 kW, which accounts
for 63% of the cooling requirements of all 4 columns, and 42% of the cooling requirements of the
whole separation system. The vapour distillate stream (S116) is sent to the heat recovery section, and
the liquid distillate stream (S117) is combined with by-products from T-102 and T-104 to form the TDO
product stream (S132).
Limonene and heavier components are drawn off as bottoms product (S118), and the stream is sent
to T-102 for further limonene enrichment. T-101 reboiler requires 103 kW of heat input (from high
pressure steam at 255 °C), which represents 51% of the steam requirements in the separation section.
It implies that T-101 reboiler accounts for 51% of all steam requirements, as steam is only used in the
columns in this study. The final mass balance of T-101 is shown in Table 26.
Table 26: Final mass balance of T-101
Stream number S115 S116 S117 S118
Mass flow (kg/hr) 488.1 14.2 187.3 286.5
Mole flow (kmol/hr) 4.3 0.2 2.1 1.9
Temperature (°C) 105.0 49.7 49.7 208.2
Stellenbosch University https://scholar.sun.ac.za

98
Table 26 continued: Final mass balance of T-101
Stream number S115 S116 S117 S118
Pressure (kPa) 200.0 100.0 100.0 103.2
Vapour fraction 0.06 1.00 0.00 0.00
Limonene purity (wt.%) 5.8 0.0 0.2 9.7
T-102
The purpose of T-102 in this study is to remove the components that are heavier than the limonene
cut, from the bottoms product of T-101 (S118), thereby further increasing the purity of limonene in
the limonene-rich stream. The limonene-rich stream is collected as distillate product (also following
recommendations from Sinnott and Towler (2009) regarding collection of desired products as
distillate); the heavier components are collected as bottoms product.
T-102 was also modelled using a RADFRAC distillation column model; the initial and final RADFRAC
column parameters were determined in a similar manner to that of T-101. In the case of T-102,
limonene and 2,5-dimethlystyrene were specified as light and heavy key components, respectively,
for determination of initial input parameters from the DSTWU column model. Recoveries of both key
components in their respective desired streams were set at 99% as well. Table 27 shows the initial
RADFRAC column parameters for T-102, as obtained from the DSTWU column model. The initial
estimate parameters in Table 27 were then used in a sensitivity analysis at the base case number of
stages, to determine the optimum base case parameters, similarly to T-101. For the base case
sensitivity analysis, all the parameters shown in Table 27 were varied. The results of T-102 sensitivity
analysis at the base case number of stages are shown in Appendix C.3.
Table 27: Initial RADFRAC column model input parameters for T-102 (obtained from DSTWU model)
Parameter Value
Number of stages 68
Reflux ratio 5.1
Distillate to feed ratio 0.27
Feed stage 35
Boil-up ratio 2.46
Stellenbosch University https://scholar.sun.ac.za

99
From the results of sensitivity analysis at the base case number of stages, it was concluded that the
optimum base case parameters are a reflux ratio of 5, a distillate to feed ratio of 0.25, and feed
location at stage 20. It was also concluded that T-102 feed temperature (S118) should be kept at its
value of 208 °C. The RADFRAC input parameters where then changed from those in Table 27 to these
optimised values, and a sensitivity analysis to determine the optimum parameters that would achieve
the desired separation at various number of stages was performed, similarly to that of T-101. For each
number of stages, the reflux ratio, distillate to feed ratio and feed location were varied. The results
of T-102 sensitivity analysis at various number of stages are also shown in Appendix C.3.
From the results of sensitivity analysis at various number of stages, it was concluded that maximum
recoveries of 75 - 80% can be achieved for 2,5-dimethylstyrene (in the bottoms product) without
compromising the recovery of limonene in the distillate product (below 99%). Since a high recovery of
limonene is desired, T-102 was designed to achieve a recovery of around 80% for 2,5-dimethylstyrene;
the remaining amount is removed by the solvent in T-103.
The results of optimum column parameters at various number of stages were then used to calculate
the annualised costs for the respective number of stages, in a similar manner to T-101. The annualised
costs for the various number of stages are shown Figure 44, and it can be seen that the total annualised
costs are lowest at 50 stages. The final number of stages for T-102 were then chosen as 50, which
correspond to a reflux ratio of 5, and a distillate to feed ratio of 0.25. The final RADFRAC column
parameters for T-102 are shown in Table 28.
Figure 44: Annualised costs for T-102 at various number of stages
0
20000
40000
60000
80000
100000
120000
140000
40 50 60 70 80 90
Co
st (
$/y
r)
Number of stages
Operating
Fixed
TAC
Stellenbosch University https://scholar.sun.ac.za

100
Table 28: Final RADFRAC column parameters for T-102
Parameter Value
Number of stages 50
Reflux ratio 5
Distillate to feed ratio 0.25
Feed stage 24
Feed temperature 208 °C
Operation of T-102
Just like T-101, T-102 is also desired to be a (structured) packed column, and it is also operated at a
condenser pressure of 100 kPa, with a 50 Pa/stage pressure drop. T-101 bottoms stream (S118) is fed
to T-102, where removal of the heavier components increases the limonene content of the limonene-
rich fraction from 10 wt.% to 39 wt.%. The limonene-rich fraction is recovered as the overheads, with
a condenser duty of -36 kW required to condense the overhead vapours. The limonene-rich stream
(S119) is then pressurised in PC-102, and is sent to the limonene recovery column (T-103) for the final
stage of limonene enrichment/recovery. The outlet pressure of PC-102 has been specified so as to
overcome the pressure drop in T-103.
The bottoms stream (S120) is mixed with the liquid distillate of T-101 (S117) and the distillate stream
of T-104 (S127) to make the TDO product stream (S132). A reboiler duty of 37 kW is required to supply
the heat requirements of T-102, which is considerably lower than what is required for T-101 reboiler.
A lower T-102 reboiler duty could be due to the high temperature of S118, which lowers additional
heat input requirements. The final mass balance of T-102 is shown in Table 29.
Table 29: Final mass balance of T-102
Stream number S118 S119 S120
Mass flow (kg/hr) 286.5 71.6 214.9
Mole flow (kmol/hr) 1.9 0.5 1.4
Temperature (°C) 208.2 177.0 229.9
Pressure (kPa) 103.2 100.0 102.5
Vapour fraction 0.00 0.00 0.00
Limonene purity (wt.%) 9.7 38.8 0.1
2,5-dimethlystyrene purity (wt.%) 8.3 6.4 9.0
Stellenbosch University https://scholar.sun.ac.za

101
T-103
The objective of T-103 is to remove the impurities contained in the limonene-rich stream (S119), using
extractive distillation, to produce a limonene stream of (minimum) 95 wt.% limonene purity. The
limonene product stream is obtained as distillate product, while the solvent, together with the
entrained impurities, are obtained as bottoms product.
T-103 is also modelled using a RADFRAC distillation column model. Initial RADFRAC input parameters
for T-103 (except for distillate flow rate) are adopted from the work of Ngwetjana (2017). The initial
input parameters are shown in Table 30. The final RADFRAC column input parameters were obtained
by a sensitivity analysis of the main (initial) column parameters, and a preliminary economic analysis
of annualised costs. Main results of sensitivity analysis are presented here; additional results of
sensitivity analysis can be found in Appendix C.4.
Table 30: Initial RADFRAC input parameters for T-103 (obtained from Ngwetjana, 2017)
Parameter Value
Number of stages 55
Reflux ratio 1.8
Distillate rate 28 kg/h
Solvent feed stage 2
Solvent feed temperature 95 °C
Solvent to feed ratio 6
Oil feed stage 24
Determination of T-103 parameters to achieve 95% limonene purity at various number of
stages
The initial input parameters for T-103 adopted from Ngwetjana (2017), shown in Table 30, were final
optimised parameters in the particular study. As such, the only sensitivity analysis done in this study
was to determine the possible number of stages that could achieve 95 wt.% limonene purity, while
also monitoring the recovery of limonene in the limonene stream. The following column parameters
were varied in the sensitivity study: reflux ratio, oil (limonene-rich fraction) feed location,
entrainer/solvent feed location, entrainer flow rate and entrainer feed temperature. When the effect
of each of parameter was studied, all other parameters were kept at their base values.
Stellenbosch University https://scholar.sun.ac.za

102
The distillate flow rate of 28 kg/h was specified for T-103 as it represents approximately all the
limonene sent to T-103, which is all desired as distillate product in perfect separation. Since the
distillate flow rate is specified in the column, the recovery and purity of limonene in the distillate
stream will be closely related. As such, only the effects of varying the column parameters on limonene
purity are presented here, results of the effects on recovery are presented in Appendix C.4.
Effect of reflux ratio
The effect of variation of reflux ratio on the purity of limonene is shown in Figure 45. It is observed
that the purity of limonene decreases with increasing reflux ratio for all number of stages considered.
The decrease in limonene purity is due to increased vaporisation of the impurities and possibly the
entrainer, as the energy input from the reboiler is increased to make up for the increase in required
vapour flow. It can also be observed that in order to achieve 95% purity, it is necessary to have reflux
ratios of ≤1, and a column with a minimum of around 50 stages.
Figure 45: Effect of reflux ratio on limonene purity in distillate product at various number of stages
Effect of oil feed location
The effect of variation in oil feed stage on the purity of limonene is shown in Figure 46. It can be seen
that the purity increases with increasing feed location (feed is located further down the column), as
more contact area is created for extraction of the impurities in the oil (limonene-rich stream) by the
entrainer. The purity then decreases with feeding further down the column, as more impurities (and
possibly the entrainer) are stripped and collected as distillate product. In order to achieve maximum
0
10
20
30
40
50
60
70
80
90
100
0 2 4 6 8 10 12
Pu
rity
in d
isti
lla
te p
rod
uct
(w
t.%
)
Reflux ratio
35 stages
40 stages
45 stages
50 stages
55 stages
60 stages
65 stages
Stellenbosch University https://scholar.sun.ac.za
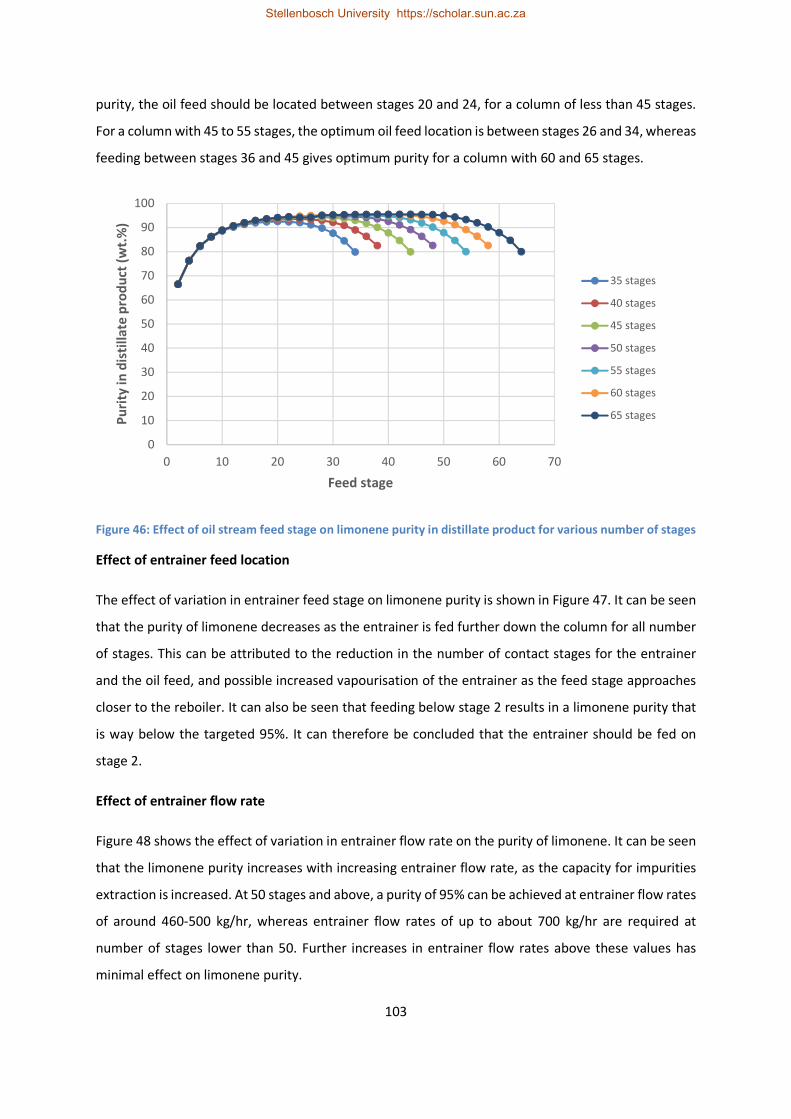
103
purity, the oil feed should be located between stages 20 and 24, for a column of less than 45 stages.
For a column with 45 to 55 stages, the optimum oil feed location is between stages 26 and 34, whereas
feeding between stages 36 and 45 gives optimum purity for a column with 60 and 65 stages.
Figure 46: Effect of oil stream feed stage on limonene purity in distillate product for various number of stages
Effect of entrainer feed location
The effect of variation in entrainer feed stage on limonene purity is shown in Figure 47. It can be seen
that the purity of limonene decreases as the entrainer is fed further down the column for all number
of stages. This can be attributed to the reduction in the number of contact stages for the entrainer
and the oil feed, and possible increased vapourisation of the entrainer as the feed stage approaches
closer to the reboiler. It can also be seen that feeding below stage 2 results in a limonene purity that
is way below the targeted 95%. It can therefore be concluded that the entrainer should be fed on
stage 2.
Effect of entrainer flow rate
Figure 48 shows the effect of variation in entrainer flow rate on the purity of limonene. It can be seen
that the limonene purity increases with increasing entrainer flow rate, as the capacity for impurities
extraction is increased. At 50 stages and above, a purity of 95% can be achieved at entrainer flow rates
of around 460-500 kg/hr, whereas entrainer flow rates of up to about 700 kg/hr are required at
number of stages lower than 50. Further increases in entrainer flow rates above these values has
minimal effect on limonene purity.
0
10
20
30
40
50
60
70
80
90
100
0 10 20 30 40 50 60 70
Pu
rity
in d
isti
lla
te p
rod
uct
(w
t.%
)
Feed stage
35 stages
40 stages
45 stages
50 stages
55 stages
60 stages
65 stages
Stellenbosch University https://scholar.sun.ac.za

104
Figure 47: Effect of entrainer feed location on limonene purity in distillate product at various number of stages
Figure 48: Effect of entrainer flow rate on limonene purity in distillate product for various number of stages
0
10
20
30
40
50
60
70
80
90
100
0 10 20 30 40 50 60
Pu
rity
in d
isti
lla
te (
wt.
%)
Feed stage
35 stages
40 stages
45 stages
50 stages
55 stages
60 stages
65 stages
0
10
20
30
40
50
60
70
80
90
100
0 200 400 600 800 1000
Pu
rity
in d
isti
lla
te p
rod
uct
(w
t.%
)
Flow rate (kg/hr)
35 stages
40 stages
45 stages
50 stages
55 stages
60 stages
65 stages
Stellenbosch University https://scholar.sun.ac.za

105
Effect of entrainer feed temperature
Figure 49 shows the effect of variation in entrainer feed temperature on the purity of limonene. The
purity increases with an increase in feed temperature up to 110 °C for all number of stages and then
decreases with a further increase in temperature. This could be attributed to an increasing extraction
capacity of the entrainer with increasing temperature. A further increase in entrainer temperature
would then vapourise part of the aromatic impurities causing them to be recovered with limonene as
distillate. Entrainer feed temperatures of between 95 and 110 °C are required to achieve maximum
limonene purity.
Figure 49: Effect of entrainer temperature on limonene purity in distillate product for various number of
stages
The final column parameters for T-103 are determined through calculation of annualised costs for
different number of stages that could achieve the minimum required limonene purity of 95 wt.%,
shown in Figure 50. It can be seen that the lowest annualised costs are obtained at 50 stages, which
was the minimum number required to achieve the desired purity, as shown by the sensitivity analysis.
Based on Figure 50, it can be inferred that lower number of stages would yield lower TAC values;
however, the limonene purity specification would not be met at lower number of stages. As such, the
final T-103 specification was set at 50 stages; the final optimised column parameters for T-103 (that
correspond to 50 stages) are shown in Table 31.
0
10
20
30
40
50
60
70
80
90
100
0 50 100 150 200
Pu
rity
in d
isti
lla
te p
rod
uct
(w
t.%
)
Temperature (°C)
35 stages
40 stages
45 stages
50 stages
55 stages
60 stages
65 stages
Stellenbosch University https://scholar.sun.ac.za

106
Figure 50: Annualised costs for T-103 at different number of stages
Table 31: Final column parameters for T-103
Parameter Value
Number of stages 50
Reflux ratio 1
Distillate flow rate 28 kg/h
Oil feed stage 30
Oil feed temperature 177 °C
Entrainer feed stage 2
Entrainer flow rate 465 kg/h
Entrainer feed temperature 100 °C
Operation of T-103
T-103 was also modelled as a structured packed column, with a specified pressure drop of 50 Pa/stage.
The pressurised limonene-rich stream (S121) is fed into the column on stage 30, and it is vapourised
by the hot vapours from the reboiler. DEG (S124) is fed on stage 2, and the solvent contacts the oil
feed counter-currently. Most of the aromatic impurities are extracted from the oil vapours, thereby
enriching the limonene content of the rising vapours. A stream of around 95 wt.% limonene purity is
recovered as distillate product (S125), at a rate of 28 kg/h; a limonene recovery of 96% is achieved in
the distillate product. T-103 condenser has a duty of -4 kW, which is only 2% of the total cooling
0
10000
20000
30000
40000
50000
60000
70000
80000
90000
100000
45 50 55 60 65 70 75
Co
st (
$/y
r)
Number of stages
Operating
Fixed
TAC
Stellenbosch University https://scholar.sun.ac.za

107
requirements of all 4 columns. The small duty can be attributed to a small vapour flow rate and the
high purity of limonene in the vapour overhead which would mean that the vapour temperature will
almost be similar to the boiling point of limonene.
The solvent-rich stream, with most of the aromatic compounds, is recovered as the bottoms product
(S126), and it is sent to T-104 for solvent regeneration. A duty of 29 kW is required for T-103 reboiler
to provide the heat requirements for T-103; the reboiler accounts for 14% of the total process steam
usage. The final mass balance around T-103 is shown in Table 32.
Table 32: Final mass balance for T-103
Stream number S121 S124 S125 S126
Mass flow (kg/hr) 71.6 464.5 28.0 508.2
Mole flow (kmol/hr) 0.5 4.4 0.2 4.7
Temperature (°C) 177.0 100.0 173.5 193.3
Pressure (kPa) 105.0 100.0 100.0 102.5
Vapour fraction 0.00 0.00 0.00 0.00
Limonene purity (wt.%) 38.8 0.0 95.1 0.2
Impurities composition (wt.%) 61.2 1.0 0.7 9.5
DEG purity (wt.%) 0.0 99.0 4.2 90.3
T-104
The objective of T-104 is to regenerate the (DEG) solvent used for extraction in T-103, by stripping off
the (mostly aromatic) impurities entrained in the solvent-rich stream from T-103 (S126). The aromatic
impurities are collected as distillate product, and the solvent is recovered as bottoms product. The
separation target in T-104 is a recovery and (mass) purity of at least 99% for diethylene glycol, in the
solvent recycle stream. A high recovery and purity of the solvent minimises solvent loss and build-up
of impurities in the system.
T-104 was also modelled using the RADFRAC column model. The initial input parameters for T-104
were also adopted from the study by Ngwetjana (2017). The initial column parameters are shown in
Table 33. The initial parameters were then used to perform sensitivity analysis to generate a set of
optimum column parameters that could achieve the desired separation objective at various number
of stages. The sensitivity analysis was performed similarly to that of T-103. For T-104 sensitivity
analysis at various number of stages, the reflux ratio, boil-up ratio, feed location, and temperature of
Stellenbosch University https://scholar.sun.ac.za

108
the feed stream were varied. The effects of varied parameters on the recovery and mass purity of DEG
in the bottoms stream, and the reboiler energy usage were observed. The results of T-104 sensitivity
analysis are given in Appendix C.5.
Table 33: Initial RADFRAC model input parameters for T-104 (adopted from Ngwetjana, 2017)
Parameter Value
Number of stages 10
Reflux ratio 1.6
Boil-up ratio 0.0371
Feed stage 4
From the results of sensitivity analysis, it was observed that a trade-off exists between recovery and
purity for most of the various varied parameters. The recovery of DEG in the bottoms product
increases with increasing reflux ratio, as cooling of the rising vapours is increased. The recovery
decreases with increasing boil-up ratio, as the increased heat input increases vapourisation of the
solvent. The opposite trends are observed for the purity, with regards to both the reflux and boil-up
ratios. It could be concluded that a maximum reflux ratio of 2, and a maximum boil-up ratio of 0.5
would give optimum recovery and purity at most number of stages. The final reflux and boil-up ratios
are determined by a column design specification that is used to ensure 99% of both recovery and
purity.
It could also be seen that T-104 temperature should be kept at the value of T-103 bottoms stream
(193 °C), as noticeable changes in recovery and purity are observed at temperatures values that would
require additional heating or cooling equipment, which would add to capital and maintenance costs.
The effects of feed location on recovery, purity, and energy usage were negligible with the initial
parameters, as such, the final feed location for each number of stages was set at the value that gave
the lowest energy consumption with the reflux and boil-up ratios from the design specification.
The final number of stages were chosen based on analysis of annualised costs using the optimum
values at each number of stages; the results of annualised costs are shown in Figure 51. It can be seen
that 10 stages give the lowest annualised costs for this separation. As such, 10 stages were specified
for T-104; this corresponds to a reflux ratio of 1.73, a boil-up ratio of 0.47, and feed location at stage
5. It can be noted from Figure 51 that even though fixed costs are lowest at 5 stages, the resulting
reflux and boil-up ratios (20.5 and 1.74 respectively) required to achieve the targeted recovery and
Stellenbosch University https://scholar.sun.ac.za

109
purity result in very high operating costs. In reality, high reflux and/or boil-up ratios could also result
in column problems such as flooding or weeping, which would decrease separation efficiency (Sinnott
and Towler, 2009). The final column parameters for T-104 are given in Table 34.
Figure 51: Annualised costs for T-104 at various number of stages
Table 34: Final optimised column parameters for T-104
Parameter value
Number of stages 10
Reflux ratio 1.73
Boil-up ratio 0.47
Feed stage 5
Operation of T-104
T-104 was also modelled as a structured packed column with a specified pressure drop of 50 Pa/stage.
The aromatics entrained in the solvent are recovered as distillate product (S127), and the regenerated
solvent is recovered as bottoms product (S128). The distillate product is combined with the liquid
distillate from T-101 and the bottoms product from T-102 in MX-102; the combined stream (S131) is
cooled down to 35 °C in EX-104, and stored as TDO product (S132).
T-104 condenser requires a duty of -13 kW to condense the column overheads, which represents 6%
of the cooling requirements in the separation section, and 3% of the overall process cooling
0
10000
20000
30000
40000
50000
60000
70000
80000
90000
100000
5 10 15 20 25 30 35 40
Co
sts
($/y
r)
Number of stages
Operating
Fixed
TAC
Stellenbosch University https://scholar.sun.ac.za

110
requirements. The reboiler in T-104 requires a duty of 31 kW to provide the energy needed to drive
the separation, which represents 16% of the steam requirement in the separation section, and 4% of
the overall process steam requirements. In cooling down S131, a duty of -28 kW is required in EX-104,
which accounts for 13% of the cooling requirements in the separation section, and 6% of the overall
process cooling requirements.
The solvent recovered (S128) is purged (1%) by SPLT-101 to avoid build-up of impurities in the system,
as the solvent is recycled. The solvent recycle stream (S130) is combined with a solvent make-up
stream (S122) in MX-103, and the combined stream (S123) is cooled down in EX-103 to the desired
solvent feed temperature for T-103 (100 °C). A design specification (DEG-FLOW) is used to control the
flow rate of DEG in the solvent stream fed to T-103 (S124) to 460 kg/hr, by manipulating the flow rate
of the solvent make-up stream.
EX-103 (duty of -42 kW) accounts for 19% of the cooling requirements of the separation system, and
9% of overall cooling requirements; this can be attributed to a high temperature of S130 (238 °C) as
the solvent has to be fed to T-103 at 100 °C for optimum extraction. The final mass balance around T-
104, together with that of the solvent make-up stream is shown in Table 35.
Table 35: Final mass balance of T-104 and the solvent make-up stream
Stream number S122 S126 S127 S128
Mass flow (kg/hr) 10.3 508.2 49.3 458.8
Mole flow (kmol/hr) 0.1 4.7 0.4 4.3
Temperature (°C) 25.0 193.3 175.0 244.5
Pressure (kPa) 100.0 102.5 100.0 100.5
Vapour fraction 0.00 0.00 0.0 0.0
Impurities composition (wt.%) 0.0 9.5 88.3 1.0
DEG purity (wt.%) 100.0 90.3 9.3 99.0
4.6. Design of energy recovery system
From the PFDs of Wojtowicz and Serio (1996), Fels and Pegg (2009) and Pilusa et al. (2014) (reviewed
in section 3.5), it could be concluded that in literature, the most common way of utilising the pyrolysis
gas produced is to combust the gas for reactor heating with any excess gas flared off. None of
Wojtowicz and Serio (1996), Fels and Pegg (2009) and Pilusa et al. (2014) reviewed the potential of
energy recovery from the flue gases generated. Only Fels and Pegg (2009) considered using part of
the excess gas produced, to provide energy for drying. According to information obtained from two
Stellenbosch University https://scholar.sun.ac.za

111
REDISA-affiliated operational tyre pyrolysis plants, the possibility of any form of heat recovery from
flue gases generated from reactor heating or burning excess pyrolysis gas is often difficult, due to low
energy gains per unit of currency invested (Jefferies, 2017; Wiese, 2017).
The process developed in this study requires the use of high pressure steam in the reboilers of the
distillation columns in the separation system. In this study, the possibility of using the pyrolysis gas
generated in the process to provide energy for reactor heating, and subsequent heat recover by steam
generation from the flue gases will be preliminarily investigated. For the preliminary investigation, it
is assumed that all the gas is combusted to meet the reactor heating requirements (only the
combustion chamber of the reactor is required), and if there is any excess heat generation (above the
reactor heating requirements), it is used for steam generation.
A preliminary economic evaluation will be performed for the energy recovery scenario (in chapter 5),
assuming that the only additional equipment required is for steam generation, and that any excess
steam above process requirements can be sold at the purchase price of high pressure steam. A final
decision on whether heat recovery should be further investigated in this study, is taken based on the
overall effect of the current proposed heat recovery system on process economics. The PFD and
stream names of the proposed heat recovery system are shown in Figure 52 and Table 36 respectively.
EX-105
S112
HT-101
S134
S139
S116 S133
S138
S137
S140
S136
Figure 52: PFD of the heat recovery system
Stellenbosch University https://scholar.sun.ac.za

112
Table 36: Stream names of the heat recovery system
Stream name Description
S112 Pyrolysis gas
S116 T-101 vapour distillate
S133 Fuel gas to RX-101
S134 Combustion air
S136 Hot flue gas
S137 Flue gas discharge
S138 Boiler feed water
S139 Pressurised boiler feed water
S140 HP steam
In the PFD shown in Figure 52, non-condensable pyrolysis gas from the pyrolysis section (S112 in Figure
27) is combined with the vapour distillate from T-101 in the separation system (S116 from Figure 36),
and are combusted in the reactor heating chamber. The flue gases that are generated are used to
generate high pressure steam, after which they are discharged via a stack.
4.6.1. Aspen Plus® simulation of the heat recovery system
The Aspen Plus® flowsheet and stream table of the heat recovery system are shown in Figure 53 and
Table 37 respectively.
Figure 53: Aspen Plus® flowsheet of the heat recover system
HT-101
EX-001 EX-002
MX-101
EX-105PC-103
S136 S137
S134
S135
S133S11618(IN)
S1122(IN)
S138
S139S140
S7
Stellenbosch University https://scholar.sun.ac.za

113
Table 37: Stream table for the heat recovery system
Stream
number
S112 S116 S133 S134 S135 S136 S137 S138 S139 S140
Mass flow
(kg/hr) 231 14 246 12712 12957 12957 12957 2881 2881 2881
Mole flow
(kmol/hr) 6 0 6 441 450 450 450 160 160 160
Temperature
(°C) 35 50 36 25 800 672 150 80 83 255
Pressure (kPa) 100 100 100 100 100 100 100 100 4300 4300
Vapour
fraction 1 1 1 1 1 1 1 0 0 1
Table 37 continued: Stream table for the heat recovery system
Stream
number
S112 S116 S133 S134 S135 S136 S137 S138 S139 S140
CO2 content
(wt.%) 0.00 0.00 0.00 0.00 5.76 5.76 5.76 0.00 0.00 0.00
SO2 content
(wt.%) 0.00 0.00 0.00 0.00 0.06 0.06 0.06 0.00 0.00 0.00
NO2 content
(wt.%) 0.00 0.00 0.00 0.00 0.00 0.00 0.00 0.00 0.00 0.00
Pyrolysis gas from the pyrolysis system (S112) is combined with the vapour distillate from T-101 (S116)
in MX-101 and the combined stream (S133) is combusted in the combustion chamber of the pyrolysis
reactor. The combustion chamber of the pyrolysis reactor is represented by HT-101 which has been
modelled as an adiabatic RSTOIC reactor modelled following what has normally been done in literature
studies for modelling of biomass boilers (Nsaful, 2012; Naleli, 2016). Combustion air (S134) is supplied
at atmospheric conditions and is fed in excess in order to maintain the temperature of HT-101 outlet
stream (S135) at 800 °C. The flow rate of air is controlled by a design specification (DS-AIR) in order to
control the outlet temperature of HT-101. An HT-101 outlet temperature of 800 °C was chosen
assuming a reactor and flue gas system of stainless steel 304 that has a maximum working
temperature of around 850 °C – 900 °C; stainless steel 304 is the most commonly used type of stainless
steel in industry (Sinnott and Towler (2009).
Stellenbosch University https://scholar.sun.ac.za

114
S135 (at 800 °C) passes through EX-001 which models heating of the reactor, a (negative) heaty duty
equivalent to the heat duty of the pyrolysis reactor (RX-101 in Figure 27) was specified for EX-001. The
flue gases (S136) at 672 °C are then used to generate 43 bar steam in EX-105, which is then used in
the column reboilers in the separation section. The temperature of the flue gas outlet stream (S137)
is specified at 150°C, similarly to that of the study by Ringer et al. (2006). A heat stream (S7) is used to
model the transfer of heat from flue gases to boiler feed water for steam generation.
Boiler feed water (S138) at 80 °C and 100 kPa is pressurised to 4300 kPa (43 bar) in PC-103, which is
the pressure of the steam required to meet reboiler heating requirements in the separation system.
A boiler feed water temperature of 80 °C was adopted from the study of Nsaful (2012). The amount
of steam generated (S140) is controlled by a design specification (BFW-FLOW), which manipulates the
flow rate of S138 in order to achieve a temperature of 255 °C in S140 (the temperature at which steam
is required in the reboilers of the separation system). Steam is generated at a rate of 2881 kg/h from
the system in Figure 53, which is enough to cover the 258 kg/h required in the reboilers and leave an
excess of 2623 kg/h, which can then be sold to generate income.
Even though steam is produced in excess, the final choice of inclusion of the heat recovery system in
the overall PFD of the process for converting tyres into limonene will be guided by the overall effect
of heat recovery on process economics.
4.7. Final PFD of the waste tyres to limonene process
The final PFD of the base case waste tyres to limonene process scenario is shown in Figure 54. The
heat recovery system is not included in the final PFD, as it is commonly not included in typical waste
tyre pyrolysis flowsheets; heat recovery is also only preliminarily considered in this study. The pyrolysis
gas from the pyrolysis section (S112) and the vapour distillate of T-101 (S116) are combined to make
“fuel gas”. A portion of the fuel gas (S133) is sent to the reactor for reactor heating and the rest is sent
to a flare (S141). The final stream table, equipment list and stream names are provided in Table 38,
Table 39, and Table 40 respectively. The stream names and equipment list apply to all PFDs and Aspen
Plus flowsheets developed in chapter 4.
Stellenbosch University https://scholar.sun.ac.za

115
RX-101
DM-101
T-101
EX-102
PC-101
S113
EX-101
S112
S109
S110
S114
S115
S116
T-102
S118
T-103
PC-102
S121
T-104
S126
S128
S117
S131
S120
S127
EX-103
S124
S130
EX-104
S132
ST-101
MG-101
DB-101
S103
S104
S102
S106
S107 S108
S141S122 S123
S111
S129
S119
S125
S133
S101
Figure 54: Final PFD of the waste tyres to limonene base case process scenario
Stellenbosch University https://scholar.sun.ac.za
Stellenbosch University https://scholar.sun.ac.za

116
Table 38: Final stream table for the tyres to limonene process
Stream number S101 S102 +
S108
S104 S107 S109 S110 S111 S112 S113 S114 S115 S116 S117
Mass flow (kg/hr) 1250.0 125.0 1125.0 405.6 719.4 719.4 719.4 231.3 488.1 488.1 488.1 14.2 187.3
Mole flow (kmol/hr)
10.0 10.0 10.0 5.7 4.3 4.3 4.3 0.2 2.1
Temperature (°C) 25.0 25.0 25.0 500.0 500.0 465.8 35.0 35.0 35.0 35.2 105.0 49.7 49.7
Pressure (kPa) 100.0 100.0 100.0 100.0 100.0 100.0 100.0 100.0 100.0 200.0 200.0 100.0 100.0
Vapour fraction 0.0 0.0 0.0 0.0 1.0 1.0 0.6 1.0 0.0 0.0 0.1 1.0 0.0
Table 38 continued: Final stream table for the tyres to limonene process
Stream number S118 S119 S120 S121 S122 S123 S124 S125 S126 S127 S128 S129 S130
Mass flow (kg/hr) 286.5 71.6 214.9 71.6 10.3 464.5 464.5 28.0 508.2 49.3 458.8 4.6 454.2
Mole flow (kmol/hr) 1.9 0.5 1.4 0.5 0.1 4.4 4.4 0.2 4.7 0.4 4.3 0.0 4.3
Temperature (°C) 208.2 177.0 229.9 177.0 25.0 234.2 100.0 173.5 193.3 175.0 244.5 238.4 238.4
Pressure (kPa) 103.2 100.0 102.5 105.0 100.0 100.0 100.0 100.0 102.5 100.0 100.5 100.5 100.5
Vapour fraction 0.0 0.0 0.0 0.0 0.0 0.0 0.0 0.0 0.0 0.0 0.0 0.0 0.0
Stellenbosch University https://scholar.sun.ac.za
Stellenbosch University https://scholar.sun.ac.za

117
Table 38 continued: Final stream table for the tyres to limonene process
Stream number S131 S132 S133 + S141
Mass flow (kg/hr) 451.6 451.6 245.5
Mole flow (kmol/hr) 3.9 3.9 6.0
Temperature (°C) 123.6 35.0 35.8
Pressure (kPa) 100.0 100.0 100.0
Vapour fraction 0.3 0.0 1.0
Table 39: Equipment list of the waste tyres to limonene process scenario
Equipment name Description
DB-101 Tyre de-beader
ST-101 Tyre shredder
RX-101 Pyrolysis reactor
MG-101 Magnetic separator
EX-000 Tube side of EX-101
EX-101 T- 101 feed preheater
EX-102 Reactor volatiles condenser
DM-101 Volatiles condenser knockout drum
PC-101 Lights remover feed pump
T-101 Light hydrocarbon remover
T-102 Limonene-rich cut purifier
PC-102 Limonene column feed pump
EX-103 DEG cooler
T-103 Limonene recovery column
T-104 DEG regeneration column
EX-104 TDO cooler
HT-101 RX-101 combustion chamber
EX-001 RX-101 heating
EX-002 EX-105 shell side
PC-103 Boiler feed water pump
EX-105 Steam generator
Stellenbosch University https://scholar.sun.ac.za

118
Table 40: Stream names for the waste tyres to limonene process scenario
Stream name Description
S101 Whole tyre feed
S102 Bead wire steel
S103 Whole tyres
S104 Tyre chips
S105 Pyrolysis reactor product
S106 Char and steel
S107 Char product
S108 Steel
S109 Reactor volatiles
S110 Slightly cooled volatile product
S111 Condensed volatiles
S112 Pyrolysis gas
S113 Pyrolysis oil
S114 Pressurised pyrolysis oil
S115 Warm pyrolysis oil feed
S116 T-101 vapour distillate
S117 T-101 liquid distillate
S118 T-101 bottoms product
S119 Limonene-rich stream
S120 T-102 bottoms product
S121 Pressurised limonene-rich stream
S122 DEG make-up
S123 Hot DEG feed
S124 Cool DEG feed
S125 Limonene product
S126 DEG-rich stream
S127 Aromatics product
S128 DEG product
S129 DEG purge
S130 DEG recycle
Stellenbosch University https://scholar.sun.ac.za

119
Table 40 continued: Stream names for the waste tyres to limonene process scenario
Stream name Description
S131 Hot TDO product
S132 Cool TDO product
S133 Fuel gas to RX-101
S134 Combustion air
S135 Hot flue gas
S136 Hot flue gas
S137 Flue gas discharge
S138 Boiler feed water
S139 Pressurised boiler feed water
S140 HP steam
S141 Fuel gas to flare
4.8. Summary
In chapter 4, a conceptual base case process scenario for upgrading waste tyres to limonene was
developed. It was shown that, by using adapted process steps involved in typical waste tyre pyrolysis
flowsheets, and an adapted version of a process for TDO fractionation for valuable chemicals recovery
as basis, a flowsheet for upgrading waste tyres to limonene can be successfully developed. A waste
tyre feed rate of 30 tons/day was found to be a suitable design flow rate for the developed process.
The literature work by Choi et al. (2014) was found to be a suitable source selection of operating
conditions for the pyrolysis reactor, yields of main product fractions, and calculation of yields of
individual components identified. A pyrolysis reactor temperature of 500 °C and pressure of 100 kPa
were found to give the maximum yield of limonene, and they were subsequently chosen as the reactor
operating conditions for the base case process.
Aspen Plus® simulation of the base case process revealed that the process can produce a limonene
stream of 95 wt.% limonene purity at a rate of 28 kg/hr, with an overall limonene recovery of around
95%. It was also found that there is error in predicting the equilibrium phase behaviour of some TDO
compounds using the PR-BM and NRTL thermodynamic models chosen for the simulation, due to lack
of readily available experimentally obtained binary interaction parameters. As such, the need for
experimentally determined phase equilibrium parameters of TDO compounds was highlighted.
Nevertheless, the PR-BM and NRTL property gave acceptable results for the purposes of this study.
Stellenbosch University https://scholar.sun.ac.za

120
The major cooling utility consumers were found to be the reactor volatiles condenser, condenser of
the light hydrocarbon removal column, and the solvent cooler. The pyrolysis reactor represented the
highest heating requirements of any kind, whereas the reboiler of the light hydrocarbon removal
column had the most requirements for the high pressure steam used in the process.
Sensitivity analysis of major column parameters for optimisation (at various number of stages) proved
to be a successful method for allowing selection of optimum column parameters while minimising
total annualised costs. Detailed economics of the process scenario developed in chapter 4 are
discussed in chapter 5.
Stellenbosch University https://scholar.sun.ac.za

121
CHAPTER 5: EVALUATION AND COMPARISON
Overview
In this chapter, objective 4 of this study (evaluation of the developed process scenarios from techno-
economic and energy utilisation viewpoints) is addressed. Detailed procedure for determination of
each component of economic evaluation, and the results of economic evaluation are presented in the
respective subsections. This chapter is subdivided into 8 sections. Section 5.1 outlines the economic
model used in this study. Section 5.2 discusses determination of total capital investment. Section 5.3
discusses how the operating costs were estimated. Section 5.4 provides information on determination
of revenue. Profitability analysis is performed in section 5.5. Section 5.6 presents comparison of
economic performance of the base case scenario with other pre-treatment scenarios and the pyrolysis
for TDO scenario. Sensitivity analysis of key economic parameters for the most profitable scenario is
discussed in section 5.7. A summary of the chapter is given in section 5.8.
5.1. Economic model used in this study
In order to evaluate the economic feasibility of the 30 tons/day process for upgrading waste tyres to
limonene in this study, an economic model was developed, which takes into account changes in the
main process. An overview of the proposed economic model is provided in Figure 55. The different
components of the model are detailed in the numbers (sections) shown in brackets.
Pre-treatment
(Chapter 4)
Cost estimation
Profitability analysis“Discounted cash flow”
(5.5)
Pyrolysis
Separation
Heat recovery
Process
Capital cost“Study estimate
method”(5.2)
Operating costs(5.3)
Revenue (5.4)
IRR, NPV, PBP(5.1.2)
Scenario analysis(5.6)
Sensitivity analysis(5.7)
Figure 55: Overview of the economic model used for evaluation of the waste tyres to limonene process
Stellenbosch University https://scholar.sun.ac.za
122
In the economic model shown in Figure 55, the equipment requirement, and utilities and/or chemicals
usage associated with each individual section of the process is used for estimation of the capital and
operating costs. The resulting (capital and operating) cost estimates are combined with the revenue
estimate and then used as input for a discounted cash flow analysis to determine profitability. The
output of the cash flow analysis is the key economic indicators (KEI), which are used as a measure of
profitability, and form a basis for comparison of the various scenarios considered in this study. The KEI
also form the basis of economic sensitivity analysis for the most profitable scenario.
5.1.1. Main assumptions
The discounted cash flow rate of return (DCFROR) analysis is used for profitability analysis in this study.
Profitability can be evaluated on a discounted or a non-discounted basis. A discounted basis takes the
effects of time into account, whereas a non-discounted basis does not account for the effects of time
(Seider et al., 2004; Turton et al., 2009). The discounted profitability analysis was chosen in this study
as it provides a much better view of the profitability of the project over the entire project life (Seider
et al., 2004).
All cash flow analyses in this study are on a nominal term basis, which means that the effects of
inflation on future revenues and expenses are not taken into account.
A base year of 2016 is used for all cost estimates in this study. Cost indices will be used to adjust for
equipment whose original costs are of a different base year, such that their 2016 costs can be
obtained. Various cost indices such as Chemical Engineering plant cost index, Nelson-Farrar refinery
construction index, Marshall and Swift process industry index, and the Engineering News record
construction index can be used to account for inflation (Turton et al., 2009). These indices show similar
inflationary trends with time; the Chemical Engineering plant cost index (CEPCI) is commonly used
(Turton et al., 2009). A cost index of 556.8 is used for the year 2016 in this study, which was obtained
from Chemengonline (2016).
In this study, all equipment cost estimations based on costs of similar equipment of different
capacities were performed using the sixth-tenths-factor rule. According to Peters and Timmerhaus
(1991), cost estimation for an equipment that has no available cost data for a particular operating
capacity can be performed (with good accuracy) using known cost data for a similar equipment of a
different capacity. This can be achieved using a logarithmic relationship known as the sixth-tenths-
factor rule (shown in Equation 3), provided that the two pieces of equipment are within a tenfold
capacity range of each other.
Stellenbosch University https://scholar.sun.ac.za

123
6+7-315 = 8/�0��')-315 ∗ � 6+7-'4'-�598/�0��')-'4'-�59�
:
Equation 3
� is the exponential factor, which is typically taken as 0.6.
Project lives of 10, 12, and 15 years are typically used for profitability analysis of chemical plants
(Turton et al., 2009). For this study, a project life of 10 years is chosen, as the project evaluated is a
small plant that should be expected to show reasonable profitability at the minimum project life
possible. A waste tyre pyrolysis study by Pilusa et al. (2014) showed reasonable profitability within a
project life of 5 years even though only primary products were produced. It is also assumed that the
plant in this study will be constructed and started-up within 1 year as it is a small plant. The plant in
the study by Pilusa et al. (2014) was also assumed to be constructed and started up within 6 months
of delivery of process equipment. The plant in this study will operate for 8000 hours/year, following
guidelines by Sinnott and Towler (2009), and what has been done in other literature studies for
continuous pyrolysis plants (Nsaful, 2012; Naleli, 2016).
Cash flow generation takes into account taxation and depreciation of the equipment. A tax rate of
28% is used in this study, which is the tax rate set for businesses in South Africa (South African Revenue
Services, 2016).
The depreciation method chosen for this study is the straight-line depreciation method over a period
of 10 years. Straight-line depreciation is the simplest and most common method of depreciation, and
it has been used in several pyrolysis economic evaluation studies (Nsaful, 2012; Dutta et al., 2015;
Naleli, 2016). The plant equipment is depreciated to its salvage value at the end of project life. A
salvage value of zero is used in this study, as the salvage value is difficult to estimate, and a salvage
value of zero is usually assumed (Seider et al., 2004; Turton et al., 2009).
In this study, it is assumed that the project will be fully equity financed, which means that there is no
loan payment (principal debt and interests) expenses. Equity financing is less risky as there exists no
obligation to repay the money invested (Marsh, 1982).
For all cases where conversion is made between the South African rand and the USA dollar, an average
conversion rate of R15/$ is used based on exchange rate trends for the year 2016, obtained from the
South African Reserve bank (2016). The 2016 exchange rate graph is shown in Figure D1 (Appendix D).
Stellenbosch University https://scholar.sun.ac.za

124
5.1.2. Key economic indicators (KEI)
The KEI typically used in DCFROR analysis are: payback period (PBP), net present value (NPV), and
internal rate of return (IRR). The profitability analysis in this study will be based on these KEIs. Each of
the indicators is discussed briefly:
• The PBP is the required time after start-up to recover the total depreciable capital. This is the
point at which the sum of the annual earnings equals the total depreciable capital. It is used
in early stages to compare alternatives. A PBP of less than 2 years is desired for high risk
projects, and PBP should typically not exceed 4 years for a project to be attractive.
• The NPV is the current worth of all cash flow in the project throughout the project life. The
cash flows at the end of each time period are discounted (at a desired discount rate), summed
up and brought back to the first time period. This accounts for time value of money, and an
NPV of above zero indicates profitability, while an NPV of less than zero indicates otherwise.
• The IRR is the discount rate at which the NPV equals zero. This indicates the maximum rate at
which money can be borrowed and the project still breaks even at the end of project life. An
IRR of less than the lending rate results in a negative NPV (non-profitable) while an IRR greater
than lending rates results in a positive NPV (profitable).
The different items that are required for DCFROR in order to generate the KEIs are discussed in section
5.2 to section 5.4.
5.2. Capital cost estimation
The total capital investment (TCI) represents a once-off expense for the design, construction, and
start-up of a new plant or modifications on an existing plant (Seider et al., 2004). TCI is the sum of
total fixed capital investment (TFCI), land, and working capital (WC).
Different methods of estimating TCI are available based on the level of information available, and the
different estimation methods yield varying levels of accuracy. According to Peters and Timmerhaus
(1991), there are five methods of estimation that are normally used for process design purposes.
These methods of estimation are: order-of-magnitude (±30% accuracy), study estimate (±30%
accuracy), preliminary estimate (±20% accuracy), definitive estimate (±10% accuracy) and detailed
estimate (±5% accuracy).
In this study, the study estimate method will be used for capital cost estimation. The study estimate
method requires knowledge of the major process equipment e.g pumps, compressors, columns and
vessels, heat exchangers etc. Each equipment is (roughly) sized, and an approximate cost is
Stellenbosch University https://scholar.sun.ac.za
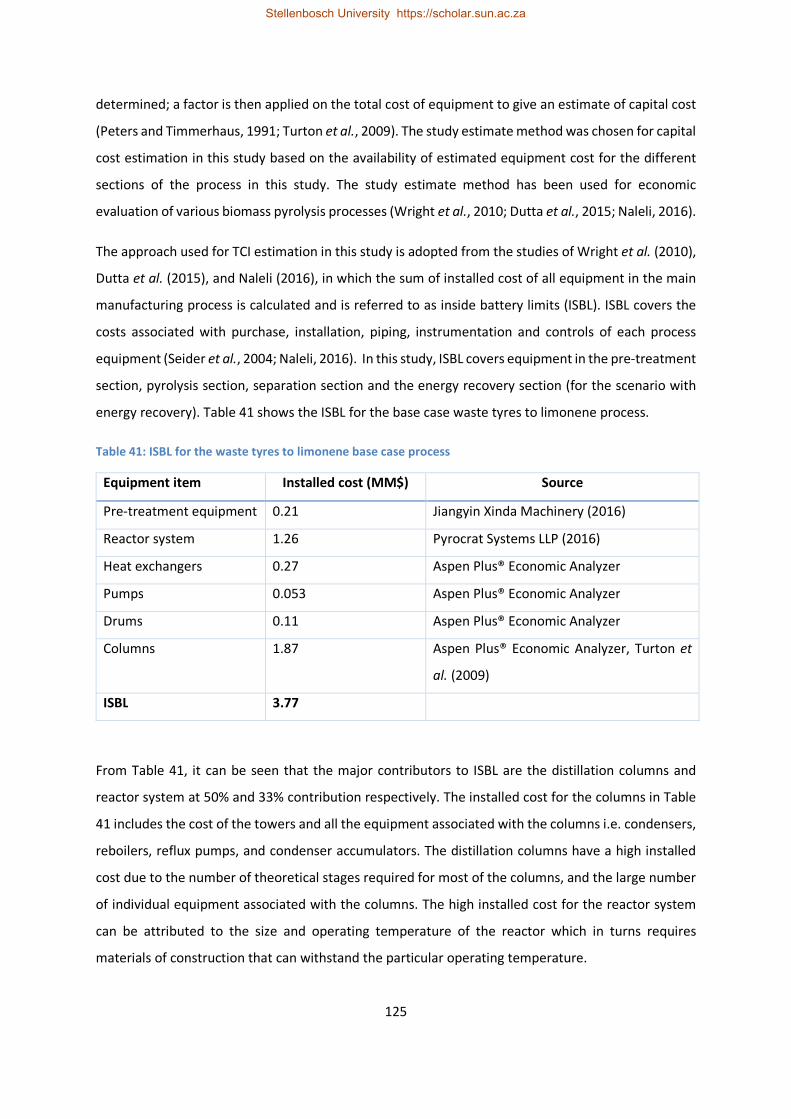
125
determined; a factor is then applied on the total cost of equipment to give an estimate of capital cost
(Peters and Timmerhaus, 1991; Turton et al., 2009). The study estimate method was chosen for capital
cost estimation in this study based on the availability of estimated equipment cost for the different
sections of the process in this study. The study estimate method has been used for economic
evaluation of various biomass pyrolysis processes (Wright et al., 2010; Dutta et al., 2015; Naleli, 2016).
The approach used for TCI estimation in this study is adopted from the studies of Wright et al. (2010),
Dutta et al. (2015), and Naleli (2016), in which the sum of installed cost of all equipment in the main
manufacturing process is calculated and is referred to as inside battery limits (ISBL). ISBL covers the
costs associated with purchase, installation, piping, instrumentation and controls of each process
equipment (Seider et al., 2004; Naleli, 2016). In this study, ISBL covers equipment in the pre-treatment
section, pyrolysis section, separation section and the energy recovery section (for the scenario with
energy recovery). Table 41 shows the ISBL for the base case waste tyres to limonene process.
Table 41: ISBL for the waste tyres to limonene base case process
Equipment item Installed cost (MM$) Source
Pre-treatment equipment 0.21 Jiangyin Xinda Machinery (2016)
Reactor system 1.26 Pyrocrat Systems LLP (2016)
Heat exchangers 0.27 Aspen Plus® Economic Analyzer
Pumps 0.053 Aspen Plus® Economic Analyzer
Drums 0.11 Aspen Plus® Economic Analyzer
Columns 1.87 Aspen Plus® Economic Analyzer, Turton et
al. (2009)
ISBL 3.77
From Table 41, it can be seen that the major contributors to ISBL are the distillation columns and
reactor system at 50% and 33% contribution respectively. The installed cost for the columns in Table
41 includes the cost of the towers and all the equipment associated with the columns i.e. condensers,
reboilers, reflux pumps, and condenser accumulators. The distillation columns have a high installed
cost due to the number of theoretical stages required for most of the columns, and the large number
of individual equipment associated with the columns. The high installed cost for the reactor system
can be attributed to the size and operating temperature of the reactor which in turns requires
materials of construction that can withstand the particular operating temperature.
Stellenbosch University https://scholar.sun.ac.za

126
The purchased cost of pre-treatment equipment and the pyrolysis reactor system were obtained from
Jiangyin Xinda Machinery (2016) and Pyrocrat Systems LLP (2016) respectively. Installation factors of
3.02 and 3 were applied respectively, to give the total installed costs of pre-treatment and pyrolysis
reactor shown in Table 41. The installation factors of 3.02 and 3 were obtained from Wright et al.
(2010) and Jones et al. (2013). Equipment costs quoted for capacities different from this study were
adjusted to obtain costs for the corresponding capacity in this study, using the sixth-tenth-factor rule
from Peters and Timmerhaus (1991).
The Economic Analyzer of Aspen Plus® V8.6 was used to calculate the purchased and installed costs
of minor equipment such as pumps, heat exchangers, and vessels. For equipment costs to be
estimated in Aspen Plus®, equipment sizing results should be within particular sizing parameters
predetermined by Aspen Plus®. However, other costing techniques such as the Guthrie method are
available in literature, which give equipment costs that are just as acceptable as those from
Aspen Plus®. Consequently, the purchased and installed costs of distillation column towers used in
this study were obtained using the bare module costing technique of Guthrie reported in
Turton et al. (2009).
ISBL is then used to calculate the total direct cost (TDC) of capital investment by addition of costs for
additional piping, site development, and warehouse. These additional costs are calculated as
percentages of ISBL, as shown by Wright et al. (2010), Dutta et al. (2015) and Naleli (2016). The
individual components of TDC and their actual amounts for the base case scenario are shown in Table
D1 (in Appendix D). The TDC for the base case scenario is 4.43 MM$.
TDC is then used to calculate the total indirect cost (TIC) of capital investment. TIC represents the non-
construction costs typically associated with project management and engineering, procurement, and
construction services (Dutta et al., 2015). TIC is divided into 5 components (prorateable expenses,
field expenses, home office and construction, project contingency and other costs for start-up, permits
etc.), which are calculated as percentages of TDC (Wright et al., 2010; Dutta et al., 2015). Table D2 in
Appendix D shows the different components of TIC and their actual values for the base case scenario.
The TIC for the base case scenario is estimated at 2.66 MM$.
After TIC has been estimated, the remaining components of TCI are total fixed capital investment
(TFCI), the cost of land, and working capital (WC). TFCI is the sum of TDC and TIC (Dutta et al., 2015).
The cost of land is 2% of TFCI, and WC is normally estimated to be 5% of TFCI (Seider et al., 2004; Jones
et al., 2013; Naleli, 2016). The working capital together with the cost of land are recovered at the end
Stellenbosch University https://scholar.sun.ac.za

127
of the project life. The remaining components of TCI together with the TCI for the base case scenario
are shown in Table D3 in Appendix D.
From Table D3, it can be seen that the TFCI is estimated at 7.1 MM$, the cost of land is 0.14 MM$,
working capital is estimated at 0.35 MM$, and it can be concluded that total capital investment of
7.6 MM$ will be required for the base case scenario.
5.3. Operating cost estimation
The operating cost is the amount of money associated with the day-to-day running of the plant (Turton
et al., 2009). The operating cost can be divided into variable and fixed operating costs. The variable
operating costs are directly related to production rate, and incurred only during operation, whereas
the fixed operating costs are incurred irrespective of the production rate (Turton et al., 2009).
5.3.1. Variable operating costs
The variable operating costs evaluated in this study are the cost of utilities and diethylene glycol (DEG).
The cost of whole tyres is not considered, as it is assumed that a REDISA accredited transporter will
supply the tyres. The utilities considered in this study are cooling water, steam, electricity, and boiler
feed water (for energy recovery). Utilities may be purchased from public or private utility companies,
or a company may build their own facilities. The purchased utilities are based on consumption, and
purchase of utilities can be assumed for early estimates (Seider et al., 2004). Only the steady-state
makeup cost of DEG is considered in this study, as the solvent is recycled. The unit cost of each utility
and DEG is given in Table 42. The annual cost of each utility for the base case scenario is given in Table
43.
Table 42: Unit cost of utilities and DEG
Utility Unit Unit price ($) Reference
Cooling water m3 1.33a City of Cape Town municipality (2016)
Boiler feed water Ton 2.45 Turton et al. (2009)
HP steam Ton 12.1 Seider et al. (2004)
Electricity Kwh 0.098a City of Cape Town municipality (2016)
DEG kg 1.2 Alibaba Group (2016)
aConverted from Rands to $
Stellenbosch University https://scholar.sun.ac.za

128
Table 43: Annual cost of variable expenses for base case scenario
Utility Total cost ($/yr)
Cooling water 275 176
Boiler feed water
HP steam 24 948
Electricity 104 319
DEG 98 880
Total 503 323
From Table 43, it can be seen that cooling water contributes the most to variable operating expenses
(±55%), which is due to a high unit cost of cooling water and high process demand for cooling water.
The cooling water demand can be attributed to the fact that most of the heat exchangers in the
process are coolers/condensers, and a lot of cooling water is also required to condense the reactor
volatiles. The cost of electricity is the second highest contributor to the variable costs (±21%), which
is largely due to the power requirements of the size reduction (shredding) equipment in the pre-
treatment section. From Table 43, it can then be concluded that in order to minimise the variable
operating costs, cooling water usage has to be kept as minimum as possible.
5.3.2. Fixed operating costs
The other factor contributing to operating cost is fixed costs. The fixed costs considered in this study
are salaries, maintenance and property insurance and taxes; these were adapted from studies by
Jones et al. (2013) and by Dutta et al. (2015).
The total cost of salaries can be estimated based on the cost of operating labour (OL) (Peters and
Timmerhaus, 1991). In this study, the amount of operating labour required was adapted from the
study done by Muzenda and Popa (2015) and from information obtained from an operational tyre
pyrolysis plant in South Africa (Wiese, 2017). Muzenda and Popa (2015) reported that an operational
tyre pyrolysis plant in South Africa created sustainable jobs for about 22 people (information about
the respective positions they occupied in the plant was not provided). It has been suggested that an
average of 4-5 people are typically required per reactor per shift (mostly for a batch plant) (Wiese,
2017). In this study, it is assumed that a total of 4 operators will be required per shift since it is a
continuous plant. According to Seider et al. (2004) and Turton et al. (2009), 5 shifts are required for a
chemical plant to account for leave, sick leave and working hours. As such, 5 shifts were considered in
Stellenbosch University https://scholar.sun.ac.za

129
this study to determine the total OL required. The cost of OL in this study is obtained from PayScale
(PayScale, 2016).
The different components of fixed operating costs considered in this study are shown in Table 44, and
the actual cost of each component, together with total operating cost are shown in Table 45.
Table 44: Components of fixed operating costs used in this study
Item Value ($/yr) Reference
OL 7916a (per operator) PayScale (2016)
Supervisor and clerical expenses 15% of OL Peters and Timmerhaus (1991)
Laboratory charges 15% of OL Peters and Timmerhaus (1991)
Maintenance 3% of ISBL Jones et al. (2013), Dutta et al. (2015)
Property insurance and tax 0.7% of TFCI Jones et al. (2013), Dutta et al. (2015)
aConverted from Rands to $
Table 45: Actual fixed costs and total operating cost for the base case scenario
Item Total cost ($/yr)
OL 158 315
Supervisor and clerical expenses 23 747
Laboratory charges 23 747
Maintenance 113 209
Property insurance and tax 49 661
Total fixed costs 368 679
Total operating cost 872 002
From Table 45, it can be seen that labour cost is the largest contributor to the fixed operating cost
(43%), which is largely due to the number of personnel required. An overall total of $872 002 will be
required to cover operating costs for the base case process which is largely composed of the costs of
cooling water (32%), OL (18%), maintenance (13%), and electricity (12%).
5.4. Estimation of revenue
In this study, revenue is generated from the sale of limonene, crude char, steel, and TDO. Excess steam
will be regarded as a saleable product when energy recovery is considered, in order to determine if
there is any economic benefit to energy recovery. The price of tyre-derived limonene in this study is
Stellenbosch University https://scholar.sun.ac.za

130
estimated using the price of citrus-derived limonene of the same purity. An average limonene selling
price or $12/kg was used in this study based on prices of 95% purity limonene shown in Figure 56. All
prices in Figure 56 are 2016 prices unless otherwise indicated.
The prices of char, steel, and TDO were adopted from a waste tyre pyrolysis economic evaluation by
Muzenda and Popa (2015). The char is sold in its crude form without any upgrading, and the steel is
sold as scrap steel. The different fractions of pyrolysis oil that are recovered from the distillation
columns are combined and sold as TDO. The selling price of each product is shown in Table 46. A
breakdown of revenue generated by the waste tyre to limonene process is shown in Table 47.
Figure 56: Limonene prices from various suppliers
Table 46: Product selling prices
Product Unit Unit price ($) Reference
Limonene Kg 12 Florida Chemicals (2016)
Char Kg 0.037a Muzenda and Popa (2015)
Steel Kg 0.047a Muzenda and Popa (2015)
TDO L 0.27a Muzenda and Popa (2015)
Steam Ton 12.1 Seider et al. (2004)
aConverted from Rands to $
0
5
10
15
20
25
30
90 95 96 98.5 99
Pri
ce (
$/k
g)
Purity (wt.%)
Green Terpene (2014)
Xian Sonwu
Haihang industry (2015)
Florida chemicals
Jiangxi Xeusong
XA-BC
Jiangxi Global
Shaanxi Lixin
Puris Natural Aroma
Stellenbosch University https://scholar.sun.ac.za

131
Table 47: Revenue generation for the base case waste tyre to limonene process
Product Revenue generated ($/yr)
Limonene 2 688 000
Char 119 093
Steel 46 667
TDO 1 115 733
Steam
Total 3 969 493
From Table 47, it can be seen that the total annual sales for the base case scenario are just below
4 MM$. Table 47 also shows that even though limonene is produced in small quantities (28 kg/h)
compared to other products, it is the highest contributor to the revenue stream (±68%), which can be
attributed to its high selling price, due to the purity achieved in this study. It can therefore be
concluded that the success of the process in this study will be highly dependent on the purity and
amount of limonene produced.
Table 47 also shows that TDO contributes the second most to the revenue stream (±28%), despite a
low selling price of $0.27/L (R4/L). High revenue contribution from TDO sales can be attributed to a
high TDO production volume, as only a small fraction of the oil condensed from the reactor volatiles
is lost to the limonene stream. It therefore shows that combining the residual liquid streams from the
distillation columns to form the TDO product has a positive impact on revenue generation of the
process. Table 47 also shows that steel sales contribute the least (±1%) to the revenue stream, which
can be attributed to a low selling price and a lower production rate as compared to char and TDO.
5.5. Profitability analysis
In this study, a conservative prime interest rate linked minimum IRR of 12% is adopted for
determination of feasibility, based on historical trends from the South African Reserve bank (2016).
However, in order to encourage investors to invest in a project, an IRR larger than the prime interest
rate needs to be achieved; 25% is typically a rate that investors would look for (Richardson et al., 2007;
Robus, 2013). An IRR of 25% is adopted in this study as being the target for all scenarios to show
attractiveness to investors.
Stellenbosch University https://scholar.sun.ac.za

132
In this study, the NPV will be evaluated between 12% and 25% DCFROR to determine economic
feasibility, and to determine economic attractiveness respectively. The results of profitability analysis
for the base case scenario are shown in Table 48.
Table 48: Key economic indicators for the base case scenario
KEI PBP (years) NPV at 12%
DCFROR
(MM$)
NPV at 15%
DCFROR
(MM$)
NPV at 20%
DCFROR
(MM$)
NPV at 25%
DCFROR
(MM$)
IRR (%)
Value 2.9 6.3 4.7 2.7 1.1 30
The KEIs presented in Table 48 show that the base case process evaluated in this study will be both
economically feasible and economically attractive, owing to the positive NPV value at 12% DCFROR
and an IRR higher than 25%. The economic attractiveness of the base case scenario can be attributed
to high revenue generation from the sales of the high value limonene, and the fact that the residual
TDO adds to the revenue stream, in addition to sales of char and steel. It can also be seen that the
base case scenario meets the desired PBP requirement of less than 4 years (3 years), which would
increase its attractiveness to investors.
The IRR and PBP shown in Table 48 are comparable to those of the study by Pilusa et al. (2014) who
obtained an IRR of 29% and a PBP of between 2 and 3 years for their 30 tons/day process aimed at
producing light-diesel equivalent fuel and refined carbon black as the main products. In the process of
Pilusa et al. (2014), 465 L/hr of the light-diesel equivalent fuel were produced, and sold for $0.52-
0.55/L, whereas 458 kg/hr of refined carbon black were produced, and sold for $0.27- 0.29/kg.
5.6. Scenario analysis and comparison
In this section, the base case scenario that was evaluated in sections 5.2 to 5.5 is compared with other
several scenarios. These scenarios are: the addition of an energy recovery section to the base case
scenario (energy recovery), other pre-treatment scenarios (pre-treatment to crumb and no pre-
treatment/crumb purchase), and the process scenario of waste tyre pyrolysis for TDO production (TDO
production). In this study, comparison of the base case scenario with the other scenarios was
performed on the basis of TCI, operating costs, revenue, and profitability (KEIs used for profitability).
In the “no pre-treatment/crumb purchase” scenario, a crumb flow rate of 30 tons/day is used (fed to
the reactor), which is similar to the 30 tons/day flow rate of whole tyres used for the other scenarios
(although only 90% is fed to the reactor in the other scenarios). For comparison of operating costs,
Stellenbosch University https://scholar.sun.ac.za

133
the cost of crumb has to be taken into account for the crumb purchase scenario, in addition to the
items in Table 42 and Table 44. The cost of crumb was obtained from Dawhi Rubber Recycling (2016),
Energia Rubber Tech (2016), and Mathe Group (2016), as shown in Figure D2 (in Appendix D); an
average value of R3.5/kg ($0.23/kg) was used in this study. Comparison of the different scenarios is
shown in Table 49.
Table 49: Comparison of the different scenarios
Scenario Base case Energy
recovery
Pre-treatment
to crumb
No pre-
treatment
TDO
production
TCI (MM$) 7.6 8.2 9.1 7.4 3.3
Variable operating
costs ($/yr)
503 323 545 763 887 875 2 748 803 247 941
Fixed operating costs
($/yr)
368 679 381 557 400 118 355 594 277 381
Total operating costs
($/yr)
872 002 927 320 1 287 993 3 104 397 525 323
Revenue ($/yr) 3 969 493 4 222 269 3 969 493 4 360 560 1 392 427
IRR (%) 30 27 20 8 17
NPV at DCFROR (MM$)
12% 6.3 5.6 3.4 -1.1 0.71
15% 4.7 4 2 -1.9 0.25
20% 2.7 2 0 -2.8 -0.35
25% 1.1 0.45 -1.3 -3.5 -0.8
30% 0 -0.72 -2.3 -4 -1.1
PBP (years) 2.9 3.2 3.9 6.1 4.4
From Table 49, it can be seen that capital investment of 8.2 MM$ (8% higher than base case) will be
required if the energy recovery section is added to the base case scenario, which is due to additional
equipment required for boiler feed water supply and steam generation. It can also be seen that the
pre-treatment to produce (steel-free) crumb scenario has the most TCI requirements (about 9 MM$),
due to additional equipment required to reduce the size of tyre chips to crumb size. It can also be seen
that even though there is no pre-treatment equipment required for the no pre-treatment scenario,
the TCI requirement is only about 2% lower than for the base case scenario. The difference is only 2%
Stellenbosch University https://scholar.sun.ac.za

134
as equipment cost in the crumb purchase scenario was scaled up (sixth-tenth-factor rule) to account
for an increase in flow rate from the value of the base case scenario. A slight increase in equipment
cost (to account for the slightly increased flow rate) would cancel out the cost savings from having no
pre-treatment equipment, as the major contributors to TCI are present even in the crumb purchase
scenario. Table 49 also shows that the TCI requirement for the TDO production scenario is 43% of the
TCI for the base case scenario, as no distillation columns are required for the TDO production scenario.
On the basis of operating costs, Table 49 shows that the total operating cost of the base case scenario
increase by 6% with addition of the energy recovery section, which is due to slightly higher electricity
costs (7%) from additional requirements by the boiler feed water pump. The cost of boiler feed water
also increases the total operating cost with energy recovery, as steam is generated in excess to utilise
all possible recoverable energy in the flue gas. The operating cost of the pre-treatment to crumb
scenario is 48% higher than the cost of the base case scenario, which is due to additional electricity
costs incurred from crumbing the tyre chips, as tyre size reduction applications are energy intensive.
Table 49 also shows that the no pre-treatment scenario has the largest operating cost (3.1 MM$/year),
which is largely due to the cost of crumb. The cost of crumb contributes 74% to the total operating
cost for the no pre-treatment (crumb purchase) scenario. It can also be seen that the operating cost
of the TDO production scenario is 38% lower than of the base case scenario. The lower operating cost
of the TDO production scenario is due to less utility requirements as compared to the base case
scenario, as TDO production involves less unit operations.
Evaluation of revenue generation shows that adding the energy recovery section to the base case
scenario increases the revenue by 6% (to 4.22 MM$) due to addition of steam sales, as steam is
generated in excess (relative to process requirements). Table 49 shows that the revenue generated
from the crumb purchase scenario is 10% higher than the base case scenario even though there are
no steel sales in the crumb purchase scenario. A slightly higher revenue in the crumb purchase
scenario can largely be attributed to an increased production of limonene, since 10% more material is
available for conversion to limonene. It can also be noted that the revenue generated in the TDO
production scenario is considerably (65%) lower than the revenue generated in the limonene
production scenario. The lower revenue generated is a result of no limonene sales in the TDO
production scenario (in the limonene production scenario, the sales of limonene contribute about 65%
of the revenue even though the limonene flow rate is considerably lower compared to the TDO flow
rate). Even though revenue generation of some other scenarios is different from the base case
scenario, the true effects of the various scenarios can only be ascertained through profitability
evaluation.
Stellenbosch University https://scholar.sun.ac.za

135
In terms of profitability, it can be seen from Table 49 that the base case scenario is the best performing
scenario, whereas the no pre-treatment scenario is the worst performing scenario and will not be
economically feasible as the IRR achieved is less than 12%. The no pre-treatment scenario also has a
PBP of 6.1 years, which also makes it unattractive for investment. It can also be seen that, of the other
3 scenarios (besides the base case scenario), addition of the energy recovery section to the base case
scenario is the only other scenario that achieves economic attractiveness (IRR≥25%). It can also be
concluded that there currently is no economic benefit to energy recovery in the waste tyre pyrolysis
process, as the profitability of the base case scenario decreased from 30% to 27% with addition of the
energy recovery section.
Table 49 also shows that the PBP of the pre-treatment to crumb and TDO production scenarios are
3.9 and 4.4 years respectively, which further shows that they will be economically unattractive
(maximum PBP of 4 years is typically desired for a chemical plant to be economically attractive). The
additional cost of crumbing in the pre-treatment to crumb scenario makes the process economically
unattractive even though economic feasibility is still achieved. The absence of sales of the high value
limonene in the TDO contribute largely to the economic unattractiveness of the TDO production
scenario as demonstrated by the low revenue shown in Table 49.
On the basis of the IRR values shown in Table 49, the limonene product would have to be sold at
$14.2/kg in order to achieve economic attractiveness (IRR=25%) for the pre-treatment to crumb
scenario. In order for the crumb purchase (no pre-treatment) scenario to attain economic feasibility
(IRR=12%), the limonene product would have to be sold at $13.3/kg, or the crumb would have to be
purchased at $0.2/kg (R3/kg). The crumb purchase scenario will then only attain economic
attractiveness if the limonene product is sold at $17.7/kg or if the crumb feed is purchased at $0.09/kg
(R1.4/kg). For the TDO production scenario, the TDO selling price will have to be set at $0.33/L (R5/L)
in order for the process to achieve economic attractiveness.
5.7. Sensitivity analysis
The results of KEIs shown in Table 49 only indicate profitability at fixed/base economic conditions
adopted for this study. Sensitivity analysis then becomes necessary to determine how a particular
process performs with variations in key economic parameters (Robus, 2013). In this study, an
economic sensitivity analysis was performed to study the effects of variation in key parameters on the
economic viability of the base case scenario (best performing scenario). The parameters that have
been selected for sensitivity analysis in this study are reactor system cost, distillation columns cost,
operating expenditure/cost (OPEX), limonene price, TDO price, limonene yield, exchange rate and the
Stellenbosch University https://scholar.sun.ac.za

136
discount rate. A parameter variation of ±50% of the respective base case values has been investigated
in this study. The base case value of each parameter investigated is shown in Table 50.
According to Turton et al. (2009), any economic indicator can be used as a measure of profitability;
however, according to Seider et al. (2004), NPV and IRR are effective measures of profitability. In this
study, sensitivity analysis was performed to study the effects of variation of the various key
parameters on the NPV and IRR. For the discount rate, only the effect on NPV is considered.
Table 50: Base case values for key parameters used for sensitivity analysis in this study
Parameter Value Unit
Reactor system cost 1.26 MM$
Distillation columns cost 1.87 MM$
OPEX 872 002 $/yr
Limonene price 12 $/kg
TDO price 0.27 $/L
Limonene yield 2.52 Wt.%
Exchange rate 15 R/$
Discount rate 12 %
The effect of variation of each key parameter on the NPV is shown in Figure 57. The effect of variation
on the NPV is expressed as a percentage deviation from the NPV at base case conditions.
It is clear from Figure 57 that the process is more sensitive to changes in the cost of distillation
columns, limonene selling price, and the yield of limonene, based on the slopes of the curves (both
positive and negative). The high sensitivity of the process towards the cost of distillation columns
could be due to the fact that column costs contributed the most (50%) to the ISBL in this study, from
which the capital cost was calculated. It should also be noted that capital cost is an expense incurred
in the very beginning of the project, and exerts a high negative influence on the discounted cash flow
as subsequent cash flows are increasingly discounted the further from the beginning they are. It can
thus be expected that items that have a huge influence on the TCI will also have a noticeable impact
on the economics of the process, since TCI is a large value compared to other expenses and cash flow
in this study.
Limonene sales contributed about 68% of the revenue generated in this study, which could explain
the high sensitivity of the process towards the selling price of limonene, as revenue represents the
Stellenbosch University https://scholar.sun.ac.za
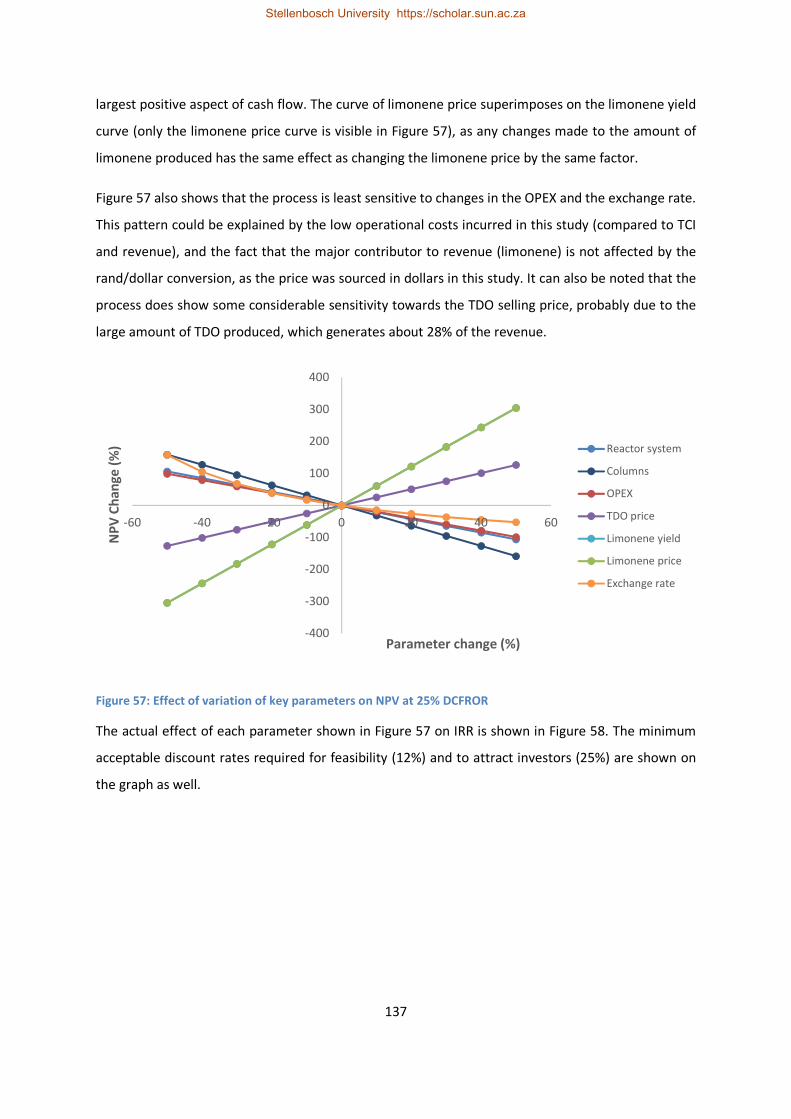
137
largest positive aspect of cash flow. The curve of limonene price superimposes on the limonene yield
curve (only the limonene price curve is visible in Figure 57), as any changes made to the amount of
limonene produced has the same effect as changing the limonene price by the same factor.
Figure 57 also shows that the process is least sensitive to changes in the OPEX and the exchange rate.
This pattern could be explained by the low operational costs incurred in this study (compared to TCI
and revenue), and the fact that the major contributor to revenue (limonene) is not affected by the
rand/dollar conversion, as the price was sourced in dollars in this study. It can also be noted that the
process does show some considerable sensitivity towards the TDO selling price, probably due to the
large amount of TDO produced, which generates about 28% of the revenue.
Figure 57: Effect of variation of key parameters on NPV at 25% DCFROR
The actual effect of each parameter shown in Figure 57 on IRR is shown in Figure 58. The minimum
acceptable discount rates required for feasibility (12%) and to attract investors (25%) are shown on
the graph as well.
-400
-300
-200
-100
0
100
200
300
400
-60 -40 -20 0 20 40 60
NP
V C
ha
ng
e (
%)
Parameter change (%)
Reactor system
Columns
OPEX
TDO price
Limonene yield
Limonene price
Exchange rate
Stellenbosch University https://scholar.sun.ac.za

138
Figure 58: Effect of variation of key parameters on the IRR
From Figure 58, it can be seen that the greatest values of IRR can be achieved by varying the cost of
columns, limonene selling price, and the limonene yield (as also observed in Figure 57). It can be seen
that an IRR of as high as 41% can be achieved with a -50% change in the cost of columns whereas the
IRR drops to 23% with an increase of 50%. To achieve an IRR of 25% (to attract investors), a maximum
(installed) cost of $2 466 429 (31% increase) can be spent on the distillation columns, whereas a
maximum cost of $5 280 878 (181% increase) should be spent to ensure 12% IRR. For the reactor
system (another TCI component varied), it has been calculated that a maximum (purchased) cost of
$1 533 339 (271% increase) can be afforded to ensure the minimum acceptable IRR of 12%, whereas
a maximum of $615 543 (47% increase) should be spent to ensure 25% IRR.
Figure 58 also shows that a 50% drop in limonene price or limonene yield does not render the process
economically infeasible (IRR<12%), whereas an IRR of 44% can be achieved with a 50% increase in
either parameter. A price or yield drop of 58% is required to reduce the IRR of the process to below
12%. It can also be seen that a price or yield drop of more than 16% results in an IRR of less than 25%,
which would not be desirable for investors. A minimum limonene selling price of $5.1/kg is required
to maintain an IRR of 12%, whereas a minimum selling price of $10/kg is required for the process to
maintain 25% IRR. The process requires a minimum limonene yield of 1.1 wt.% (on the basis of a steel-
free tyre feed) to achieve 12% IRR, whereas a minimum yield of 2.1 wt.% is required to attain 25% IRR.
At the base case limonene price and yield, a minimum overall limonene recovery (in the limonene
product stream) of 40% is required to achieve 12% IRR, whereas a minimum overall recovery of 79%
0
5
10
15
20
25
30
35
40
45
50
-60 -40 -20 0 20 40 60
IRR
(%
)
Parameter change (%)
Reactor system
Columns
OPEX
TDO price
Limonene yield
Limonene price
Exchange rate
12% DCFROR
25% DCFROR
Stellenbosch University https://scholar.sun.ac.za

139
is required to ensure 25% IRR. The overall limonene recoveries of 40% and 79% are based on the
limonene produced in the pyrolysis reactor.
It is also evident from Figure 58 that even though the selling price of TDO does not exert much effect
on the IRR, a change of more than -40% in the TDO price will cause the IRR of the process to fall below
25%, which would not be desirable. A minimum TDO selling price of $0.16/L (R2.4/L) is required to
ensure 25% IRR, whereas the minimum acceptable IRR of 12% can be achieved even without any TDO
sales (17% IRR). It can also be seen that it would take an increase of around 50% for either the OPEX
or the exchange rate to really influence the economic attractiveness of the process. The process would
remain attractive to investors up to an exchange rate of R41/$ (173% increase), largely to a huge drop
in the resulting cost (in dollars) of cooling water and electricity, coupled with that the limonene price
in this study is independent of the exchange rate.
Due to the difficulty in predicting future economic conditions (which would influence the minimum
acceptable IRR), a sensitivity analysis of the discount rate was performed to investigate the effect it
has on NPV as shown in Figure 59. A discount rate range of 5-35% was considered in this study. It can
be seen from Figure 59 that the NPV decreases sharply with increasing discount rate and it can also
be concluded that above a discount rate of 30%, the project will start running at a loss.
Figure 59: Effect of discount rate on NPV for base case scenario
In this study, it was deemed necessary to also investigate the effect of production capacity on the IRR
of the process, to determine the feed rates necessary to ensure the minimum acceptable 12% IRR and
the 25% IRR required to attract investors. The effect of feed rate was investigated within a tyre feed
-2
0
2
4
6
8
10
12
14
0 5 10 15 20 25 30 35 40
NP
V (
MM
$)
Discount rate (%)
Stellenbosch University https://scholar.sun.ac.za

140
range of 10 -100 tons/day, which is a range that has been used for waste tyre pyrolysis studies in
literature (Wojtowicz and Serio, 1996; Muzenda and Popa, 2015).
For scaling of the process to determine the flow rates required for 12% and 25% IRR, the capital and
operating costs, and the revenue generated were adjusted by a factor equivalent to dividing the new
flow rate by 30 tons/day (base case flow rate). The TCI was adjusted through equipment costs by using
the sixth-tenth-factor rule. Consequently, fixed operating costs that are calculated as percentages of
components of the TCI were also automatically adjusted through changes in the TCI. The variable
operating costs and revenue were directly multiplied by the resultant factor, to obtain corresponding
values for a particular new flow rate. The effect of variation in production capacity on the IRR is shown
in Figure 60.
From Figure 60, it can be seen that the IRR shows a sharp increase with increasing production capacity,
especially at higher feed rates, which could be attributed to the effects of economy of scale at higher
feed rates. The increase in TCI is not linear since it was adjusted using the sixth-tenth-factor rule, and
it can be expected that the benefits of increased limonene production will far outweigh the
increased TCI at higher feed rates. Figure 60 also shows that a minimum tyre feed rate of just over
20 tons/day (23 tons/day) is required to ensure that the process is economically attractive to investors.
It can also be seen that a minimum flow rate of just over 10 tons/day is required to ensure that the
process achieves the minimum acceptable IRR.
Figure 60: Effect of production capacity on IRR
0
10
20
30
40
50
60
0 20 40 60 80 100 120
IRR
(%
)
Production capacity (tons/day)
12% DCFROR
25% DCFROR
Process
Stellenbosch University https://scholar.sun.ac.za
141
Figure 60 also shows that an IRR as high as 54% can be achieved at a feed rate of 100 tons/day,
however, high feed rates might not be sustainable, which would greatly affect the profitability of
the process. According to information received from two operational REDISA-affiliated tyre pyrolysis
plants that process 20 - 30 tons/day of tyres each, tyre supply is one of the bottlenecks encountered,
as REDISA is responsible for setting up a network of tyre collectors and suppliers (Jefferies, 2017;
Wiese, 2017). Information received from REDISA about waste tyre collection and processing in the
Western Cape for the period December 2014 to June 2016 (Figure D4 in Appendix D) also shows that
993 tons/month (33 tons/day) was the average difference between the amount of tyres collected and
the amount processed (Seebran, 2016).
It can thus be argued that at the current moment (also taking into account that the waste tyre recycling
industry in South Africa is in its infancy stages), high tyre feed rates such as 100 tons/day might not be
sustainable. As such, profitability projections based on such high flow rates would most likely be
negatively affected as there might not be enough revenue generation to overcome the increased TCI
associated with the high flow rates. It can also be argued that with a better-developed/improved
waste tyre recycling industry, scale-ups of the current 30 tons/day process to higher tyre feed rates
could be possible, and as such, could be recommended in future.
5.8. Summary
In this chapter, the base case conceptual process scenario for limonene recovery from waste tyre
pyrolysis was evaluated on the basis of economic performance. TCI, operating costs, revenue
generation, profitability and sensitivity analysis were evaluated for the process. The base case process
scenario was then compared with the energy recovery scenario, other pre-treatment scenarios and
the process scenario of waste tyre pyrolysis for TDO production.
The base case scenario for limonene recovery was found to be economically feasible at current
economic conditions when considering a 30 tons/day process. The base case scenario had a PBP of
just under 3 years, an IRR of 30% with an NPV of 6.3 MM$ at the minimum acceptable IRR of 12%. It
was also found that sales of the residual TDO collected during the process are also vital in ensuring
that the base case scenario remains attractive to investors. Sensitivity analysis of KEIs showed that
changes in the cost of distillation columns, limonene selling price, and the yield of limonene are the
main factors influencing the profitability of the process. A minimum tyre flow rate of 23 tons/day is
required in order for the process to be economically attractive to investors (25% IRR).
Stellenbosch University https://scholar.sun.ac.za

142
Scenario comparison showed that addition of an energy recovery section to the base case scenario
served to bring a negative overall effect on profitability, as the additional capital and operating costs
outweigh the additional benefits brought by steam sales. Comparison of the base case scenario with
other pre-treatment scenarios indicated that the pre-treatment option used in this study is the most
economical of the scenarios. The no pre-treatment scenario (crumb purchase) showed to be the least
economical pre-treatment option, largely due to the cost of crumb. The no pre-treatment scenario
fails to meet the 12% minimum acceptable IRR criteria as it only achieves an IRR of 8%.
When comparing the base case scenario with the tyre pyrolysis for TDO production scenario, it was
demonstrated that the TCI and operating cost of producing TDO are notably lower than for limonene
recovery. Revenue generation from the TDO production scenario is also considerable lower than for
limonene recovery, as there are no sales of the high value limonene. The TDO production scenario
showed that it would not be economically attractive for investment under the current TDO selling
price of $0.27/L, with an IRR of 17%, even though the IRR generated is higher than the minimum
required IRR of 12%.
Stellenbosch University https://scholar.sun.ac.za

143
CHAPTER 6: CONCLUSIONS AND RECOMMENDATIONS
6.1. Conclusions
The aim of this study was to evaluate the economic feasibility of recovering valuable chemicals from
waste tyres through different pyrolysis and separation processes. The aim was set out to be achieved
through addressing the following objectives:
Objective 1: Investigating current technologies available to convert waste tyres into various
valuable chemicals
A thorough literature review of various current methods/technologies used as pathways for dealing
with the waste tyre generation problem was conducted in this study. The analysis demonstrated that
the most common pathways include methods such as direct disposal, material recovery and recycling
and thermal treatment. Direct disposal includes landfilling and stockpiling, material recovery
commonly includes crumbing, milling/grinding, re-treading, devulcanisation and civil engineering
applications whereas thermal treatment mainly includes incineration with energy recovery,
gasification and pyrolysis. Of all these current methods for dealing with waste tyres, it was concluded
that the pyrolysis technology is the most suitable pathway for converting waste tyres into various
valuable chemicals. It was found that the liquid product fraction of waste tyre pyrolysis contains
potentially valuable chemicals such as the BTX compounds, styrene, ethylbenzene and limonene,
which makes pyrolysis the ideal technology.
Objective 2: Proposing and developing various conceptual process scenarios for converting waste
tyres into targeted valuable chemicals
Limonene was selected as the valuable chemical of interest in this study based on its wide industrial
uses and the high selling price that it could potentially command. This study therefore focused on
developing a process that would enable the recovery of limonene from waste tyres via the pyrolysis
technology.
A conceptual base case process scenario was proposed and developed by adapting typical process
steps of waste tyre pyrolysis processes and combining them with an adapted version of the process
developed by Ngwetjana (2017) for recovering limonene from TDO using diethylene glycol. The typical
process steps involved in waste tyre pyrolysis were adapted from pyrolysis processes developed in
several literature studies; the steps were considered up to recovery of primary pyrolysis products. It
was concluded that the following process steps are required for the base case scenario: pre-treatment,
Stellenbosch University https://scholar.sun.ac.za

144
pyrolysis, magnetic separation of char and steel, condensation of reactor volatiles, fractional
distillation, extractive distillation using a solvent and solvent regeneration. Pre-treatment included de-
beading and shredding of whole tyres to form tyre chips, fractional distillation was required to produce
a limonene-rich stream whereas diethylene glycol was used as the solvent for extractive distillation. It
was determined that energy recovery from combustion of the pyrolysis gas does not form part of the
base case scenario and could only be considered for preliminary economic investigation purposes.
Four other process scenarios were proposed that were just either alternatives of the pre-treatment
step of the base case scenario or alternatives of the whole base case scenario (pre-treatment to form
crumb, no pre-treatment, addition of an energy recovery section and pyrolysis for TDO production).
No additional PFDs were developed for these other proposed scenarios as their PFDs could just be
derived from the PFD of the base case process scenario. It was concluded that the other scenarios
would be for economic comparison purposes with the base case scenario.
Objective 3: Developing Aspen Plus® models/simulations for the different scenarios developed
A model of the base case process scenario was developed and evaluated using Aspen Plus® V8.6.
Physical properties for all conventional components were estimated using the PR-BM thermodynamic
model except for the solvent extraction and solvent regeneration columns in which the NRTL and
UNIFAC property models were used. For non-conventional components, enthalpy and density were
calculated using the HCOALGEN and DCOALIGT property models.
Validation of the PR-BM and NRTL thermodynamic models by comparing model-predicted
thermodynamics with literature experimental data revealed that there was some error in predicting
the pure component heat capacities with use of the PR-BM model. Both the PR-BM and NRTL models
also showed some error in predicting the equilibrium phase distribution of some compounds within
the TDO, due to prediction of binary interaction parameters using Aspen Plus®. A need for
experimentally determined phase equilibrium parameters of TDO compounds was highlighted.
Simulation results indicated that the process was able to produce a limonene stream of 95.1 wt.%
limonene purity at a flow rate of 28 kg/hr. The limonene purity achieved was sufficient to meet the
market product specification of 95 wt.% limonene purity required for technical grade limonene. A
limonene recovery of 96% was achieved in the limonene stream on the basis of the limonene-rich
stream feed, which translated to an overall limonene recovery of 94% on the basis of the limonene
produced in the pyrolysis reactor. Normal distillation was able to separate the solvent used and the
Stellenbosch University https://scholar.sun.ac.za

145
entrained impurities; the solvent was recycled back at sufficient recovery and purity (99%), which
reduced the demand for make-up solvent.
Objective 4: Evaluation of the various scenarios from techno-economic and energy utilisation
viewpoints
A discounted cash flow analysis was performed for the various scenarios (base case, pre-treatment to
crumb, no pre-treatment, energy recovery and TDO production) and compared on the basis of IRR,
PBP and NPV. Economic analysis showed that the base case scenario was both feasible and attractive
for investment with an IRR of 30%, a PBP of 2.9 years, and NPV values of 6.3 and 1.1 MM$ at 12% and
25% IRR respectively. The base case scenario was found to require TCI of 7.6 MM$, total operating
cost of $872 002/year and generated 4 MM$/year. It was also demonstrated that TDO sales are also
necessary to ensure the process remained economically attractive.
Economic comparison of the base case scenario with the other scenarios revealed that the base case
scenario was the best performing scenario. The worst performing scenario was found to be the no
pre-treatment scenario with an IRR of 8%, a PBP of 6.1 years and an NPV of -1.3 MM$ at 12% IRR.
Evaluation of the energy recovery scenario indicated that addition of an energy recovery section to
the base case scenario had an overall negative effect on the profitability of the process. From
evaluation of the TDO production scenario, it was concluded that waste tyre pyrolysis for limonene
recovery (with residual TDO sold as fuel) is more economically feasible than selling all the TDO
produced as fuel.
Sensitivity analysis of the base case scenario (best performing scenario) showed that the process is
mostly influenced by changes in the cost of distillation columns, limonene selling price and the yield
of limonene. In order to remain economically attractive to investors (25% IRR), the process required a
minimum limonene selling price of $10/kg, which was 83% of the assumed price of citrus-derived
limonene used as reference. A minimum limonene yield of 2.1 wt.% (on a steel-free basis) was
required for the process to achieve 25% IRR for economic attractiveness, which is within the common
limit of limonene yield found in literature. It was also found that changes in OPEX and the exchange
rate affect the feasibility of the process the least.
With respect to energy utilisation, an evaluation of the energy requirements of each process
equipment of the base case scenario was performed with the aid of Aspen Plus® V8.6 and supplier
quotes. It was found that the pyrolysis reactor accounted for 73% (544 kW) of the total heating
requirements of the process. The pyrolysis reactor volatiles condenser had the most requirement for
Stellenbosch University https://scholar.sun.ac.za

146
cooling utilities (235 kW) which represented 52% of the total cooling requirements of the process.
Heating of the oil feed stream to the first separation column with hot reactor volatiles was found to
reduce the demand for both heating and cooling utilities by 19 kW, with annual savings of $14 000 in
utility costs. With addition of an energy recovery section to the base case scenario, it was found that
the process was able to supply the heating requirements of the pyrolysis reactor and all the steam
requirements.
6.2. Recommendations
The limonene product recovered in this study represented less than 7% of the pyrolysis oil produced,
with the majority of the remaining oil fraction sold as a low value TDO product. The sales of TDO
represented 28% of the revenue generated in this study, which demonstrated the importance of the
residual TDO to the economic success of the limonene recover process. Further work could consider
conversion of the residual TDO into carbon black that could be used in the tyre manufacturing process
(carbon black would have higher market value than TDO as a fuel).
The current study demonstrated economic feasibility of a process that targeted the recovery of a
single valuable compound only (limonene) from the pyrolysis oil produced. Further work could look at
expanding the scope of the current study by evaluating the recovery of other high value compounds
in the oil that are usually present in large quantities, like the BTX compounds and styrene, in addition
to limonene. Styrene could be re-used in the manufacturing of styrene-butadiene rubber that could
be used in tyre formulation, thereby forming a tyre raw material recycle loop.
Due to a wide variety of chemical compounds in pyrolysis oil, prediction of product distribution was
limited to compounds for which polynomial equations could be developed. Further work could
consider generation of reaction kinetic data that would be used to develop kinetic models of formation
of targeted (valuable) compounds. Prediction of product distribution based on kinetic models could
greatly improve the accuracy of simulation results, which would lead to improved equipment sizing
results. The kinetic models developed could also then be implemented in optimisation of pyrolysis
conditions depending on targeted (valuable) compounds.
Stellenbosch University https://scholar.sun.ac.za

147
REFERENCES
Abdelouahed, L., Authier, O., Mauviel, G., Corriou, J.P., Verdier, G. and Dufour, A. 2012. Detailed
modeling of biomass gasification in dual fluidized bed reactors under Aspen Plus. Energy &
Fuels, 26(6), pp.3840-3855.
Adeyemi, I. and Janajreh, I. 2015. Modeling of the entrained flow gasification: Kinetics-based ASPEN
Plus model. Renewable Energy, 82, pp.77–84.
Adhikari, B., De, D. and Maiti, S. 2000. Reclamation and recycling of waste rubber. Progress in Polymer
Science (Oxford), 25(7), pp.909–948.
Aguado, J., Serrano, D.P. and Escola, J.M. 2008. Fuels from waste plastics by thermal and catalytic
processes: A review. Industrial and Engineering Chemistry Research, 47(21), pp.7982–7992.
Ahmed, A.M.A., Salmiaton, A., Choong, T.S.Y. and Azlina, W.W. 2015. Review of kinetic and equilibrium
concepts for biomass tar modeling by using Aspen Plus. Renewable and Sustainable Energy
Reviews, 52, pp.1623-1644.
Al Amoodi, N., Kannan, P., Al Shoaibi, A. and Srinivasakannan, C. 2013. Aspen Plus simulation of
polyethylene gasification under equilibrium conditions. Chemical Engineering Communications,
200(7), pp.977-992.
Alibaba Group ®.2016. [Online] Available from http://www.alibaba.com/. [Accessed on: 22 August
2016].
Alqahtani, A., Hellgardt, K., Holdich, R. and Cumming, I. 2007. Integrated knowledge based system for
process synthesis. Computer Aided Chemical Engineering, 24, p.437
Alsaleh, A. and Sattler, M.L., 2014. Waste Tire Pyrolysis: Influential Parameters and Product Properties.
Current Sustainable/Renewable Energy Reports, 1(4), pp.129–135.
Altayeb, R.K. 2015. Liquid fuel production from pyrolysis of waste tires : process simulation , exergetic
analysis , and life cycle assessment, MSc thesis, Department of Chemical Engineering, American
University of Sharjah
Amari, T., Themelis, N.J. and Wernick, I.K., 1999. Resource recovery from used rubber tires. Resources
Policy, 25(3), pp.179–188.
Stellenbosch University https://scholar.sun.ac.za

148
Ambrose, D. and Hall, D.J. 1981. Thermodynamic properties of organic oxygen compounds L. The
vapour pressures of 1,2-ethanediol (ethylene glycol) and bis(2-hydroxyethyl) ether (diethylene
glycol). The Journal of Chemical Thermodynamics, 13(1), pp.61-66.
Arabiourrutia, M., Lopez, G., Elordi, G., Olazar, M., Aguado, R. and Bilbao, J. 2007. Product distribution
obtained in the pyrolysis of tyres in a conical spouted bed reactor. Chemical Engineering
Science, 62(18), pp.5271-5275.
Ashour, I., Fatemi, A., Vakili-Nezhaad, G. and Al-Rawahi, N. 2011. Applications of Equations of State in
the Oil and Gas Industry (pp. 165-178). INTECH Open Access Publisher.
ASPEN TECHNOLOGY. 2009. Aspen Simulation User guide. Burlington, MA: Aspen Technology.
ATA Engineering. 2015. Conceptual design. [Online] Available from: http://www.ata-e.com/-
http://www.ata-e.com/services/conceptual. [Accessed: 18 April 2015].
Aydin, H. and Ilkiliç, C. 2012. Optimization of fuel production from waste vehicle tires by pyrolysis and
resembling to diesel fuel by various desulfurization methods. Fuel, 102, pp.605–612.
Aydın, H. and İlkılıç, C., 2015. Analysis of combustion, performance and emission characteristics of a
diesel engine using low sulfur tire fuel. Fuel, 143, pp.373–382.
Aylón, E., Fernández-Colino, A., Navarro, M.V., Murillo, R., García, T. and Mastral, A.M. 2008. Waste
tire pyrolysis: comparison between fixed bed reactor and moving bed reactor. Industrial & Engineering
Chemistry Research, 47(12), pp.4029-4033.
Bajus, M. and Olahová, N. 2011. Thermal conversion of scrap tyres. Petroleum and Coal, 53(2), pp.98–
105.
Barlaz, M.A., Eleazer, W.E. and Whittle, D.J.1993. Potential to use waste tires as supplemental fuel in
pulp and paper mill boilers, cement kilns and in road pavement. Waste management &
research, 11(6), pp.463-480.
Banar, M., Akyıldız, V., Özkan, A., Çokaygil, Z. and Onay, Ö. 2012. Characterization of pyrolytic oil
obtained from pyrolysis of TDF (Tire Derived Fuel). Energy Conversion and Management, 62, pp.22-
30.
Bassano, C., Deiana, P. and Girardi, G. 2014. Modeling and economic evaluation of the integration of
carbon capture and storage technologies into coal to liquids plants. Fuel, 116, pp.850–860.
Stellenbosch University https://scholar.sun.ac.za
149
Benallal, B., Roy, C., Pakdel, H., Chabot, S. and Poirier, M.A. 1995. Characterization of pyrolytic light
naphtha from vacuum pyrolysis of used tyres comparison with petroleum naphtha. Fuel, 74(11),
pp.1589-1594.
Bender, D.L. 2007. Tire retreading - the rationale and a review of technologies. Rubber World, 236(6),
pp.34–40.
Bennett, G. 1993. Scrap tire technology and markets: by US Environmental Protection Agency and C.
Clark, K. Meardon and D. Russell of Pacific Environmental Services, Noyes Data Corp., Park Ridge, NJ,
ISBN 0-8155-1317-8, 1993, 316 pp., $54.
Berrueco, C., Esperanza, E., Mastral, F.J., Ceamanos, J. and García-Bacaicoa, P. 2005. Pyrolysis of waste
tyres in an atmospheric static-bed batch reactor: Analysis of the gases obtained. Journal of Analytical
and Applied Pyrolysis, 74(1), pp.245-253.
Boxiong, S., Chunfei, W., Binbin, G. and Rui, W. 2007. Pyrolysis of waste tyres with zeolite USY and
ZSM-5 catalysts. Applied Catalysis B: Environmental, 73(1), pp.150-157.
Brondani, L.B., Flores, G.B. and Soares, R.P. 2015. Modeling and Simulation of a Benzene Recovery
Process By Extractive Distillation. Brazilian Journal of Chemical Engineering, 32(1), pp.283–291.
CARiD™. 2016. [Online] Available from: https://www.carid.com/articles/the-hidden-secrets-of-
tires.html. [Accessed on: 16 October 2016].
Carlson, E.C. 1996. Don't gamble with physical properties for simulations. Chemical Engineering
Progress, 92(10), pp.35-46.
Chao, L.I., Dai, Z.H., Ji, Y.A.N.G., Yu, G.S. and Wang, F.C. 2015. Modelling and energy analysis of an
integrated coal gasification and pyrolysis system for synthetic natural gas. Journal of Fuel Chemistry
and Technology, 43(7), pp.779-789.
Chaala, A. and Roy, C. 1996. Production of coke from scrap tire vacuum pyrolysis oil. Fuel Processing
Technology, 46(3), pp.227–239.
Chemengonline. 2016. [Online] Available from: http://www.chemengonline.com/current-economic-
trends-march-2016/?printmode=1. [Accessed on: 10 August 2016].
ChemSpider. 2016. 1, 1, 6-Trimethyl-1, 2-dihydronaphthalene. [Online] Available from:
http://www.chemspider.com/Chemical-Structure.108567.html. [Accessed on: 01 November 2016].
Stellenbosch University https://scholar.sun.ac.za

150
ChemSpider. 2016. 1, 2, 4-Trimethylenecyclohexane. [Online] Available from:
http://www.chemspider.com/Chemical-Structure.496197.html. [Accessed on: 01 November 2016].
ChemSpider. 2016. 1, 2, 5, 5-Tetramethyl-1, 3-cyclopentadiene. [Online] Available from:
http://www.chemspider.com/Chemical-Structure.497460.html. [Accessed on: 01 November 2016].
Chen, C.C. and Mathias, P.M. 2002. Applied thermodynamics for process modeling. AIChE
Journal, 48(2), pp.194-200.
Chen, F. and Qian, J. 2002. Studies on the thermal degradation of cis-1, 4-polyisoprene. Fuel, 81(16),
pp.2071-2077.
Cheung, K.Y., Lee, K.L., Lam, K.L., Chan, T.Y., Lee, C.W. and Hui, C.W. 2011. Operation strategy for
multi-stage pyrolysis. Journal of Analytical and Applied Pyrolysis, 91(1), pp.165-182.
Chickos, J.S. and Acree, W.E. 2003. Enthalpies of vaporization of organic and organometallic
compounds, 1880-2002. Journal of Physical and Chemical Reference Data, 32(2), pp.519–878.
Chien, J.C.W. and Kiang, J.K.Y. 1979. Polymer reactions—X thermal pyrolysis of poly
(isoprene). European Polymer Journal, 15(11), pp.1059-1065.
Ciriminna, R., Lomeli-Rodriguez, M., Carà, P.D., Lopez-Sanchez, J.A. and Pagliaro, M. 2014. Limonene:
a versatile chemical of the bioeconomy. Chemical Communications, 50(97), pp.15288-15296.
City of Cape Town. 2016. Electricity tariffs. [Online] Available from:
https://www.capetown.gov.za/en/electricity/Elec%20Tariffs%20201617/ElectricityConsumptiveTarif
fs-1617.pdf. [Accessed on: 16 August 2016].
City of Cape Town. 2016. Water and sanitation tariffs. [Online] Available from:
https://www.capetown.gov.za/en/Budget/Budget%20201516%20Final/Utility%20Services%20-
%20Water%20and%20Sanitation%20-%20Water%20-%20Consumptive%20(20%20percent).pdf.
[Accessed on: 16 August 2016].
Choi, G.G., Jung, S.H., Oh, S.J. and Kim, J.S., 2014. Total utilization of waste tire rubber through
pyrolysis to obtain oils and CO 2 activation of pyrolysis char. Fuel Processing Technology, 123, pp.57-
64.
Stellenbosch University https://scholar.sun.ac.za

151
Clará, R.A., Marigliano, A.C.G. and Sólimo, H.N. 2009. Density, viscosity, and refractive index in the
range (283.15 to 353.15) K and vapor pressure of α-pinene, d-limonene,(±)-linalool, and citral over the
pressure range 1.0 kPa atmospheric pressure. Journal of Chemical & Engineering Data, 54(3), pp.1087-
1090.
Conesa, J.A., Martin-Gullon, I., Font, R. and Jauhiainen, J. 2004. Complete study of the pyrolysis and
gasification of scrap tires in a pilot plant reactor. Environmental science & technology, 38(11),
pp.3189-3194.
Conesa, J.A., Gálvez, A., Mateos, F., Martín-Gullón, I. and Font, R. 2008. Organic and inorganic
pollutants from cement kiln stack feeding alternative fuels. Journal of Hazardous Materials, 158(2),
pp.585-592.
Cunliffe, A.M. and Williams, P.T., 1998a. Composition of oils derived from the batch pyrolysis of tyres.
Journal of Analytical and Applied Pyrolysis, 44(2), pp. 131-152.
Cunliffe, A.M. and Williams, P.T. 1998b. Properties of Chars and Activated Carbons Derived from the
Pyrolysis of Used Tyres. Environmental Technology, 19(12), pp.1177–1190.
Curry, J. 2010. The Engineering method and Skill development. [Online] Available:
http://www.eng.usyd.edu.au/webnet/ENGG1803/UserFiles/File/wk 2-2 Eng Method.pdf [Accessed:
16 December 2010].
Dabić-Ostojić, S. et al., 2014. Applying a mathematical approach to improve the tire retreading
process. Resources, Conservation and Recycling, 86, pp.107–117.
Dabić-Ostojić, S., Miljuš, M., Bojović, N., Glišović, N. and Milenković, M. 2014. Applying a mathematical
approach to improve the tire retreading process. Resources, Conservation and Recycling, 86, pp.107-
117.
Danon, B., Van Der Gryp, P., Schwarz, C.E. and Görgens, J.F. 2015. A review of dipentene (dl-limonene)
production from waste tire pyrolysis. Journal of Analytical and Applied Pyrolysis, 112, pp.1-13.
Diederichs, G.W. 2015. Techno-economic assessment of processes that produce jet fuel from plant-
derived sources, MEng thesis, Department of Process Engineering, Stellenbosch University.
Dıez, C., Martınez, O., Calvo, L.F., Cara, J. and Morán, A. 2004. Pyrolysis of tyres. Influence of the final
temperature of the process on emissions and the calorific value of the products recovered. Waste
Management, 24(5), pp.463-469.
Stellenbosch University https://scholar.sun.ac.za

152
Díez, C., Sánchez, M.E., Haxaire, P., Martínez, O. and Morán, A. 2005. Pyrolysis of tyres: A comparison
of the results from a fixed-bed laboratory reactor and a pilot plant (rotatory reactor). Journal of
Analytical and Applied Pyrolysis, 74(1), pp.254-258.
Douglas, J.M. 1988. Conceptual design of chemical processes. McGraw-Hill.
Dũng, N.A., Klaewkla, R., Wongkasemjit, S. and Jitkarnka, S., 2009. Light olefins and light oil production
from catalytic pyrolysis of waste tire. Journal of Analytical and Applied Pyrolysis, 86(2), pp.281-286.
Dutta, A., Sahir, A., Tan, E., Humbird, D., Snowden-Swan, L. J., Meyer, P., Ross, J., Sexton, D., Yap, R.
2015. Process Design and Economics for the Conversion of Lignocellulosic Biomass to Hydrocarbon
Fuels. Thermochemical Research Pathways with In Situ and Ex Situ Upgrading of Fast Pyrolysis Vapors.
, (March 2015), p.275.
Edwards, D.W., Danon, B., van der Gryp, P. and Görgens, J.F., 2016. Quantifying and comparing the
selectivity for crosslink scission in mechanical and mechanochemical devulcanization processes. J.
Appl. Polym. Sci. 43932 doi: 10.1002/app.43932
Edwards, J.H., Smith, I.W. and Tyler, R.J. 1980. Flash pyrolysis of coals: comparison of results from 1
gh− 1 and 20 kg h− 1 reactors. Fuel, 59(10), pp.681-686
Emets, S. V., Hoo, K.A. and Mann, U. 2006. A modified hierarchy for designing chemical processes.
Industrial and Engineering Chemistry Research, 45(14), pp.5037–5043.
Emun, F., Gadalla, M., Majozi, T. and Boer, D. 2010. Integrated gasification combined cycle (IGCC)
process simulation and optimization. Computers & chemical engineering, 34(3), pp.331-338
Eriksson, L., Arnhold, T., Beck, B., Fox, T., Johansson, E. and Kriegl, J.M. 2004. Onion design and its
application to a pharmaceutical QSAR problem. Journal of chemometrics, 18(3‐4), pp.188-202.
Fels, M. and Pegg, M. 2009. A techno-economic and environmental assessment of a tire pyrolysis plant
Mort Fels and Michael Pegg Chemical Engineering; Dalhousie University Halifax, NS; Canada. Carbon,
(2009), pp.2–7.
Fernández, A.M., Barriocanal, C. and Alvarez, R. 2012. Pyrolysis of a waste from the grinding of scrap
tyres. Journal of Hazardous Materials, 203–204, pp.236–243.
Florida Chemical Co., 1991a. Marketing Data Sheet: d-limonene. Lake Alfred, FL.
Florida Chemical Co., 1991b. Product Data Sheet: d-limonene. Lake Alfred, FL.
Stellenbosch University https://scholar.sun.ac.za

153
Florida Chemical Co., 1991c. Material Safety Data Sheet: d-limonene. Lake Alfred, FL.
Foo, D.C.Y., Selvan, M. and McGuire, M.L. 2005. Integrate process simulation and process
synthesis. Chemical engineering progress, 101(10), pp.25-29
François, J., Abdelouahed, L., Mauviel, G., Patisson, F., Mirgaux, O., Rogaume, C., Rogaume, Y., Feidt,
M. and Dufour, A. 2013. Detailed process modeling of a wood gasification combined heat and power
plant. Biomass and bioenergy, 51, pp.68-82.
François, J., Mauviel, G., Feidt, M., Rogaume, C., Rogaume, Y., Mirgaux, O., Patisson, F. and Dufour, A.
2013. Modeling of a biomass gasification CHP plant: influence of various parameters on energetic and
exergetic efficiencies. Energy & Fuels, 27(12), pp.7398-7412.
Frigo, S., Seggiani, M., Puccini, M. and Vitolo, S. 2014. Liquid fuel production from waste tyre pyrolysis
and its utilisation in a Diesel engine. Fuel, 116, pp.399-408.
Garcia, P.S., de Sousa, F.D.B., de Lima, J.A., Cruz, S.A. and Scuracchio, C.H. 2015. Devulcanization of
ground tire rubber: Physical and chemical changes after different microwave exposure times. Express
Polym. Lett., 9, pp.1015-1026.
Giugliano, M., Cernuschi, S., Ghezzi, U. and Grosso, M. 1999. Experimental evaluation of waste tires
utilization in cement kilns. Journal of the Air & Waste Management Association, 49(12), pp.1405-1414.
GoIndustry Dovebid SA (Pty) Ltd. 2016. [Online]. Available from: http://international.go-
dove.com/data/Auctions/Auction19472/documents/Tyre%20Plant%20Visitor%20Presentation5.pdf.
[Accessed on 02 January 2017].
González, J.F., Encinar, J.M., Canito, J.L. and Rodrıguez, J.J. 2001. Pyrolysis of automobile tyre waste.
Influence of operating variables and kinetics study. Journal of Analytical and Applied Pyrolysis, 58,
pp.667-683.
Gopaul, S.G., Dutta, A. and Clemmer, R. 2014. Chemical looping gasification for hydrogen production:
A comparison of two unique processes simulated using ASPEN Plus. International Journal of Hydrogen
Energy, 39(11), pp.5804–5817.
Görling, M., Larsson, M. and Alvfors, P. 2013. Bio-methane via fast pyrolysis of biomass. Applied
Energy, 112, pp.440–447.
Stellenbosch University https://scholar.sun.ac.za

154
Green Terpene™.2014. [Online] Available from: www.greenterpene.com. [Accessed on 20 June
2014].
Grieco, E., Bernardi, M. and Baldi, G. 2008. Styrene-butadiene rubber pyrolysis: Products, kinetics,
modelling. Journal of Analytical and Applied Pyrolysis, 82(2), pp.304–311.
Grossmann, I.E., Caballero, J.A. and Yeomans, H. 2000. Advances in mathematical programming for
the synthesis of process systems. Latin American Applied Research, 30(4), pp.263-284.
Gu, W., Wang, K., Huang, Y., Zhang, B., Chen, Q. and Hui, C.W. 2015. Energy Optimization for a
Multistage Crude Oil Distillation Process. Chemical Engineering & Technology, 38(7), pp.1243-1253
Hammer, N.L., Boateng, A.A., Mullen, C.A. and Wheeler, M.C. 2013. Aspen Plus® and economic
modeling of equine waste utilization for localized hot water heating via fast pyrolysis. Journal of
environmental management, 128, pp.594-601.
Handbook—Fundamentals, A.S.H.R.A.E., 2005. SI edition. Atlanta, GA: American Society of Heating,
Refrigerating and Air-Conditioning Engineers, Inc.
Handbook—Fundamentals, A.S.H.R.A.E., 2013. SI edition. Atlanta, GA: American Society of Heating,
Refrigerating and Air-Conditioning Engineers, Inc.
He, C., Feng, X. and Chu, K.H. 2013. Process modeling and thermodynamic analysis of Lurgi fixed-bed
coal gasifier in an SNG plant. Applied Energy, 111, pp.742–757.
Henley, E.J., Seader, J.D. and Roper, D.K. 2011. Separation Process Principles. New York: Wiley.
Hita, I., Arabiourrutia, M., Olazar, M., Bilbao, J., Arandes, J.M. and Sánchez, P.C. 2016. Opportunities
and barriers for producing high quality fuels from the pyrolysis of scrap tires. Renewable and
Sustainable Energy Reviews, 56, pp.745-759.
Infrastructurene. 2016. Waste tyres. [Online] Available from:
http://www.infrastructurene.ws/2016/02/24/waste-tyres-the-new-coal/. [Accessed on: 16 October
2016]
Islam, M.R., Joardder, M.U.H., Hasan, S.M., Takai, K. and Haniu, H. 2011. Feasibility study for thermal
treatment of solid tire wastes in Bangladesh by using pyrolysis technology. Waste management, 31(9),
pp.2142-2149.
Stellenbosch University https://scholar.sun.ac.za

155
Islam, M.R., Tushar, M.S.H.K. and Haniu, H. 2008. Production of liquid fuels and chemicals from
pyrolysis of Bangladeshi bicycle/rickshaw tire wastes. Journal of Analytical and Applied Pyrolysis, 82(1),
pp.96–109.
Ismail, H.Y., Abbas, A., Azizi, F. and Zeaiter, J. 2017. Pyrolysis of waste tires: A modeling and parameter
estimation study using Aspen Plus®. Waste Management, 60, pp.482-493.
Jacob, P., Kashyap, P., Suparat, T., and Visvanathan, C. 2014. Dealing with emerging waste streams:
Used tyre assessment in Thailand using material flow analysis. Waste Management & Research,
32(August), pp.918–926.
Jaksland, C.A., Gani, R. and Lien, K.M., 1995. Separation process design and synthesis based on
thermodynamic insights. Chemical Engineering Science, 50(3), pp.511-530.
Janajreh, I. & Raza, S.S. 2015. Numerical simulation of waste tyres gasification. Waste Management
& Research, 33(5), pp.460–468.
Jones, S., Meyer, P., Snowden-Swan, L., Padmaperuma, A., Tan, E., Dutta, A., Jacobson, J., Cafferty, K.
2013. Process Design and Economics for the Conversion of Lignocellulosic Biomass to Hydrocarbon
Fuels Fast Pyrolysis and Hydrotreating. PNNL Report, PNNL-23053, p.97.
Jefferies, T. 2017, Personal interview. 5 january, Stellenbosch.
Kääntee, U., Zevenhoven, R., Backman, R. and Hupa, M. 2004. Cement manufacturing using alternative
fuels and the advantages of process modelling. Fuel Processing Technology, 85(4), pp.293-301.
Kaminsky, W. and Mennerich, C. 2001. Pyrolysis of synthetic tire rubber in a fluidised-bed reactor to
yield 1,3-butadiene, styrene and carbon black. Journal of Analytical and Applied Pyrolysis, 58–59,
pp.803–811.
Kaminsky, W., Mennerich, C. and Zhang, Z. 2009. Feedstock recycling of synthetic and natural rubber
by pyrolysis in a fluidized bed. Journal of Analytical and Applied Pyrolysis, 85(1–2), pp.334–337.
Kandasamy, J. and Gökalp, I. 2014. Pyrolysis , Combustion , and Steam Gasi fi cation of Various Types
of Scrap Tires for Energy Recovery. Energy & Fuels, 29, pp.346–354.
Kar, Y. 2011. Catalytic pyrolysis of car tire waste using expanded perlite. Waste Management, 31(8),
pp.1772–1782.
Stellenbosch University https://scholar.sun.ac.za

156
Ko, D.C., Mui, E.L., Lau, K.S. and McKay, G. 2004. Production of activated carbons from waste tire–
process design and economical analysis. Waste Management, 24(9), pp.875-888.
Ko, M.S., Na, S. and Kim, H. 2002. Simulation of the aromatic recovery process by extractive
distillation. Korean Journal of Chemical Engineering, 19(6), pp.996–1000.
Kong, X., Zhong, W., Du, W. and Qian, F. 2014. Compartment modeling of coal gasification in an
entrained flow gasifier: A study on the influence of operating conditions. Energy Conversion and
Management, 82, pp.202-211.
Kusiak, A. and Finke, G. 1987. Hierarchical approach to the process planning problem. Discrete applied
mathematics, 18(2), pp.175-184.
Kwon, E. and Castaldi, M.J. 2009. Fundamental understanding of the thermal degradation mechanisms
of waste tires and their air pollutant generation in a N2 atmosphere. Environmental Science and
Technology, 43(15), pp.5996–6002.
Kyari, M., Cunliffe, A. and Williams, P.T., 2005. Characterization of oils, gases, and char in relation to
the pyrolysis of different brands of scrap automotive tires. Energy and Fuels, 19(3), pp. 1165-1173.
Lamprecht, S.M. 2010. Establishing a facility to measure packed column hydrodynamics, MSc thesis,
Department of Process Engineering, Stellenbosch University.
Lamprecht, S.M. 2010. Establishing a facility to measure packed column hydrodynamics, MSc thesis,
Department of Process Engineering, Stellenbosch University.
Laresgoiti, M.F., Caballero, B.M., de Marco, I., Torres, A., Cabrero, M.A. and Chomón, M.J. 2004.
Characterization of the liquid products obtained in tyre pyrolysis. Journal of Analytical and Applied
Pyrolysis, 71(2), pp.917-934.
Lebreton, B. and Tuma, A. 2006. A quantitative approach to assessing the profitability of car and truck
tire remanufacturing. International Journal of Production Economics, 104(2), pp.639–652.
Lee, J.M., Lee, J.S., Kim, J.R. and Kim, S.D. 1995. Pyrolysis of waste tires with partial oxidation in a
fluidized-bed reactor. Energy, 20(10), pp.969-976.
Leung, D.Y. and Wang, C. 1998. Kinetic study of scrap tyre pyrolysis and combustion. Journal of
Analytical and Applied Pyrolysis, 45(2), pp.153–169.
Stellenbosch University https://scholar.sun.ac.za

157
Leung, D.Y.C. and Wang, C.L. 1999. Kinetic modeling of scrap tire pyrolysis. Energy and Fuels, 13(2),
pp.421–427.
Leung, D.Y.C. and Wang, C.L. 2003. Fluidized-bed gasification of waste tire powders. Fuel Processing
Technology, 84(1–3), pp.175–196.
Li, Q., Zhang, Y. and Hu, G. 2015. Techno-economic analysis of advanced biofuel production based on
bio-oil gasification. Bioresource Technology, 191, pp.88–96.
Li, S., Jin, H. and Gao, L. 2014. Coal Based Cogeneration System for Synthetic/Substitute Natural Gas
and Power With CO 2 Capture After Methanation: Coupling Between Chemical and Power Production.
Journal of Engineering for Gas Turbines and Power, 136(9), p.91501.
Li, S.Q., Yao, Q., Chi, Y., Yan, J.H. and Cen, K.F. 2004. Pilot-scale pyrolysis of scrap tires in a continuous
rotary kiln reactor. Industrial & engineering chemistry research, 43(17), pp.5133-5145.
Li, X. and Kraslawski, A. 2004. Conceptual process synthesis: past and current trends. Chemical
Engineering and Processing: Process Intensification, 43(5), pp.583-594
Linninger, A.A. 2002. Metallurgical Process Design A Tribute to Douglas' Conceptual Design
Approach. Industrial & engineering chemistry research, 41(16), pp.3797-3805.
Liu, B., Yang, X., Song, W. and Lin, W. 2011. Process simulation development of coal combustion in a
circulating fluidized bed combustor based on Aspen Plus. Energy & Fuels, 25(4), pp.1721-1730.
Lopez, G., Olazar, M., Aguado, R., Elordi, G., Amutio, M., Artetxe, M. and Bilbao, J. 2010. Vacuum
pyrolysis of waste tires by continuously feeding into a conical spouted bed reactor. Industrial &
Engineering Chemistry Research, 49(19), pp.8990-8997.
López, G., Olazar, M., Aguado, R. and Bilbao, J. 2010. Continuous pyrolysis of waste tyres in a conical
spouted bed reactor. Fuel, 89(8), pp.1946-1952.
de Marco Rodriguez, I., Laresgoiti, M.F., Cabrero, M.A., Torres, A., Chomon, M.J. and Caballero, B.
2001. Pyrolysis of scrap tyres. Fuel processing technology, 72(1), pp.9-22.
Mahlangu, M.L. 2009. Waste tyre management problems in South Africa and the possible
opportunities that can be created through the recycling thereof, MA thesis, Department of
Environmental Sciences, University of South Africa
Stellenbosch University https://scholar.sun.ac.za

158
Mandegari, M.A., Farzad, S. and Görgens, J.F. 2016. Process Design, Flowsheeting, and Simulation of
Bioethanol Production from Lignocelluloses. Biofuels: Production and Future Perspectives, p.255.
Mapamba, L.S., 2012. Simulation of the Copper-chlorine Thermochemical Cycle, MEng thesis, School
of Chemical and Minerals Engineering, North-West University.
Marsh, P. 1982. The choice between equity and debt: An empirical study. The Journal of finance, 37(1),
pp.121-144.
Martínez, J.D., Murillo, R., García, T. and Veses, A. 2013. Demonstration of the waste tire pyrolysis
process on pilot scale in a continuous auger reactor. Journal of hazardous materials, 261, pp.637-645.
Martínez, J.D., Puy, N., Murillo, R., García, T., Navarro, M.V. and Mastral, A.M. 2013. Waste tyre
pyrolysis–a review. Renewable and Sustainable Energy Reviews, 23, pp.179-213
Mastral, A.M., Murillo, R., Callén, M.S. and Garcıa, T. 1999. Application of coal conversion technology
to tire processing. Fuel processing technology, 60(3), pp.231-242.
Mastral, A.M., Murillo, R., Callen, M.S., Garcia, T. and Snape, C.E. 2000. Influence of process variables
on oils from tire pyrolysis and hydropyrolysis in a swept fixed bed reactor. Energy & Fuels, 14(4),
pp.739-744.
Mastral, A.M., Murillo, R., Callen, M.S. and Garcia, T. 2000. Optimisation of scrap automotive tyres
recycling into valuable liquid fuels. Resources, Conservation and Recycling, 29(4), pp.263-272.
Mazloom, G., Farhadi, F. and Khorasheh, F. 2009. Kinetic modeling of pyrolysis of scrap tires. Journal
of Analytical and Applied Pyrolysis, 84(2), pp.157–164.
McDonald, R.A., Shrader, S.A. and Stull, D.R. 1959. Vapor Pressures and Freezing Points of Thirty Pure
Organic Compounds. Journal of Chemical and Engineering Data, 4(4), pp.311-313.
Messerly, J.F., Guthrie Jr, G.B., Todd, S.S. and Finke, H.L. 1967. Low-temperature thermal data for
pentane, n-heptadecane, and n-octadecane. Revised thermodynamic functions for the n-alkanes, C5-
C18. Journal of Chemical and Engineering Data, 12(3), pp.338-346.
Mirmiran, S., Pakdel, H. and Roy, C. 1992. Characterization of used tire vacuum pyrolysis oil:
Nitrogenous compounds from the naphtha fraction. Journal of Analytical and Applied Pyrolysis, 22(3),
pp.205–215.
Stellenbosch University https://scholar.sun.ac.za

159
Mitta, N.R., Ferrer-Nadal, S., Lazovic, A.M., Perales, J.F., Velo, E. and Puigjaner, L. 2006. Modelling and
simulation of a tyre gasification plant for synthesis gas production. Computer Aided Chemical
Engineering, 21(B), p.1771.
Mix, T.J., Dweck, J.S., Weinberg, M. and Armstrong, R.C., 1978. Energy conservation in distillation.
Chemical Engineering Progress, 74(4), pp.49-55.
Mocke, F.J., 2013. Implementation of membrane technology in a base metal refinery, MEng thesis,
Faculty of Chemical and Minerals Engineering, North-West University.
Mtui, P. 2013. Gasification And Combustion Of Waste Tires For Process Heat And Power Generation. ,
2(12), pp.38–46.
Murugan, S., Ramaswamy, M.C. and Nagarajan, G. 2008. The use of tyre pyrolysis oil in diesel engines.
Waste Management, 28(12), pp.2743–2749.
Muzenda, E. and Popa, C. 2015. Waste Tyre Management in Gauteng , South Africa : Government ,
Industry and Community Perceptions. , 6(4).
Naeem, M., Al-Arabia, A.A. and Mughees, W. 2014. Process Simulation of 1-Butene and N- Butane
Separation By Extractive Distillation. , 3(6), pp.747–750.
Naim, A., Mourad, B., Khaled, L., Sary, A. and Mohand, T. 2017. Heating rate effects on pyrolytic vapors
from scrap truck tires. Journal of Analytical and Applied Pyrolysis, 123 (2017), pp. 419–429
Naleli, K. 2016. Process Modelling In Production of Biobutanol from Lignocellulosic Biomass via ABE
Fermentation, MEng thesis, Department of Process Engineering, Stellenbosch University.
Narayanasamy, L. and Murugesan, T. 2014. Degradation of Alizarin Yellow R using UV/H2O2 advanced
oxidation process. Environmental Progress & Sustainable Energy, 33(2), pp.482-489.
Nayak, R. and Mewada, R. 2011. Simulation of Coal Gasification Process using ASPEN PLUS.
International conference of current trends in technology, pp.8–10.
Ngwetjana, M.M., 2017. Fractionation of tyre derived oil (TDO), MEng thesis, Department of Process
Engineering, Stellenbosch University.
Nikoo, M.B. and Mahinpey, N. 2008. Simulation of biomass gasification in fluidized bed reactor using
ASPEN PLUS. Biomass and Bioenergy, 32(12), pp.1245–1254.
Stellenbosch University https://scholar.sun.ac.za

160
Nkosi, N. and Muzenda, E. 2014. A review and discussion of waste tyre pyrolysis and derived products.
Nkosi, N., Muzenda, E., Zvimba, J. and Pilusa, J. 2013. The current waste generation and management
trends in South Africa: a review.
Nsaful, F., 2012. Process modelling of sugar mill biomass to energy conversion processes and energy
integration of pyrolysis, MEng thesis, Department of Process Engineering, Stellenbosch University.
Nsaful, F., Görgens, J.F. and Knoetze, J.H. 2013. Comparison of combustion and pyrolysis for energy
generation in a sugarcane mill. Energy Conversion and Management, 74, pp.524–534.
Oden, J., Belytschko, T., Fish, J., Hughes, T., Johnson, C., Keyes, D., Laub, A., Petzold, L., Srolovitz, D.
and Yip, S. 2006. Revolutionizing Engineering Science through Simulation. Simulation-based
engineering science. National Science Foundation.
Olazar, M., Aguado, R., Arabiourrutia, M., Lopez, G., Barona, A. and Bilbao, J. 2008. Catalyst effect on
the composition of tire pyrolysis products. Energy & Fuels, 22(5), pp.2909-2916.
Oliver, G.D., Eaton, M. and Huffman, H.M. 1948. The Heat Capacity, Heat of Fusion and Entropy of
Benzene1. Journal of the American chemical society, 70(4), pp.1502-1505.
Pakdel, H., Magdalena, D.and Roy, C. 2001. Production of dl -limonene by vacuum pyrolysis of used
tires. , 57, pp.91–107.
Pakdel, H. and Roy, C. 1994. Simultaneous gas chromatographic-Fourier transform infrared
spectroscopic-mass spectrometric analysis of synthetic fuel derived from used tire vacuum pyrolysis
oil, naphtha fraction. Journal of Chromatography A, 683(1), pp.203–214.
Pattabhi Raman, K., Walawender, W.P. and Fan, L.T., 1981. Gasification of waste tires in a fluid bed
reactor. Conservation and Recycling, 4(2), pp.79–88.
Payscale Human Capital. 2016. [Online] Available from:http://www.payscale.com/. [Accessed on 18
August 2016].
Pehlken, A. and Müller, D.H., 2009. Using information of the separation process of recycling scrap tires
for process modelling. Resources, Conservation and Recycling, 54(2), pp.140–148.
Perales, A.V., Valle, C.R., Ollero, P. and Gómez-Barea, A. 2011. Technoeconomic assessment of ethanol
production via thermochemical conversion of biomass by entrained flow gasification. Energy, 36(7),
Stellenbosch University https://scholar.sun.ac.za

161
pp.4097-4108.Peters, J.F., Iribarren, D. and Dufour, J., 2014. Predictive pyrolysis process modelling in
Aspen Plus. In pp. 352–368.
Perry, R.H. and Green, D.W. 1997. Perry’s chemical engineers’ handbook. New York: McGraw-Hill.
Peters, M.S. and Timmerhaus, K .D. 1991. Plant Design and Economics for Chemical Engineers. New
York: McGraw-Hill.
Pilusa, J. and Muzenda, E. 2013. Qualitative analysis of waste rubber-derived oil as an alternative diesel
additive. International Conference on Chemical and Environmental Engineering (ICCEE'2013).
Pilusa, J., Shukla, M. & Muzenda, E., 2014. Economic Assessment of Waste Tyres Pyrolysis Technology :
A Case study for Gauteng Province, South Africa. International Journal of Research in Chemical,
Metallurgical and Civil Engineering, 1(1), pp.41–49.
Pipilikaki, P., Katsioti, M., Papageorgiou, D., Fragoulis, D. and Chaniotakis, E. 2005. Use of tire derived
fuel in clinker burning. Cement and Concrete Composites, 27(7), pp.843-847.
PPC Ltd. 2014. [Online] Available from: http://www.ppc.co.za/media/101384/Environmental-
Review.pdf. [Accessed on: 16 October 2016].
Puig-Arnavat, M., Bruno, J.C. and Coronas, A., 2010. Review and analysis of biomass gasification
models. Renewable and Sustainable Energy Reviews, 14(9), pp.2841–2851.
Qu, W., Zhou, Q., Wang, Y.Z., Zhang, J., Lan, W.W., Wu, Y.H., Yang, J.W. and Wang, D.Z. 2006. Pyrolysis
of waste tire on ZSM-5 zeolite with enhanced catalytic activities. Polymer Degradation and
Stability, 91(10), pp.2389-2395.
Quek, A. and Balasubramanian, R. 2013. Liquefaction of waste tires by pyrolysis for oil and chemicals
- A review. Journal of Analytical and Applied Pyrolysis, 101, pp.1–16.
Rahman, A., Rasul, M.G., Khan, M.M.K. and Sharma, S. 2015. Recent development on the uses of
alternative fuels in cement manufacturing process. Fuel, 145, pp.84-99.
Raj, R.E., Kennedy, Z.R. and Pillai, B.C. 2013. Optimization of process parameters in flash pyrolysis of
waste tyres to liquid and gaseous fuel in a fluidized bed reactor. Energy Conversion and
Management, 67, pp.145-151.
Stellenbosch University https://scholar.sun.ac.za

162
Ramanathan, S.P., Mukherjee, S., Dahule, R.K., Ghosh, S., Rahman, I., Tambe, S.S., Ravetkar, D.D. and
Kulkarni, B.D. 2001. Optimization of continuous distillation columns using stochastic optimization
approaches. Chemical Engineering Research and Design, 79(3), pp.310-322
Ramzan, N., Ashraf, A., Naveed, S. and Malik, A. 2011. Simulation of hybrid biomass gasification using
Aspen plus: A comparative performance analysis for food, municipal solid and poultry waste. Biomass
and Bioenergy, 35(9), pp.3962-3969.
REDISA . 2012. Integrated Industry Waste Tyre Management Plan. Government Gazette Staatskoerant.
Government Gazette, 583(37230), pp.1–4.
REDISA NPC. 2016. [Online]. Available from:
http://www.redisa.org.za/Satellite/Redisa%20Home%20Page.html. [Accessed on 02 January 2017].
Richardson, J.W., Lemmer, W.J. and Outlaw, J.L. 2007. Bio-ethanol production from wheat in the
winter rainfall region of South Africa: a quantitative risk analysis. International Food and Agribusiness
Management Review, 10(2), pp.181-204.
Ringer, M., Putsche, V. and Scahil, J. 2006. Large-Scale Pyrolysis Oil Production: A Technology
Assessment and Economic Analysis. Golden (CO): National Renewable Energy Laboratory; 2006 Nov.
Report No. NREL/TP-510-37779. Contract No.: DE-AC36-99-GO10337.
Robus, C.L.L. 2013. Production of Bioethanol from Paper Sludge using Simultaneous Saccharification
and Fermentation, MSc thesis, Department of Process Engineering, Stellenbosch University.
Rofiqul Islam, M., Haniu, H. and Rafiqul Alam Beg, M. 2008. Liquid fuels and chemicals from pyrolysis
of motorcycle tire waste: Product yields, compositions and related properties. Fuel, 87(13–14),
pp.3112–3122.
Roy, C., Darmstadt, H., Benallal, B. and Amen-Chen, C. 1997. Characterization of naphtha and carbon
black obtained by vacuum pyrolysis of polyisoprene rubber. Fuel processing technology, 50(1),
pp.87 - 103.
SA Tyre Recyclers. 2017. [Online]. Available from: http://satyrerecyclers.co.za/satyre/. [Accessed on
02 January 2017].
Sampaio, M.O. and de Castro, C.N. 1998. Heat capacitiy of liquid terpenes. Fluid phase equilibria, 150,
pp.789-796.
Stellenbosch University https://scholar.sun.ac.za

163
Sánchez, Ó.J. and Cardona, C.A. 2012. Conceptual design of cost-effective and environmentally-
friendly configurations for fuel ethanol production from sugarcane by knowledge-based process
synthesis. Bioresource technology, 104, pp.305-314.
Seader, J.D., Seider, W.D. and Lewin, D.R. 2006. Using process simulators in Chemical Engineering.
New York: Wiley
Seebran, N. 2016, Personal interview. 2 August, Stellenbosch.
Seghar, S., Ait Hocine, N., Mittal, V., Azem, S., Al-Zohbi, F., Schmaltz, B. and Poirot, N. 2015.
Devulcanization of styrene butadiene rubber by microwave energy: Effect of the presence of ionic
liquid. Express Polym. Lett, 9, pp.1076-1086.
Seidelt, S., Müller-Hagedorn, M. and Bockhorn, H. 2006. Description of tire pyrolysis by thermal
degradation behaviour of main components. Journal of Analytical and Applied Pyrolysis, 75(1),
pp.11- 18.
Seider, W.D., Seader, J.D. and Lewin, D.R. 2004. Product and process design principles: synthesis,
analysis and evaluation. New York: Wiley and Sons.
Senneca, O., Salatino, P. and Chirone, R., 1999. Fast heating-rate thermogravimetric study of the
pyrolysis of scrap tyres. Fuel, 78(13), pp.1575–1581.
Shah, J., Jan, M.R. and Mabood, F., 2009. Recovery of value-added products from the catalytic pyrolysis
of waste tyre. Energy Conversion and Management, 50(4), pp.991–994.
Sharma, V.K., Fortuna, F., Mincarini, M., Berillo, M. and Cornacchia, G. 2000. Disposal of waste tyres
for energy recovery and safe environment. Applied Energy, 65(1), pp.381-394.
Shelley, M.D. and El-Halwagi, M.M., 1999. Journal of Elastomers and Plastics. Journal of Elastomers
and Plastics, 31, pp.232–254.
Shemfe, M.B., Gu, S. and Ranganathan, P. 2015. Techno-economic performance analysis of biofuel
production and miniature electric power generation from biomass fast pyrolysis and bio-oil upgrading.
Fuel, 143, pp.361–372.
Shoaib, M.W., Wukovits, W. and Gul, S. 2014. Review of process simulation and simulation software-
open source software development. In 2nd Conference on Sustainability in Process Industry
(SPI) (pp. 45-49).
Stellenbosch University https://scholar.sun.ac.za

164
Shu, X. and Huang, B. 2013. Recycling of waste tire rubber in asphalt and portland cement concrete:
An overview. Construction and Building Materials, 67, pp.217–224.
Sienkiewicz, M., Kucinska-Lipka, J., Janik, H. and Balas, A. 2012. Progress in used tyres management in
the European Union: a review. Waste Management, 32(10), pp.1742-1751.
Siirola, J.J. and Rudd, D.F. 1971. Computer-aided synthesis of chemical process designs. From reaction
path data to the process task network. Industrial & Engineering Chemistry Fundamentals, 10(3),
pp.353-362.
Singh, S., Nimmo, W., Gibbs, B.M. and Williams, P.T. 2009. Waste tyre rubber as a secondary fuel for
power plants. Fuel, 88(12), pp.2473-2480.
Sinnott, R.K. and Towler, G. 2009. Chemical engineering design. Amsterdam. Elsevier, Butterworth-
Heinemann.
Smith, R., 1995. Chemical process design. McGraw- Hill, New York.
South African Reserve Bank. 2016. Exchange rates. [Online] Available from:
http://www.resbank.co.za/Research/Rates/Pages/SelectedHistoricalExchangeAndInterestRates.aspx
. [Accessed on 09 August 2016].
South African Reserve Bank. 2016. Prime lending rates. [Online] Available from:
https://www.resbank.co.za/Research/Rates/Pages/SelectedHistoricalExchangeAndInterestRates.asp
x. [Accessed on: 09 August 2016].
South African Revenue Services. 2016. Corporate Income Tax. [Online] Available from:
http://www.sars.gov.za/TaxTypes/CIT/Pages/default.aspx. [Accessed on: 09 August 2016].
Sreejith, C.C., Muraleedharan, C. and Arun, P. 2013. Performance prediction of steam gasification of
wood using an ASPEN PLUS thermodynamic equilibrium model. International Journal of Sustainable
Energy, 33(2), pp.416–434.
Stanciulescu, M. and Ikura, M. 2007. Limonene ethers from tire pyrolysis oil. Part 2: Continuous flow
experiments. Journal of Analytical and Applied Pyrolysis, 78(1), pp.76–84.
Stanciulescu, M. and Ikura, M. 2006. Limonene ethers from tire pyrolysis oil: Part 1: Batch
experiments. Journal of Analytical and Applied Pyrolysis, 75(2), pp.217–225.
Stellenbosch University https://scholar.sun.ac.za

165
Steele, W.V., Chirico, R.D., Cowell, A.B., Knipmeyer, S.E. and Nguyen, A. 2002. Thermodynamic
properties and ideal-gas enthalpies of formation for methyl benzoate, ethyl benzoate,(R)-(+)-
limonene, tert-amyl methyl ether, trans-crotonaldehyde, and diethylene glycol. Journal of Chemical &
Engineering Data, 47(4), pp.667-688.
Taylor, R., Ray, R. and Chapman, C. 2013. Advanced thermal treatment of auto shredder residue and
refuse derived fuel. Fuel, 106, pp.401–409.
Tong, Z. F., Yang, Z. Y., Liao, D. K., Wei, T. Y. and Chen, X. P. 2009. Measurement and correlation of VLE
data for α-pinene+ limonene and p-cymene+ limonene systems under atmospheric pressure. J Chem
Ind and Eng (China), 60(8), pp.1877-1882.
Turton, R., Baile, R.C., Whiting, W.B. and Shaeiwitz, J.A. 2009. Analysis, synthesis, and design of
chemical processes. Prentice Hall international series in the physical and chemical engineering
sciences. Upper Saddle River, NJ: Prentice Hall.
Ucar, S., Karagoz, S., Ozkan, A.R. and Yanik, J. 2005. Evaluation of two different scrap tires as
hydrocarbon source by pyrolysis. Fuel, 84(14), pp.1884-1892.
United States Department of Agriculture. 2016. Citrus: World Markets and Trade. [Online] Available
from: http://apps.fas.usda.gov/psdonline/circulars/citrus.pdf. [Accessed on: 26 October 2016].
Van der Merwe, A.B. 2010. Evaluation of Different Process Designs for Biobutanol Production from
Sugarcane Molasses, MSc thesis, Department of Process Engineering, Stellenbosch University.
VENKATARAMAN, S. 1996. Process enhancement by process simulation and multiobjective
optimization, MSc thesis, Faculty of the Graduate College, Oklahoma State University.
Visconti, A., Miccio, M. and Juchelková, D. 2015. An aspen plus tool for simulation of lignocellulosic
biomass pyrolysis via equilibrium and ranking of the main process variables. International Journal of
Mathematical Models and Methods in Applied Sciences, 9, pp.71–86.
Wang, S.F., Zhao, Y.H., Wen, H. and Xu, Z.H. 2008. Simulation study of a novel process co-producing
synthesis gas and light olefins. Chemical engineering & technology, 31(10), p.1424.
Wang, W.C., Bai, C.J., Lin, C.T. and Prakash, S. 2016. Alternative fuel produced from thermal pyrolysis
of waste tires and its use in a DI diesel engine. Applied Thermal Engineering, 93, pp.330-338.
Stellenbosch University https://scholar.sun.ac.za

166
Ward, J., Rasul, M.G. and Bhuiya, M.M.K. 2014. Energy recovery from biomass by fast
pyrolysis. Procedia Engineering, 90, pp.669-674.
WebFinance Inc. 2015. Conceptual framework. [Online] Available from:
http://www.businessdictionary.com/definition/conceptual-framework.html. [Accessed: 18 April
2015].
WebFinance Inc. 2015. Framework. [Online] Available from:
http://www.businessdictionary.com/definition/framework.html. [Accessed: 18 April 2015].
Wei, Y., Lei, H., Wang, L., Zhu, L., Zhang, X., Liu, Y., Chen, S. and Ahring, B. 2014. Liquid–liquid extraction
of biomass pyrolysis bio-oil. Energy & Fuels, 28(2), pp.1207-1212.
Weitkamp, J., Raichle, A. and Traa, Y. 2001. Novel zeolite catalysis to create value from surplus
aromatics: Preparation of C2+-n-alkanes, a high-quality synthetic steamcracker feedstock. Applied
Catalysis A: General, 222(1–2), pp.277–297.
Wiese, J. 2017, Personal interview. 6 January, Stellenbosch.
Wilkins Jr, J.S. 1999. Limonene pesticides. U.S. Patent 5,951,992.
Williams, P.T. 2013. Pyrolysis of waste tyres: A review. Waste Management, 33(8), pp.1714–1728.
Williams, P.T. and Besler, S. 1995. Pyrolysis-thermogravimetric analysis of tyres and tyre components.
Fuel, 74(9), pp.1277–1283.
Williams, P.T., Besler, S. and Taylor, D.T. 1990. The pyrolysis of scrap automotive tyres. The influence
of temperature and heating rate on product composition. Fuel, 69(12), pp.1474–1482.
Williams, P.T., Besler, S. and Taylor, D.T. 1993. The batch pyrolysis of tyre waste—fuel properties of
the derived pyrolytic oil and overall plant economics. Proceedings of the Institution of Mechanical
Engineers, Part A: Journal of Power and Energy, 207(1), pp.55-63.
Williams, P.T. and Brindle, A.J. 2002. Catalytic pyrolysis of tyres: Influence of catalyst temperature.
Fuel, 81(18), pp.2425–2434.
Williams, P.T. and Brindle, A.J., 2003a. Aromatic chemicals from the catalytic pyrolysis of scrap tyres.
Journal of Analytical and Applied Pyrolysis, 67(1), pp.143–164.
Stellenbosch University https://scholar.sun.ac.za

167
Williams, P.T. and Brindle, A.J. 2003b. Temperature selective condensation of tyre pyrolysis oils to
maximise the recovery of single ring aromatic compounds. Fuel, 82(9), pp.1023–1031.
Williams, P.T. and Brindle, A.J. 2003c. Fluidised bed pyrolysis and catalytic pyrolysis of scrap tyres.
Environmental technology, 24(7), pp.921-929.
WinSim Inc. 2012. Advanced Process Simulation Solutions.
Wojtowicz, M.A. and Serio, M.A. 1996. Pyrolysis of scrap tires: Can it be profitable?. Chemtech-
Washington DC-, 26, pp.48-53.
Wright, M.M., Satrio, J .A., Brown, R. C., Daugaard, D.E., Hsu, D.D. 2010. Techno-economic analysis of
biomass fast pyrolysis to transportation fuels, NREL report.
Wright, M.M., Daugaard, D.E., Satrio, J.A. and Brown, R.C. 2010. Techno-economic analysis of biomass
fast pyrolysis to transportation fuels. Fuel, 89, pp.S2-S10.
Xiangdong, K., Zhong, W., Wenli, D.U. and Feng, Q.I.A.N. 2013. Three stage equilibrium model for coal
gasification in entrained flow gasifiers based on Aspen Plus. Chinese Journal of Chemical
Engineering, 21(1), pp.79-84.
Xiao, G., Ni, M.J., Chi, Y. and Cen, K.F. 2008. Low-temperature gasification of waste tire in a fluidized
bed. Energy Conversion and Management, 49(8), pp.2078-2082.
Yan, H.M. and Zhang, D.K. 1999. Modeling of a Low Temperature Pyrolysis Process Using Aspen Plus.
Developments in Chemical Engineering and Mineral Processing, 7(5–6), pp.577–591.
Yang, X., Liu, B. and Lin, W., 2012. Process Simulation of Using Coal Pyrolysis Gas to Control NO and
N2O Emissions during Coal Decoupling Combustion in a Circulating Fluidized Bed Combustor Based on
Aspen Plus. Energy & Fuels, 26(8), pp.5210-5225.
Zabaniotou, A.A. and Stavropoulos, G. 2003. Pyrolysis of used automobile tires and residual char
utilization. Journal of Analytical and Applied Pyrolysis, 70(2), pp.711–722.
Zebala, J., Ciepka, P., Reza, A. and Janczur, R. 2007. Influence of rubber compound and tread pattern
of retreaded tyres on vehicle active safety. Forensic science international, 167(2), pp.173-180.
Zhang, J., Toghiani, H., Mohan, D., Pittman, C.U. and Toghiani, R.K. 2007. Product analysis and
thermodynamic simulations from the pyrolysis of several biomass feedstocks. Energy & fuels, 21(4),
pp.2373-2385.
Stellenbosch University https://scholar.sun.ac.za

168
Zhang, X., Wang, T., Ma, L. and Chang, J. 2008. Vacuum pyrolysis of waste tires with basic
additives. Waste Management, 28(11), pp.2301-2310.
Zhang, Y., Brown, T.R., Hu, G. and Brown, R.C. 2013. Techno-economic analysis of monosaccharide
production via fast pyrolysis of lignocellulose. Bioresource technology, 127, pp.358-365.
Stellenbosch University https://scholar.sun.ac.za

169
APPENDIX A: LIST OF COMPONENTS IN CURRENT SIMULATIONS
Table A1: Compounds in oil fraction used for current study from Choi et al. (2014) and Aspen reactor yields
Compound name in Choi et al. (2014) Compound name Aspen used for
simulation
Aspen Plus® yield
(wt.%)
2-Methyl-2-aminopropane Tert-butalymine 0.04
p-Phenylenediamine p-Phenylenediamine 0.04
Benzothiazole Benzothiazole 2.57
Styrene Styrene 0.00
Xylenes m-Xylene 1.21
Indene Indene 0.35
Methylstyrenes o-Methylstyrene 1.76
Trimethylbenzenes 1,2,4-Trimethylbenzene 2.62
1,2-Methylethylbenzene 2-Ethylytoluene 1.43
1,2,4-Tris(methylene)cyclohexane 3-Ethylytoluene 0.26
1,2,5,5-Tetramethyl-1,3-
cyclopentadiene
1-Ethyl-4-methyl-1,3-
cyclohexadiene
0.38
Limonenes d-Limonene 2.52
Naphthalene Naphthalene 0.00
Methylindenes 1-Methylindene 0.78
Dimethylstyrenes 2,5-Dimethylstyrene 2.13
Cymenes p-Cymeme 1.38
Propyltoluenes o-Propyltoluene 0.19
Tetramethylbenzenes 1,2,3,4-Tetramethylbenzene 0.40
Ethylxylenes 5-Ethyl-m-xylene 0.99
2,7-Dimethylbenzothiophene 2,7-Dimethylbenzothiophene 0.00
Methylnaphthalenes 1-Methylnaphthalene 0.84
Dimethylindenes 1,3-Dimethylindene 2.11
Dimethylindanes 1,1-Dimethylindane 0.08
2,4-Dimethylquinoline 2,5-Dimethylquinoline 1.77
1-Dodecene 1-Dodecene 0.25
Dimethylnaphthalenes 2,6-Dimethylnaphthalene 1.43
1,2,3-Trimethylindene 1,2,3-Trimethylindene 1.22
Stellenbosch University https://scholar.sun.ac.za

170
Table A1 continued: Compounds in oil fraction used for current study from Choi et al. (2014) and Aspen yields
Compound name in Choi et al. (2014) Compound name Aspen used for
simulation
Aspen Plus® yield
(wt.%)
Methylbiphenyls 3-Methlybiphenyl 0.00
Trimethylnaphthalenes 1,2,3-Trimethylnaphthalene 1.23
Dihydrotrimethylnaphthalenes 1,1,6-Dihydro-1,2-
trimethylnaphthalene
0.39
Tetramethylnaphthalenes 1,2,6,8-Tetramethylnaphthalene 0.28
Pentadecane Pentadecane 0.21
Heptadecane Heptadecane 0.18
n-Eicosane n-Eicosane 2.42
Benzene Benzene 9.67
Phenanthrene Phenanthrene 0.97
Table A2: Original and normalised gas composition from Rodriguez et al. (2001) and Aspen reactor yields
Compound Compound name
used in Aspen
Simulation
Composition
(wt.%)
Normalised
composition
(wt.%)
Aspen Plus®
yield (wt.%)
Hydrogen sulphide Hydrogen sulphide 4.3 5 0.36
Carbon monoxide Carbon monoxide 3.3 0 0.00
Carbon dioxide Carbon dioxide 10.3 0 0.00
Methane Methane 7.9 9.1 2.06
Ethene Ethylene 6.6 7.6 1.72
Ethane Ethane 6.8 7.9 1.78
Propene Propylene 6.7 7.7 1.74
Propane Propane 4.8 5.6 1.27
Butenes 1-Butene 24.4 28.2 6.37
Butanes N-Butane 5.5 6.4 1.45
Pentene 1-Pentene 4.9 5.6 1.27
Pentane N-Pentane 8.6 10 2.26
Hexene 1-Hexene 2.3 2.7 0.61
Hexane N-Hexane 3.6 4.2 0.95
Stellenbosch University https://scholar.sun.ac.za

171
APPENDIX B: ADDITIONAL INFORMATION FOR PYROLYSIS SECTION
B.1. Mass balance equations
Y� = �X�G100� ∗ YG
Equation B1
Y� = �X�L100� ∗ YL
Equation B2
Y� is the yield of compound i from tyre (wt/wt), X�G and X�L are the respective compositions (wt.%)
of the gas and liquid product compounds in their respective fractions. YG and YL are the respective
adjusted yields of the gas and liquid fractions from tyre (wt/wt).
YBenzo =(Ntyre − Nvolatile − Nchar)
d ∗ Ftyre
Equation B3
Ntyre = � b100� ∗ Ftyre
Equation B4
Nvolatile =Ha� ∗ Y� ∗I
JKLFtyre
Equation B5
Nchar = M c100N ∗ YS ∗ Ftyre
Equation B6
YBenzo is the yield of benzothiazole from tyre (wt/wt). Ntyre, Nvolatile and Nchar represent the
nitrogen in the tyre feed, the volatiles (gas and liquid fractions) and the char fraction respectively. The
letters a, b, c and d represent the mass fraction of nitrogen in each of the volatiles compounds, tyre
feed, char and benzothiazole respectively. Ftyre is the flow rate of the tyre feed in kg/h.
Stellenbosch University https://scholar.sun.ac.za

172
YH2S =(Styre − Svolatile − Schar)
d ∗ Ftyre
Equation B7
Styre = � b100� ∗ Ftyre
Equation B8
Svolatile =Ha� ∗ Y� ∗ FtyreI
JKL
Equation B9
Schar = M c100N ∗ YS ∗ Ftyre
Equation B10
YH2S is the yield of hydrogen sulphide from tyre (wt/wt). Styre, Svolatile and Schar represent the
sulphur in the tyre feed, the volatiles (gas and liquid fractions) and the char fraction respectively. The
letters a, b, c and d represent the mass fraction of sulphur in each of the volatiles compounds, tyre
feed, char and hydrogen sulphide respectively.
Ashchar = �AshtyreYS � ∗ 100
Equation B11
Ashchar is the ash content of the char product (wt.%), Ashtyre is the mass fraction of ash in the tyre
feed and YS is the yield of char.
YBenzene = 1 − Ygastotal − Yoiltotal − YS
Equation B12
YBenzene is the yield of benzene from tyre (wt/wt), Ygastotal and Yoiltotal represent the total
reactor yield accounted for by the gas and oil components respectively. YS is the yield of the char
product fraction.
Stellenbosch University https://scholar.sun.ac.za
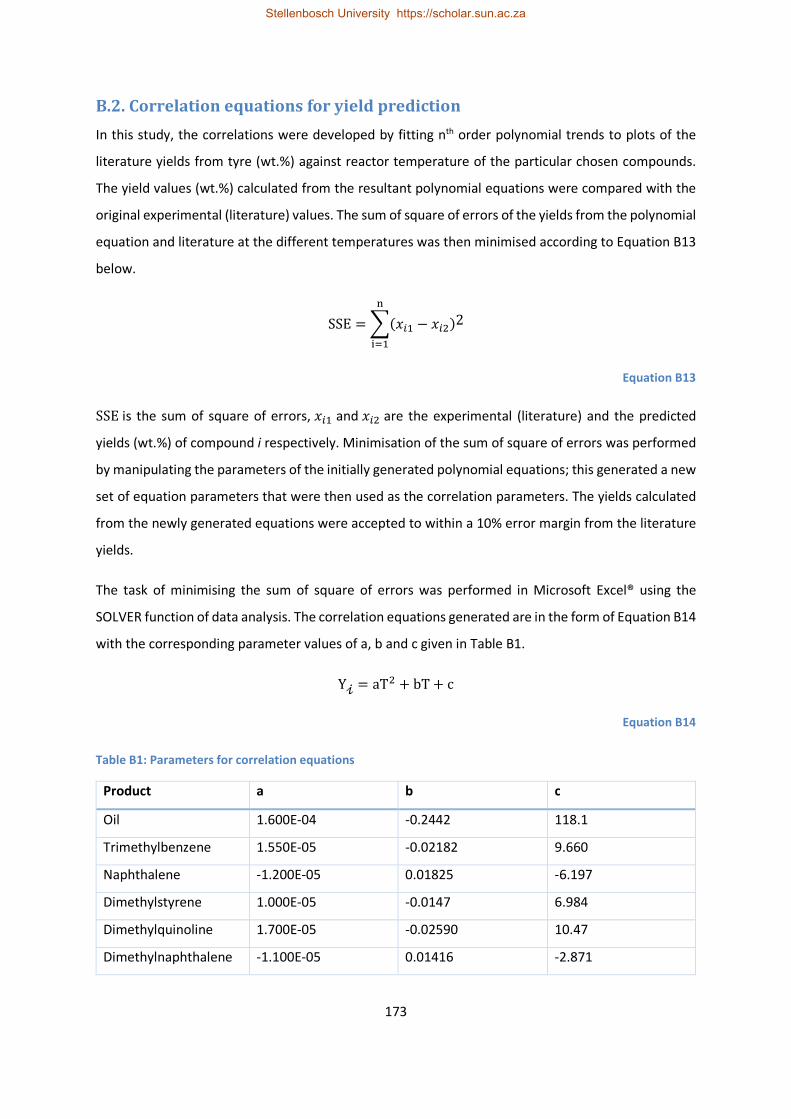
173
B.2. Correlation equations for yield prediction
In this study, the correlations were developed by fitting nth order polynomial trends to plots of the
literature yields from tyre (wt.%) against reactor temperature of the particular chosen compounds.
The yield values (wt.%) calculated from the resultant polynomial equations were compared with the
original experimental (literature) values. The sum of square of errors of the yields from the polynomial
equation and literature at the different temperatures was then minimised according to Equation B13
below.
SSE =H(��L − ��R)2I
JKL
Equation B13
SSE is the sum of square of errors, ��L and ��R are the experimental (literature) and the predicted
yields (wt.%) of compound i respectively. Minimisation of the sum of square of errors was performed
by manipulating the parameters of the initially generated polynomial equations; this generated a new
set of equation parameters that were then used as the correlation parameters. The yields calculated
from the newly generated equations were accepted to within a 10% error margin from the literature
yields.
The task of minimising the sum of square of errors was performed in Microsoft Excel® using the
SOLVER function of data analysis. The correlation equations generated are in the form of Equation B14
with the corresponding parameter values of a, b and c given in Table B1.
Y� = aTR + bT + c
Equation B14
Table B1: Parameters for correlation equations
Product a b c
Oil 1.600E-04 -0.2442 118.1
Trimethylbenzene 1.550E-05 -0.02182 9.660
Naphthalene -1.200E-05 0.01825 -6.197
Dimethylstyrene 1.000E-05 -0.0147 6.984
Dimethylquinoline 1.700E-05 -0.02590 10.47
Dimethylnaphthalene -1.100E-05 0.01416 -2.871
Stellenbosch University https://scholar.sun.ac.za

174
Table B1 continued: Parameters for correlation equations
Product a b c
Indene -5.410E-06 8.530E-03 -2.564
Methylindene -1.010E-05 0.01631 -4.854
Tetramethylbenzene 2.860E-06 -4.390E-03 1.880
Methylnaphthalene -2.317E-05 3.2200E-02 -9.466
Dimethylindane 3.484E-06 -3.800E-03 1.118
The expression of the yield of char is the only exception from Equation B.14, and the char yield is in
the form of Equation B15. The corresponding values of a, b, c and d are -2.000E-07, 4.000E-04, -0.2584
and 90.25 respectively.
Y� = aTT + bTR + cT + d
Equation B15
The generated correlation equations used to describe the yields of the selected compounds as
functions of the reactor temperature were used to give a certain degree of predictive ability to the
reactor model.
B.3. Selection of thermodynamic model
The choice of an appropriate property model is a vital decision in simulation which affects all
subsequent tasks in developing accurate physical properties for simulation and has implications on
the accuracy of the simulation results (Aspen Technology, 2009; Van der Merwe, 2010). Aspen Plus®
uses a collection of methods and models for property models in estimation of thermodynamic and
transport properties (Aspen Technology, 2009; Mapamba 2012). Aspen Plus® contains a large number
of built-in property methods that cover most engineering applications (Aspen Technology, 2009).
In Aspen Plus®, a choice of property models between ideal, equation of state (EOS) and activity
coefficient property models is afforded based on the type of simulation (Aspen Technology, 2009;
Mapamba 2012). The composition, temperature and pressure range and availability of parameters
will influence the choice of property model to be selected (Van der Merwe, 2010). An equation of
state is an analytical expression that relates the pressure to volume and temperature in describing the
volumetric behaviour, vapour-liquid equilibria and thermal properties for both pure components and
mixtures (Ashour et al., 2011; Mapamba, 2012).
Stellenbosch University https://scholar.sun.ac.za

175
The choice of thermodynamic model to be used depends on the compounds that are being handled
in the model. In the current study, the introduction of extractive distillation was found to require a
different thermodynamic model from the rest of the flowsheet. As such, the choice of thermodynamic
model will be highlighted for other sections and for the extractive distillation separately.
Thermodynamic model for pyrolysis section, normal distillation and heat recovery
Several methods have been used in literature for selection of property methods based on different
algorithms. The methods considered for evaluation in this study are the Eric Carlson method, Bob
Seader method and the Aspen Plus® guidelines for property method selection (Carlson, 1996; Seader
et al., 2006; Aspen Technology, 2009). Each of the methods considered is discussed below. The green
lines indicate the paths that were followed to get to the recommended property method(s) for each
method of evaluation.
Eric Carlson method
The Eric Carlson method for selection is shown in B.12 (Carlson, 1996). According to the Eric Carlson
method, the Peng-Robinson (PENG-ROB), Redlich-Kwong-Soave (RK-SOAVE), Lee-Kesler-Plocker (LK-
PLOCK), Peng-Robinson with Boston-Mathias alpha function (PR-BM) and the Redlich-Kwong-Soave
with Boston-Mathias alpha function (RKS-BM) are then recommended for non-polar real compounds.
Polarity?
Electrolyte?
Real or Pseudo?
Pressure
Polar
Non-Polar
Real
Electrolyte
Real and Pseudo
Vacuum
P≥ 1atm
Non-Electrolyte
Polar
ELECNRTL
Decision path not full shown
PENG-ROB, RK-SOAVE, LK-
PLOCK, PR-BM, RKS-BM,
BK10, IDEAL
CHAO-SEA, GRAYSON,
BK10
Figure B12: The Eric Carlson property method selection algorithm
Stellenbosch University https://scholar.sun.ac.za
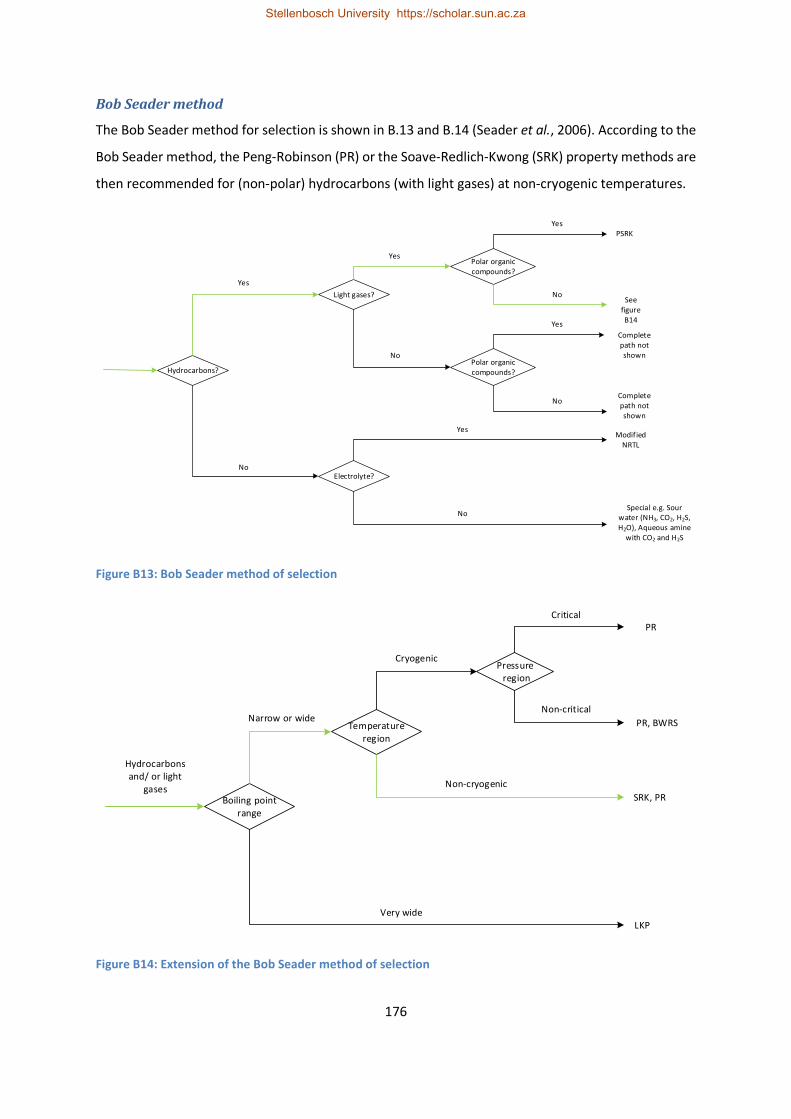
176
Bob Seader method
The Bob Seader method for selection is shown in B.13 and B.14 (Seader et al., 2006). According to the
Bob Seader method, the Peng-Robinson (PR) or the Soave-Redlich-Kwong (SRK) property methods are
then recommended for (non-polar) hydrocarbons (with light gases) at non-cryogenic temperatures.
Hydrocarbons?
Light gases?
Polar organic compounds?
Polar organic compounds?
Electrolyte?No
Yes
No
No
Yes
Yes
No
Yes
No
YesPSRK
See figure B14
Complete path not shown
Complete path not shown
Modified NRTL
Special e.g. Sour water (NH3, CO2, H2S, H2O), Aqueous amine
with CO2 and H2S
Figure B13: Bob Seader method of selection
Boiling point range
Temperature region
Pressure region
Narrow or wide
Non-cryogenic
Cryogenic
Non-critical
Critical
Very wide
Hydrocarbons and/ or light
gases
PR
PR, BWRS
SRK, PR
LKP
Figure B14: Extension of the Bob Seader method of selection
Stellenbosch University https://scholar.sun.ac.za

177
Aspen Plus® guideline
Polarity?
Real or Pseudo components?
Electrolyte?
Pressure?
Polar
Nonpolar
Pseudo & Real
Real
Electrolyte
Non-electrolyte
≥ 1 atm
Vacuum
Full path not shown
ELECNRTL
PENG-ROB, RK-SOAVE, LK-PLOCK,
PR-BM, RKS-BM
CHAO-SEA, GRAYSON,
BK10
BK10, IDEAL
Figure B15: Aspen Plus® property method selection algorithm
The Aspen Plus® guideline for choosing a property method is indicated in B.15 (Aspen Technology,
2009). According to this algorithm, equation of state methods should be used. The Peng-Robinson
(PENG-ROB), Redlich-Kwong-Soave (RK-SOAVE), Lee-Kesler-Plocker (LK-PLOCK), Peng-Robinson with
Boston-Mathias alpha function (PR-BM) and the Redlich-Kwong-Soave with Boston-Mathias alpha
function (RKS-BM) are then recommended for non-polar real compounds at pressures equals to or
above atmospheric.
Literature recommendations
Equations of state are well suited for vapour mixtures, non-polar mixtures and slightly polar
compounds (Aspen Technology, 2009; Mapamba 2012). The most commonly used equations of state
are the Redlich-Kwong-Soave (RKS) and the Peng-Robinson (PR) equations of state. Both these
equations of state give quite similar results for prediction of vapour-liquid equilibrium and vapour
pressure comparison of several substances with the difference being that the PR EOS gives superior
predictions for liquid densities (Aspen Technology, 2009; Ashour et al., 2011; Mapamba 2012).
The Boston-Mathias alpha function is an alternative function to the usual PR alpha function and it is
suitable for temperatures higher than critical. The PR alpha function can be used for subcritical
temperatures but gives unrealistic results for light gases at high reduced temperatures (Ashour et al.,
Stellenbosch University https://scholar.sun.ac.za

178
2011). The PR-BM property method can be used for non-polar or mildly polar mixtures, hydrocarbons
and light gases hence its relevance to the current model. It is recommended for applications of coal
gasification or liquefaction of which the process of tyre pyrolysis is similar to (Aspen Technology,
2009). The PR-BM property method has been used in literature for processes simulating pyrolysis and
gasification of carbonaceous material like tyres and coal (Kong et al., 2013; He et al., 2014; Altayeb,
2015).
Recommended property method
The Peng-Robinson with a Boston-Mathias alpha function (PR-BM) property method was chosen to
calculate the physical properties for all the conventional components in the current study. The
HCOALGEN and DCOALIGT property models were used to calculate the enthalpy and density of the
non-conventional components (tyre and char) respectively (based on the proximate and ultimate
analyses provided in Choi et al., 2014).
Thermodynamic model for extractive distillation
In this study, work regarding the recovery of limonene using extractive distillation was adapted from
a study by Ngwetjana (2017). As such, the thermodynamic model used in this study for the extractive
section was also adopted from Ngwetjana (2017). For the solvent recovery section, the non-random
two-liquid (NRTL) property model has been used for prediction of thermodynamic properties of
components in this study. The universal function activity coefficient (UNIFAC) property model was
used to estimate missing binary parameters for the NRTL property model in this study.
Activity coefficient property models (such as the NRTL model) are recommended for non-ideal liquid
mixtures and are preferred for solvent recovery systems in literature (Chen and Mathias, 2002; Aspen
Technology, 2009). When binary interaction parameters are available, activity coefficient models are
accurate for phase equilibrium calculations. The UNIFAC predictive model can however be used to
estimate the required parameters in the absence of vapour-liquid equilibrium (VLE) data to generate
the required binary parameters (Aspen Technology, 2009). The NRTL property model has been used
in literature for simulations including solvent recovery of hydrocarbons with the UNIFAC property
model used to estimate missing interaction parameters (Ko et al., 2002; Brondani et al., 2015).
Stellenbosch University https://scholar.sun.ac.za

179
APPENDIX C: SENSITIVITY ANALYSIS OF SEPARATION COLUMNS
C.1. Determination of initial parameters for T-101 using DSTWU column
model
The DSTWU column model generates the necessary parameters by performing a Winn-Underwood-
Gilliland shortcut design calculation for a single-feed, two-product distillation column for the specified
key components. The desired recovery of key components also has to be specified. The DSTWU model
then estimates reflux ratio or number of theoretical stages given that either of the parameters is
specified (Aspen Technology, 2009; Henley et al., 2011).
The key components were specified as 2-ethyltoluene (light key) and limonene (heavy key) based on
the desired limonene cut/fraction. The recovery of each key component was specified at 99%, as it is
usually desirable to have it specified at such for target compounds (Sinnott and Towler, 2009).
The number of theoretical stages was chosen (as input) such that the resulting ratio of actual:
minimum reflux ratios was around 1.15. According to literature, the ratio of actual: minimum reflux
ratios should typically be between 1.05 and 1.5 (with 1.15 being a good initial estimate) for optimum
column operation (Douglas, 1998; Sinnott and Towler; 2009; Henley et al., 2011). The number of
theoretical stages was manually changed until the ratio of 1.15 was obtained. A stage pressure drop
of 0.7 kPa was specified as it is recommended for atmospheric operation (Henley et al., 2011). The
resulting number of stages was compared with information of some representative commercial binary
distillation at atmospheric pressure (100 kPaa) of close boiling point compounds shown in Table C1.
Table C1: Representative commercial binary distillation operations (Henley et al., 2011)
Binary mixture Average relative
volatility
Number of trays Reflux: minimum
reflux ratio
Vinyl acetate/ethyl
acetate
1.16 90 1.15
o-Xylene/m-xylene 1.17 130 1.12
Methanol/ethanol 1.44 75 1.2
Water/acetic acid 1.83 40 1.35
Acetic acid/acetic
anhydride
2.02 50 1.13
Stellenbosch University https://scholar.sun.ac.za
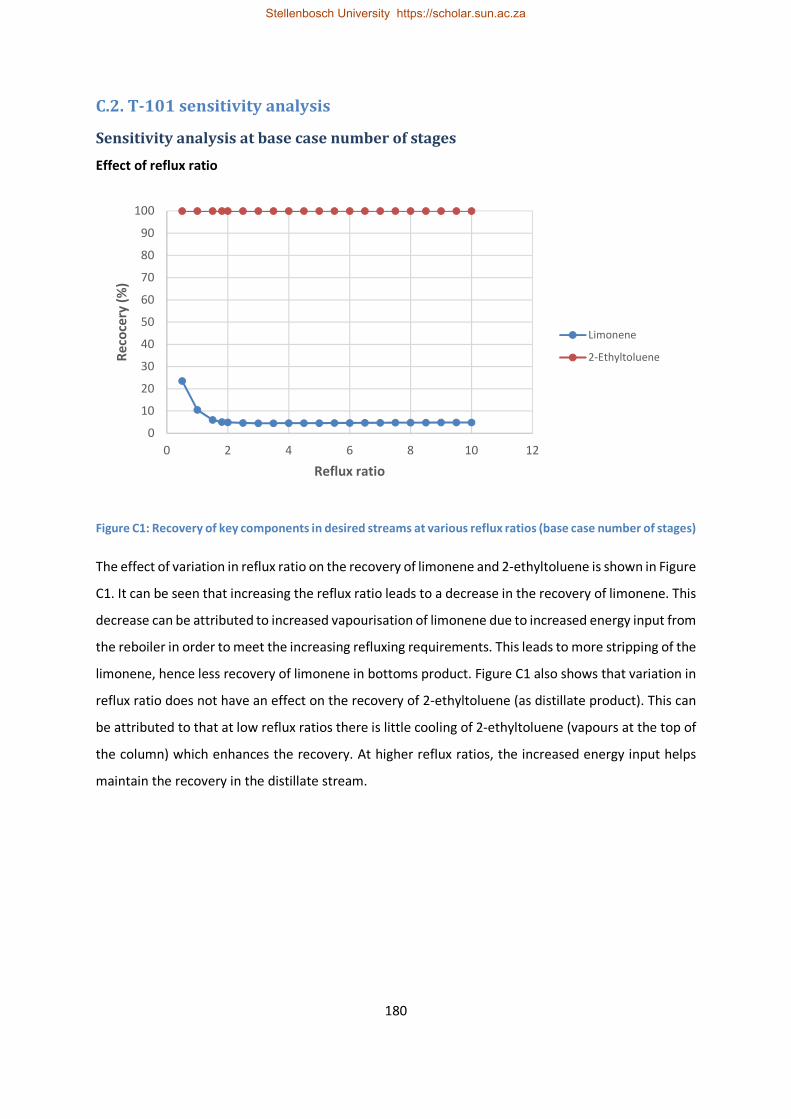
180
C.2. T-101 sensitivity analysis
Sensitivity analysis at base case number of stages
Effect of reflux ratio
Figure C1: Recovery of key components in desired streams at various reflux ratios (base case number of stages)
The effect of variation in reflux ratio on the recovery of limonene and 2-ethyltoluene is shown in Figure
C1. It can be seen that increasing the reflux ratio leads to a decrease in the recovery of limonene. This
decrease can be attributed to increased vapourisation of limonene due to increased energy input from
the reboiler in order to meet the increasing refluxing requirements. This leads to more stripping of the
limonene, hence less recovery of limonene in bottoms product. Figure C1 also shows that variation in
reflux ratio does not have an effect on the recovery of 2-ethyltoluene (as distillate product). This can
be attributed to that at low reflux ratios there is little cooling of 2-ethyltoluene (vapours at the top of
the column) which enhances the recovery. At higher reflux ratios, the increased energy input helps
maintain the recovery in the distillate stream.
0
10
20
30
40
50
60
70
80
90
100
0 2 4 6 8 10 12
Re
coce
ry (
%)
Reflux ratio
Limonene
2-Ethyltoluene
Stellenbosch University https://scholar.sun.ac.za
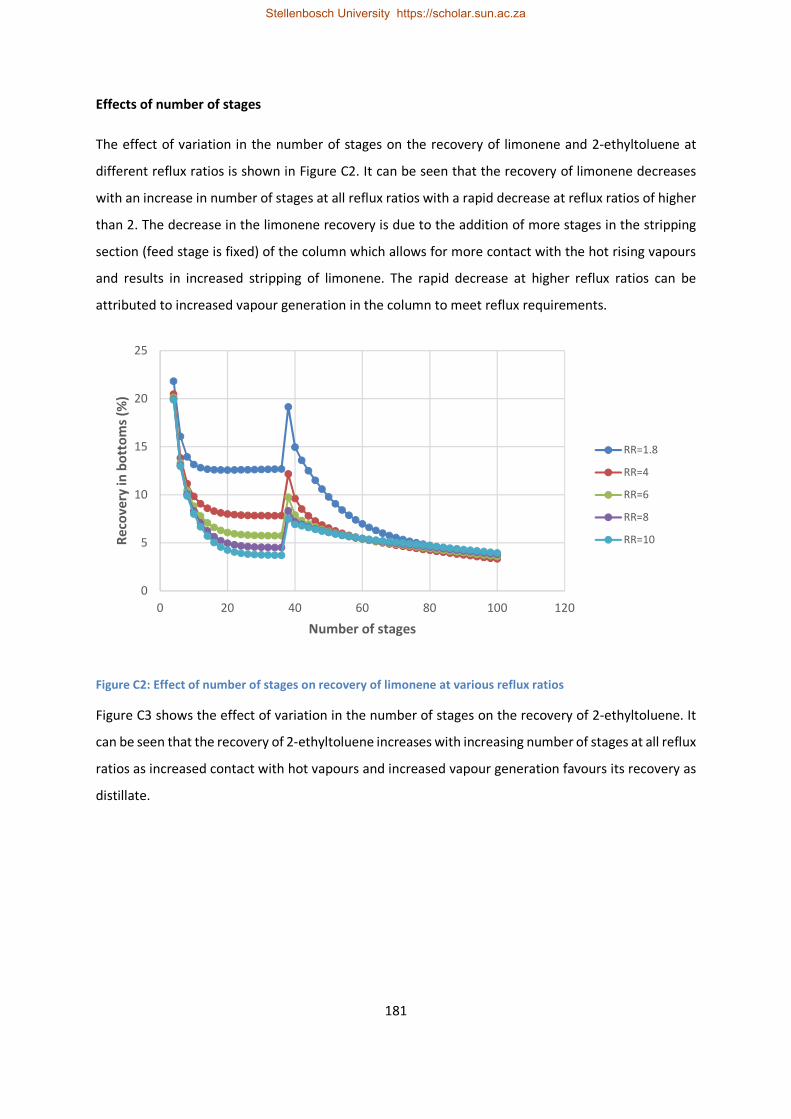
181
Effects of number of stages
The effect of variation in the number of stages on the recovery of limonene and 2-ethyltoluene at
different reflux ratios is shown in Figure C2. It can be seen that the recovery of limonene decreases
with an increase in number of stages at all reflux ratios with a rapid decrease at reflux ratios of higher
than 2. The decrease in the limonene recovery is due to the addition of more stages in the stripping
section (feed stage is fixed) of the column which allows for more contact with the hot rising vapours
and results in increased stripping of limonene. The rapid decrease at higher reflux ratios can be
attributed to increased vapour generation in the column to meet reflux requirements.
Figure C2: Effect of number of stages on recovery of limonene at various reflux ratios
Figure C3 shows the effect of variation in the number of stages on the recovery of 2-ethyltoluene. It
can be seen that the recovery of 2-ethyltoluene increases with increasing number of stages at all reflux
ratios as increased contact with hot vapours and increased vapour generation favours its recovery as
distillate.
0
5
10
15
20
25
0 20 40 60 80 100 120
Re
cov
ery
in b
ott
om
s (%
)
Number of stages
RR=1.8
RR=4
RR=6
RR=8
RR=10
Stellenbosch University https://scholar.sun.ac.za

182
Figure C3: Effect of number of stages on recovery of 2-ethyltoluene at various reflux ratios
Effect of feed location
Figure C4: Effect of feed stage on the recovery of limonene at various reflux ratios
The effect of feed location on the recoveries of limonene and 2-ethyltoluene is shown for various
reflux ratios in Figure C4. Figure C4 shows that the recovery of limonene decreases with increasing
feed location (feeding further down the column) for all reflux ratios. Feeding further down the column
facilitates more vapourisation of limonene due to increasing feed point temperature as feed is
0
10
20
30
40
50
60
70
80
90
100
0 20 40 60 80 100 120
Re
cov
ery
in o
ve
rhe
ad
s (%
)
Number of stages
RR=1.8
RR=4
RR=6
RR=8
RR=10
0
5
10
15
20
25
30
35
40
0 10 20 30 40 50 60 70 80
Re
cov
ery
in b
ott
om
s(%
)
Feed stage
RR=1.8
RR=4
RR=6
RR=8
RR=10
Stellenbosch University https://scholar.sun.ac.za

183
introduced closer to the reboiler. The recovery starts increasing as the feed is introduced much closer
to the reboiler as there is less room for contact of the liquid feed with the hot vapours coming from
the reboiler which results in less limonene being stripped off.
Figure C5: Effect of feed stage on the recovery of 2-ethyltoluene at various reflux ratios
Figure C5 shows that the recovery of 2-ethyltoluene remains constant for almost all feed locations
except just above the reboiler as some of it flows down the column due to reduced contact stages
with the vapours coming from below the feed. Feed location has no effect on the recovery of 2-
ethyltoluene.
Effect of boilup ratio
The effect of boilup ratio on the recoveries of limonene and 2-ethyltoluene is shown in Figure C6 and
Figure C7 respectively. Figure C6 shows that limonene recovery decreases with an increase in boilup
ratio for reflux ratios below 10 as more bottoms product is vapourised and returned as boilup. At a
reflux ratio of 10 there is no change in the recovery as the increased reflux ratio counteracts the effects
of increased boilup and all limonene is recovered as bottoms product.
The recovery of 2-ethyltoluene increases with increasing boilup ratio for all reflux ratios as shown in
Figure C7 and it can also be noted that increasing the boilup ratio above 7 no longer has an effect as
almost all 2-ethyltoluene is recovered already. The recovery in the distillate is favoured by an
increased boilup ratio as more material is vapourised due to increased reboiler energy input.
0
10
20
30
40
50
60
70
80
90
100
0 10 20 30 40 50 60 70 80
Re
cov
ery
in o
ve
rhe
ad
s (%
)
Feed stage
RR=1.8
RR=4
RR=6
RR=8
RR=10
Stellenbosch University https://scholar.sun.ac.za

184
Figure C6: Effect of boilup ratio on the recovery of limonene at various reflux ratios
Figure C7: Effect of boilup on the recovery of 2-ethyltoluene at various reflux ratios
Effect of feed temperature
Figure C8 and Figure C9 show the effects of variation in feed temperature on the recoveries of
limonene and 2-ethytoluene respectively. The variation in feed temperature has very minimal effect
on the recoveries of both limonene and 2-ethyltoluene at all reflux ratios. There is only a slight increase
0
10
20
30
40
50
60
70
80
90
100
0 2 4 6 8 10 12
Re
cov
ery
in b
ott
om
s (%
)
Boilup ratio
RR=1.8
RR=4
RR=6
RR=8
RR=10
0
10
20
30
40
50
60
70
80
90
100
0 2 4 6 8 10 12
Re
cov
ery
in o
ve
rhe
ad
s (%
)
Boilup ratio
RR=1.8
RR=4
RR=6
RR=8
RR=10
Stellenbosch University https://scholar.sun.ac.za

185
in limonene recovery above 120 °C at a reflux ratio of 1.8 as the effects of decreased reboiler duty
slightly decrease the stripping of limonene.
Figure C8: Effect of temperature on the recovery of limonene at various reflux ratios
Figure C9: Effect of feed temperature on the recovery of 2-ethyltoluene at various reflux ratios
0
1
2
3
4
5
6
7
50 100 150 200 250
Re
cov
ery
in b
ott
om
s (%
)
Temperature (°C)
RR=1.8
RR=4
RR=6
RR=8
RR=10
0
10
20
30
40
50
60
70
80
90
100
50 100 150 200 250
Re
cov
ery
in o
ve
rhe
ad
s (%
)
Temperature (°C)
RR=1.8
RR=4
RR=6
RR=8
RR=10
Stellenbosch University https://scholar.sun.ac.za

186
Reboiler duties
Figure C10: Effect of reflux ratio on condenser and reboiler duties at base case number of stages
Figure C11: Effect of number of stages on reboiler duty at various reflux ratios
0
50
100
150
200
250
300
350
400
0 2 4 6 8 10 12
Du
ty (
kW
)
Reflux ratio
Condenser
Reboiler
0
50
100
150
200
250
300
350
400
0 20 40 60 80 100 120
Du
ty (
kW
)
Number of stages
RR=1.8
RR=4
RR=6
RR=8
RR=10
Stellenbosch University https://scholar.sun.ac.za
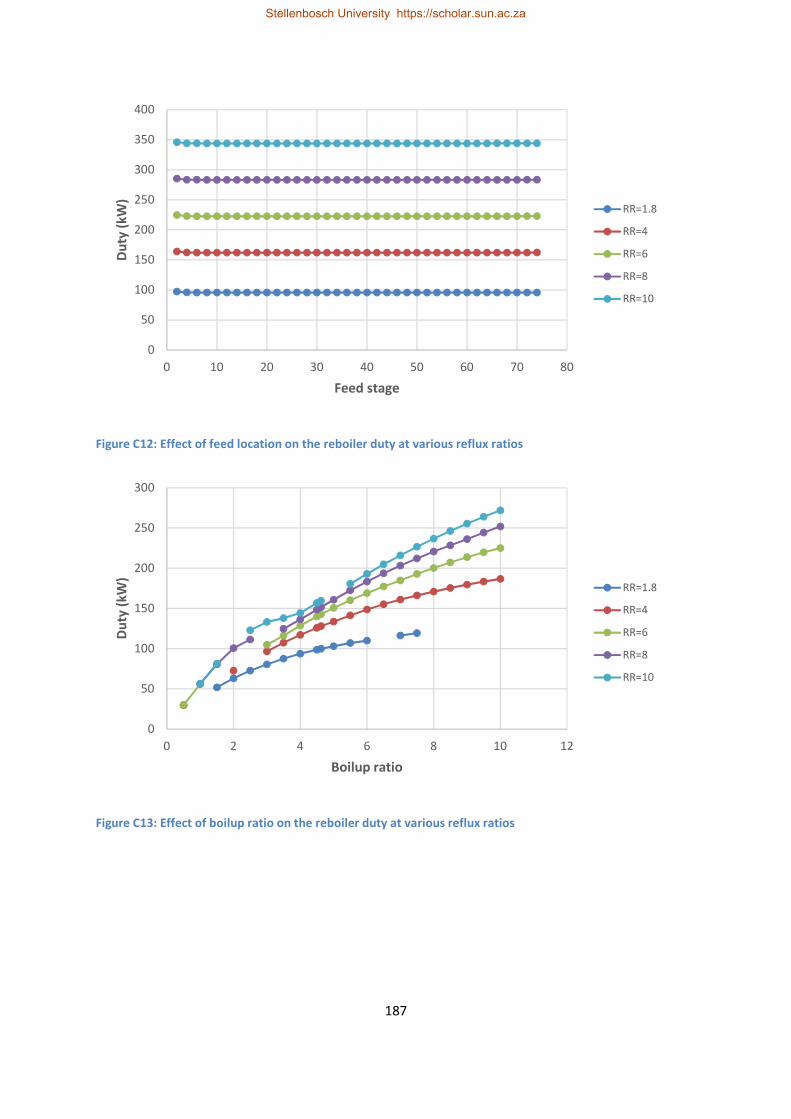
187
Figure C12: Effect of feed location on the reboiler duty at various reflux ratios
Figure C13: Effect of boilup ratio on the reboiler duty at various reflux ratios
0
50
100
150
200
250
300
350
400
0 10 20 30 40 50 60 70 80
Du
ty (
kW
)
Feed stage
RR=1.8
RR=4
RR=6
RR=8
RR=10
0
50
100
150
200
250
300
0 2 4 6 8 10 12
Du
ty (
kW
)
Boilup ratio
RR=1.8
RR=4
RR=6
RR=8
RR=10
Stellenbosch University https://scholar.sun.ac.za

188
Figure C14: Effect of feed temperature on reboiler duty at various reflux ratios
Sensitivity analysis at various number of stages
Figure C15: Effect of reflux ratio on reboiler duty at various number of stages
0
50
100
150
200
250
300
350
400
50 100 150 200 250
Du
ty (
kW
)
Temperature (°C)
RR=1.8
RR=4
RR=6
RR=8
RR=10
0
20
40
60
80
100
120
140
160
0 2 4 6 8 10 12
Du
ty (
kW
)
Reflux ratio
45 stages
50 stages
55 stages
60 stages
65 stages
70 stages
75 stages
Stellenbosch University https://scholar.sun.ac.za
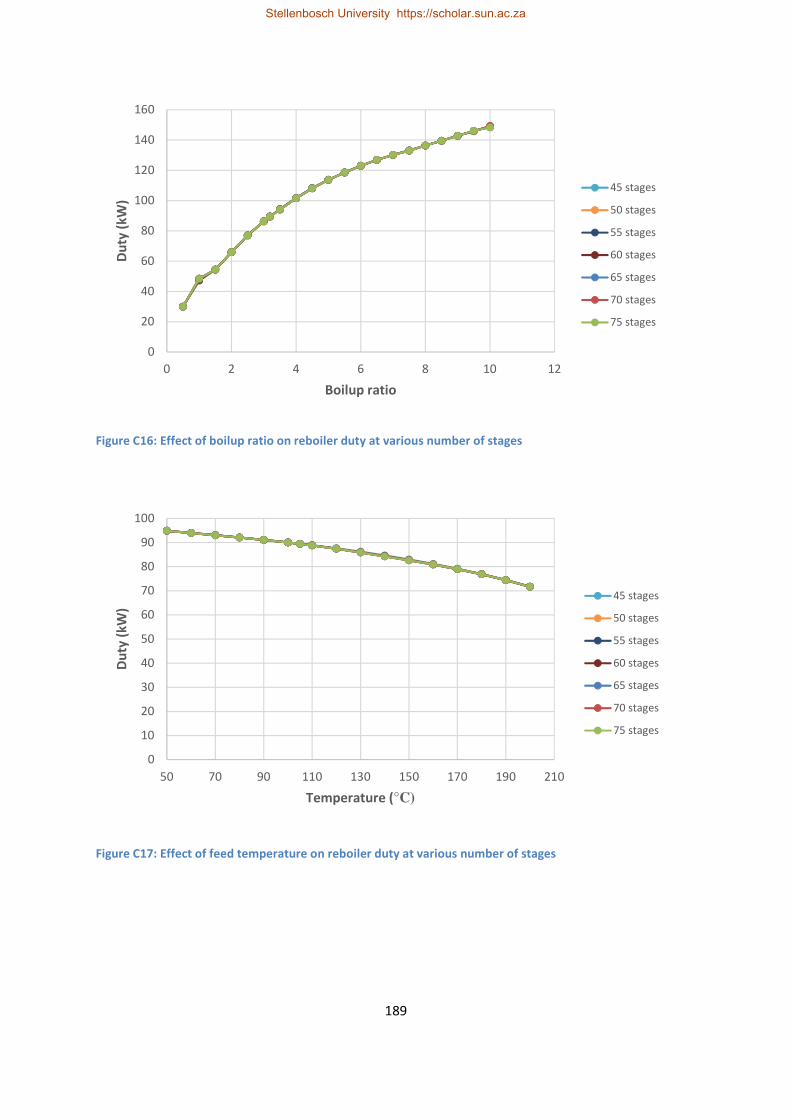
189
Figure C16: Effect of boilup ratio on reboiler duty at various number of stages
Figure C17: Effect of feed temperature on reboiler duty at various number of stages
0
20
40
60
80
100
120
140
160
0 2 4 6 8 10 12
Du
ty (
kW
)
Boilup ratio
45 stages
50 stages
55 stages
60 stages
65 stages
70 stages
75 stages
0
10
20
30
40
50
60
70
80
90
100
50 70 90 110 130 150 170 190 210
Du
ty (
kW
)
Temperature (°C)
45 stages
50 stages
55 stages
60 stages
65 stages
70 stages
75 stages
Stellenbosch University https://scholar.sun.ac.za

190
C.3. T-102 sensitivity analysis
Sensitivity analysis at base case number of stages
Figure C18: Recovery of key components in desired product streams at various reflux ratios at base case
number of stages
Figure C19: Recovery of limonene in distillate product at various distillate to feed ratios for base case number
of stages
0
10
20
30
40
50
60
70
80
90
100
0 2 4 6 8 10 12
Re
cov
ery
(%
)
Reflux ratio
Limonene
2,5-Dimethylstyrene
0
10
20
30
40
50
60
70
80
90
100
0 0.2 0.4 0.6 0.8 1
Re
cov
ery
in d
isti
lla
te (
%)
Distillate to feed ratio
RR=2
RR=4
RR=5.1
RR=6
RR=8
RR=10
Stellenbosch University https://scholar.sun.ac.za

191
Figure C20: Recovery of 2,5-dimethylstyrene at various distillate to feed ratios for base case number of stages
Figure C21: Effect of number of stages on recovery of limonene in distillate product at various reflux ratios
0
10
20
30
40
50
60
70
80
90
100
0 0.2 0.4 0.6 0.8 1
Re
cov
ery
in b
ott
om
s (%
)
Distillate to feed ratio
RR=2
RR=4
RR=5.1
RR=6
RR=8
RR=10
0
10
20
30
40
50
60
70
80
90
100
0 20 40 60 80 100 120
Re
cov
ery
in d
isti
lla
te (
%)
Number of stages
RR=2
RR=4
RR=5.1
RR=6
RR=8
RR=10
Stellenbosch University https://scholar.sun.ac.za

192
Figure C22: Effect of number of stages on recovery of 2,5-dimethylstyrene in bottoms product at various reflux
ratios
Figure C23: Effect of feed location on recovery of limonene in distillate product at various reflux ratios
0
10
20
30
40
50
60
70
80
90
100
0 20 40 60 80 100 120
Re
cov
ery
in b
ott
om
s (%
)
Number of stages
RR=2
RR=4
RR=5.1
RR=6
RR=8
RR=10
0
10
20
30
40
50
60
70
80
90
100
0 10 20 30 40 50 60 70
Re
cov
ery
in d
isti
lla
te (
%)
Feed stage
RR=2
RR=4
RR=5.1
RR=6
RR=8
RR=10
Stellenbosch University https://scholar.sun.ac.za

193
Figure C24: Effect of feed location on recovery of 2,5-dimethylstyrene in bottoms at various reflux ratios
Figure C25: Effect of boil-up ratio on recovery of limonene in distillate at various reflux ratios
0
10
20
30
40
50
60
70
80
90
100
0 10 20 30 40 50 60 70
Re
cov
ery
in b
ott
om
s (%
)
Feed stage
RR=2
RR=4
RR=5.1
RR=6
RR=8
RR=10
0
10
20
30
40
50
60
70
80
90
100
0 2 4 6 8 10 12
Re
cov
ery
in d
isti
lla
te (
%)
Boilup ratio
RR=2
RR=4
RR=5.1
RR=6
RR=8
RR=10
Stellenbosch University https://scholar.sun.ac.za

194
Figure C26: Effect of boil-up ratio on the recovery of 2,5-dimethylstyrene in bottoms at various reflux ratios
Figure C27: Effect of feed temperature on the recovery of limonene in distillate at various reflux ratios
0
10
20
30
40
50
60
70
80
90
100
0 2 4 6 8 10 12
Re
cov
ery
inb
ott
om
s (%
)
Boilup ratio
RR=2
RR=4
RR=5.1
RR=6
RR=8
RR=10
0
10
20
30
40
50
60
70
80
90
100
150 170 190 210 230 250 270
Re
cov
ery
in d
isti
lla
te (
%)
Temperature (°C)
RR=2
RR=4
RR=5.1
RR=6
RR=8
RR=10
Stellenbosch University https://scholar.sun.ac.za

195
Figure C28: Effect of feed temperature on the recovery of 2,5-dimethylstyrene in bottoms at various reflux
ratios
Reboiler duties
Figure C29: Effect of reflux ratio on reboiler duty at base case number of stages
0
10
20
30
40
50
60
70
80
90
100
150 170 190 210 230 250 270
Re
cov
ery
in b
ott
om
s (%
)
Temperature (°C)
RR=2
RR=4
RR=5.1
RR=6
RR=8
RR=10
0
10
20
30
40
50
60
70
80
0 2 4 6 8 10 12
Du
ty (
kW
)
Reflux ratio
Condenser
Reboiler
Stellenbosch University https://scholar.sun.ac.za

196
Figure C30: Effect of distillate to feed ratio on reboiler duty at various reflux ratios
Figure C31: Effect of number of stages on reboiler duty at various reflux ratios
0
50
100
150
200
250
300
0 0.2 0.4 0.6 0.8 1
Du
ty (
kW
)
Distillate to feed ratio
RR=2
RR=4
RR=5.1
RR=6
RR=8
RR=10
0
10
20
30
40
50
60
70
80
90
0 20 40 60 80 100 120
Du
ty (
kW
)
Number of stages
RR=2
RR=4
RR=5.1
RR=6
RR=8
RR=10
Stellenbosch University https://scholar.sun.ac.za

197
Figure C32: Effect of feed location on the reboiler duty at various reflux ratios
Figure C33: Effect of boilup ratio on reboiler duty at various reflux ratios
0
10
20
30
40
50
60
70
80
0 10 20 30 40 50 60 70
Du
ty (
kW
)
Feed stage
RR=2
RR=4
RR=5.1
RR=6
RR=8
RR=10
0
20
40
60
80
100
120
140
0 2 4 6 8 10 12
Du
ty (
kW
)
Boilup ratio
RR=2
RR=4
RR=5.1
RR=6
RR=8
RR=10
Stellenbosch University https://scholar.sun.ac.za

198
Figure C34: Effect of feed temperature on the reboiler duty at various reflux ratios
Sensitivity analysis at various number of stages
Figure C35: Effect of reflux ratio on the recovery of limonene in distillate at various number of stages
0
10
20
30
40
50
60
70
80
90
100
150 170 190 210 230 250 270
Du
ty (
kW
)
Temperature (°C)
RR=2
RR=4
RR=5.1
RR=6
RR=8
RR=10
0
10
20
30
40
50
60
70
80
90
100
0 2 4 6 8 10 12
Re
cov
ery
in d
isti
lla
te (
%)
Reflux ratio
30 stages
40 stages
50 stages
60 stages
70 stages
80 stages
85 stages
Stellenbosch University https://scholar.sun.ac.za

199
Figure C36: Effect of reflux ratio on the recovery of 2,5-dimethylstyrene in bottoms at various number of
stages
Figure C37: Effect of reflux ratio on the reboiler duty at various number of stages
0
10
20
30
40
50
60
70
80
90
100
0 2 4 6 8 10 12
Re
cov
ery
in b
ott
om
s (%
)
Reflux ratio
30 stages
40 stages
50 stages
60 stages
70 stages
80 stages
85 stages
0
10
20
30
40
50
60
70
80
0 2 4 6 8 10 12
Du
ty (
kW
)
Reflux ratio
30 stages
40 stages
50 stages
60 stages
70 stages
80 stages
85 stages
Stellenbosch University https://scholar.sun.ac.za

200
Figure C38: Effect of distillate to feed ratio on recovery of limonene in distillate at various number of stages
Figure C39: Effect of distillate to feed ratio on recovery of 2,5-dimethylstyrene in bottoms at various number
of stages
0
10
20
30
40
50
60
70
80
90
100
0 0.1 0.2 0.3 0.4 0.5 0.6 0.7 0.8 0.9 1
Re
cov
ery
in d
isti
lla
te (
%)
Distillate to feed ratio
30 stages
40 stages
50 stages
60 stages
70 stages
80 stages
85 stages
0
10
20
30
40
50
60
70
80
90
100
0 0.2 0.4 0.6 0.8 1
Re
cov
ery
in b
ott
om
s (%
)
Distillate to feed ratio
30 stages
40 stages
50 stages
60 stages
70 stages
80 stages
85 stages
Stellenbosch University https://scholar.sun.ac.za

201
Figure C40: Effect of distillate to feed ratio on the reboiler duty at various number of stages
Figure C41: Effect of feed location on the recovery of limonene at various number of stages
0
20
40
60
80
100
120
140
160
180
0 0.2 0.4 0.6 0.8 1
Du
ty (
kW
)
Distillate to feed ratio
30 stages
40 stages
50 stages
60 stages
70 stages
80 stages
85 stages
50
55
60
65
70
75
80
85
90
95
100
0 20 40 60 80 100
Re
cov
ery
(%
)
Feed stage
30 stages
40 stages
50 stages
60 stages
70 stages
80 stages
85 stages
Stellenbosch University https://scholar.sun.ac.za

202
C.4. T-103 sensitivity analysis
Effect of reflux ratio
Figure C42: Effect of reflux ratio on limonene recovery in distillate product for various number of stages
Figure C43: Effect of reflux ratio on reboiler duty for various number of stages
Effect of oil feed location
0
10
20
30
40
50
60
70
80
90
100
0 2 4 6 8 10 12
Re
cov
ery
in d
isti
lla
te (
%)
Reflux ratio
35 stages
40 satges
45 stages
50 stages
55 stages
60 stages
65 stages
0
10
20
30
40
50
60
0 2 4 6 8 10 12
Du
ty (
kW
)
Reflux ratio
35 stages
40 stages
45 stages
50 stages
55 stages
60 stages
65 stages
Stellenbosch University https://scholar.sun.ac.za

203
Figure C44: Effect of oil feed stage on limonene recovery in distillate product for various number of stages
Figure C45: Effect of oil feed location on reboiler duty for various number of stages
Effect of entrainer feed location
0
10
20
30
40
50
60
70
80
90
100
0 10 20 30 40 50 60 70
Re
cov
ery
in d
isti
lla
te (
%)
Feed stage
35 stages
40 stages
45 stages
50 stages
55 stages
60 stages
65 stages
0
5
10
15
20
25
30
35
0 10 20 30 40 50 60 70
Du
ty (
kW
)
Feed stage
35 stages
40 stages
45 stages
50 stages
55 stages
60 stages
65 stages
Stellenbosch University https://scholar.sun.ac.za

204
Figure C46: Effect of entrainer feed stage on limonene recovery in distillate product for various number of
stages
Figure C47: Effect of entrainer feed location on reboiler duty for various number of stages
Effect of entrainer flow rate
0
10
20
30
40
50
60
70
80
90
100
0 10 20 30 40 50 60
Re
cov
ery
in d
isti
lla
te (
%)
Feed stage
35 stages
40 stages
45 stages
50 stages
55 stages
60 stages
65 stages
0
5
10
15
20
25
30
35
0 10 20 30 40 50 60
Du
ty (
kW
)
Feed stage
35 stages
40 stages
45 stages
50 stages
55 stages
60 stages
65 stages
Stellenbosch University https://scholar.sun.ac.za

205
Figure C48: Effect of entrainer flow rate on limonene recovery in distillate product for various number of
stages
Figure C49: Effect of entrainer feed rate on reboiler duty for various number of stages
Effect of entrainer feed temperature
0
10
20
30
40
50
60
70
80
90
100
0 200 400 600 800 1000
Re
cov
ery
in d
isti
lla
te (
%)
Flow rate (kg/hr)
35 stages
40 stages
45 stages
50 stages
55 stages
60 stages
65 stages
0
10
20
30
40
50
60
0 200 400 600 800 1000
Du
ty (
kW
)
Flow rate (kg/hr)
35 stages
40 stages
45 stages
50 stages
55 stages
60 stages
65 stages
Stellenbosch University https://scholar.sun.ac.za
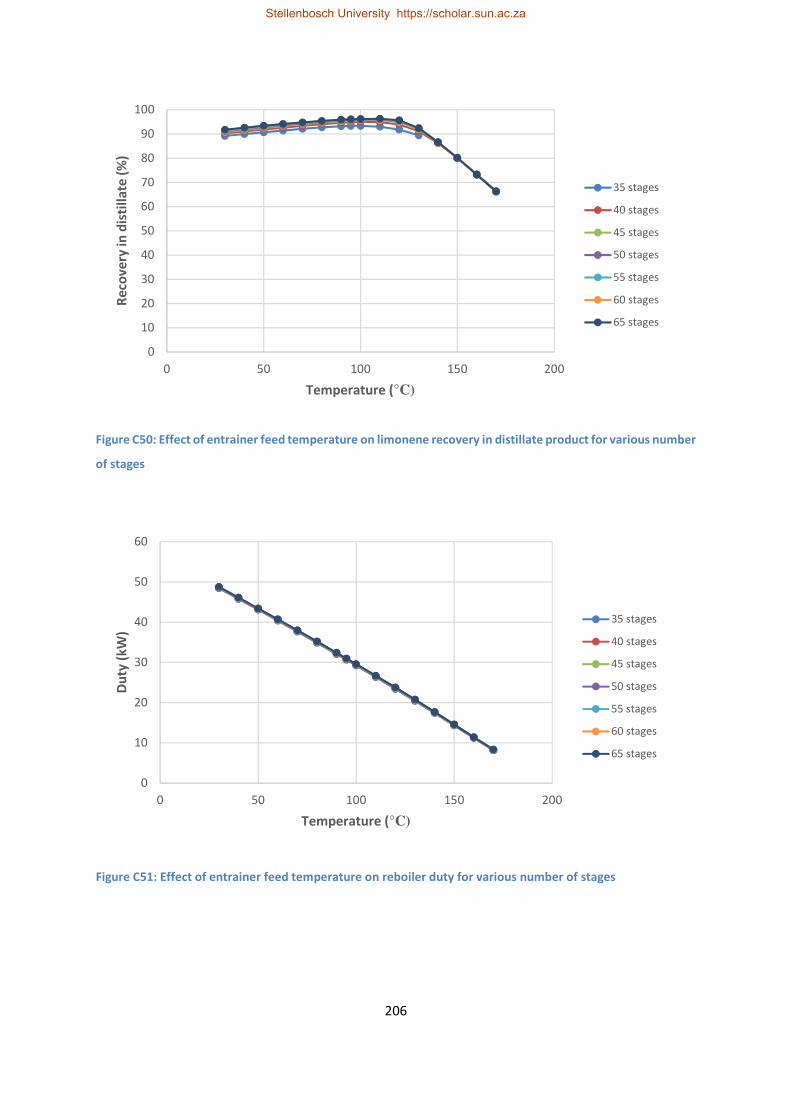
206
Figure C50: Effect of entrainer feed temperature on limonene recovery in distillate product for various number
of stages
Figure C51: Effect of entrainer feed temperature on reboiler duty for various number of stages
0
10
20
30
40
50
60
70
80
90
100
0 50 100 150 200
Re
cov
ery
in d
isti
lla
te (
%)
Temperature (°C)
35 stages
40 stages
45 stages
50 stages
55 stages
60 stages
65 stages
0
10
20
30
40
50
60
0 50 100 150 200
Du
ty (
kW
)
Temperature (°C)
35 stages
40 stages
45 stages
50 stages
55 stages
60 stages
65 stages
Stellenbosch University https://scholar.sun.ac.za

207
C.5. T-104 sensitivity analysis
Effect of reflux ratio
Figure C52: Effect of reflux ratio on the recovery of DEG in bottoms product for various number of stages
Figure C53: Effect of reflux ratio on purity of DEG in bottoms product for various number of stages
0
10
20
30
40
50
60
70
80
90
100
0 0.5 1 1.5 2 2.5
Re
cov
ery
in b
ott
om
s (%
)
Reflux ratio
5 stages
10 stages
15 stages
20 stages
25 stages
30 stages
35 stages
0
10
20
30
40
50
60
70
80
90
100
0 0.5 1 1.5 2 2.5
Pu
rity
in b
ott
om
s (w
t.%
)
Reflux ratio
5 stages
10 stages
15 stages
20 stages
25 stages
30 stages
35 stages
Stellenbosch University https://scholar.sun.ac.za

208
Figure C54: Effect of reflux ratio on reboiler duty for various number of stages
Effect of boilup ratio
Figure C55: Effect of boilup ratio on DEG recovery in bottoms product at various number of stages
0
1
2
3
4
5
6
7
8
9
10
0 0.5 1 1.5 2 2.5
Du
ty (
kW
)
Reflux ratio
5 stages
10 stages
15 stages
20 stages
25 stages
30 stages
35 stages
0
10
20
30
40
50
60
70
80
90
100
0 0.5 1 1.5 2 2.5
Re
cov
ery
in b
ott
om
s (%
)
Boilup ratio
5 stages
10 stages
15 stages
20 stages
25 stages
30 stages
35 stages
Stellenbosch University https://scholar.sun.ac.za

209
Figure C56: Effect of boilup ratio on DEG purity in bottoms product at various number of stages
Figure C57: Effect of boilup ratio on reboiler duty at various number of stages
Effect of feed location
0
10
20
30
40
50
60
70
80
90
100
0 0.5 1 1.5 2 2.5
Pu
rity
in b
ott
om
s (w
t.%
)
Boilup ratio
5 stages
10 stages
15 stages
20 stages
25 stages
30 stages
35 stages
0
20
40
60
80
100
120
0 0.5 1 1.5 2 2.5
Du
ty (
kW
)
Boilup ratio
5 stages
10 stages
15 stages
20 stages
25 stages
30 stages
35 stages
Stellenbosch University https://scholar.sun.ac.za
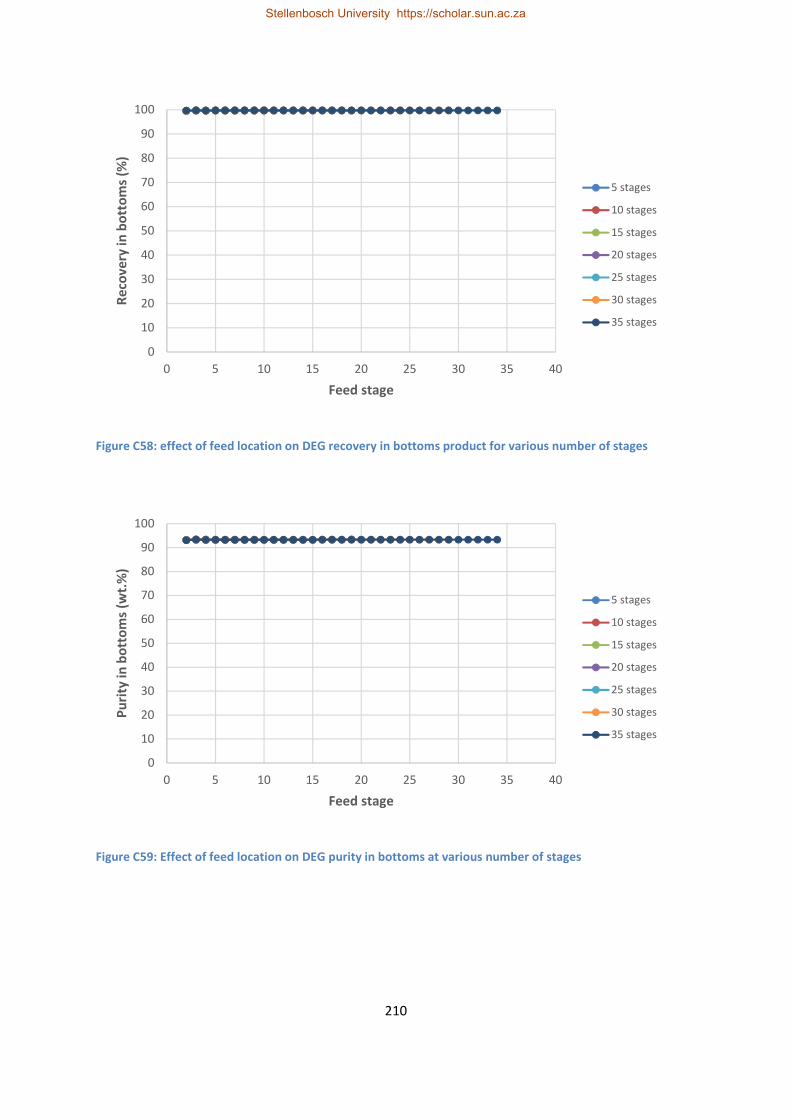
210
Figure C58: effect of feed location on DEG recovery in bottoms product for various number of stages
Figure C59: Effect of feed location on DEG purity in bottoms at various number of stages
0
10
20
30
40
50
60
70
80
90
100
0 5 10 15 20 25 30 35 40
Re
cov
ery
in b
ott
om
s (%
)
Feed stage
5 stages
10 stages
15 stages
20 stages
25 stages
30 stages
35 stages
0
10
20
30
40
50
60
70
80
90
100
0 5 10 15 20 25 30 35 40
Pu
rity
in b
ott
om
s (w
t.%
)
Feed stage
5 stages
10 stages
15 stages
20 stages
25 stages
30 stages
35 stages
Stellenbosch University https://scholar.sun.ac.za

211
Figure C60: Effect of feed location on reboiler duty for various number of stages
Effect of feed temperature
Figure C61: Effect of feed temperature on DEG recovery in bottoms product at various number of stages
0
1
2
3
4
5
6
7
8
9
10
0 5 10 15 20 25 30 35 40
Du
ty (
kW
)
Feed stage
5 stages
10 stages
15 stages
20 stages
25 stages
30 stages
35 stages
0
10
20
30
40
50
60
70
80
90
100
150 170 190 210 230 250
Re
cov
ery
in b
ott
om
s (%
)
Temperature (°C)
5 stages
10 stages
15 stages
20 stages
25 stages
30 stages
35 stages
Stellenbosch University https://scholar.sun.ac.za
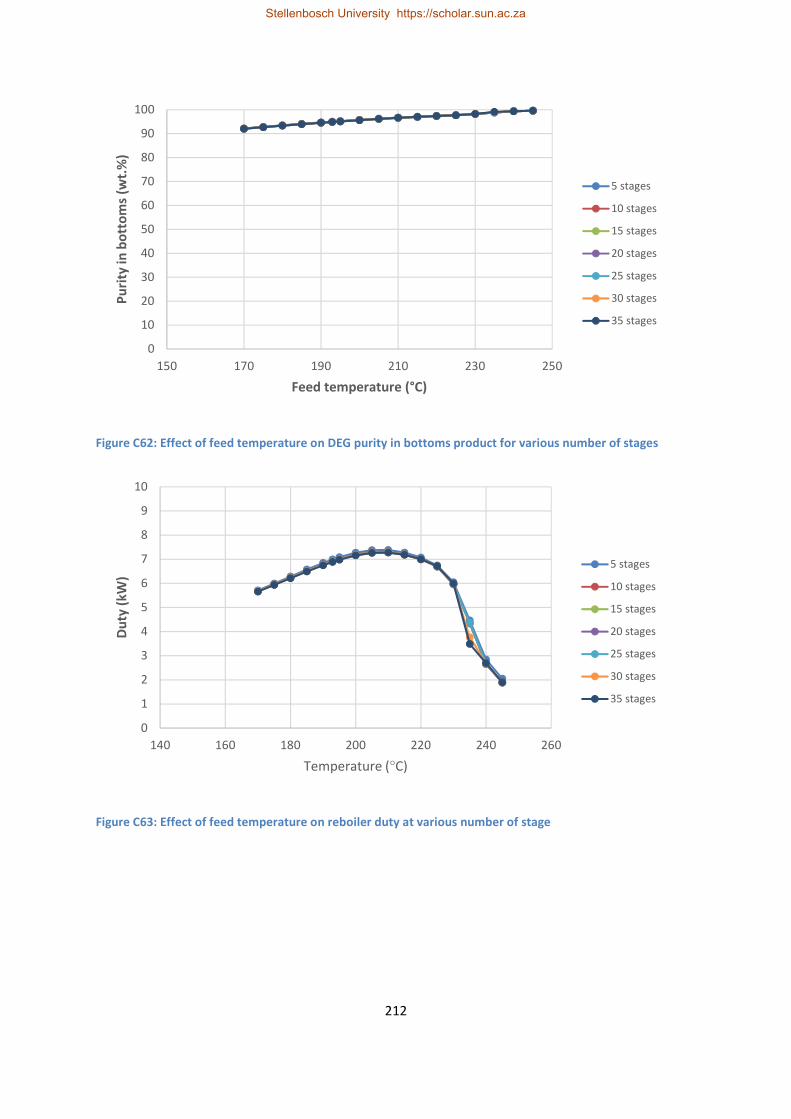
212
Figure C62: Effect of feed temperature on DEG purity in bottoms product for various number of stages
Figure C63: Effect of feed temperature on reboiler duty at various number of stage
0
10
20
30
40
50
60
70
80
90
100
150 170 190 210 230 250
Pu
rity
in b
ott
om
s (w
t.%
)
Feed temperature (°C)
5 stages
10 stages
15 stages
20 stages
25 stages
30 stages
35 stages
0
1
2
3
4
5
6
7
8
9
10
140 160 180 200 220 240 260
Du
ty (
kW
)
Temperature (°C)
5 stages
10 stages
15 stages
20 stages
25 stages
30 stages
35 stages
Stellenbosch University https://scholar.sun.ac.za

213
APPENDIX D: ADDITIONAL INFORMATION FOR ECONOMIC
EVALUATION
Table D1: Additional components of TDC
Component Value (% of ISBL) Actual amount (MM$)
Additional piping 4.5 0.17
Warehouse 4 0.15
Site development 9 0.34
Total other costs 0.66
TDC 4.43
Table D2: Components of TIC
Component Value (% of TDC) Actual amount (MM$)
Prorateable expenses 10 0.44
Field expenses 10 0.44
Home office and construction 20 0.88
Project contingency 10 0.44
Other costs (start-up, permits etc) 10 0.44
TIC 2.66
Table D3: Final components for capital cost estimation
Item Actual amount (MM$)
TFCI 7.09
Land 0.14
WC 0.35
TCI 7.6
Stellenbosch University https://scholar.sun.ac.za

214
Figure D1: Rand/Dollar exchange rate trends for 2016 (from South African Reserve Bank)
Figure D2: Crumb prices from various suppliers
0
1
2
3
4
5
6
8 mesh 10 mesh 20 mesh 30 mesh 40 mesh 60 mesh
Pri
ce (
R/k
g)
Size
Dawhi
Mathe group
Energia
Stellenbosch University https://scholar.sun.ac.za

215
Figure D3: Discounted cash flow for the base case waste tyre to limonene process
Figure D4: Waste tyres collection and processing data for Western Cape, from REDISA (Dec 2014 – Jun 2016)
-10000000
-5000000
0
5000000
10000000
15000000
20000000
0 1 2 3 4 5 6 7 8 9 10
Cu
mu
lati
ve
DC
F ($
)
Project life (years)
0% discount
12% discount
25% discount
-1000
-500
0
500
1000
1500
2000
2500
3000
Sep-14 Dec-14 Apr-15 Jul-15 Oct-15 Jan-16 May-16 Aug-16
Am
ou
nt
of
tyre
s (t
on
s)
Month
Collected Processed Difference Average difference 30 tons/day mark
Stellenbosch University https://scholar.sun.ac.za

216
APPENDIX E: INDIVIDUAL EQUIPMENT COST
Figure D1: Individual equipment cost for pre-treatment and pyrolysis section
Equipment name Description
Number
required
Original size
parameter
Size
parameter
in current
study Size ratio
Size
parameter
units Base year
Scaled unit
purchased cost in
base year (US$)
Total purchased
cost in base year
(US$)
Total scaled
installed cost in
base year (US$)
Installation
factor
Total scaled
installed
cost in 2016
(US$) Source
Single hook debeader 1 2016 8000 8000 24160 24160
Tyre conveyor 1 2016 4800 4800 14496 14496
Tyre shredder 1 2016 52200 52200 157644 157644
Tyre chip conveyer 1 2016 3600 3600 10872 10872
Area total 68600 207172 207172
RX-101 Pyrolysis reactor 1 417 1250 3 kg/hr 2016 386636 386636 1159909 3.0 1159909
MG-101 Magnetic separator 1 417 1250 3 kg/hr 2016 32000 32000 96000 3.0 96000
EX-102 Reactor volatiles condenser 1 235 235 1 kW 2013 14000 14000 88400 6.3 86764 Aspen Plus®
DM-101 Volatiles condenser knockout drum 1 719 719 1 kg/hr 2013 16100 16100 110500 6.9 108455 Aspen Plus®
Area total 448736 1454809 1451128
Pyrolysis
Pyrocrat Systems
LLp
Pre-treatment
1250 1250 1 kg/hr 3.02
Jiangyin Xinda
Machinery Co. Ltd
Stellenbosch University https://scholar.sun.ac.za
Stellenbosch University https://scholar.sun.ac.za

217
Figure D2: Individual equipment cost for the separation section
Equipment name Description
Number
required
Original size
parameter
Size
parameter
in current
study Size ratio
Size
parameter
units Base year
Scaled unit
purchased cost in
base year (US$)
Total purchased
cost in base year
(US$)
Total scaled
installed cost in
base year (US$)
Installation
factor
Total scaled
installed
cost in 2016
(US$) Source
PC 101 Lights remover feed pump 1 0.6 0.6 1 m3/hr 2013 3800 3800 26600 7.0 26108 Aspen Plus®
PC 102 Limonene column feed pump 1 0.1 0.1 1 m3/hr 2013 3800 3800 27500 7.2 26991 Aspen Plus®
T 101 reflux pump 1 0.1 0.1 1 m3/hr 2013 4300 4300 27100 6.3 26598 Aspen Plus®
T 102 reflux pump 1 0.08 0.08 1 m3/hr 2013 4300 4300 28000 6.5 27482 Aspen Plus®
T 103 reflux pump 1 0.01 0.01 1 m3/hr 2013 4300 4300 28000 6.5 27482 Aspen Plus®
T 104 reflux pump 1 0.02 0.02 1 m3/hr 2013 4300 4300 28000 6.5 27482 Aspen Plus®
EX 101 T 101 feed preheater 1 19 19 1 kW 2013 9300 9300 56300 6.1 55258 Aspen Plus®
EX 103 DEG cooler 1 42 42 1 kW 2013 10400 10400 54700 5.3 53688 Aspen Plus®
EX 104 HFO cooler 1 28 28 1 kW 2013 10800 10800 80100 7.4 78617 Aspen Plus®
T 101 condenser 1 91 91 1 kW 2013 12200 12200 81600 6.7 80090 Aspen Plus®
T 102 condenser 1 36 36 1 kW 2013 9300 9300 53400 5.7 52412 Aspen Plus®
T 103 condenser 1 4 4 1 kW 2016 1224 1224 7253 5.9 7253 Turton et al., 2009
T 104 condenser 1 130 130 0.1 kW 2013 3549 3549 16905 4.8 16592 Aspen Plus®
T 101 reboiler 1 103 103 1 kW 2013 18500 18500 79800 4.3 78323 Aspen Plus®
T 102 reboiler 1 38 38 1 kW 2013 16800 16800 71400 4.3 70078 Aspen Plus®
T 103 reboiler 1 29 29 1 kW 2013 12300 12300 66200 5.4 64975 Aspen Plus®
T 104 reboiler 1 31 31 1 kW 2013 20200 20200 75100 3.7 73710 Aspen Plus®
T 101 condenser accumulator 1 680 680 1 kg/hr 2013 15700 15700 99500 6.3 97658 Aspen Plus®
T 102 condenser accumulator 1 430 430 1 kg/hr 2013 15700 15700 108500 6.9 106492 Aspen Plus®
T 103 condenser accumulator 1 56 56 1 kg/hr 2013 15700 15700 108500 6.9 106492 Aspen Plus®
T 104 condenser accumulator 1 135 135 1 kg/hr 2013 15700 15700 108500 6.9 106492 Aspen Plus®
T 101 Light hydrocarbon remover 1 0.46 0.46 1 m 2016 41027 41027 318310 7.8 318310 Turton et al., 2009
T 102 Limonene-rich cut purifier 1 0.46 0.46 1 m 2016 32731 32731 255331 7.8 255331 Turton et al., 2009
T 103 Limonene column 1 0.46 0.46 1 m 2016 32731 32731 255331 7.8 255331 Turton et al., 2009
T 104 DEG regenaration column 1 0.46 0.46 1 m 2016 9291 9291 76087 8.2 76087 Turton et al., 2009
Area total 327953 2138017 2115331
Separation
Stellenbosch University https://scholar.sun.ac.za
Stellenbosch University https://scholar.sun.ac.za

218
APPENDIX F: CASH FLOW ANALYSIS
Figure E1: Cash flow analysis for the waste tyres to limonene scenario (all values in $)
Year
Fixed
capital Land
Working
capital
Manufacturing
costs Revenue Depreciation Tax
Net
income
Cash
flow
Cummulative
cash flow
Discounted
cash flow
(12%)
Cummulative
discounted
cash flow
(12%)
Discounted
cash flow
(25%)
Cummulative
discounted
cash flow
0 -7094426 -141889 -354721 -7591035 -7591035 -7591035 -7591035 -7591035 -7591035
1 -872002 3969493 709443 668654 1719395 2428838 -5162198 2168605 -5422430 1943070 -5647965
2 -872002 3969493 709443 668654 1719395 2428838 -2733360 1936255 -3486176 1554456 -4093509
3 -872002 3969493 709443 668654 1719395 2428838 -304522 1728799 -1757377 1243565 -2849944
4 -872002 3969493 709443 668654 1719395 2428838 2124316 1543570 -213806 994852 -1855092
5 -872002 3969493 709443 668654 1719395 2428838 4553154 1378188 1164381 795882 -1059210
6 -872002 3969493 709443 668654 1719395 2428838 6981991 1230525 2394906 636705 -422505
7 -872002 3969493 709443 668654 1719395 2428838 9410829 1098683 3493589 509364 86859
8 -872002 3969493 709443 668654 1719395 2428838 11839667 980967 4474556 407491 494350
9 -872002 3969493 709443 668654 1719395 2428838 14268505 875863 5350419 325993 820343
10 141889 354721 -872002 3969493 709443 668654 1719395 2925448 17193952 941916 6292335 314118 1134461
Stellenbosch University https://scholar.sun.ac.za
Stellenbosch University https://scholar.sun.ac.za