proceedings - united states coast guard (uscg)
TRANSCRIPT


PROCEEDINGSSummer 2016 Vol. 73, Number 2
Overview6 The U.S. Waterborne Economy
The crucial role our waterway infrastructure and resources play.by Ms. Cassandra Ingram, Mr. Fenwick Yu, and Dr. Regina Powers
11 Say “Cheese”!A snapshot of the Coast Guard’s role in commerce on our waterways.by Mr. Korey J. Barry
13 U.S. Ocean and Coastal EconomiesSignificant contribution to the national economy. by Ms. Tracy Rouleau, Mr. Jeffery Adkins, and Ms. Valerie Were
17 The U.S. Coast Guard and the WaterwaysA history of the vessel traffic service. by Mr. Dave Rosen
19 Storytelling from the Last FrontierCommunications in the Arctic.by LT Anastacia Visneski
Regions22 America’s Marine Highway Routes Map
24 Sector Hampton Roads VirginiaStrength and readiness through collaboration.by LT Karen Lee, LT Ashley Dufresne, and Mr. Trey Clifton
28 The Port of VirginiaA catalyst for commerce.by Ms. Cathie J. Vick
32 A Port for All AgesThe Port of Milwaukee’s rich transportation and trade history.by Mr. Peter Hirthe and CDR Dan Somma
35 Planning for SuccessFrom berthing to departure, the Houston Ship Channel drives our nation’s economy.by Captain Bill Diehl, Mr. Bob Mitchell, Mr. Stan Swigart, CAPT Randal Ogrydziak, CAPT Rob McLellan, and CAPT Brian Penoyer
39 The Mississippi River SystemA strategic resource.by CAPT Michael W. Cribbs

44 Building a PortManaging an expanding port and keeping it healthy. by CDR Brian Khey
46 The Port of New OrleansPreparing for the future.by Mr. Matt Gresham
49 Transforming the TideA look at the Columbia/Snake River system — past, present, and future.by Ms. Jennifer Riddle
52 Commerce and Navigation Safety on the High SeasU.S. Arctic and western Alaska.by CDR Hector L. Cintron, Jr.
55 Alaska Fuel DistributionSix months, 50 million gallons, 100 remote delivery locations.by Captain Greg Pavellas
60 Shifting TidesThe importance of holding on to the American-flagged commercial fleet.by Mr. Charles Diorio
Lessons Learned66 Fire Destroys Two Tank Barges
A tank cleaning operation gone wrong.by Ms. Sarah K. Webster
On Deck4 Director’s Perspective
by Ms. Ellen Engleman Conners
5 Champion’s Point of Viewby CAPT Steven P. Wittrock
71 Chemical of the QuarterUnderstanding Biodieselby LT Andrew Murphy
Nautical Queries72 Engineering73 Deck
Cover image: New Orleans port activity with cityscape by Ed Metz / Shutterstock.Graphics USCG and its licensors, unless otherwise indicated.

In this edition of Proceedings, we focus on our American waterways. The United States has the largest system of ports, waterways, and coastal seas in the world, with 95,000 miles of coastline and 26,000 miles of commercial waterways serving 361 ports, 4,700 marine terminals, and 25,000 miles of inland and coastal waterways. With 90 percent of all containerized cargo now being shipped via maritime conveyance as the most eco-nomic means for transportation, these rivers and ports serve as the historic and present marine transportation system (MTS) — powering the economic engine for national and international commerce. These pathways of commerce within the Western Hemisphere are linked to the global maritime environment.
The Coast Guard is committed to ensuring safe, secure, and environmentally responsible maritime activity in the Western Hemisphere. This commitment requires an integrated and coherent strategy that focuses on the specific priorities of combating transnational criminal networks, securing borders, and safeguarding commerce.
The Coast Guard’s responsibility to support maritime commerce is almost as old as the nation itself, dating back 226 years to the original Revenue Cutter Service. As a nation, continued investment in a safe and efficient marine transportation system is crucial to ensuring that it meets the growing needs of our economy. These strategic investments will ultimately enhance our trade position, support national security interests, ensure greater national wealth and relevance, and ease congestion caused by land-based trans-portation systems.
In this edition we highlight the importance of partnerships, external engagement, and relationships as well as external and internal communication among stakeholders, including the U.S. Coast Guard, industry, political and community leaders, and the customers/taxpayers we serve. This wide range of topics includes the crucial role of waterway infrastructure, a historical review of the vessel traffic service, and the national economic impact of U.S. oceans and coastal economies. Regional topics include stories on the ports of Virginia, Milwaukee, and New Orleans; the Houston Ship Channel; and the Mississippi River and Columbia Snake River systems. We also explore how the Panama Canal expansion project will affect West Coast container terminals and the Mississippi River system.
I hope these articles will encourage a dialogue in support of our marine transportation system — nature’s highways that are fundamental to our nation’s economic growth and security.
4 Proceedings Summer 2016 www.uscg.mil/proceedings
Admiral Paul F. Zukunft Commandant
U.S. Coast Guard
The Marine Safety & Security Council
of the United States Coast Guard
Mr. Calvin Lederer Judge Advocate General
(Acting) Chairman
Mr. Jeffrey G. Lantz Director of Commercial
Regulations and Standards Member
Rear Admiral Peter J. Brown Assistant Commandant
for Response Policy Member
Rear Admiral Paul F. Thomas Assistant Commandant
for Prevention Policy Member
Rear Admiral Todd A. Sokalzuk Assistant Commandant for
Resources, Chief Financial Officer Member
Ms. Ellen Engleman Conners Director for Governmental
and Public Affairs (Acting) Member
Captain Verne B. Gifford Director of Inspections
and Compliance Member
Mr. William R. Grawe Director of National Pollution
Funds Center Member
Captain David C. Barata Director of Marine
Transportation Systems (Acting) Member
Ms. Dana S. Tulis Director of Incident Management
and Preparedness Policy Member
Mr. Michael W. Mumbach Executive Secretary
Director’s Perspective
by MS. ELLEN ENGLEMAN CONNERS Acting Director Governmental and Public Affairs U.S. Coast Guard

In this edition, we explore the ways the maritime domain is expanding as our increasingly interconnected world continues to rely on the marine transportation system (MTS) for rapid, economical, and efficient goods movement from port to port. Currently, more than 90 percent of global trade travels by way of a maritime conveyance. 1 As American water-ways form a large portion of this global marine transportation system network, stakehold-ers depend upon the U.S. Coast Guard to ensure safe waterway transit throughout the United States. Further, ensuring a viable cadre of U.S.-flagged and U.S.-trained commercial vessels and crews remains a vital national security interest.
Additionally, the continued growth of a safe and efficient marine transportation system provides a unique path to swell the economy and national wealth. Ensuring a safe, secure, and viable U.S. waterway system supports the global economy as well as regional United States economies, as U.S. waterways generate $165 million per day 2 and employ more than 374,000 people in the Port of Virginia alone. 3 In this edition, we feature several articles illus-trating the ways this broad array of maritime commerce is critical to our national economy.
Unfortunately, the marine transportation system faces a number of challenges and threats, including natural or man-made disasters, mechanical or human-caused casualties, and the effects of climate change. The effects of any system disruption only magnify our increasing reliance upon the marine transportation system for national and global economic security.
The Coast Guard’s responsibility and ability to manage such threats is critical to maintain-ing MTS efficiency. We manage these risks through our unique global-to-local expertise in the domain, leveraging operational capabilities through a trained and focused workforce as well as close collaboration with a wide range of international, federal, state, local, and industry partners. One final critical element of Coast Guard governance is our need to maintain a careful balance by upholding rigorous safety standards without becoming an impediment to economic growth.
As you look through this edition, you will quickly realize the challenges we face as a nation in attempting to leverage the full capabilities of the MTS while the Coast Guard, along with our partners, continues to balance the need to expand responsibly through a regime of safety and security. I’d like to thank our many maritime industry partners for sharing their expertise in this edition, and I hope our readers find this Proceedings issue interesting and useful.
Endnotes:1. See https://business.un.org/en/entities/13.2. Virginia Maritime Association, “Ports of Virginia Annual 2014.”3. Raymond A. Mason School of Business, College of William & Mary, “The Fiscal Year 2013 Virginia Economic Impacts of
the Port of Virginia.”
Champion’sPoint of
View
5Summer 2016 Proceedingswww.uscg.mil/proceedings
Editorial Team
Barbara Chiarizia Executive Editor
Diana Forbes Managing Editor
Leslie C. Goodwin Art Director
Proceedings is published quarterly in the interest of safety at sea under the auspices of the Marine Safety & Security Council. Special permission for republication, either in whole or in part, except for copyrighted mate-rial, is not required, provided credit is given to Proceedings.
The articles contained in Proceed-ings are submitted by diverse public and private interests in the maritime community as a means to promote maritime safety and security. The views expressed by the authors do not necessarily represent those of the U.S. Coast Guard or the Department of Homeland Security or represent official policy.
Editorial Contact
Email: HQS-DG-NMCProceedings@ uscg.mil
Mail: Commandant (CG-DCO-84) ATTN: Editor, Proceedings Magazine U.S. Coast Guard Stop 7318 2703 Martin Luther King Jr. Ave. S.E. Washington, DC 20593-7318
Web: www.uscg.mil/proceedings
Phone: (202) 372-2316
Subscription Requests
Proceedings is free.
Subscriptionswww.uscg.mil/proceedings
by CAPT STEVEN P. WITTROCK Chief, Office of Strategic Analysis
U.S. Coast Guard

6 Proceedings Summer 2016 www.uscg.mil/proceedings
markets, and the many industries that facilitate goods transportation.
In addition, many NAICS industry sectors are broad, and the portions of those industries that are waterborne-related are not clear. As a result, the totals in table 1 would under-estimate the contribution of our waterways to the national economy. Nevertheless, the detailed industry information is useful in understanding the economic contributions of a number of waterborne industries.
Water Transportation Industries Referring back to table 1, in 2013 there were 1,556 establish-ments in the water transportation industry sector, with rev-enue totaling $41.7 billion. Almost 80 percent of the revenue came from deep sea, coastal, and Great Lakes water trans-portation, which included freight and passenger transporta-tion. Nearly all inland water transportation revenue came from freight shipments. An additional 2,530 establishments offered water transportation support activities, with rev-enues totaling $16.5 billion.
In addition, the water transportation industry and related industries that support waterborne commerce generated $18.5 billion in value added, or 0.1 percent of U.S. gross domestic product (GDP) in 2014. 2 Although this industry’s share of U.S. GDP has stayed relatively stable, its level has risen from $8.1 billion in 2000 to $18.5 billion in 2014, an aver-age annual rate of 6.1 percent. 3
However, the importance of water transportation in the U.S. economy goes beyond these direct employment, rev-enue, and GDP effects; U.S. waterways bring a substantial
The oceans, Great Lakes, and major rivers and tributaries of the United States support a substantial amount of our nation’s economic activity. These waterways facilitate inter-state and global commerce and provide natural resources that enable regions and local communities to offer goods and services, supporting their economies and that of the nation. Defining what comprises the waterborne economy and identifying some possible measures of it can help us better understand how greatly businesses and communities rely upon our nation’s water resources and infrastructure.
National-Level Waterborne IndustriesOfficial data collections of U.S. businesses can be used to estimate the economic contribution of particular industry sectors to the national economy. In the U.S. statistical sys-tem, industries are classified according to the North Ameri-can Industry Classification System (NAICS). 1
According to U.S. Census Bureau data, in 2013, the most recent period for which data is available, there were almost 22,000 establishments in waterborne industries that employed 545,000 workers and had revenues of almost $180 billion (see table 1). In terms of employment and revenues, the waterborne economy represents about 0.5% of the total for all industry sectors.
However, these industries are just a starting point for our understanding of the role of waterborne industries in the national economy. For example, national and international waterways facilitate the flow of goods from the place of pro-duction into consumers’ hands. Thus, much of the value of the waterborne economy lies in the vast amount of goods moving through U.S. ports for domestic and international
The U.S. Waterborne EconomyThe crucial role our waterway infrastructure
and resources play.
by MS. CASSANDRA INGRAM Economist
U.S. Department of Commerce
MR. FENWICK YU Economist
U.S. Department of Commerce
DR. REGINA POWERS Economist
U.S. Department of Commerce
Overview

7Summer 2016 Proceedingswww.uscg.mil/proceedings
amount of goods to domestic and international consumers and businesses.
Waterborne Goods Movement According to data from the Waterborne Commerce Statis-tics Center of the U.S. Army Corps of Engineers, domestic and foreign waterborne traffic of goods in 2013 was 33.2 per-cent higher than in 1983 (see figure 1). The increase came entirely from foreign water-borne commerce, which rose 84.2 percent during the period, while domestic waterborne commerce fell 6.8 percent. However, waterborne ship-ments of goods fell from a peak of 2,588 million short tons in 2006 to 2,275 million short tons in 2013. The decline in this period resulted mostly from the drop in petroleum ship-ments, which fell 17.3 percent. 4
Waterborne Commerce Sta-tistics Center data also shows that petroleum and petroleum products are the largest group of commodity, by tonnage, in total U.S. waterborne com-merce, accounting for 40.8 per-cent of total traffic in 2013. The second-largest group is crude materials (14.6 percent), fol-lowed by coal (13.7 percent). Petroleum and petroleum products are also the larg-est group of commodities, by tonnage, in domestic and for-eign waterborne commerce, accounting for 36.8 percent of total domestic traffic in 2013, and 43.3 percent of total for-eign waterborne commerce in 2013.
U.S. Ports and Foreign TradeForeign trade is vital to the U.S. economy. Exports and imports accounted for 13.5 percent and 16.6 percent of GDP,
respectively, in 2014. 5 U.S. ports handled $1,751 billion of waterborne exports and imports, or 44.1 percent of total U.S.
Waterborne Industries, 2013North American Industry Classi�cation System industries that are comprised of waterborne industries,
as well as the number of establishments, employment, and revenues of �rms in these industries.
Number of Establishments Employment
2012 Revenues ($1,000)
Aquaculture 3,093 5,798 1,371,707Fin�sh farming and �sh hatcheries #N/A #N/A #N/AShell�sh farming #N/A #N/A #N/AOther aquaculture #N/A #N/A #N/A
Fishing 2,259 5,990 5,118,939Fin�sh �shing 1,288 3,669 #N/AShell�sh �shing 925 2,200 #N/AOther marine �shing 46 121 #N/A
Seafood Product Preparation and Packaging 604 31,390 10,692,418
Ship and Boat Building 1,514 135,287 31,945,467Ship building and repairing 683 106,627 24,956,770Boat building 831 28,660 6,988,697
Search, Detection, Navigation Guidance, Aeronautical and Nautical System and Instrument Manufacturing 592 131,900 50,279,094
Fish and Seafood Merchant Wholesalers 2,098 20,367 14,305,670
Fish and Seafood Markets 1,995 10,631 2,105,437
Water Transportation 1,556 66,672 41,708,660Deep sea freight transportation 305 8,704 9,639,955Deep sea passenger transportation 62 16,743 16,324,925Inland water freight transportation 497 18,659 7,006,467Inland water passenger transportation 124 1,885 370,567Inland waterways towing transportation 355 18,671 8,074,181Inland waterways ferry transportation 213 2,010 292,565
Scenic and Sightseeing Transportation, Water 1,783 12,548 1,579,684
Support Activities for Water Transportation 2,530 98,460 16,486,242Port and harbor operations 383 7,000 2,359,128Marine cargo handling 458 66,301 8,903,626Navigational services to shipping 847 12,485 3,167,702Other support activities for water transportation 842 12,674 2,055,786
Marinas 3,844 26,373 3,891,178
Total Waterborne Industries 21,868 545,416 179,484,496
Total Economy 7,488,353 118,266,253 32,061,450,544
Percent of Total Economy 0.29% 0.46% 0.56%
Sources: Establishment and employment data are from the 2013 County Business Patterns, U.S. Census Bureau, except Aquaculture.Aquaculture establishment and revenue data are from the 2013 Census of Aquaculture, U.S. Department of Agriculture. Aquaculture employment data are from the 2013 Quarterly Census of Employment and Wages, U.S. Bureau of Labor Statistics. Revenue data, except Aquaculture and Fishing, are from the 2012 Economic Census, U.S. Census Bureau.Fishing revenue data are from 2013 Commercial Landings, National Marine Fisheries Service, National Oceanic and Atmospheric
Administration.Notes: Revenue data from the Economic Census are for 2012 and refer to value of sales, shipments, receipts, revenue, or business.Aquaculture establishments refer to farms.
Table 1

8 Proceedings Summer 2016 www.uscg.mil/proceedings
In the NOAA Report on the U.S. Ocean and Great Lakes Economy, it was esti-mated that, taken together, the six economic sectors defined as the water-borne economy in coastal communities (living resources, marine construction, marine transportation, offshore min-eral extraction, ship and boat build-ing, and tourism/recreation) gener-ated $343 billion in GDP and employed 2.9 million people. Of the six sectors, tourism/recreation and offshore min-erals industries are the frontrunners in terms of the levels they contribute to the “waterborne” economic activities of coastal communities. 8
Tourism and RecreationThe ocean-based tourism and recre-ation sector accounted for the most
economic activity in our coastal communities, according to the NOAA Report on the U.S. Ocean and Great Lakes Economy. Industries included in the NOAA analysis were eating and drinking places, hotels and lodging, scenic water tours, aquariums, parks, marinas, boat dealers, recreational vehicle parks and campsites, and associated sporting goods
trade, in 2014 (see table 2). Though the share of waterborne trade to total U.S. trade has declined during the past few years, it is still higher than it was a decade ago; in 2014, the share was 44.1 percent compared to 42 percent in 2004. 6
Coastal Community EconomiesAnother way to measure the waterborne economy is to explore how industries con-tribute to the U.S. economy through their engagement in economic activity in coastal communities. The close prox-imity of these communities to major waterways means much of their overall eco-nomic activity in these areas can be attributed to the value of the waterborne economy. According to the National Oceanic and Atmospheric Administrat ion (NOAA) “National Coastal Population Report,” about 40 percent of the nation’s population resides in shoreline coastal communities, and many of these communities rely on waterborne goods and ser-vices to support their econo-mies. 7
Waterborne Foreign Trade Through the Top Ten U.S. Custom Districts (Billions of U.S. Dollars)
The top five custom districts in terms of waterborne trade are Los Angeles, Houston-Galveston, New York City, New Orleans, and Savannah. These top five custom districts handled 61.6 percent of all U.S. waterborne trade in 2014. Altogether, the top 10 custom districts were responsible for 82 percent of total U.S. waterborne exports and imports in 2014.
U.S. Custom District 2013 2014
Total Trade Exports Imports
Total Trade Exports Imports
All U.S. Ports 1,746.9 598.3 1,148.6 1,750.9 600.2 1,150.7
Los Angeles, CA 409.7 81.4 328.3 409.8 78.6 331.2
Houston-Galveston, TX 229.7 119.5 110.2 228.5 121.3 107.2
New York City, NY 202.3 53.2 149.1 207.8 52.9 154.9
New Orleans, LA 138.7 64 74.7 130.9 65.5 65.4
Savannah, GA 90 32.7 57.3 101.5 33.7 67.8
Seattle, WA 90.1 26.6 63.5 85.5 26.3 59.2
San Francisco, CA 72.4 25.1 47.3 76.3 26.4 49.9
Norfolk, VA 67.1 29.7 37.4 71.6 30.6 41
Charleston, SC 65.1 24.4 40.7 71.4 26.7 44.6
Baltimore, MD 52.6 20.9 31.7 52.5 18.6 33.9
Note: Top ten custom districts selected based on 2014 total trade. Source: U.S. Census Bureau, Foreign Trade Division (https://usatrade.census.gov/).
Table 2continued on page 10
Figure 1

9Summer 2016 Proceedingswww.uscg.mil/proceedings
Regional ToolsThe importance of the waterborne industries to coastal communities can vary from region to region and city to city, and there are a number of regional tools that can be used to better understand and value the waterborne economy at the local level.
Using Virginia port communities as an example, we discuss three such resources:
NOAA Coastal Community ExplorerThe National Oceanic and Atmospheric Administration (NOAA) has developed useful regional data and visualization tools that highlight the ocean and Great Lakes economies for coastal counties and states. For example, Economics: National Ocean Watch (ENOW) data 1 provides county and state snapshots as well as a data explorer that allows users to access data on a number of waterborne industries at the county and state levels.
This information provides employment totals, wages, the number of establishments, and gross domestic product, all broken down by economic sector related to the ocean economy. It also provides county, state, and national comparisons by economic sectors that are part of the ocean and Great Lakes waterborne economy.
For example, the ENOW data explorer’s “quick summary” of Norfolk City, a port city in Virginia, indicates that in 2012 the ocean economy represented 12 percent of total employment in Norfolk City, and ranked 39 of 402 coastal counties in terms of employment in the ocean economy.
Census Local Employment Dynamics DataThe Census Bureau’s Local Employment Dynamics program provides another source of data on local communities, including coastal communities. 2 In partic-ular, the program’s quarterly workforce indicators (QWIs) o�er several interesting indica-tors about the local labor market that can be aggregated by state, county, metropolitan area, or other types of geographies.
These indicators, such as employ-ment and earnings for employees
who worked for their employer for at least a full quarter, can be broken down by detailed industry, firm size and age, or selected worker demographics and can show how important waterborne industries are to coastal communities.
For example, table 3 shows select QWI data for the Virginia Beach-Norfolk-Newport News metropolitan statistical area for 2014. The ship and boat building industry accounted for almost 5 percent of full-quarter employees in that community. Water transportation and support activities for water transportation together accounted for 0.7 percent, and seafood product preparation and packaging accounted for 0.1 percent. There were relatively few jobs in other waterborne industries in the area.
The QWI data also shows that in 2014, while average monthly earnings for full-quarter employees in the community were $3,721, in ship and boat building, average monthly earnings were about $6,447, or 173 percent higher than overall. Likewise, earnings in deep sea and coastal water transportation and support activities for water transporta-tion were signi�cantly higher than the overall average ($9,267 and $5,018, respectively). However, earnings in the other waterborne industries in the area, all of which were rela-tively small in terms of overall employment shares for the area, were below the overall average.
Regional Industry Cluster Mapping ToolWater transportation and related industries are especially concentrated and essential to economic competitiveness in several regions of the country. Regional concentrations of related industries are referred to as clus-ters. The U.S. Cluster Mapping Tool, 3 built through a partnership between Harvard Business School and the Economic Develop-ment Administration in the U.S. Department of Commerce, is a resource that allows users to identify industry clusters.
The Cluster Mapping Tool identifies 67 different types of clusters, including water transportation, and makes it easy to analyze the clusters and the regions in which they exist. For the industries they de�ne as water transportation industries, 4 the Virginia Beach metropolitan statistical area bubbles up as a critical cluster. In 2013, nearly 14 percent of the area’s total jobs were in this cluster — nearly double the share for the second-ranked water transportation cluster, Los Angeles.
Endnotes:1, 2, 3. See “For more information,” on next page.4. It is important to note that economic measures of
regionally based industry clusters can di�er some-what. This occurs because the information and data can come from a broad range of sources or timeframes, and they often draw from sources that use di�erent North American Industry Classi�ca-tion System industries to de�ne a regional industry cluster.
Selected Employment Indicators for Virginia Beach-Norfolk-Newport News Coastal Community, 2014
Percent of Total
Employment
Average Monthly Earnings
Average Monthly Earnings
Relative to Overall Average
Total, All Industries 100% $3,721 100%
Select Waterborne Industries
Aquaculture less than 0.05% $2,787 75%
Fishing less than 0.05% $2,158 58%
Seafood Product Preparation and Packaging 0.1% $3,078 83%
Ship and Boat Building 4.9% $6,447 173%
Deep Sea, Coastal, and Great Lakes Water Transportation
0.2% $9,267 249%
Inland Water Transportation less than 0.05% $2,606 70%
Scenic and Sightseeing Transportation, Water less than 0.05% $1,604 43%
Support Activities for Water Transportation 0.5% $5,018 135%
Source: Analysis of Quarterly Workforce Indicators, available at http://qwiexplorer.ces.census.gov.
Table 3

10 Proceedings Summer 2016 www.uscg.mil/proceedings
About the authors:Cassandra Ingram is an economist in the Office of the Chief Economist, Department of Commerce. Her research topics have included performance evaluation of business assistance programs, the innovation economy, women-owned businesses, and the green economy. Previously, she was a research economist at the Economic Research Service, U.S. Department of Agriculture. She holds an M.S. in agricultural and natural resource econom-ics from the University of California at Davis.
Fenwick Yu is an economist in the Office of the Chief Economist, Depart-ment of Commerce. His work has included various international and domes-tic issues. He also served as a commercial attaché for three years at the U.S. Embassy in Beijing. He holds an M.A. in economics from Binghamton University.
Regina Powers is an economist in the Office of the Chief Economist, Depart-ment of Commerce. Her recent work has included reports on the value of federal statistical data, earnings in the manufacturing sector, and data-inten-sive occupations. Previously, she worked at the U.S. Department of Labor as an economist in the policy office and at the Occupational Safety and Health Administration. She holds a Ph.D. in economics and a J.D., both from Indi-ana University.
Endnotes:1. See www.census.gov/econ/census/ and www.census.gov/eos/www/naics/ for
information about the Economic Census and the detailed industries covered by NAICS codes.
2. For more details on how GDP is measured, see https://bea.gov/national/pdf/nipa_primer.pdf.
3. Bureau of Economic Analysis, “Industry Data,” www.bea.gov/iTable/iTable.cfm?ReqID=51&step=1#reqid=51&step=51&isuri=1&5114=a&5102=1.
4. Calculated from data in “Waterborne Commerce of the United States, Calendar Year 2013, Part 5 - National Summaries,” compiled under the supervision of the Institute for Water Resources, U.S. Army Corps of Engineers, Tables 1-1 & 1-5, found at www.navigationdatacenter.us/wcsc/pdf/wcusnatl13.pdf.
5. Bureau of Economic Analysis, “GDP and the National Income and Product Accounts,” Table 1.1.5. www.bea.gov/iTable/iTable.cfm?ReqID=9&step=1#reqid=9&step=3&isuri=1&903=5.
6. The U.S. Census Bureau collects and disseminates foreign trade statistics, includ-ing foreign trade by custom districts and ports, available at https://usatrade.census.gov/.
7. National Coastal Population Report, “Population Trends from 1970-2020,” found at http://oceanservice.noaa.gov/facts/coastal-population-report.pdf.
8. NOAA Report on the U.S. Ocean and Great Lakes Economy, found at https://coast.noaa.gov/data/docs/digitalcoast/econ-report.pdf.
9. National Oceanic and Atmospheric Administration, National Marine Fisheries Service, https://www.st.nmfs.noaa.gov/economics/fisheries/recreational/angler-expenditures-economic-impacts/index.
manufacturing. This sector supported 2.1 million employ-ees and $97.1 billion in value added in the ocean and Great Lakes economy in 2012.
Results from the 2011 NOAA National Marine Recreational Fishing Expenditure Survey demonstrates the importance of marine anglers to local economies, as they generated about $23.4 billion in total expenditures nationally. Their trip-related expenditures were $4.4 billion, and they spent another $19 billion on fishing equipment and durable goods. 9
O�shore Oil and Gas ProductionOffshore mineral extraction generates a good amount of economic value for local economies as well as for the nation as a whole. According to the “NOAA Report on the Ocean Economy,” in 2010 close to one quarter of total U.S. crude oil production occurred offshore in state and federal waters. Offshore oil and gas production supported 160,000 employ-ees and created $159 billion in GDP in 2012, and the Gulf of Mexico region accounted for a large majority of this pro-duction. The offshore mineral extraction sector has also experienced higher-than-average wages and relatively large annual growth.
Marine ConstructionMarine construction industries are also critical to ensur-ing that the waterborne movement of goods remains unim-peded. According to The NOAA Report on the U.S. Ocean and Great Lakes Economy, marine construction industries such as those heavy construction activities associated with navigation channel dredging, beach replenishing, and dock building supported 43,000 employees and contributed $5.7 billion in GDP in 2012.
Further, this waterborne sector has some of the highest aver-age wages per employee — $67,000/year, which was much higher than the national average of $49,000/year in 2012.
In SumThe primary mission of the U.S. Coast Guard is to protect and support our coastal communities, marine resources, and waterborne commerce, which in turn protects the liveli-hoods and safety of our coastal communities as well as our national economy.
The measures of the waterborne economy clearly demon-strate how a breadth of U.S. economic activity — and the value of our economy — relies heavily upon our waterways.
Note:The views expressed in this article are solely those of the authors and do not necessarily reflect the views of the U.S. Department of Commerce.
For more information:
NOAA’s Economics: National Ocean Watch (ENOW) Explorer https://coast.noaa.gov/digitalcoast/tools/enow
NOAA’s Coastal County Snapshots https://coast.noaa.gov/snapshots/
Census’ Longitudinal Employer-Household Dynamics Data http://lehd.ces.census.gov/
U.S. Cluster Mapping Toolwww.clustermapping.us/cluster

11Summer 2016 Proceedingswww.uscg.mil/proceedings
During the course of the U.S. Coast Guard’s evolution from the Revenue Cutter Service to the modern Coast Guard, 1 the organization has expanded its original narrowly tailored revenue mandate into a multimission organization, integral to the healthy functioning of modern American commerce.
Maritime Law Enforcement and ProtectionThe Coast Guard serves as the lead agency for enforcing national and international law on the high seas, outer con-tinental shelf, and inward from the U.S. exclusive economic zone to waters over which the United States has jurisdiction. The service derives this authority from 14 U.S.C. § 89, which enables the Coast Guard to investigate, examine, inspect, and search vessels, and in addition perform seizures and arrests upon the high seas and waters over which the United States has jurisdiction.
The constitutionality of this broad-sweeping authority has been challenged numerous times, but federal courts have repeatedly found in the service’s favor. As early as 1804, sto-ried Chief Justice John Marshall opined that countries have the right to protect their maritime commerce. 2 More recent rulings have acknowledged that while Marshall’s reading is extremely broad, the crux of that argument remains true: A nation’s ability to protect its interests on the high seas is paramount to its national interests. 3 In short, the Coast Guard’s broad authority in this area enables the service to ensure that maritime commerce remains safe, secure, and efficient.
In addition to the Coast Guard’s law enforcement authority in Title 14, specifically with respect to the exclusive eco-nomic zone, the Magnuson-Stevens Fishery Conservation and Management Act requires the service to protect the domestic fishing industry by preventing foreign fishing ves-sels from encroaching into U.S. waters and raiding domestic fishing stocks. 4
Protecting the Maritime Transportation SystemWorking under a diverse set of authorities, the Coast Guard maintains and operates a robust regulatory program to ensure that U.S. waterways remain safe and secure. This facilitates efficient transport of goods and services across the United States. For example:
• Starting with transfer of the Lighthouse Service to the Coast Guard in 1939, 5 the service has been charged with the operation and maintenance of short- and long-range aids to navigation that are vital to both the commercial shipping sector as well as to maritime-based tourism ventures. 6
• Congress granted similar authority to the Coast Guard to issue regulations pertaining to maintaining and operating bridges over navigable water of the United States.7
• During the 1970s, amidst a legislative climate that placed a priority on environmental protection, Congress passed the Ports and Waterways Safety Act. Among other things, it required the Coast Guard to establish and implement vessel traffic services to prevent damage to vessels, bridges, or other structures and to protect the navigable waters of the United States from environmen-tal harm. 8
Say “Cheese”!A snapshot of the Coast Guard’s role
in commerce on our waterways.
by MR. KOREY J. BARRY Legislative Counsel U.S. Coast Guard
Overview
On an average day, the Coast Guard facilitates movement of $8.7 billion worth of goods and commodities through the U.S. marine transportation system.—U.S. Coast Guard Posture Statement

12 Proceedings Summer 2016 www.uscg.mil/proceedings
2. To quote Marshall: “(a)ny attempt to violate the laws made to protect this right, is an injury to itself, which it may prevent, and it has a right to use the means necessary for its prevention. These means do not appear to be limited within any certain marked boundaries … .” Church v. Hubbart, 6 U.S. (2 Cranch) 187, 235 (1804).
3. United States v. One (1) 43 Foot Sailing Vessel, 538 F.2d 694 (5 Cir. 1976); United States v. Williams, 617 F.2d 1063 (5 Cir. 1980).
4. 16 U.S.C. § 1851, et.seq.5. The origins of the Lighthouse Service actually predate the founding of the republic
by more than 70 years. The first lighthouse constructed on U.S. soil was in 1716 on Little Brewster Island in Boston Harbor. George R. Putnam, Lighthouses and Light-ships, 5 (1917). Congress created the Lighthouse Service in 1789, but the Lighthouse Service was not transferred to the Coast Guard until 1939. Reorganization Plan No. II, § 2, 53 Stat. 1431 (June 7, 1939).
6. See, e.g., 14 U.S.C. §§ 81 & 85.7. See, e.g., Rivers and Harbors Appropriations Act of 1899, ch. 425, §§ 9, 12 & 18, 30
Stat. 1121, 1151-53 (as amended) (33 U.S.C. §§ 401, 406 & 502).8. See, e.g., Cinnamon Pinon Carlame, US and EU Laws and Policies Compared, 249
(2010); Ports and Waterways Safety Act, Pub. L. No. 92-340, § 101, 86 Stat. 424 (1972) (33 U.S.C. § 1221 et seq.).
9. See, e.g., 46 U.S.C. §§ 3311, 7101 & 7302.10. U.S. Coast Guard, Posture Statement, 25 (2015).11. Ronald O’Rourke, Cong. Research Serv., R34391, Coast Guard Polar Icebreaker Mod-
ernization: Background and Issues for Congress (2015), https://www.fas.org/sgp/crs/weapons/RL34391.pdf.
12. Ronald O’Rourke, Cong. Research Serv., R41153, Changes in the Arctic: Background and Issues for Congress (2015), https://www.fas.org/sgp/crs/misc/R41153.pdf.
• A bit more recently, Congress required the Coast Guard to develop, implement, and enforce an intricate mari-time governance regime focusing on commercial and recreational vessel inspection as well as on licenses, cer-tificates, and merchant mariner documentation. 9
Ice OpsUtilizing a host of express statutory authorities, the Coast Guard undertakes national and international icebreaking operations. With respect to domestic icebreaking operations, the service renders aid or assistance to vessels and com-munities in emergency situations. The Coast Guard also conducts such operations in the Great Lakes, Northeast, and Mid-Atlantic regions to facilitate critical commercial activi-ties in the maritime domain.
In 2014, for example, the service, in concert with the Cana-dian Coast Guard, sustained navigable waterways on the Great Lakes for commercial transits of more than 35 million tons of bulk cargo and over 20 million barrels of petroleum products. 10
Beyond domestic icebreaking operations, Congress has required the Coast Guard to ensure safe and secure Arctic shipping. To that end, the service operates the only U.S.-flagged heavy icebreaker capable of providing continuous access to the Arctic regions. 11 Such operations allow for year-round transit of goods and raw materials between the Arctic regions and the lower 48 states.
Further, with large commercial fisheries stocks in the Arc-tic regions, coupled with warming temperatures that may allow for greater exploration of oil, gas, and minerals, the Coast Guard’s Arctic icebreaking operations are likely to be even more critical to the health of the U.S. economy in the future. 12
About the author: Mr. Korey J. Barry has served as legislative counsel to the Coast Guard for more than two years. Prior to this position, Mr. Barry spent seven years in the private sector, where he focused on government affairs and public policy.
Endnotes:1. While Congress has opted in recent years to statutorily define the Coast Guard’s
mission set, the seeds of the organization’s role in the modern era were planted during the founding days of our republic. Indeed, the U.S. Constitution specifi-cally gave Congress the power “to define and punish Piracies and Felonies com-mitted on the high Seas, and offenses against the Law of Nations” as well as to “regulate Commerce.” U.S. Constitution, art. I, § 8.
For more information:
As this snapshot makes clear, the Coast Guard’s legal authorities extend out in a vast array of directions and are constantly undergoing change to reflect the service’s ever-changing operational realities. As such, the author recommends that readers utilize two electronic resources that are consistently updated to reflect changes in law:
1. The Office of the Law Revision Counsel, U.S. House of Representatives maintains a comprehensive list of titles contained in the United States Code. It can be found at http://uscode.house.gov/.
2. The U.S. Government Publishing Office maintains the electronic Code of Federal Regulations (e-CFR). It can be found at www.ecfr.gov.

13Summer 2016 Proceedingswww.uscg.mil/proceedings
Ocean-based economic activities support jobs across America and increase the quality of life from coast to coast. For example, offshore oil and gas production, an important ocean-based sector, provides energy for industry and transportation. Our seaports give farmers, manufacturers, and retailers access to overseas markets.
The U.S. commercial fishing workforce, while small (about 120,000 workers), is responsible for all the sea-food produced in the nation. Ocean tourism and rec-reation attracts vacationers from across the nation and around the world, stimulating the U.S. economy and promoting cultural exchange. In these and many other ways, the health of our nation’s economy is tied to the health of the oceans and Great Lakes.
Consider, for example, the labor strikes at the ports of Los Angeles and Long Beach, California, in January 2015. Just a few of the estimated impacts include:
• Twenty percent of the [nation’s] 2015 fresh fruit and veg-etable crop exports to Asia were delayed 3-4 weeks, and rice crops were delayed 8 weeks.
• The North American meat industry lost $85 million every week that its cuts of meat and poultry sat in freez-ers outside of West Coast ports.
It is estimated that the residual effects of the port strike delays will cost retailers $7 billion.
The U.S. Coastal EconomyThe coastal economy is an economic juggernaut. At almost $7 trillion in 2012, it accounted for close to half of the U.S.
national gross domestic product (GDP). The 2012 U.S. coastal economy alone was greater than the national GDP in every country of the world except for the United States ($16 tril-lion) and China ($8.5 trillion).
There is often confusion between the coastal economy and the ocean economy. 1 The coastal economy includes all eco-nomic activity that takes place along the geographic area defined as the “coast.” However, definitions of the term dif-fer. For example, the U.S. Census Bureau defines a coastal county as one close to waters classified as “coastal water” or “territorial sea.” Using this definition, there are 254 coastal counties in 23 states. The National Oceanic and Atmospheric
U.S. Ocean and Coastal Economies
Significant contribution to the national economy.
by MS. TRACY ROULEAU Deputy Chief Economist
National Oceanic and Atmospheric Administration
MR. JEFFERY ADKINS Economist
I.M. Systems Group
MS. VALERIE WERE Social Scientist
I.M. Systems Group
Overview
The coastal and ocean economies, compared to the U.S. economy (gross domes-tic product, 2012). Graphic courtesy of NOAA.

14 Proceedings Summer 2016 www.uscg.mil/proceedings
coastline. It includes activities that extract key products from the ocean, such as fishing, oil and gas exploration and production, and sand and gravel mining.
It also includes activities that drive and sup-port commerce in the ocean such as construct-ing commercial and recreational vessels and dredging navigational channels. Ocean-based tourism and recreation are also important parts of the ocean economy.
In 2012, the ocean economy accounted for 2.2 percent of the nation’s employment and 2.1 percent of the national gross domestic product. There were 147,000 businesses that employed 3 million people who were paid more Graphic courtesy of NOAA.
Administration (NOAA) defines coastal counties as those that have a coastline bordering the open ocean or contain coastal high hazard areas that the Federal Emergency Management Agency identifies as a special flood hazard area. Using NOAA’s definition, there are 400 coastal counties in 30 states.
Although the ocean economy is most directly affected by ocean management decisions, the coastal economy warrants special consideration for at least two reasons: its enormity and its vulnerability to coastal storms, tsu-namis, and other ocean-based hazards.
The U.S. Ocean EconomyThe nation’s ocean economy is also huge, employing more people than home construction and crop produc-tion combined. As expected, much of the ocean econ-omy is concentrated in the counties along the nation’s
The relative size of the ocean economy. Graphic courtesy of NOAA.
Economics: National Ocean Watch Data Center Sources
Employment
Wages
Number of business establishments
Bureau of Labor Statistics, Quarterly Census of
Employment and Wages
Gross domestic product Bureau of Economic Analysis, Gross Domestic Product by
State
Employment
Wages
Self-employed workers
Gross receipts for self-employed workers
Bureau of the Census, Nonemployer Statistics,
Zip Code Business Patterns
than $113 billion and produced $343 billion in goods and services.
Figures on the number of business establishments, the num-ber of people employed, annual wages, and gross domestic product are all used to measure the ocean economy. NOAA’s Economics: National Ocean Watch (ENOW) information has been available at the county, state, regional, and national level on an annual basis since 2005 and includes statistics for the six ocean-based sectors that make up the ocean economy:
• living resources, • marine construction, • ship and boat building, • marine transportation, • offshore mineral extraction, and • tourism and recreation.

15Summer 2016 Proceedingswww.uscg.mil/proceedings
The living resources sector includes commercial fishing, aquaculture, fish processing, and seafood marketing. Employing just under 62,000 people, this sector also pro-vides jobs for another 56,000 self-employed workers—the largest number of any of the ocean sectors. Like tourism and recreation, this sector is highly seasonal. Although it constitutes only 2 percent of the ocean economy — whether measured in terms of employment, wages, or gross domestic product — it is important to remember that it accounts for all of the seafood produced in the United States.
Marine construction and ship and boat building are relatively small sectors, but pay high wages per employee — an aver-age of $60,000 per year. Marine transporta-tion accounts for 14 percent of the employ-ment and 26 percent of the ocean economy wages, as annual wages per employee also tend to be high in this sector.
The offshore mineral extraction sector, dom-inated by the oil and gas industry, accounts for almost half the gross domestic product in the U.S. ocean economy. Employment in this capital-intensive industry accounts for only 5.5 percent of the ocean economy total. However, this sector accounts for 20 per-cent of total ocean economy wages, with employees making an average of $143,000 per year.
At the national level, employment in the ocean economy is dominated by the tour-ism and recreation sector (71 percent). Wages per employee average about $22,000 annually. This is partially because the sec-tor includes a number of seasonal and part-time jobs, like those at beachfront hotels and restaurants.
The importance of each sector varies greatly from place to place. The living resources sector is concentrated in Alaska, the Gulf of Mexico, and the Northeast. Offshore mineral extraction is concentrated in the Gulf of Mexico and is almost completely absent on the Atlantic coast and in the Great Lakes. 2 Tourism and recreation has a significant pres-ence in all U.S. regions.
Because of its importance to the national economy, NOAA and the Bureau of Economic Analysis are working together to continue improving our understanding of the ocean economy. The two agencies are working to create the Ocean Economy Satellite Account to quantify more fully the
relationship between the ocean economy and the national economy as a whole.
Links between the Ocean and Inland EconomiesCalifornia provides several examples of links between the ocean and national economies. A 2015 study focused on California shows that its ocean economy, valued at $44.8 bil-lion, was the largest among U.S. states, according to data from 2012. That state alone accounted for 13 percent of the business establishments, 17 percent of the employment and
wages, and 12 percent of the national ocean economy. Three sectors — tourism and recreation, marine transportation, and offshore mineral extraction — accounted for most of California’s ocean economy GDP.
The tourism and recreation sector in California boosts the U.S. economy, attracting national and international visitors. In 2014, approximately 23.2 million people visited California from other parts of the United States, and 4.6 million out of a total of 30 million overseas visitors to the U.S. listed Cali-fornia as their primary destination. These visitors buy food and souvenirs, pay entrance fees to parks and attractions, and stay in hotels. California’s hotel industry links the ocean and inland economies through procurement contracts with
Graphic courtesy of NOAA.

16 Proceedings Summer 2016 www.uscg.mil/proceedings
Bibliography:National Oceanic and Atmospheric Administration (NOAA) Office of Program Planning and Integration, “The Ocean and Coast Economy,” 2015. World Bank Country gross domestic product data available at http://data.world-bank.org/indicator/NY.GDP.MKTP.CD?order=wbapi_data_value_2012+wbapi_data_value&sort=desc.NOAA, “The Oceans and Coasts — A Driver for Inland Economic Activity,” 2015, available at http://noaa.maps.arcgis.com/apps/MapJournal/?appid=639339405df9482ea2a907038fa75eb0.Economics: National Ocean Watch information is available at https://coast.noaa.gov/digitalcoast/tools/enow.NOAA Office for Coastal Management, “NOAA Report on the U.S. Ocean and Great Lakes Economy,” 2015, available at http://coast.noaa.gov/digitalcoast/publications/econreport.Elementum News Desk, “The Real Cost Of The West Coast Port Strike Pt. 1,” 2015, available at http://news.elementum.com/the-real-cost-of-the-west-coast-port-strike-pt.-1.Dean Runyan Associates, California Air Traffic Analysis, accessed November 22, 2015 at www.deanrunyan.com/CAAirTraffic/AirTraffic.html.Eastern Research Group, Inc., for the NOAA Office for Coastal Management, “The National Significance of California’s Ocean Economy,” 2015, available at https://coast.noaa.gov/data/docs/digitalcoast/ca-ocean-economy.pdf.
Endnotes:1. The ocean economy includes the activities in the states adjacent to the Great Lakes.2. It is important to note that this sector also includes offshore sand and gravel min-
ing, accounting for all of this sector’s activity in some regions.
companies that supply hotels with everything from artwork to water coolers. As many procurement companies feature nationwide distribution centers, this supports inland econo-mies by creating jobs for people living near a center, and some goods that the hotel industry needs are niche goods that come from companies that are based inland.
Ports provide entry and exit points for the inland U.S. econ-omy to receive foreign goods and ship goods internationally. In 2012, the estimated value of foreign imports from the rest of the country through California ports totaled $331 bil-lion, and the value of state foreign exports was $99.2 billion. Some imported products, such as car parts or chemicals for plastic production, support manufacturing jobs and allow for the production of goods that can then become exports themselves. Finished goods that the U.S. imports support retail jobs.
Commodity-level imports and exports are another way to link the ocean and inland economies. Electronics ($60.4 bil-lion), motorized vehicles ($50.8 billion), and textiles and leather ($49 billion) were the top three commodities exported through California ports. The top three commodity imports were waste and scrap ($15.8 billion), machinery ($11.6 bil-lion), and other agricultural products ($9.2 billion). These statistics also demonstrate how California’s ports support key U.S. industries.
Looking AheadThe coastal economy is large and contributes significantly to the national economy. As a subset of the coastal econ-omy, the ocean economy is therefore also important to the national economy.
Although we know a lot about the ocean economy, there is a lot more to learn that will enhance the data we have currently. Through the Ocean Economy Satellite Account, NOAA and the Bureau of Economic Analysis hope to develop a more complete understanding, in numbers, of the connections between the national economy and the ocean economy.
About the authors:Ms. Tracy Rouleau is NOAA’s deputy chief economist in the Office of Pro-gram Planning and Integration, which is the nexus where social science is powered, coordinated, and catalyzed across NOAA.
Mr. Jeffery Adkins is an economist with I.M. Systems Group, supporting NOAA. Jeff is the lead economist for NOAA’s Economics: National Ocean Watch data that provides time-series data for six economic sectors that depend upon the oceans and Great Lakes.
Ms. Valerie Were is a social scientist with I.M. Systems Group, supporting NOAA in the Office of Program Planning and Integration. She works on a variety of projects that integrate social science across NOAA’s line offices.
For more information:
Statistics courtesy of the National Oceanic and Atmospheric Administration.
From daily weather forecasts, severe storm warnings, and climate monitoring to fisheries management, coastal restoration, and supporting marine commerce, NOAA’s products and services support economic vitality and affect more than one-third of America’s gross domestic product.
NOAA’s dedicated scientists use cutting-edge research and high-tech instrumentation to provide citizens, planners, emergency managers, and other decision makers with the reliable information they need when they need it.
For more information, visit www.noaa.gov.

17Summer 2016 Proceedingswww.uscg.mil/proceedings
Coast Guard AuthorityFollowing this incident, the NTSB recommended expanding the authority of the U.S. Coast Guard over vessel traffic in the ports. The contemporary Harbor Advisory Radar system was a voluntary system, and the Oregon Standard was not maintaining its connection at the time of the collision. More-over, the system had proved inadequate, as it prohibited U.S. Coast Guard operators from directing vessels.
Subsequently, Congress enacted the Ports & Waterways Safety Act of 1972, which mandated that vessel traffic ser-vices (VTS) facilitate maritime transportation and guard the marine environment. San Francisco Bay was the site of the first VTS.
Also in the early 1970s, the Bridge to Bridge Radiotelephone Act set up mandatory radio channels for communication between ships and for hailing and distress signals. The act applies to power-driven vessels of 20 meters or more, as well as vessels of 20 gross tons or more.
After the 1978 grounding of the SS Argo Merchant southeast of Nantucket Island, Massachusetts, the U.S. Coast Guard increased its supervision of vessel traffic. The Port & Tanker Safety Act of 1978 amended the 1972 law and gave the U.S. Coast Guard expanded authority over U.S. waterways.
LegislationIn March of 1989, the oil tanker Exxon Valdez hit Bligh Reef in Alaska’s Prince William Sound, spilling approximately
The U.S. Coast Guard and the Waterways
A history of the vessel traffic service.
by MR. DAVE ROSEN Pacific Area Historian
U.S. Coast Guard
Overview
In 1971, two fully laden tankers, the Arizona Standard and the Oregon Standard, collided in dense fog at the entrance to San Francisco Bay, totally shutting down the Port of San Francisco. According to the National Transportation Safety Board (NTSB), those operating the vessels failed to correctly utilize their VHF radios and radarscopes. Further, both vessels were underway at immoderate speed for the foggy conditions, and both operators failed to keep each ship to its own side of the channel.
Before the Arizona Standard made its pass under the bridge, its crew sighted a red navigation light on the starboard bow of the Oregon Standard, which was only about 200 yards away. The master ordered a hard-left rudder and to stop all engines — but it was too late. The bow of the Arizona Standard penetrated the port side of the Oregon Standard.
As the two vessels became locked together and drifted under the bridge back into the bay, 800,000 gallons of fuel spilled into the water, fouling beaches up to 20 miles north at Kellam Bay and 25 miles south at Half Moon Bay. Hundreds of volunteers aided Standard Oil as well as federal, state, and local agencies in cleaning up the waterways.
The Oregon Standard (top) and the Arizona Standard after the incident. U.S. Coast Guard photos.

18 Proceedings Summer 2016 www.uscg.mil/proceedings
the pilot’s course, the vessel alided along its port side with the bridge’s fender system three minutes later. The Cosco Busan suffered a 100-foot by 12-foot gash, cutting into two fuel tanks and spilling up to 58,000 gallons of oil.
The Incident Specific Preparedness Review of January 2008 found the pilot guilty of navigating at a high, unsafe speed in near-zero visibility and failing to monitor the vessel’s position and progress. It faulted the master of the Cosco Busan for not monitoring the pilot’s actions, and both for failing to communicate with each other. 1
Endnote:1. The Senate passed a bill, but it was not enacted into law. One provision of the
bill requiring VTS communication to identify the vessel, and not the pilot, was incorporated in CG VTS policy.The summary below was written by the Congressional Research Service, which is a nonpartisan division of the Library of Congress.:
9/29/2010--Passed Senate amended. Oil Spill Prevention Act of 2010 – (Sec. 2) Requires double hull protection of oil fuel tanks on certain vessels with a tank capacity of at least 600 cubic meters. Defines “oil fuel” as any oil used as fuel in connection with the vessel’s propulsion and auxiliary machinery.(Sec. 3) Directs the Secretary of the department in which the Coast Guard is operating to: (1) provide guidance to all vessel traffic personnel that clearly defines the use of authority to direct or control vessel movement when such direction or control is justified in the interest of safety; and(2) require vessel traffic personnel communications to identify the vessel, rather than the pilot, when vessels are operating in vessel traffic service pilotage areas.Requires the Secretary to identify, and report to Congress concerning, requirements for the necessary expansion, improvement, or construction of buildings, networks, communications, or other infrastructure to improve the effectiveness of existing vessel traffic service systems, or necessary to support recommended new vessel traffic service systems, including all necessary costs for construction, reconstruction, expansion, or improvement.Requires a review and validation of the recruiting, retention, training, and expansion of vessel traffic service personnel.(Sec. 4) Requires that at least one trained and experienced pollution investigator be on duty or on call at all times for each Coast Guard Sector Command.(Sec. 5) Modifies requirements regarding the duration of merchant mariner’s documents and certificates of registry.(Sec. 6) Authorizes the extending of licenses, certificates of registry, and merchant mariner’s documents in specified circumstances. Terminates that authorization on December 31, 2011.(Sec. 7) Limits to one the number of reports regarding port security terrorism exercises that the Coast Guard is required to submit each year to the House of Representatives Committee on Appropriations.(Sec. 8) Requires that compliance with the Statutory Pay-As-You-Go Act of 2010 be determined by reference to the latest statement titled “Budgetary Effects of PAYGO Legislation” for this Act.
Bibliography:Marine casualty report Collision Involving the SS Arizona Standard and the SS Oregon Standard at the Entrance to San Francisco Bay on January 18, 1971, USCG Marine Board of Investigation, August 1971.USCG Vessel Traffic Service San Francisco User’s Manual, March 2004.Puget Sound VTS User’s Manual, 2013.Vessel Traffic Service Houston/Galveston: A Brief History, March 2014.Robert M. Browning Jr., Captains of the Port, undated.DHS Navigation Center website.Ports, Waterways & Coastal Security, Office of Counterterrorism & Defense Opera-tions Policy (CG-DOD), October 2015.Special thanks to Alan Tubbs, John Dittmar, Mike van Houten, and CAPT Lane Johnson of the United States Coast Guard.
About the author: Mr. Dave Rosen is the Pacific Area historian for the U.S. Coast Guard. He completed a Ph.D. in history at the University of Wisconsin and has been an instructor at the University of California and the University of San Fran-cisco, as well as an assistant professor at Ohio State and the University of Minnesota. He assisted in modernization programs at Travis AFB, McClel-lan AFB, Naval Air in Alameda, and Mare Island. He has also worked as a consultant in international business in Germany, France, and Holland, and speaks several languages.
10.8 million gallons of oil. Within 10 days, 1,000 square miles extending 100 miles south of Valdez into the Gulf of Alaska were soaked with oil.
As a result of this calamity, Congress passed the Oil Pol-lution Act of 1990. The act addressed maritime commu-nications, radar surveillance, vessel tracking, tank hulls, and mandated that a vessel movement reporting system be used to monitor and track vessel movements. Finally, the U.S. Coast Guard’s Aids to Navigation and VTS units were beefed up, and VTS became mandatory.
In the 1997 appropriations bill, Congress directed the U.S. Coast Guard to review private/public partnership opportu-nities in VTS operations. As a result, the U.S. Coast Guard established the Ports and Waterways Safety System to address waterway user needs and emphasize partnerships with industry to reduce risk in the marine environment.
The Coast Guard also convened a national dialogue group comprised of maritime and waterway community stake-holders to identify the needs of waterway users with respect to vessel traffic management and VTS systems.
After the terrorist attacks of September 11, 2001, the Mari-time Transportation Security Act of 2002 amended the Ports and Waterways Safety Act to include port and waterway security. The act required vessels and waterfront facilities to maintain certain security practices and plans, which would be subjected to security inspections. The act also accelerated the phase-in period for Automatic Identification Systems carriage requirements.
In November of 2007, the M/V Cosco Busan departed San Francisco’s Pier 56 in a dense fog heading out to sea, intending to pass under the Delta Echo span of the San Francisco/Oak-land Bay Bridge. When the vessel traffic service questioned
U.S. Coast Guard graphic.

19Summer 2016 Proceedingswww.uscg.mil/proceedings
Storytelling is one of the oldest human traditions. Historically, cultures passed on their stories and traditions via oral storytelling. With the invention of the printing press, the way we communicated our stories evolved. In the last decade, we have seen the rise of social media and the death of the tradi-tional news cycle. Storytelling has become a science as well as an art.
As far as the Coast Guard is concerned, we can cre-ate a documentary featuring an icebreaker that was commissioned in 1999 — the U.S. Coast Guard Cut-ter (USCGC) Healy — as a platform to conduct sci-ence experiments in the Arctic. Or personnel may write an article on ships like the former naval ves-sel, the USCGC Alex Haley (homeported in Kodiak, Alaska), to give a glimpse into the operational exe-cution of the Commandant’s Arctic Strategy. This is all a part of telling the Coast Guard story to the people served by the nation’s oldest continuous seagoing service.
Behind the ScenesWhat the audience doesn’t see is the amount of coordination and effort it takes to make sure that that story gets to the TV, computer, or glossy magazine. For example, when we
brainstormed about how to get the word out about Arctic Shield 2015, during which the U.S. Coast Guard deployed cutters, aircraft, and personnel to the Bering Strait; Dead-horse, Alaska; and the northern Alaska outer continental shelf; we began planning more than eight months out.
Just within the U.S. Coast Guard, the communications coor-dination included public affairs offices in Pacific Area Com-mand and headquarters, then expanded to include other districts as various offices deployed specialists in support of the effort. We also coordinated with a number of other agencies and applied a wealth of technical expertise to make sure we gathered the needed information and disseminated it quickly. This involved deploying numerous public affairs specialists to various cutters as well as to remote locations to gather the information for multiple Facebook posts, tweets, videos, and blog posts.
Storytelling from the Last Frontier
Communications in the Arctic.
by LT ANASTACIA VISNESKI Former Digital Media Officer
U.S. Coast Guard
Overview
“The growth of human activity in the Arctic region will require highly engaged steward-ship to maintain the open seas necessary for global commerce and scientific research, allow for search and rescue activities, and provide for regional peace and stability.”
— President Barack Obama
The Coast Guard Cutter Healy conducts science operations in the southern Arctic Ocean while the aurora borealis shimmers across the sky. U.S. Coast Guard photo by Petty Officer Cory J. Mendenhall.

20 Proceedings Summer 2016 www.uscg.mil/proceedings
ensure that the public was informed about what operations were underway, and that everyone clearly communicated what impact the operations would possibly have.
The StoryDuring Arctic Shield 2015, the Coast Guard worked to enhance Arctic maritime domain awareness, broaden partnerships, and improve preparedness, prevention, and response capabilities. The U.S. Coast Guard public affairs involvement was critical for making sure that the public was kept informed of all of these missions in a timely and engaging fashion.
By the time the USCGC Healy departed from Seattle head-ing for the Arctic in the spring of 2015, there were already plans in place to have multiple media outlets embed aboard her. A U.S. Coast Guard public affairs officer was sent on temporary orders to assist the command during the media embeds and to ensure that the media was able to get and transmit the information they needed.
Of course, this is easier said than done. Before you can get the story out, especially from such a remote location with so many agencies involved, you have to have a plan. For this oper-ation, the communications action plan detailed timelines, communications tools, key messages, and the various agencies’ responsibilities. We created guidance documents that discussed current policy, concerns, environmental issues, and emergency planning. From there, the team made sure that personnel were sent to the right place to help with the outreach efforts, that everyone involved coordinated messaging to
Evolving CommunicationsPre-EmailBack in the 1980s and 1990s, getting a story from a U.S. Coast Guard icebreaker could take months, as public a�airs specialists needed to mail �lm or video. Even after email become more prevalent, once you were north or south of certain latitudes, the coverage became thin.
The less coverage available, the harder it was to get imagery o� the ship, and imagery was (and still is) an integral part of showing the U.S. Coast Guard missions to the public.
Modern Media ChallengesNow, even with satellite coverage, when a cutter enters the Arctic, we must make accommodations to get the information o� the vessel fast enough to keep up with a modern, 24-hour, social media-integrated news cycle.
This includes compressing image sizes to make the data packet small enough to email o� the ship and waiting for the best signal to send video back to the waiting public a�airs o�ces on land.
Arctic Shield 2015 SupportDuring Arctic Shield 2015, e�orts to communicate from the far north included one television station doing a live feed from the USCGC Healy using a special satellite uplink that allowed the station to show real-time shots from the icebreaker. We also conducted interviews on the Healy via Skype with other media when their satel-lite capacity allowed.
Further, we were able to provide Arctic Shield 2015 images to Admiral Zukunft’s sta�, who used them in a presentation just days after they were taken. Just one generation ago, this type of image would have taken weeks or months to make its way to Washington, DC.
Scientists aboard Coast Guard Cutter Healy collect ice cores and other data on an ice floe in the Arctic Ocean. U.S. Coast Guard photo by Petty Officer Cory J. Mendenhall.
The Coast Guard Cutter Healy breaks through ice near the Arctic Circle. U.S. Coast Guard photo.

21Summer 2016 Proceedingswww.uscg.mil/proceedings
There was also a plan to have a U.S. Coast Guard public affairs specialist aboard the icebreaker for a more than 60-day, solo journey to the North Pole. The coverage of the USCGC Healy turned out to be well-timed, as the president announced, during a tour of Alaska, that the nation needed new icebreakers.
The StorytellersThe U.S. Coast Guard public affairs effort further supported the Commandant’s Arctic Strategy and demonstrated to an audience of millions the importance of the U.S. Coast Guard’s efforts in the Arctic. Millions were able to see and hear how important the work was via images, videos, blog posts, articles, and tweets.
U.S. Coast Guard public affairs specialists also deployed to the forward operating bases for Arctic Shield support in locations like Dead Horse, Alaska. There, they captured video of training exercises and daily operations and quickly uploaded the information to the Defense Video and Imagery Distribution System (DVIDS). This allowed various public affairs specialists throughout the U.S. Coast Guard to take the images and information and pass it along to their audi-ences within 24 hours of an event.
The Take-AwayAll of this is important for one reason — visibility for U.S. Coast Guard missions means that the public is informed about the U.S. Coast Guard’s activities and impact on the nation. The U.S. Coast Guard’s public affairs coverage of Arctic Shield 2015 is just one example of the enormous role that the media plays in connecting the often unseen water-ways efforts to United States citizens.
An informed public can make informed decisions, from the budget for a new fleet of icebreakers to their own safety on the water.
About the author: LT Anastacia Visneski most recently served as the Coast Guard’s digital media officer. A third-generation Coast Guardsman, she is a graduate of the University of Washington communications leadership program with a master of communication in digital media and a master of communica-tion in communities and networks. She served more than 11 years in the Coast Guard, with service as a public information officer during Hurricane Katrina and the Deepwater Horizon oil spill. During the summer of 2015, she served as the public affairs officer for Arctic Shield 2015.
The Story Within the Story: We Do What We Can With What We Have
With less and less ice in the Arctic, new trade routes are opening, more vessels ply Arctic waters, and many are looking northward to the vast natural resources that are becoming ever more accessible.
By showing the USCGC Healy’s mission specifically focused on the science conducted aboard, then showing the activities of the USCGC Alex Haley, the USCGC Waesche, and the U.S. Coast Guard units in Alaska, U.S. Coast Guard public a�airs was able to show the public that the service already has a presence there, but that the service is spread too thin to cover the region.
The USCGC Alex HaleyFor example, the Alex Haley, like far too many Coast Guard vessels in its history, is a hand-me-down ship. It was a former Navy vessel originally commissioned in 1971 and handed down to the Coast Guard in 1999.
The USCGC Healy, commissioned in 1999, was purpose-built as a medium
icebreaker for the Coast Guard and the National Science Foundation, joining heavy icebreakers Polar Star (commis-sioned in 1976) and Polar Sea (commis-sioned in 1977). So, in November 2016, Healy will be 17 years old. At 40 and 39, respectively, Polar Star and Polar Sea have outlasted their expected useful lives. In fact, Polar Sea is currently in “inactive” commission.
We Need MoreSo, while public a�airs specialists work to report the news that happens aboard our vessels and other platforms, we must also support the Coast Guard in its e�orts to secure the resources neces-sary to continue Coast Guard missions in the Arctic and around the world.
“As the U.S. Coast Guard cutter Polar Star breaks into McMurdo, if they have a main console failure, if they have a crankcase explosion and now they’re beset in ice, I don’t have a buddy system …” — Admiral Paul Zukunft
U.S. Coast Guard Commandant

22 Proceedings Summer 2016 www.uscg.mil/proceedings
Image courtesy of America’s Marine Highway Program.

23Summer 2016 Proceedingswww.uscg.mil/proceedings

24 Proceedings Summer 2016 www.uscg.mil/proceedings
provides 375,000 jobs to the region. It is the nation’s leading coal exporter and facilitates the safe transport of millions of intermodal shipping containers. Virginia is the third-highest producing state (behind Alaska and Louisiana) for fisheries by volume and houses the largest manufacturer of fish oil and fishmeal in North America. To add to an already robust area of responsibility, the partners also ensure the safety of more than 250,000 registered recreational vessels.
Like a well-oiled ship engine is powered by myriad com-ponents, America’s waterways are fueled by effective inter-agency collaboration. This is the basis for the relationship forged between U.S. Coast Guard Sector Hampton Roads and the Port of Virginia. The Virginia Port Authority, U.S. Navy, U.S. Coast Guard, U.S. Army Corps of Engineers, National Oceanic and Atmospheric Administration, Vir-
ginia Maritime Association, Customs and Border Pro-tection, and numerous state and local agencies all share a common purpose: to promote the strength, readiness, safety, and security of this crucial piece of the Eastern Seaboard. This is highlighted through joint efforts in four areas of concentration: search and rescue, incident management, maritime security, and vessel safety.
Search and RescueMore than 200 first responders and support staff from federal, state, and local agencies covering three states converge in Hampton, Virginia, every year for a Port of Virginia and U.S. Coast Guard-hosted search and rescue forum. The forum spans five days and includes joint training that emphasizes interoperability, including everything from the first contact in a dispatch center, to nighttime search patterns, to cold water survival. The week’s training also incorporates maritime law enforce-ment and includes training specifically tailored to these
The Sector Hampton Roads area of responsibility encom-passes the Atlantic Coast from the Virginia/Maryland bor-der to the Virginia/North Carolina border. It also includes all navigable waters including the Chesapeake Bay; the Eliz-abeth, James, and Rappahannock Rivers; the intracoastal waterway; and several inland lakes. It is a complex arrange-ment of missions and waterway users, with some of the deepest natural shipping channels on the East Coast. Not only is it home to the largest U.S. naval base in the world, the area also encompasses a rapidly growing infrastructure that supports all aspects of the Department of Defense.
The Port of Virginia, which is mainly situated in the cities of Newport News, Norfolk, Portsmouth, and Chesapeake, Virginia, is the third-largest port on the East Coast based on tonnage, generates $165 million a day in commerce, and
Sector Hampton Roads VirginiaStrength and readiness through collaboration.
by LT KAREN LEE Sector Hampton Roads
U.S. Coast Guard
LT ASHLEY DUFRESNE Sector Hampton Roads
U.S. Coast Guard
MR. TREY CLIFTON U.S. Coast Guard Auxiliary
Regions
First responders and support staff representing federal, state, and local agencies from Virginia, Maryland, and North Carolina converge in Hampton, Virginia, for an annual search and rescue forum. U.S. Coast Guard photo by Auxiliarist Trey Clifton.

25Summer 2016 Proceedingswww.uscg.mil/proceedings
tasks, from boarding and searching to demonstrations of drug and radioactive material-detecting equipment.
This collaborative training provides many benefits, includ-ing identifying challenges, building professional working relationships, and learning best practices. Mr. Bryan Miers, a participant from the Henrico County Fire Department, citing Richmond’s geographic distance from the rest of the
exercise simulating a worst-case discharge of fuel oil in the vicinity of U.S. Coast Guard Base Portsmouth and the Craney Island Fuel Depot on the Elizabeth River.
The exercise required participants to conduct the operations necessary in an emergency oil spill response, including cre-ating a unified command; establishing the incident plan; creating finance, logistics, and public information compo-nents; and generating oil recovery strategies. This allowed participants to improve preparedness; identify weaknesses and strengths; assess the adequacy of resources, plans, and policies to support the pollution response mission; and share best practices.
Planning for this exercise required a joint effort among U.S. Coast Guard, U.S. Navy, and Virginia Department of Envi-ronmental Quality personnel for more than a year. Accord-ing to LT Ashley Dufresne, contingency planner and pub-lic affairs officer for USCG Sector Hampton Roads, “The exercise was a great opportunity to work with other agen-cies within the port of Hampton Roads to test our ability to respond to incidents.”
Maritime SecurityThe Virginia Area Maritime Security Committee (VA AMSC) was established on October 23, 2003. Since that time, it has grown to comprise members from more than 20 state and federal agencies, including the U.S. Coast Guard, Federal Bureau of Investigation, U.S. Navy, Virginia Department of Public Safety, and numerous others. The committee’s main focus is to enhance maritime homeland security in the U.S. Coast Guard captain of the port area of responsibility, which includes developing and coordinating a comprehensive area strategy to minimize the threat of a transportation security incident and respond to any security incidents.
The national towing vessel seminar features a search and rescue demonstration and the annual Tug Boatman’s Challenge, where local mariners compete in practical skills and industry exercises. U.S. Coast Guard photos by Auxiliarist Trey Clifton.
“Following the search and rescue forum, first responders in the Port of Virginia and the surrounding region will be better pre-pared to collaboratively conduct search and rescue, pollution response, and law enforcement operations.”
— Rear Admiral Stephen Metruck, commander, Coast Guard Fifth District
port, noted, “We wouldn’t know each other’s capabilities without this training.”
Incident ManagementIn 2015, the Coast Guard and other federal, state, and local agencies participated in a two-day, government-led, full-scale exercise to evaluate the capabilities and effectiveness of the U.S. Coast Guard Sector Hampton Roads Area Con-tingency Plan.
Coast Guard Sector Hampton Roads, along with Naval Sta-tion Norfolk, the Virginia Department of Environmental Quality, the Hampton Roads Incident Management Team, the Virginia Port Authority, and others participated in the

26 Proceedings Summer 2016 www.uscg.mil/proceedings
responders and allow them to safely identify radio-active material.
According to Mr. Roger Tomlinson, Port Security Specialist for Sector Hampton Roads, “The mindset that we have here at Sector Hampton Roads, due to our collaborative spirit and mutual recognition, has made us a very forward-leaning port. This is just one example of what we have been able to accom-plish.”
The VA AMSC doesn’t just fight terrorism; it con-tinually looks over the horizon to stay proactive in addressing port growth, as the Panama Canal expansion will allow deeper and wider ships to transit from Eastern Asia through the United States and Europe. With its naturally occurring deep approaches, the Port of Virginia will be a major player in canal-related trade. However, with larger ships becoming the norm, we must work together
to balance the needs of the world’s largest naval fleet with the economic needs of the commercial shipping industry.
With the growing number of possible security threats on Virginia’s waterways, the VA AMSC has correspondingly expanded its mission. The executive committee has char-tered eight mission-specific subcommittees:
• lower Chesapeake Bay users, • port readiness,• marine transportation system planning, • law enforcement, • port risk assessment, • recreational vessels,• cybersecurity, • radio nuclear threats.
The last two subcommittees were added in 2015 to focus the AMSC on such threats, collectively enhance waterway safety and security, identify threats, and ensure the most efficient and effective preventive, mitigation, and response measures.
For example, the radio nuclear threat subcom-mittee has acquired more than $500,000 in radio nuclear detection equipment from the Department of Homeland Security to be strategically distributed to local law enforcement within the Port of Hampton Roads. This initiative will dramatically minimize transit time for
Oil skimmers simulate the response to an oil spill in a joint training exercise with partici-pants from multiple agencies. U.S. Coast Guard photo by Petty Officer Joshua Canup.
First responders, Coast Guard Station Little Creek personnel, and Virginia Beach EMS personnel practice search and rescue techniques at the annual search and rescue forum in Hampton, Virginia. U.S. Coast Guard photo by Auxiliarist Trey Clifton.
“A strong interagency approach is required to meet the challenges ahead.”— CAPT Rick Wester, deputy sector commander,
Coast Guard Sector Hampton Roads
Vessel SafetyThe first towing vessel seminar at Sector Hampton Roads took place more than 15 years ago. Ever since that first semi-nar, Coast Guard and Virginia Maritime Association (VMA) personnel have co-hosted the annual national Towing Ves-sel Safety Seminar, providing training for towing vessel crewmembers from the Port of Virginia and beyond.

27Summer 2016 Proceedingswww.uscg.mil/proceedings
“The Towing Vessel Safety Seminar provides valuable train-ing for the local maritime community,” said CAPT Christo-pher Keane, commander of Coast Guard Sector Hampton Roads. “It also provides a venue to discuss the latest policies and trends impacting local industry.”
Topics for the 2015 seminar included casualty training, a safety management review, electronic charting, a mariner credential program update, and demonstrations of lifesav-ing equipment. The seminar also focused on the upcoming regulations applicable to the towing vessel fleet, commonly referred to as “Subchapter M,” since some vessels in this fleet will be regulated under 46 CFR Subchapter M.
The event also included a Coast Guard helicopter crew search and rescue demonstration. Seminar participants were able to experience the vessel-to-helicopter transfer like never before as communications were broadcast to those on shore. The seminar also included practical evolutions and the annual Tug Boatman’s Challenge, where local mariners competed in practical skills and industry exercises.
hazardous situations. Their employers and our port indus-try are beneficiaries. More importantly, this training helps ensure the health and well-being of these crewmembers.”
No Weak LinksOver the next several years, the Coast Guard must confront complex challenges on America’s waterways. We must simultaneously continue to cultivate interagency partner-ships to answer those challenges. Mr. Brian Vahey, Ameri-can Waterways Operators Senior Manager Atlantic Region, summarized, “Our waterways are only as safe as our weak-est link.”
Men and women from all branches of public safety and the maritime industry come together at every opportunity and work to make the Port of Virginia and mid-Atlantic region a safer place, ensuring that the engine that is America’s water-ways works effectively and efficiently.
About the authors:LT Karen Lee has served in the U.S. Coast Guard for 10 years in capacities in the prevention and response fields, most notably as a marine inspector at Sector Hampton Roads. She has received two achievement medals, a Com-mandant’s letter of commendation, a meritorious unit commendation, and a meritorious team commendation.
LT Ashley Dufresne has served in the U.S. Coast Guard for seven years as a deck watch officer on the Coast Guard cutter Alex Haley, a command duty officer at U.S. Coast Guard District One Command Center, and as a contin-gency planner at Sector Hampton Roads. She has received an achievement medal and five meritorious unit commendations.
Mr. Trey Clifton is a member of the U.S. Coast Guard Auxiliary and has worked for the Fifth Coast Guard District’s external affairs office since July of 2014. Additionally, he serves on the Public Affairs Directorate of the Coast Guard Auxiliary national staff. He joined the Coast Guard Auxiliary in 2010, and is currently the flotilla commander for Flotilla 054-05-03 in Chesapeake, Virginia.
“Service to our nation requires that we safeguard America’s security and pros-perity by maintaining and building the capabilities, capacities, and cooperative relationships that we use to accomplish our missions.”
— Admiral Paul F. Zukunft, Commandant U.S. Coast Guard
“For 16 years the VMA and the Coast Guard have been partners in delivering vital safety and survival training to the tug and barge crews moving goods and assisting ships in Virginia’s ports,” said Mr. Art Moye, Virginia Maritime Association executive vice president. “Each year, participat-ing mariners leave the Towing Vessel Safety Seminar bet-ter equipped to safely perform their work and respond to
For more information:
All stats courtesy of the Virginia Maritime Association.
For more information, visit the website: www.vamaritime.com.

28 Proceedings Summer 2016 www.uscg.mil/proceedings
These areas form a continuum, each item feeding into the other, that we manage on a daily basis.
Strategic PlanningHow do we ensure the port is meeting the needs of today and building for the future? By accounting for a long list of items, including sustainability, infrastructure needs, and changes in trade patterns.
On a hot Monday afternoon in June 2015, the port’s future got a boost. Two signatures on a feasibility coast-share agree-ment — those of John F. Reinhart, the port’s chief executive officer and executive director; and Colonel Paul B. Olsen, Norfolk District Engineer for the U.S. Army Corps of Engi-neers — started the clock on a three-year process to evaluate the economics of dredging the port’s channels to a depth of more than 50 feet. Deeper water and overall expansion of the port’s capacity and cargo handling capability put the Port of Virginia in the position to market to the rest of the world the deepest channels and the most modern terminals on the East Coast.
During the next decade, the port will require at least $2 bil-lion to add capacity to its terminals, modernize them, remain competitive, and prepare for the future. We are ever mindful of what must be done on a day-to-day basis to serve our customers, but in order to stay competitive and serve as an economic engine for years to come, we must always look to the future.
There are three large projects in the port’s future:
• targeted redevelopment at Norfolk International Termi-nals (NIT);
• expansion at Virginia International Gateway (VIG); and • the continued eastward expansion of Craney Island,
which will make way to develop Craney Island Marine Terminal.
Each project adds to the port’s capacity, increases its ability to safely handle the biggest ships in the Atlantic trade, and
Everyone is familiar with modern shipping containers. For more than 50 years, the ever-present 20-foot and 40-foot boxes have become a part of our lives. Ships carrying thou-sands of these containers transport cargo across the oceans, trucks carry them to and from distribution centers via the highway system, and railroads carry containers along rail lines into the heartland of our country.
These ubiquitous boxes hold the lifeblood of our economy. Businesses use containers to bring in or ship out goods. Businesses employ people. People buy things from stores stocked with items shipped in containers … and so the cycle continues.
That brings us to ports (including the Port of Virginia), which are at the center of it all. A 2013 College of William & Mary economic impact study found that more than 374,000 jobs in Virginia — nearly 10 percent of Virginia’s workforce — have ties to this port, which is mainly situated in the cities of Newport News, Norfolk, Portsmouth, and Chesapeake, Vir-ginia. Additionally, more than $60 billion is spent on port-related goods and services. 1
At the Port of Virginia, we consider ourselves the stewards of tomorrow, which means:
• Ocean carriers rely on us to handle their vessels with efficiency.
• Cargo owners count on us to safely and expeditiously move their goods to and from market.
• Motor carriers depend on us for quick, consistent ser-vice delivery.
• Taxpayers want and deserve a port that’s a catalyst for job creation and economic development while staying mindful of precious environmental resources.
We also believe we can best serve our role by taking a stra-tegic approach to three interrelated key areas:
• strategic planning, • innovation, and • collaborative partnering.
The Port of VirginiaA catalyst for commerce.
by MS. CATHIE J. VICK Chief Public Affairs Officer
Virginia Port Authority
Regions

29Summer 2016 Proceedingswww.uscg.mil/proceedings
ensures sustainable growth. Competitive participation in the global market depends in part upon being able to efficiently trans-fer goods through port facilities and keep pace with changes in the industry, includ-ing bigger vessels and changing trade pat-terns.
To leverage the shift in trade patterns and the move to shipping alliances and larger vessels, we must expand capacity and improve the port’s ability to handle larger container ships—from the water and the land. The port’s average annual growth rate since 2012 (measured in containers on a calendar-year basis) is 7.6 percent, and the port forecasts that growth will con-tinue over the next several years.
Norfolk International Terminal redevel-opment: By summer 2016, the new North Gate Complex — the first project of the first phase of the optimization of Norfolk International Terminals — is anticipated to be nearing its finish. Following the North Gate project, NIT will be re-engineered to become a rail-mounted gantry crane opera-tion. This $350 million project will increase NIT’s capacity by 700,000 TEUs (20-foot equivalent units, the industry stan-dard of measurement for container volume) without add-ing a single inch to the property. In addition to increasing capacity, it will increase efficiency and decrease emissions, as the rail-mounted gantries run on electricity rather than the diesel-powered straddle carrier operation the terminal currently utilizes.
Virginia International Gateway expansion: This project will provide the capacity to handle an additional 1.1 mil-lion TEUs annually and bring the terminal’s total annual capacity to two-plus million TEUs. The $320 million proj-ect entails expanding the rail operation, adding container stacks, introducing new cargo conveyance equipment, and extending the berth.
Craney Island Marine Terminal development: The expan-sion at VIG and NIT optimization will provide a bridge to the port’s long-term goal of developing Craney Island Marine Terminal — a 28-crane, 5 million-TEU facility that will bring the port’s total capacity to nearly 10 million TEUs.
Our natural assets, long-term capital plan, and deepening effort puts us on a path for sustainable growth over the long term. This will collectively result in jobs, revenue, invest-ment, and reinvestment for the entire Commonwealth of Virginia.
InnovationWhat are some of the innovative ways the Port of Virginia is making the port safer, more efficient, more effective, and more sustainable? Running a sustainable port requires a stable platform to ensure effective and efficient business operations that promote responsible future growth. That’s why we have adopted and maintained certifications in the ISO 14001 environmental management system and ISO 9001 quality management system programs.
In the spirit of continual improvement, we have recently expanded these successful programs to create an enterprise-wide business operating system. In addition to combining our ISO 14001 and 9001 activities, the business operating system is the way we do business — codifying, promulgat-ing, and following those best practices that make us the port of choice for our customers and key stakeholders.
Service-Level ImprovementsWe have achieved service-level improvements that increase the flow of cargo and reduce turn times and container dwell times. To do so, we made a number of innovative changes across our organization. At the time of this writing, we’d grown the size of our chassis pool by nearly 1,500 units over the previous 12 months — a 10 percent increase over the pre-vious year. This larger pool allows truckers to more quickly access an appropriate trailer for their load.
Additionally, our empty container yard is located off of, but adjacent to, our marine terminals. With this configuration, we cut a trucker’s turn time roughly in half compared to a
Economic Impacts FY 2013
Source: The Fiscal Year 2013 Virginia Economic Impacts of The Port of Virginia, Raymond A. Mason School of Business, College of William & Mary.
Graphic courtesy of the Port of Virginia.

30 Proceedings Summer 2016 www.uscg.mil/proceedings
to consume 15 percent less fuel per unit and generate 30 percent fewer emissions on average than their diesel equivalents.
ProgramsFiscal year 2015 marked the seventh operat-ing year of the Port of Virginia’s green opera-tor (GO) diesel emission reduction program. The GO program is a comprehensive program designed to incentivize and introduce clean diesel and alternative fuel technology into all transportation and cargo-handling vehicles that support port operations.
The GO program offers incentives to dray truck owners, commercial shipping lines, United States Maritime Administration marine high-way operators, railroads, and terminal opera-tors supporting Port of Virginia operations. To date, the program has helped more than 400
dray truckers replace or retrofit their trucks to burn cleaner fuel, and between 2012 and 2015 enabled 580 ship calls to reduce 58.2 metric tons of sulfur dioxide, 9.71 tons of nitro-gen dioxide, and 2.8 metric tons of particulate matter.
SoftwareIn fiscal year 2015, integrating the Navis N4 terminal operat-ing system was an area of keen focus for our operations and information technology teams. The N4 system is built on industry-standard platforms that allow the port to use “off the shelf” applications that provide more efficient services to port customers and port partners.
For example, upgrading the Norfolk International Terminals to N4 allowed the introduction of an automated gate system and a transfer zone automation system that improved on safety and efficiency. The automated gate moved staff from physical gate lanes into a safe office environment where they use computers to perform tasks previously done manually. Transfer zone automation also introduced a new level of safety and efficiency by allowing truck drivers to exit their vehicles and process their transactions in a protected kiosk in their truck lane. Straddle carrier operators pick up from or lower containers to trucks only when the driver is standing on the pressure pad inside the kiosk.
N4 also supports a reservation system, and we are working closely with our trucking partners in the early testing phase of a system that will allow drivers to pick up and drop off cargo even more expeditiously. Furthermore, the N4 system enables us to implement a global position detection system that will improve container management and enable pre-staging for containers to be picked up the next day.
trip onto the terminals. Major improvements to our empty yard include incorporating four high-definition cameras that post real-time video on the Port of Virginia website to enhance truck volume awareness and safety oversight.
Our information technology colleagues also installed radio-frequency identification readers to allow us to measure and publish to the community empty yard turn time metrics as well as expanded turn times on all terminals. All roadways were graded to improve drainage and paved to provide a smooth drivable surface for our trucking partners. We also added a direct entrance from the empty yard to the Ports-mouth marine terminal. Entrance booths were replaced and a new trailer was installed to keep operations colleagues safe from the elements as they manage the yard.
At the Virginia International Gateway, we expanded our rail container staging yard to provide a total of 308 additional “parking spaces” to provide additional flexibility for con-tainers arriving from or awaiting movement by rail. This enlarged area allows our operations colleagues to segregate truck containers from rail containers, decreasing the size of our stacks, reducing rail dwell time, and increasing velocity.
EquipmentIn early 2015, the Virginia Port Authority received $750,000 in Diesel Emission Reduction Act funding from the U.S. Environmental Protection Agency to introduce the next wave of cargo-handling technology — hybrid diesel-electric shuttle carriers.
Three of these hybrid shuttle carriers have been phased into Port of Virginia daily operations. They are the first of their kind to be deployed at any U.S. port and are estimated
Marine science technician Petty Officer Tonya Mulhern inspects under a shipping container. U.S. Coast Guard photo by Petty Officer Robert Brazzell.

31Summer 2016 Proceedingswww.uscg.mil/proceedings
Collaborative PartneringThe Port of Virginia does not operate in a vacuum. Our col-leagues live and work in communities across the common-wealth. We operate facilities near neighborhoods and work ships along our waterways. That’s why it’s critical that we form and nurture relationships with community organi-zations, business organizations, and government at every level.
Working together, keeping each other informed, and being mindful of the needs of our communities helps ensure we are running an economic engine that is sustainable — in every sense of the word — for generations to come.
For example, we have embarked on a three-year study with the U.S. Army Corps of Engineers to produce a general re-evaluation report on the future of our shipping channel to ensure the Port of Virginia is deepened and widened to accommodate larger commercial vessels and the U.S. Navy’s largest aircraft carriers. That report, which will be released in draft form in December 2016 and signed into effect by September 2018, will serve as the foundation for working with our congressional delegation and state legislators to secure funding for this critical asset.
A March 2015 partnership led to a prototype propane- powered truck. Personnel put the vehicle through the paces and agreed that it kept pace with conventional diesel trucks in the high-tempo marine terminal environment while keeping ground-level emissions around the vehicle cleaner than gasoline or diesel-powered trucks. Moving forward, we will continue to explore alternatives to diesel power in our vehicle and cargo-handling equipment fleets.
Further, to make the most meaningful impact in our com-munities, the port focuses on distinct areas of giving and service, including:
• education and workforce development, • awareness and stewardship, • harbors and navigable waterways, • health and safety, • community enrichment.
We also actively participate in programs including the United Way, Clean the Bay Day, and food drives for our local food banks. Additionally, through our Aid to Local Ports program, the Port of Virginia provides $1 million each year to localities throughout the Commonwealth of Virginia to help fund projects including dock and bulkhead
replacements, constructing a breakwater and pier, and dredging assistance.
We are also active members of the Virginia Maritime Asso-ciation as well as sponsors of the Elizabeth River Project, Virginia Aquarium, Boy Scouts of America, and many more.
Future FocusThe number and size of the vessels coming to the Port of Virginia keep growing — and will continue to grow. The revenue generated will be reinvested in all of the port’s ter-minals. This unique port, because of its assets and ability to leverage those assets and expand, is well-positioned to capitalize on new markets, growing market share, shifting trade lanes, a dynamic industry, and the unforeseen oppor-tunities that all these changes hold.
We know that each additional import container brings jobs to the port and business for our shipper, freight forwarder, and distribution center partners. Each new export container also brings jobs to the farms and factories that produce a “made in Virginia” product. Our mission is to foster eco-nomic development and create jobs across the Common-wealth of Virginia by serving as a global gateway for trade.
About the author:Cathie J. Vick is the chief public affairs officer at the Port of Virginia, where she oversees economic development, government and community rela-tions, marketing and communications, and maritime incident and emer-gency response for the third-largest port on the East Coast. Her background includes both the public and private side of government and public relations. Ms. Vick earned her J.D. from Georgia State University College of Law and her B.A. in political science and communications from James Madison Uni-versity. She is currently pursuing her MBA at the College of William and Mary. She is a 2005 fellow of the Sorenson Institute of Political Leadership, a 2009 graduate of LEAD Hampton Roads, a 2015 graduate of LEAD Vir-ginia, and has been named by Inside Business as one of the region’s “Top 40 under 40” in 2005 and “Top Women in Business” in 2010.
Endnote: 1. Raymond A. Mason School of Business, College of William & Mary, “The Fiscal
Year 2013 Virginia Economic Impacts of the Port of Virginia.”
For more information:
Statistics courtesy of the Port of Virginia. For more information, visit www.portofvirginia.com.

32 Proceedings Summer 2016 www.uscg.mil/proceedings
material that built the city, along with other communities in southeast Wisconsin.
Within three years, the city’s first lighthouse began its oper-ation, thus initiating Milwaukee’s relationship with the modern-day Coast Guard. Congress appropriated $1,000 to construct a lighthouse north of the Milwaukee River mouth, and it remained in service until moved to a higher bluff in 1855. Two other lighthouses were added, along with a Coast Guard lifesaving station and support base, which further solidified Milwaukee as a maritime hub, ready to drive the area’s economy.
By the early 1900s, a time of industrialization and vibrant immigration, a newly created outer harbor accelerated Milwaukee’s growth by allowing vessels to avoid navigat-ing through the web of bridges built within the city. The newly created 467-acre port stimulated trade, business, and employment, and the port became a premier provider of transportation and distribution services for its commercial customers.
The Port of Milwaukee is a diverse transportation hub on the Great Lakes, transacting business within the U.S. and internationally. The Great Lakes region, including the eight surrounding states as well as the province of Ontario, Can-ada, has been named “North America’s Economic Engine” for good reason.
In 2012, this region had an economic output of 4.9 trillion U.S. dollars. In fact, if it were its own country, the Great Lakes region would rank as the fourth-largest economy in the world, following behind only the United States, China, and Japan. The region also accounts for 28 percent of the combined U.S. and Canadian economic activity, and sup-plies 46 million jobs. 1
Economic ImpactOpened for business in 1835, Milwaukee’s location on Lake Michigan, near the mouth of three rivers — the Milwau-kee, Kinnickinnic, and Menomonee — made it a natural focal point for maritime trade. Lumber schooners from the northern end of Lake Michigan steadily brought in the raw
A Port for All AgesThe Port of Milwaukee’s rich
transportation and trade history.
by MR. PETER HIRTHE Senior Trade Development Representative
Port of Milwaukee
CDR DAN SOMMA Deputy Commander Sector Lake Michigan
U.S. Coast Guard
Regions
The Port of Milwaukee. Photo courtesy of Discovery World, Milwaukee, Wisconsin.

33Summer 2016 Proceedingswww.uscg.mil/proceedings
Meeting Public InterestThe 20th century saw the north harbor tract develop to sup-port public recreation, leisure, and other uses in the public interest. Today, music, cultural, and educational activities take place at the lakefront Henry Maier Festival Park and Discovery World. Additionally, Discovery World’s dock hosts regular cruise ship visits, bringing tourists to the city. It also serves as the home berth for Wisconsin’s flagship, the three-masted schooner Denis Sullivan, which is a U.S. Coast Guard-inspected passenger vessel that sails Milwaukee’s harbor from Memorial Day through October, giving pas-sengers a taste of early Great Lakes transportation.
The south harbor tract became the commercial port, serving the region with “laker” traffic, and then, in 1959, St. Law-rence Seaway vessels began exchanging commerce with Europe. Since the St. Lawrence Seaway opened, the Mon-treal-based shipline Fednav has been bringing vessels into the Great Lakes from Europe, with Milwaukee a scheduled port of call.
The port also serves as landlord to a diverse group of more than 20 tenants on the south harbor tract. For example, the Lake Express high-speed vehicle and passenger ferry carries close to 100,000 passengers between May and November
each year, taking their vehicles across Lake Michigan to Muskegon, Michigan, bypassing road congestion and reduc-ing stress on the highway.
The international cruise ship industry uses the port’s secure docks, as the Hamburg, the largest cruise ship on the Great
Lakes, often visits the port with 400 European pas-sengers. Through tight coordination with Customs and Border Protection, the U.S. Coast Guard has been able to ensure compliance with all applicable laws and treaties, provide for passenger security, and allow for safe vessel transit.
Further, as a tenant at the Port of Milwaukee since 1907, the U.S. Coast Guard is uniquely situated to facilitate maritime commerce. When U.S. Coast Guard Base Milwaukee was established as a depot for the Ninth Light-House District, Base Milwaukee was used to store, maintain, and repair the region’s vessels and assets. In 1967, Base Milwaukee moved
to the present-day building for Sector Lake Michigan. In 2005, marine safety, aids to navigation, lifesaving, and search and rescue functions were combined into Sector Lake Michigan, and the command center for all maritime opera-tions on Lake Michigan remains based in Milwaukee.
Commercial Tra�cCommercial vessel traffic continues today with a combina-tion of “lakers” and “salties” making more than 200 port calls each year. The lakers are U.S.- and Canadian-flagged ships that can carry up to 36,000 tons of bulk commodities such as grain, limestone, cement, and scrap metal. Each Janu-ary through March, the port’s winter laker fleet provides an opportunity for additional revenue as maintenance work is carried out, supported by port-owned and -operated cranes.
The schooner Denis Sullivan sails Milwaukee’s harbor from Memorial Day through October. Photo courtesy of Discovery World, Milwaukee, Wisconsin.
Lakers arrive at a heavy lift dock. Photo courtesy of the Port of Milwaukee.
The Lake Express high-speed vehicle and passenger ferry carries close to 100,000 passengers between May and November each year. Photo cour-tesy of Lake Express, LLC.

34 Proceedings Summer 2016 www.uscg.mil/proceedings
Canada and the U.S. jointly manage. Additionally, U.S. and Canadian Coast Guard icebreaking operations are pivotal in keeping the shipping lanes open at the begin-ning of the navigation season.
Inland River PortPerhaps less obvious, but of an equally important eco-nomic benefit, Milwaukee is an inland river port, as it’s the northernmost transit point on Lake Michigan for inland river barges that travel to and from the Missis-sippi River system. This allows river barges to traverse between Milwaukee and the Gulf of Mexico, carrying steel, manufactured products, scrap metal, asphalt, and agricultural products.
The Port of Milwaukee is also a conduit into the heartland of the United States via the access it has to the U.S. interstate highway system and the Canadian Pacific and Union Pacific railroads. This connectivity and geographic location pro-vide unique advantages that make the Port of Milwaukee an attractive destination for inbound vessel cargo as well as a port of origin for export.
About the authors: Mr. Peter Hirthe is a senior trade development representative at the Port of Milwaukee, where he assists Port of Milwaukee partners with their facilities, logistics, and procedures. He focuses on maximizing their commercial suc-cess and bringing economic benefits to the Milwaukee region.
CDR Dan Somma is an active duty Coast Guard officer who has served on all major U.S. coasts, including the Great Lakes. His tours have focused on facility security, marine safety, vessel inspection, and environmental protec-tion. He has published original research on energy production and authored articles on international trade, port security, and maritime history.
Endnote:1. Robert Kavcic, “Great Lakes Region: North America’s Economic Engine,” BMO
Capital Markets report, May 2013, page 1.
Owners ensure that U.S. Coast Guard marine inspectors approve laker repairs, fit-ups, repowering, and modifica-tions so that, come spring, the ships are ready to carry cargo.
Foreign-flagged vessels also carry a variety of cargo, bringing in heavy equipment and steel for the region’s manufacturing base and agricultural products like barley for the brewing industry. They then load out export products such as min-ing equipment and agricultural products like grain, wheat, and soybeans. Approximately 50 vessels annually transit to the Port of Milwaukee by sailing through the St. Law-rence Seaway System, “climbing” almost 600 feet from the Atlantic Ocean through a series of locks the governments of
Beer storage tanks arrive from a ship. Photo courtesy of the Port of Milwaukee.
For more information:
Port statistics courtesy of the Port of Milwaukee. For more information, visit: http://city.milwaukee.gov/port.The cruise ship Hamburg, the largest cruise ship on the Great Lakes, vis-
its the port with 400 European passengers. Photo courtesy of the Port of Milwaukee.

35Summer 2016 Proceedingswww.uscg.mil/proceedings
As one of the busiest waterways in the country, the Houston Ship Channel is home to three Texas ports: Galveston, Texas City, and Houston. While each port has its own distinct spe-cialties, capabilities, and flavor, the ports form a regional hub that channels competition into national success.
For example, Houston Ship Channel stakeholders, ranging from multinational oil companies to local family businesses, have created more than 1.1 million jobs around the nation, are responsible for nearly $265 billion in annual economic activity, and serve as models for sustainable commercial development through competitive cooperation. 1
The PortsThe Port of Galveston, on the back side of Galveston Island, is the first port of call on the Houston Ship Channel. This port is largely a cruise port, with facilities capable of han-dling more than a million passengers per year 2 and ameni-ties and attractions ranging from museums to shops to the tall ship Elissa, a three-masted barque that is home to the Texas Seaport Museum.
The port of Galveston is also home to Texas A&M Univer-sity – Galveston. This marine-oriented school — one of only seven maritime academies in the country — offers students the opportunity to become third mates, third engineers, or commissioned naval officers upon graduation.
Farther up the channel, the Port of Texas City is an unas-suming port owned by the Texas City Terminal Railway Company, a joint venture between the Union Pacific and Burlington Northern-Santa Fe railroad companies. It is home to several major refineries and chemical plants and moves 78 million tons of cargo every year. 3
Finally, the Port of Houston is a massive industrial complex that stretches from Port of Houston Authority-owned city docks through a narrow, winding waterway. It is home to more than 52 deep-draft waterfront terminals; 300 petro-chemical, manufacturing, and transportation facilities; and
Planning for SuccessFrom berthing to departure, the Houston
Ship Channel drives our nation’s economy.
by CAPTAIN BILL DIEHL President, Greater Houston Port Bureau
MR. BOB MITCHELL President, Bay Area Houston Economic Partnership
MR. STAN SWIGART Director, Port of Houston Authority Marketing
and External Communications
CAPT RANDAL OGRYDZIAK Commanding Officer, Marine Safety Unit Port Arthur
U.S. Coast Guard
CAPT ROB MCLELLAN Deputy Sector Commander, Sector Houston-Galveston
U.S. Coast Guard
CAPT BRIAN PENOYER Sector Commander, Houston-Galveston
U.S. Coast Guard
Regions
Ships docked at a facility on the Houston ship channel. U.S. Coast Guard photo by Petty Officer James Dillard.

36 Proceedings Summer 2016 www.uscg.mil/proceedings
In addition to the required paperwork, every foreign-flagged vessel calling on a U.S. port must undergo annual inspections conducted by the Coast Guard’s port state con-trol inspectors to verify that the vessel’s condition complies with certain domestic and international regulations govern-ing its seaworthiness, safety, and security. Once a vessel’s documentation is in order and the Coast Guard clears it, the port agent coordinates with local service providers for the vessel’s transit into Houston.
Coordinating the Transit to BerthThese service providers include pilots who provide the ves-sel’s master with expert advice while navigating the Hous-ton Ship Channel. As the local experts, such pilots are in the best position to determine what actions should or should not be taken at any given moment, and their on-scene discretion is an important factor in ensuring safe transits.
Adding to the routine exertion required to bring a vessel into berth, the Port of Houston is a landlocked port with a ship channel that is only 530 feet wide and 45 feet deep, at best — and the width can thin to as little as 250 feet near the city docks. Therefore, these pilots work closely with the U.S. Army Corps of Engineers, terminal operators, and the Coast Guard to implement guidelines governing which vessels are allowed to make routine movements at various points in the channel.
At Houston Fuel Oil Terminal Company, for example, docks 2 and 3 are situated close enough together that, even when dredged to project depth and width, vessels situated at or moving to and from these docks must have a combined beam of less than 290 feet to make sure there’s enough space for both vessels to maneuver.
During the transit to berth, vessel personnel also check in regularly with the Coast Guard’s vessel traffic service, which coordinates issues such as channel closures and notifies ships of potential passing situations.
As a ship approaches its assigned berth, tugs maneuver the vessel into the dock. Finally, as the tugs push each ship into position, professional line handlers dart in and around the vessel, mooring it in place and ensuring that it stands fast.
At the DockOnce the vessel is at its berth, agents meet it to address arrival formalities. For vessels arriving from foreign ports,
some of the largest refinery complexes in the world. The more than 200 million tons of cargo that move annually through the Port of Houston include nearly every type of commodity or product made or consumed in the United States.4
The AgenciesAlong the Houston Ship Channel, more than three dozen vessel agencies compete to handle a ship’s affairs. These agencies provide local expertise, so they must be fully pre-pared to work with each service entity and stakeholder. In addition, the agent is often the single point of contact for the vessel’s crew with regard to the services they may need after a long voyage at sea.
Even in the age of instant communication, the agencies’ specialized skills remain in high demand. An agent typi-cally works with the owners and master before arriving at the channel, while the ship is still at sea, to ensure that the proper pre-arrival paperwork is completed before the ship enters U.S. waters. For example, the U.S. Coast Guard elec-tronic notice of arrival must be submitted at least 96 hours prior to arrival. Other necessary documentation for a ves-sel’s transit may include U.S. Customs and Border Protection (CBP)’s automated manifest, the National Ballast Informa-tion Clearinghouse’s ballast water report, or documentation that tank vessels have response plans in place to cover a potential spill or discharge.
Port Of Houston National Rankings
■ #1 U.S. port by foreign waterborne tonnage
■ #1 U.S. port in petroleum, steel, and project cargo
continued on page 38
Texas Ports Help Drive Our Nation’s Economy
The ports of Texas represent 21.8 percent of our nation’s maritime tonnage, making Texas the nation’s largest exporter, ahead of California and signi�cantly ahead of New York, Washington, Illinois, and Louisiana.
Among U.S. seaports, the Port of Houston has ranked �rst in foreign tonnage for 19 consecutive years as of 2014, and second in total tonnage for 23 consecutive years as of 2014.
Bibliography:Port of Houston Authority, www.portofhouston.com.

37Summer 2016 Proceedingswww.uscg.mil/proceedings
Maintenance and Expansion Challenges Although the Houston Ship Channel spans a seemingly short distance — 52 miles from Galveston Bay to just outside of downtown Houston — it requires multiagency coordination to keep vessels moving. The Port of Houston Authority, a non-federal sponsor of the Houston Ship Channel, works with the Galveston District of the U.S. Army Corps of Engi-neers and local industry to maintain a healthy system.
Due to its origin as a shallow, muddy bayou cutting through geologic clay, the Houston Ship Channel requires constant maintenance dredging to remain a deep, wide channel. For example, some of the terminals along the channel report silting in at a rate of one foot per three-month period. 1
Maintenance FundingThe U.S. Army Corps of Engineers esti-mates that the federal portion of the Houston Ship Channel needs about $50 million in maintenance per year, but the federal appropriations are usually only half of that. Meanwhile, port users in Houston contributed $93 million to the Harbor Maintenance Trust Fund in 2013, of which only $21 million was appropriated for use. 2
Insufficient funding for necessary projects can lead to draft restrictions on the channel or docks, which has a trickle-down e�ect on the rest of the supply chain. Shippers may be forced to light load or lighter their vessels to enter their terminal destinations, which increases the cost to shippers and inflates the number of vessel transits required to move the same amount of cargo.
Fortunately, the Water Resources Reform and Redevelopment Act of
2014 set annually increasing targets for appropriations from the Harbor Maintenance Trust Fund to alleviate some of the maintenance shortfall.
DAMPsOther challenges include dredge material placement areas, or DAMPs, along the Houston Ship Channel, which are under strain to accept projected material placement loads, partially due to the large increase in investment throughout the region.
Maintaining DAMP sites requires periodic dewatering, decanting, and levee-raising, during which the site is not available to receive additional material. Additionally, it’s a time-consuming process to obtain approval for non-federal parties to use federal placement areas.
Looking AheadA deeper and wider Panama Canal offers the opportunity to capture the bene�t of larger ships newly able to transit it. In the near term, the
increased ship size will initially reduce the number of vessel arrivals at Gulf Coast ports. However, as growth in the Far East continues to expand, trans-Paci�c trade will grow as well. Over time, this will result in an increasing number of vessel arrivals at key Gulf Coast ports.
To enable the growth of regional industry along the channel, in 2016 the Port of Houston Authority and the Galveston District U.S. Army Corps of Engineers embarked on a four-year study of the Houston Ship Channel’s needs to determine the economic and engineering feasibility of deep-ening and/or widening sections of the channel and expanding placement areas.
Endnotes:1. S e e w w w. c h r o n . co m / b u s i n e ss/a r t i c l e /
Ship - Channel- depth-af fec ts-authorit y-s-revenue-1682269.php.
2. S e e w w w . n b c d f w . c o m / n e w s / l o c a l /Houston-Bayous-Evolution-Into-Busy-Port-Ongoing-252440941.html.
A tanker passing a dredge working in the Houston ship channel. U.S. Coast Guard photo by Petty Officer James Dillard.

38 Proceedings Summer 2016 www.uscg.mil/proceedings
every private and public entity on the ship channel — meets to share information and prioritize vessel movements in a show of unparalleled cooperation to get traffic restarted after a closure.
At the end of the day, moving through the Houston Ship Channel involves a multitude of parties and an unprece-dented amount of teamwork. Owners, operators, agents, masters, pilots, seafarers, tugs, terminals, longshoremen, federal agencies, and even more entities work together closely to ensure the safe and reliable flow of commerce through Houston.
About the authors:Captain Bill Diehl (USCG, Ret.) is president of the Greater Houston Port Bureau, a maritime trade organization of 210 companies that supplies its companies with detailed vessel traffic information and maritime expertise in safety, security, and environmental issues. Before coming to the Port Bureau in 2009, Captain Diehl served for 31 years in the Coast Guard.
Bob Mitchell is president of the Bay Area Houston Economic Partnership (BAHEP). For the past 40 years, BAHEP has provided the leadership to stimulate regional economic development and employment, creating a great quality of life for the 800,000 people who live and work within the BAHEP service region.
Mr. Stan L. Swigart is the director of marketing and external communica-tions for the Port of Houston Authority. He has over fifteen years of experi-ence specializing in market research and analysis, business development, and strategic planning in the liner shipping, maritime and intermodal transpor-tation sector. A native of Louisiana, Mr. Swigart earned a bachelor’s degree in marketing from Loyola University of the South.
CAPT Randal Ogrydziak is the commander of Marine Safety Unit Port Arthur. Previous assignments include: executive officer, Marine Safety Unit Port Arthur; supervisor, Liquefied Gas Carrier National Center of Exper-tise; deputy commander, Air Station Corpus Christi; maintenance and repair supervisor, Coast Guard Base Milwaukee; salvage diver, National Strike Force Dive Team; Chemical Division response and operations officer, Pacific Strike Team; and marine inspector, Marine Safety Office Honolulu. He holds a master’s degree in public health from the University Of Hawaii.
CAPT Malcolm R. McLellan III has served in the U.S. Coast Guard for over 24 years, supporting the Coast Guard strategic missions of marine safety, security, and environmental protection for the majority of his career. He is currently assigned as the deputy sector commander of Sector Houston-Galveston.
CAPT Brian Penoyer, USCG, is the sector commander and captain of the port in Houston-Galveston. The sector encompasses an area extending from 60 miles east of Lake Charles, Louisiana; to the east bank of the Colorado River; 40 miles west of Freeport, Texas; and from the Texas/Oklahoma bor-der on Lake Texoma extending 200 nautical miles offshore into the Gulf of Mexico. Captain Penoyer has served in the Coast Guard for 27 years.
Endnotes:1. Port of Houston Authority, www.portofhouston.com/inside-the-port-authority/
communications/business-news/the-port-of-houston-authoritys-future-is-here/.2. Port of Galveston, www.portofgalveston.com/CivicAlerts.aspx?AID=32.3. Texas City Terminal Railway Co., www.tctrr.com/.4. Port of Houston Authority, www.portofhouston.com/about-us/overview/.
Customs and Border Protection officers obtain information about their voyage, gross and net tonnage, and crew details. While importers of record submit electronic cargo mani-fests to CBP, all personnel (and their accompanied baggage, property, cargo, and associated documentation, as well) are subject to inspection.
The port agent also deals with other issues while a vessel is tied up, including arranging for bunkering, provisioning, or inspections; facilitating crew changes; or clearing equipment delivery. While these may seem to be simple tasks, safety and security regulations — especially those promulgated since the 2003 Maritime Transportation Security Act — have created significant disincentives for terminal operators to allow personnel and material transit through their facilities.
DeparturePort calls in Houston can last anywhere from 10 hours for a cruise or container ship to sail in, churn cargo, and depart, to more than a month for a chemical tanker to make pre-cisely ordered stops across many terminals. As a vessel readies to depart, the port agent ensures that cargo filings are completed, the electronic notice of departure has been filed, and the crew lists have been updated with CBP. They will also reverse the process of arrival by arranging for line handlers to untie the vessel, tugs to push it out, and a pilot to guide the ship back out to sea.
But the job is not quite over yet; when all is said and done, it is time to reconcile accounts. While a port call in Houston starts at nearly $25,000 for a single voyage (consistent with many other regional ports), it can be far more expensive if the schedule outlined in the charter party isn’t met. Demur-rage charges, extra movements, and additional terminal charges add to the cost of doing business, and extenuating circumstances may contribute to the delay if, for example, the vessel needs to be repaired, a crewmember needs to be hospitalized, or hazardous material must be removed from the ship.
In addition, external forces such as fog, channel closures, or regional incidents can cause delays for everyone doing business in the port. Regional stakeholder groups work dili-gently to ensure that closures are minimized and normal operating practices keep costs down. The Lone Star Harbor Safety Committee, area maritime security committee, and Central Texas Area Committee meet regularly to advise the Coast Guard’s captain of the port on issues affecting safety, security, and the environment. During times of crisis, the port coordination team — a group that represents nearly

39Summer 2016 Proceedingswww.uscg.mil/proceedings
When we think about America’s top resources, we typically think about energy resources like oil or natural gas, vital metals such as copper or iron, or our enormous agricultural capacity. But what about the vast transportation network comprising thousands of miles of navigable waterways that link tens of millions of consumers, ensuring that those stra-tegic resources get to markets?
While the transportation infrastructure dialogue often focuses on highways, bridges, and airports, too frequently the only time we talk about America’s marine transporta-tion system is when its banks are breached by floodwaters or other environmental mishaps occur.
This is unfortunate, as America’s waterways — and partic-ularly the Mississippi River system — are national assets with global economic importance, and there are opportu-nities to further leverage this resource. We must be mind-ful, though, that the Mississippi River system is vulner-able, requiring protection, thoughtful policies, and — most importantly — investment.
An Immense Transportation NetworkThe Mississippi River system, also commonly referred to as the western rivers, includes the Mississippi River and its major tributaries (the Missouri, Arkansas, Ohio, Red, and Illinois riv-ers) as well as major Ohio River tributaries (the Tennessee-Tombigbee Waterway and the Tennes-see, Allegheny, and Wabash rivers).
As such, the Mississippi River system consists of more than 6,000 miles of navigable waterways, extending north to south from the Great Lakes to the Gulf of Mexico, as far west as Oklahoma and Nebraska, and as far east as Pennsylvania. The drainage basin includes 41 percent of the conti-nental United States, and more than 50 major U.S. cities rely on the system for potable water. 1
Strategic Economic ImportanceStrategic resources like the Mississippi River system also pose national security implications. President Obama’s recently updated National Security Strategy underscores economic might as the bedrock of American power and global influence, and emphasizes renewed strategic focus on domestic economic issues to strengthen this foundation. 2
If economic might is the bedrock of American power, then our national intermodal transportation system, in which the inland river system plays a critical role, is the prime facilita-tor. For example, the Mississippi River system enables an enormous share of America’s global trade, including 60 per-cent of U.S. grain exports, 3 as the system’s waterways reach deep into the heart of America’s rich farming regions and provide efficient transportation for agricultural exports such as soybeans, corn, and grain. Further, the relatively cheap cost of transporting these exports to the Gulf Coast by barge
The Mississippi River SystemA strategic resource.
by CAPT MICHAEL W. CRIBBS U.S. Coast Guard
Regions
The Mississippi River system. Image created by Mr. Joseph Brown, U.S. Coast Guard Shore Infrastructure Logistics Center.

40 Proceedings Summer 2016 www.uscg.mil/proceedings
capacity issues. While pipelines are arguably the most efficient way to move petroleum products, the existing pipeline infrastructure was quickly over-whelmed shortly after the shale oil boom began in 2007. 8 The lengthy permitting process for new pipelines means that barges will continue to be an important enabler for America’s energy renaissance. Many interstate highways are already perpetually clogged and taxed beyond capacity by tens of thou-sands of semi-trucks. Fortunately, there are oppor-tunities to shift cargo currently moved via land to domestic waterways. Doing so will relieve traffic congestion on our roads and reduce air pollution.
System ExpansionA 2009 report prepared for the Maritime Admin-istration (MARAD) examined this idea of mov-ing more cargo by waterways rather than by land. Among its conclusions, the report noted that further investment would be necessary to keep pace with global trade realities. 9 As such, MARAD’s marine
highway initiative seeks to leverage inland rivers, inter-coastal waterways, and domestic coastwise trade routes.
For example, MARAD contends, with investment in port facilities along the Mississippi and its major tributaries, con-tainerized cargo could be moved to dozens of large inland urban centers such as Memphis, Tennessee; St. Louis, Mis-souri; and Pittsburgh, Pennsylvania. Further, deepening lower Mississippi channel depths to accommodate larger ships will make Gulf Coast ports attractive to importers and ensure U.S. agricultural exports remain competitive with other major South American grain producers. This will relieve pressure on West Coast ports while building a layer of redundancy and resilience for America’s overall marine transportation system. 10
The Missouri Department of Transportation sponsored another study that examined the feasibility of using the Mississippi River system to export large farm equipment to markets in Asia. While the report concluded that using waterways to move these machinery exports would have very positive prospects, like any new business proposal, it would require up-front investment to capitalize on the efficiencies this freight alternative offers. 11
The good news is that the U.S. Coast Guard, the U.S. Army Corps of Engineers, and the shipping industry have col-laborated closely to develop an advanced, reliable electronic navigation system and traffic management regime on the western rivers. This ensures the continued safe use of this vital transportation network and also positions the system to accommodate increased vessel traffic.
allows U.S. farmers to remain competitive with other major global agricultural powers like Brazil and Argentina.
The western rivers also transport millions of tons of energy products. More than 20 percent of oil from the Bakken shale oil reserves and 20 percent of both coal exports and coal used for domestic power generation is transported on the Mississippi River system. 4
Cheap, E�cient TransportationWaterways are an essential part of the U.S. intermodal trans-portation system. Moving large volumes of goods by water is simply the cheapest, most environmentally clean way to get the job done. Consider some creative comparisons to other modes of transportation:
• One gallon of fuel will transport one ton of cargo 155 miles by truck, 413 miles by rail, and 576 miles by barge. 5
• One barge can carry the same amount of cargo as 15 jumbo rail hoppers or 58 semi-truck haulers.
• One barge of wheat can bake 2.25 million loaves of bread. 6
Moreover, the volumetric edge our marine transportation system enjoys over other transport methods generates enor-mous revenue. For example, the U.S. Army Corps of Engi-neers (USACE) maintains a 1,200-mile long navigation chan-nel (running through Illinois, Iowa, Minnesota, Missouri, and Wisconsin) which generates an estimated $1 billion of transportation savings annually. 7
Additionally, other modes of transportation such as rail, road, and pipeline have significant infrastructure and
Mississippi River system tugs can push dozens of barges at once. This towboat pushes 35 barges near Vicksburg, Mississippi. U.S. Coast Guard photo by Petty Officer Jona-than Lally.

41Summer 2016 Proceedingswww.uscg.mil/proceedings
The Mississippi River System is a marvel of engi-neering. There are more than 120 locks on the western rivers, most of which are along the upper Mississippi River system.
In the late 1940s, the U.S. Army Corps of Engineers (USACE) noticed that the Mississippi River was diverting west toward the Atchafalaya River. Left to its own devices, the Mississippi would eventually merge with the Atchafalaya and cut o� river access to Baton Rouge and New Orleans — two of the largest commercial ports on the Gulf Coast.
In 1963, the USACE completed a lock and dam struc-ture that prevented the Atchafalaya from “capturing” the Mississippi River and preserved the vital commer-cial channel from Baton Rouge to the Gulf of Mexico.
Bibliography:John McPhee, “The Control of Nature,” Farrar, Straus, and Giroux, New York, 1989.
The U.S. Army Corps of Engineers and the U.S. Coast Guard have a long history of working together to ensure our marine transportation system works safely and efficiently. The USACE operates and maintains the system’s locks and dams, and conducts hydrographic surveying, dredging, and blasting to maintain control depths required for vessels to operate.
The U.S. Coast Guard ensures the western rivers can be safely navigated. Supporting that effort, the Coast Guard operates a fleet of 18 inland river tenders that position and maintain more than 14,000 floating and fixed aid to navi-gation structures that mark channels in the Mississippi River system. 12 In addition, it regulates the inland domestic shipping industry through a variety of oversight functions, including vessel inspection and mariner licensing.
System OverheadOf course, all of this comes with a cost. Simply maintaining Mississippi River system infrastructure and transportation capacity is expensive in itself — and these costs are about to rise. Why? To put it simply: age.
The majority of dams and locks in the Mississippi River system were built in the 1930s, with a design life of 50 years. The U.S. Coast Guard’s inland river tenders are an average age of 48 years old. Once completed, the project of replacing the aging Olmstead Locks and Dam will cost approximately
$1 billion. Recapitalizing the river tender fleet will cost an estimated $300 million. 13
While this is a significant amount of money, spending these sums is arguably a prudent business decision, as the Water-ways Council, Inc., estimates that every dollar spent on the inland waterways yields $10 in economic benefit. 14
Investment — A National Security ImperativeAmerica’s economic strength is powered by our robust intermodal transportation system, which is a strategic asset that cannot operate efficiently without a fully functional Mississippi River system. Therefore, investment in the Mis-sissippi River system is imperative.
An investment to replace antiquated Mississippi River system infrastructure and the vintage fleet of tenders that maintain its channels is also urgently required to realize the Mississippi River system’s full transportation capacity and position the system to accommodate increased trade. Additionally, smart policies must be in place to promote private investment in inland port facilities and encourage businesses to choose waterborne commerce.
Finally, the Mississippi River system needs to be better mar-keted to the general population. Since most Americans can agree on the issues of reducing emissions and decreasing highway congestion, public advertising campaigns should
The U.S. Army Corps of Engineers operates more than 120 navigational lock facilities, such as the Brandon Road Lock in Joliet, Illinois. Photo courtesy of the U.S. Army Corps of Engineers.
Preservation, Engineered

42 Proceedings Summer 2016 www.uscg.mil/proceedings
3. See www.nps.gov/miss/riverfacts.4. See www.waterwayscouncil.org.5. See www.marad.dot.gov/wp-content/uploads/pdf/Phase_II_Report_Final_
121907.pdf, page 38.6. See www.nps.gov/miss/riverfacts.7. See www.mvr.usace.army.mil.8. GAO Report 14-667, “Oil and Gas Transportation: Department of Transportation
is Taking Actions to Address Rail Safety, but Additional Actions are Needed to Improve Pipeline Safety,” August 21, 2014.
9. “An Evaluation of Maritime Policy in Meeting the Commercial and Security Needs of the United States,” prepared by IHS Global Insight, Inc., for the Maritime Administration, January 7, 2009.
10. “Panama Canal Expansion Study, Phase 1 Report: Developments in Trade and National and Global Economies,” prepared by the Economic Development Research Group, Inc., for the Maritime Administration, November 2013.
11. “M-55 Illinois-Gulf Marine Highway Initiative,” prepared by the RNO Group for the Missouri Department of Transportation, March 2013.
12. Information provided by the U.S. Coast Guard Office of Navigation Systems (CG-NAV-3).
13. Information provided by the U.S. Coast Guard Office of Cutter Forces (CG-751). Recapitalization estimate is in 2012 dollars.
14. “Record Harvest Seen Pushing U.S. River Transportation System to Near Break-ing Point,” Michael Hirtzer and Karl Plume, Reuters, September 25, 2014.
emphasize that utilizing our maritime transportation sys-tem can aid these efforts.
An assertive information campaign leveraging these issues will raise the visibility of the Mississippi River system to policymakers and legislators beyond those from the states the system runs through.
About the author:CAPT Cribbs is a military fellow at the Center for Strategic and Interna-tional Studies. He has served 10 years at sea on five cutters and recently completed an assignment as commanding officer of USCGC Harriet Lane. CAPT Cribbs has served in diverse staff assignments, including assistant Senate liaison in Coast Guard Congressional Affairs and project manager at Civil Engineering Unit Providence. CAPT Cribbs holds a B.S. and M.S. in civil engineering and is a licensed professional engineer.
Endnotes:1. See www.nps.gov/miss/riverfacts.2. National Security Strategy, February 2015.
Risk-Based System ProtectionTransportation systems require protec-tion, but what are the threats to our waterways? Acts of terrorism certainly cannot be ruled out, but recent history indicates that other modes of trans-portation are more attractive targets for terrorists.
History, however, shows us that major waterway closures regularly result from natural disasters and extreme weather. For example, in 2012, extreme drought triggered a low-water crisis that came dangerously close to closing the Mississippi River between St. Louis, Missouri, and Cairo, Illinois. In 2013, massive �ooding on the Illinois River caused several barges to break loose from their moorings and crash into the Marseilles Dam, temporarily shutting down the river.
So while implementing prudent phys-ical security measures at critical river infrastructure is important, the best protection for the Mississippi River system, based on risk, is to enhance the system’s resilience in the event of severe weather events. The best way
to accomplish this task is to replace or refurbish dams and locks and recapi-talize the equipment needed to main-tain the system.
High Probability, High ConsequenceWhat happens when a major port — or an entire river system — shuts down? Hurricane Katrina offers an excel-lent case study. Of course, Katrina impacted tens to hundreds of thou-sands of people, and its e�ects were felt throughout our nation. If we take a look at one market segment, we can more clearly see the cascading, dele-terious economic impact of a major waterway closure.
Each year, millions of tons of agricul-tural products such as corn, soybeans, and wheat harvested in the Midwest make their way down the western rivers by barge to port facilities in Loui-siana for export to countries across the globe. The Mississippi River was shut down immediately after Katrina made landfall.
Bid prices for corn and soybeans expe-rienced a signi�cant decline because grain elevators at facilities along the Mississippi River were completely full. These falling commodity prices had an immediate impact on rural farming communities and the marine trans-portation industry throughout the Midwest, both of which employed tens of thousands of people.
Further, the timing of Katrina’s landfall in late August was particularly precar-ious for the farming sector, as two of the area’s largest exports — corn and soybeans — are harvested in October. While the Herculean efforts of the U.S. Army Corps of Engineers, Coast Guard, Louisiana port authorities, and the U.S. shipping industry were able to gradually reopen channels and grain handling facilities, it was months before the system was fully restored.
Bibliography:CRS Report for Congress: “U. S. Agricul-ture After Hurricane Katrina: Status and Issues,” Randy Schnepf and Ralph M. Chite, September 12, 2005.

43Summer 2016 Proceedingswww.uscg.mil/proceedingsU.S. port operations. Photo courtesy of the U.S. Maritime Administration.

44 Proceedings Summer 2016 www.uscg.mil/proceedings
Tra�c ControlCommodities and their handling requirements shape the way the Mississippi River functions. For example, bulk commodities, such as grain and coal, barge down from the heartland, bringing these cargoes to freight ships for export. To accomplish this, the river must provide barge fleeting areas, deep draft anchorages, and loading facilities or trans-fer buoys while still managing to accommodate navigating traffic.
Further, the spot commodity market routinely moves petro-chemical products between Mobile, Alabama; and Houston, Texas. Barge traffic must utilize locks to enter and exit the river as the barges move through the Intracoastal Waterway.
The lower Mississippi River houses five port complexes: the Port of Baton Rouge, Port of South Louisiana, Port of New Orleans, Port of St. Bernard, and Port of Plaquemines. Four of these ports have consistently been in the top 10 for ton-nage, making the Mississippi River one of the busiest ports in the Western Hemisphere. 1
Even with these already-high volumes, these five ports actively seek to expand their capabilities and continue to expand commerce within the region. With increased imports and new potential facilities to manage products such as liquefied natural gas exports, coupled with the fact that the Mississippi River can no longer expand, it is vital to ensure that the river is developed with the principles of an efficient and effective marine transportation system (MTS).
Building a PortManaging an expanding port
and keeping it healthy.
by CDR BRIAN KHEY Chief of Prevention
U.S. Coast Guard Sector New Orleans
Regions

45Summer 2016 Proceedingswww.uscg.mil/proceedings
These tugs and barges need places to hold up as they wait for their turn to lock through.
MTS DemandsSo if the river can’t get any bigger, how do you accommodate greater demands?
The main problem is that the separate needs for anchorages, waterfront access, protection of the levee systems, and safe navigation can be at odds with one another. A landowner may seek to establish a waterfront facility that may impede traffic or remove a spot on the river where tow traffic was previously able to hold up. An anchorage may prohibit or restrict a landowner from building a waterfront facility. A difficult turn in the river may require additional naviga-tional room close to the bank right where a fleeting area is proposed.
So how do people come together and put aside competing demands to ensure a healthy marine transportation system?
Currently, individual entities apply for U.S. Army Corps of Engineering permits to construct or build something in the river. Traditionally these projects seek to help the individual or organization requesting approval, and the request will impact how the river operates. While it may help the indi-vidual, it may not help the overall efficiency of the river. Therefore, it’s important to balance the effects of any change and ensure that the entire marine transportation system is evaluated.
For example, if someone is seeking to expand dock space for more deep draft vessels, it’s important to assess how the expansion will impact the navigation of traffic through the area. In addition, granting such expansion will increase vessel traffic in the river system, potentially requiring more anchorage space as well as vessel services such as bunkering and stores, which also have a footprint on the river.
Various people have discussed increasing the depth of the Mississippi River to bring larger vessels into port. While dredging the river would enable deeper vessels to come in, the fixed width of the river would still limit the total amount of traffic it could accommodate. Thus, it is critical that port partners as well as state and federal agencies work together to manage ports to ensure they grow in a man-ner that can benefit and be effective for all. If such growth goes unplanned, it may degrade the ports’ overall capability, leaving vessels to find another place to go.
About the author: CDR Brian Khey has served in the U.S. Coast Guard for 17 years — 13 of them as a marine safety professional. CDR Khey currently manages one of the largest prevention departments in the Coast Guard at Sector New Orleans.
Endnote:1. Bureau of Transportation Statistics, “Tonnage of Top 50 U.S. Water Ports, Ranked
by Total Tons,” found at www.rita.dot.gov/bts/sites/rita.dot.gov.bts/files/publica-tions/national_transportation_statistics/html/table_01_57.html.
New Orleans, Louisiana. Photo by pisaphotography / Shutterstock.com.

46 Proceedings Summer 2016 www.uscg.mil/proceedings
are just two paradigm shifts in the international trade sec-tor, and the Port of New Orleans is readying for both, which will bring larger ships and additional business to the port’s docks. In addition, due to historic private industrial expan-sions, investment, and new construction on the lower Mis-sissippi River and along the Gulf Coast, port docks are expe-riencing record highs in cargo and container throughput.
Port ExpansionNew shipping services have led to record volumes at the port’s Napoleon Avenue container terminal. To stay ahead of market demand, the port has invested more than $100 mil-lion in capital improvement projects since 2012 and has a master plan to expand the Napoleon Avenue container terminal to an annual capacity of 1.5 million twenty-foot equivalent units.
Nearly $40 million in new investments to increase efficiencies and expand container handling capabilities were completed in early 2016 within the terminal. For example, due to surging demand for refrigerated cargo, the port spent $7.9 million for a refrigerated container racking system, which allows the terminal to store more than 600 refrigerated containers at once. The new Mississippi River intermodal ter-minal uses two new electric rubber tire gantry cranes, which allow for more efficient handling of containers than traditional side-loading cranes. New Orleans terminal also added two new rubber tire gantry cranes to its container marshaling yard, which has allowed for faster transfer of containers from truck to stack, or vice versa, increasing container handling and turn times.
These projects are complemented by the new $25.1 million Mississippi River Intermodal Terminal, which facilitates marine and rail cargo movement while enhancing safety and
The Port of New Orleans is a deep-draft, multipurpose port at the center of the world’s busiest port system — Louisiana’s lower Mississippi River. Connected to major inland markets and Canada via 14,500 miles of inland navigable waterways, six railroad lines, and the interstate highway system, the Port of New Orleans is the ideal gateway for containers, chemicals, coffee, steel, project cargo, natural rubber, forest products, manufactured goods, and more. Further, the port was named Business Facilities magazine’s top logistics leader in 2013 and Lloyd’s List North America’s port operator of the year in 2014.
However, the shipping world is evolving; the Port of New Orleans can’t just rest on its laurels. Rather, we must stra-tegically invest in and prepare for the future. For example, shipper alliances and the pending Panama Canal expansion
The Port of New OrleansPreparing for the future.
by MR. MATT GRESHAM Director of External Affairs
Port of New Orleans
Regions
A 718-ton absorption tower is offloaded at the Port of New Orleans’ Louisiana Avenue com-plex. The tower is an example of the project cargo being handled at the port in response to the investments being made in chemical and petrochemical facilities on the lower Missis-sippi River. In January 2015, the Port of New Orleans handled its largest project cargo piece to date at the Louisiana Terminal (operated by Coastal Cargo). Dan-Gulf Shipping was the appointed agent for the record-breaking 790-ton, 128-foot-long project piece that journeyed to New Orleans from Jebel Ali, Dubai, aboard the MV Palabora. The record was broken just two weeks later. Photo courtesy of the Port of New Orleans.

47Summer 2016 Proceedingswww.uscg.mil/proceedings
reducing the overall carbon footprint. The 12-acre ter-minal, spurred by a $16.7 million Transportation Invest-ment Generating Economic Recovery grant, began operation in March 2016. All of these projects enhance efficiencies, expand capacity, and create new, high-pay-ing maritime jobs in the region.
Deepening the Mississippi RiverIn addition, the U.S. Army Corps of Engineers is updating a study on the feasibility of deepening the Mississippi River from its current 45-foot channel to 50 feet — the controlling draft of the expanded Panama Canal locks.
While five feet of water doesn’t sound like very much, officials at the National Oceanic and Atmospheric Administration (NOAA) found that even an inch means a lot to the shipping community. In fact, it could mean the difference between making and losing money. For example, for each inch of additional draft, an oceangoing ship could load 9,600 more laptop computers; 1,540 more 55-inch televisions; 36 more tractors; or 358,000 more pounds of wheat. Imagine what 60 inches would produce! 1
In 1985, Congress and the U.S. Army Corps of Engineers authorized a deepening study for the Mississippi River to deepen it from its then-40-foot draft to 55 feet. Work pro-gressed through the years to a 45-foot minimum draft, but never went deeper. Now, as the Panama Canal expands and deepens its locks to 50 feet, ports throughout the Northern Hemisphere are striving to reach that 50-foot draft number.
In 2013, as part of a coalition, the Port of New Orleans commissioned a study to update the economic benefits of deepening the river to 50 feet. That study determined that a 50-foot minimum channel for the lower Mississippi River would add $11.49 billion in U.S. production; 17,000 new jobs; $849 million in increased income; and result in an $89.40-to-$1 benefit-to-cost ratio. 2
A completed draft of the study is due in the fall of 2016, with a finalized report expected in 2017. In the meantime, industry officials and political leaders are already working to secure the estimated $150 million needed for Louisiana’s share of the construction cost.
The U.S. Army Corps of Engineers, in conjunction with its local sponsor, the Louisiana Department of Transportation and Development, launched a re-evaluation study to esti-mate the transportation cost savings and highest net ben-efits derived from increasing the Mississippi River’s draft to 50 feet.
Further, deepening the river could be done in phases, as deepening Southwest Pass alone could open more than half of the lower Mississippi River to a 50-foot channel.
Cruising IndustryWhile the Port of New Orleans is a gateway to global com-merce, the port’s cruise and industrial properties business segments are also growing at a steady pace.
The port set a goal to surpass the 1-million-passenger mark a few years ago, and, thanks to valued cruise partners, a strong marketing effort, and continued investment into first-class facilities, exceeded that goal in 2014 and 2015 as new and larger ships found a home port in the Crescent City.
Those figures could rise again, as Carnival Cruise Lines increased its capacity for its four- and five-day year-round itineraries by 34 percent. Port officials will also welcome 19 cruise ship ports of call to New Orleans from seven dif-ferent ships and five cruise lines over the next year.
To handle this new business and set a new cruise passen-ger “high-water” mark, the Port of New Orleans expects to complete a third cruise terminal at Poland Avenue in late 2017. This project will free berthing space for additional homeported cruise ships and allow port officials to aggres-sively market New Orleans as a unique port of call.
River cruising is also growing in New Orleans, as American Cruise Line added a new sternwheeler — the America — to its fleet homeported in New Orleans, and Viking River Cruises plans to establish its first North American homeport in New Orleans.
A container ship berthed at the Port of New Orleans Napoleon Avenue container terminal, where new shipping services have led to record volumes. Photo courtesy of the Port of New Orleans.

48 Proceedings Summer 2016 www.uscg.mil/proceedings
environmental certification program, the “Green Marine” initiative, which addresses key environmental issues in the maritime industry through its 12 performance indicators.
The Port of New Orleans’ environmental services depart-ment is also responsible for the “Keep It Clean” campaign, which won a national environmental improvement award from the American Association of Port Authorities.
About the author:Matt Gresham joined the Port of New Orleans three weeks prior to Hur-ricane Katrina’s landfall, and worked as a communications specialist and legislative liaison during the port’s recovery and rebuilding. He has served as the port’s director of external affairs since 2012. He also serves as a mem-ber of the Public Relations-Government Relations Committee of the Ameri-can Association of Port Authorities; as an active member of the Louisiana Maritime Association and the Coastal Ports Advisory Council; and on the boards of the Gulf Ports Association of the Americas, the Ports Association of Louisiana, and the Coastal Protection and Restoration Authority Naviga-tion Focus Group. He is a graduate of Nicholls State University.
Endnotes:1. National Oceanic and Atmospheric Administration, Ocean Service Magazine,
3/29/12.2. “The Economic Impact of Deepening the Mississippi River to 50 Feet,” Dr. Timothy
Ryan, Ph.D., August 22, 2013.3. 2015 Port of New Orleans Annual Report.
Industrial Real EstateIn further positive news, the port’s industrial real estate portfolio is producing strong results, as well. In the years since closing the Mississippi River-Gulf Outlet (MR-GO), port officials worked to reimage the property into an inter-national logistics hub, with firms adding value to cargo in New Orleans. Today, the port has 42 leases covering about 500 acres and generating $6 million in annual rev-enue — nearly double the revenue from when the MR-GO was open to deep-draft shipping. 3
Fortunately, due to the more than $14 billion invested in surge barriers and armored levees by the U.S. Army Corps of Engineers in the New Orleans area, the port’s property along the inner harbor navigation canal is the only surge-protected waterfront property on the Gulf Intracoastal Waterway. Interest in those properties remains strong, and port officials anticipate additional growth.
Environmental InitiativesWith every sector of the port’s business portfolio realizing strong results, port officials have also reinvested in smart growth through its environmental efforts. For example, the Port of New Orleans recently became only the 8th U.S. port to earn “green port” certification via a voluntary
For more information:
Port statistics courtesy of the Port of New Orleans. For more information, visit www.portno.com.

49Summer 2016 Proceedingswww.uscg.mil/proceedings
Nearly 85 years ago, Tidewater Transportation and Termi-nals helped pioneer commercial transportation on the upper Columbia/Snake River (CSR), opening up one of the nation’s most isolated regions to the markets of the world.
Columbia/Snake River SystemIn the early 1930s, commodity transport via rivers in the Columbia River basin took a back seat to the railroads until the U.S. Army Corps of Engineers (USACE) completed the Bonneville Dam in 1938, then the McNary Dam in 1953.
Today, eight hydroelectric dams and navigation locks pro-vide tug and barge companies a 465-mile navigable water-way between Portland, Oregon; and Lewiston, Idaho; allow-ing the Columbia/Snake River system to annually transport more than 46 million tons of cargo, including grain, refined petroleum products, fer-tilizer, containers, wood products, and special project cargoes. 1
Economic ImpactAccording to the Pacific Northwest Waterways Association, the regions along the CSR are poised to experience tremendous growth over the next 15 years, making the Columbia River basin econo-mies even more reliant on the ability to efficiently flow that growing commerce up and down the system.
Hence, Columbia/Snake River system stake-holders (including companies such as Tidewater, grain growers/co-ops, ports, the energy industry, exporters, and others) look to the U.S. Army Corps of Engineers to maintain lock and dam integrity. The federal government also invested in major maintenance repairs for the locks and dams along the CSR in 2010. While this was good news for the longevity of the system, the maintenance closed the system for nearly four months.
Transforming the Tide A look at the Columbia/Snake River system
— past, present, and future.
by MS. JENNIFER RIDDLE Public Information Officer
Tidewater Transportation and Terminals
Regions
Vessels that pass through the eight Columbia/Snake River locks travel nearly 750 feet above sea level. The Columbia River John Day lock lifts 105 feet and is the deepest lock of its type in the nation. The Ice Harbor and Lower Monumental dams on the Snake River each lift 100 feet. In comparison, Mississippi River locks typically provide 10 to 25 feet of lift. Graphic courtesy of the Pacific Northwest Waterways Association. U.S. Army Corps of Engineers statistics.
“As I reflect upon my life on the river, I think of
the old river captains and pilots who opened the
wild Columbia. They had the vision to foresee
the potential of the river. They fought for the
development of the dams and navigation locks
that have given us slack water navigation from
Lewiston, Idaho, to the sea. Their incredible
skill and courage is an inspiration.”
— Captain Lewis S. Russell, Jr., past president
Tidewater Transportation and Terminals

50 Proceedings Summer 2016 www.uscg.mil/proceedings
Recognizing this, the USACE and Pacific Northwest Water-ways Association worked together to minimize the impact of the 2010 extended closure by rerouting container and fuel shipments. As the grain harvests had already flowed downriver into silos on the lower Columbia River, they were not impacted by the closure. A similar extended lock clo-sure is scheduled to begin in December of 2016, extending through early 2017.
Advantages of BargingAlthough the Pacific Northwest has a broad infrastructure of railroads and highways, barge transportation has sig-nificant advantages over other modes of transportation, including lower environmental impact and greater fuel and operational efficiency. According to the Pacific Northwest Waterways Association, as of 2015, a typical four-barge tow on the Columbia/Snake River system moves the same amount of cargo as 140 rail cars or 538 trucks, 2 and emission comparisons between barge, rail, and truck transportation show that moving products by barge results in fewer air pollutants. 3
Moreover, the existing barge transportation system has sufficient capacity — at a competitive cost — to meet peak demand. The sole constraint on the system is the need for dredging at the entrances to some terminals and parts of the navigation channel. 4
Looking AheadAt present, with 25 upriver grain elevators, the CSR sys-tem is the top wheat export gateway in the U.S. It’s also the
number-one West Coast wood and mineral bulk export gateway. 5 In expectation of increased sales in Asian mar-kets, more than $500 million has been invested in Columbia River grain export terminals, expanding export capacity from around 23 million tons to more than 50 million tons/year. 6
About the author: Ms. Jennifer Riddle has been with Tidewater as the company’s marketing and communications specialist and public information officer since 2014.
Endnotes:1. Institute for Water Resources, “Waterborne Commerce of the U.S., Calendar Year
2012, Part 4,” found at www.navigationdatacenter.us/wcsc/pdf/wcuspac12.pdf.2. Pacific Northwest Waterways Association graphics, 2015, found at www.pnwa.
net/wp-content/uploads/2012/11/CSRSFactSheet.pdf.3. National Waterways Foundation, “Highlights of ‘A Modal Comparison of Domes-
tic Freight Transportation Effects on the General Public: 2001-2009,’” February 2012, found at http://nationalwaterwaysfoundation.org/study/NWF_117900_2011WorkingForAmericaBrochure_FINAL_forWeb.pdf.
4. BST Associates, Lower Snake River Transportation Study Final Report. Bothel: June 2003. See www.americanrivers.org/assets/pdfs/lsr_transportation_study_final_reportb482.pdf.
5. Pacific Northwest Waterways Association graphics, 2015, found at www.pnwa.net/wp-content/uploads/2012/11/CSRSFactSheet.pdf.
6. Oregon Wheat, December 2014, Vol. 66, No. 6, found at www.owgl.org/wp-content/uploads/2011/07/12_2014_oregon_wheat_entire_issue_final.pdf.
For more information:
For more information, visit the Pacific Northwest Waterways Association at www.pnwa.net; the U.S. Army Corp of Engineers at www.usace.army.mil; Tidewater Transportation and Terminals at www.tidewater.com.
The McNary Locks, looking downriver. In the early 1930s, commodity transport via rivers in the Columbia River basin took a back seat to the railroads until the U.S. Army Corps of Engineers completed the Bonneville Dam in 1938, then the McNary Dam in 1953. Graphic courtesy of Tidewater Transportation and Terminals.
Barges can move one ton of cargo 576 miles per gallon of fuel. A rail car would move the same ton of cargo 413 miles, and a truck only 155 miles. Graphic courtesy of the National Waterways Foundation.

The M/V New Pacific navigates west on the Columbia River. U.S. Coast Guard photo by Petty Officer Levi Read.
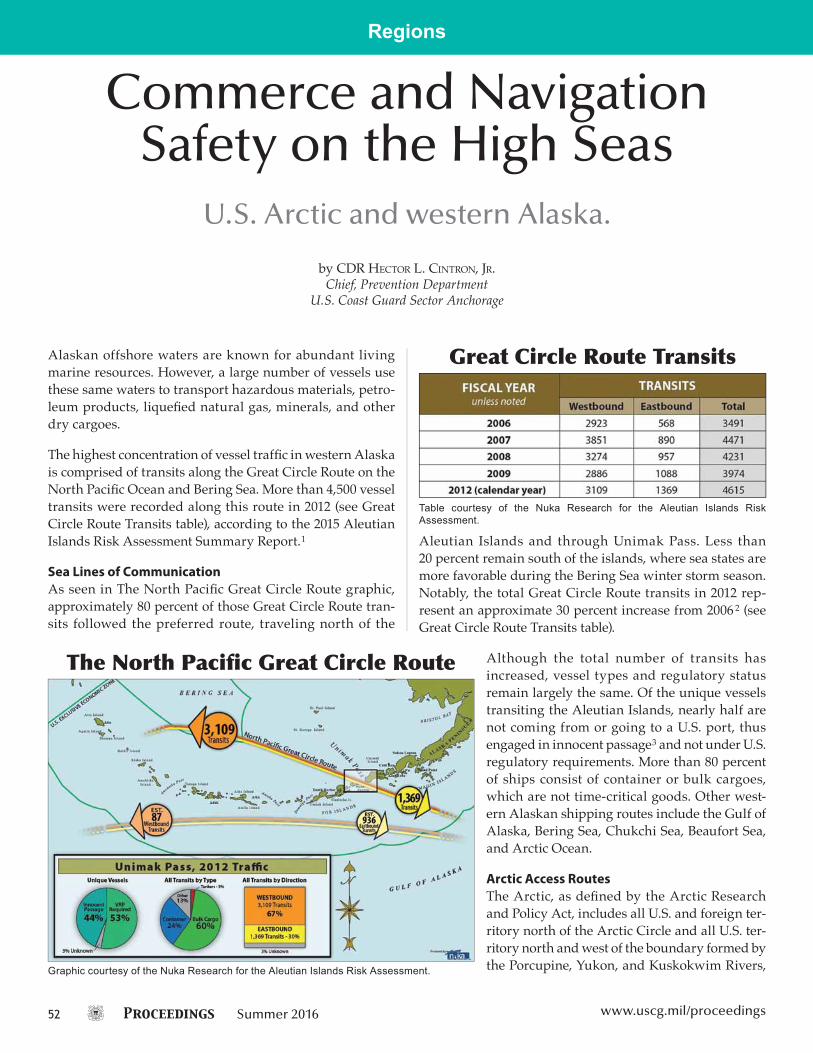
52 Proceedings Summer 2016 www.uscg.mil/proceedings
Aleutian Islands and through Unimak Pass. Less than 20 percent remain south of the islands, where sea states are more favorable during the Bering Sea winter storm season. Notably, the total Great Circle Route transits in 2012 rep-resent an approximate 30 percent increase from 2006 2 (see Great Circle Route Transits table).
Although the total number of transits has increased, vessel types and regulatory status remain largely the same. Of the unique vessels transiting the Aleutian Islands, nearly half are not coming from or going to a U.S. port, thus engaged in innocent passage 3 and not under U.S. regulatory requirements. More than 80 percent of ships consist of container or bulk cargoes, which are not time-critical goods. Other west-ern Alaskan shipping routes include the Gulf of Alaska, Bering Sea, Chukchi Sea, Beaufort Sea, and Arctic Ocean.
Arctic Access RoutesThe Arctic, as defined by the Arctic Research and Policy Act, includes all U.S. and foreign ter-ritory north of the Arctic Circle and all U.S. ter-ritory north and west of the boundary formed by the Porcupine, Yukon, and Kuskokwim Rivers,
Alaskan offshore waters are known for abundant living marine resources. However, a large number of vessels use these same waters to transport hazardous materials, petro-leum products, liquefied natural gas, minerals, and other dry cargoes.
The highest concentration of vessel traffic in western Alaska is comprised of transits along the Great Circle Route on the North Pacific Ocean and Bering Sea. More than 4,500 vessel transits were recorded along this route in 2012 (see Great Circle Route Transits table), according to the 2015 Aleutian Islands Risk Assessment Summary Report. 1
Sea Lines of CommunicationAs seen in The North Pacific Great Circle Route graphic, approximately 80 percent of those Great Circle Route tran-sits followed the preferred route, traveling north of the
Commerce and Navigation Safety on the High Seas
U.S. Arctic and western Alaska.
by CDR HECTOR L. CINTRON, JR. Chief, Prevention Department
U.S. Coast Guard Sector Anchorage
Regions
Graphic courtesy of the Nuka Research for the Aleutian Islands Risk Assessment.
The North Pacific Great Circle Route
Table courtesy of the Nuka Research for the Aleutian Islands Risk Assessment.
Great Circle Route Transits

53Summer 2016 Proceedingswww.uscg.mil/proceedings
Alaska; all contiguous seas, including the Arctic Ocean and the Beaufort, Bering, and Chukchi Seas; and the Aleutian chain.
Vessel transits in the Russian Arctic have varied from 41 ves-sels in 2011 to as many as 71 in 2013. The numbers went down to 53 in 2014, but the outlook is for an annual increase in vessels transiting the Northern Sea Route as Russian oil and gas production in the Arctic comes online and more products are shipped to Asia. 4
Similar to the Russian Arctic, Canadian traffic “over the top” is possible from June to November, depending on the movement of unpredictable ice in the Canadian archipelago. According to U.S. Coast Guard records, the first bulk carrier transited the Northwest Passage in 2013 under icebreaker escort. In 2014, the first bulk carrier made it across the Northwest Passage unescorted. In recent years, Northwest Passage transits have been on a downward trend.
As Arctic ice continues to recede, this trend is expected to reverse. 5 If melting trends continue, the idea of a transpolar route from Iceland to Anchorage, Alaska, seems feasible.
Bering StraitBering Strait traffic is mostly predictable. In general, ves-sels transit near the shoreline — Russian traffic on the Rus-sian side, U.S. and Canadian traffic on the U.S. side. Vessels traveling to the Red Dog lead and zinc mine near Kivalina, Alaska, typically transit to Asia and cross the Russian/U.S. boundary. In addition, mining resupply ships occasionally transit from Seattle, Washington, to the Pevek mine in the Russian East Siberian Sea.
Recent U.S. oil exploration in the Arctic boosted annual activity beyond the steady rise in traffic through the Bering Strait, peaking at 344 transits in U.S. waters alone in 2013. Although the number of transits through the Bering Strait dropped in 2014, total transits jumped to 540 in 2015. Vessel activity has the potential to increase due to Russian invest-ment in the Arctic and ecological pleasure cruise ship transits through U.S. waters. 6
Other Navigational ConcernsAlaska has more than 200 federally recognized Alaska native tribal governments. The same waters used for commercial navigation provide critical food resources for Alaska natives who rely on sub-sistence fishing and hunting for survival. Some subsistence journeys take Alaska natives as far as 50 nautical miles offshore in small open boats. For this reason, the U.S. Coast Guard works with
The Arctic boundary line. U.S. Coast Guard graphic.
Northwest Passage transits. In recent years, Northwest Passage transits have been on a downward trend, but as Arctic ice continues to recede, this trend is expected to reverse. U.S. Coast Guard graphic.
Kivalina, Alaska; and Pevek, Russia. U.S. Coast Guard graphic.

54 Proceedings Summer 2016 www.uscg.mil/proceedings
study with an expanded geographic scope and a proposed vessel routing system — an 816-nau-tical-mile-long by 4-nautical-mile wide, two-way vessel route in U.S. waters from Unimak Pass on the Aleutian chain through the Bering Strait. The routing system also has an extension toward Russia in the vicinity of St. Lawrence Island and four different 8-nautical-mile pre-cautionary areas. 8
Future FocusThe waters off western Alaska are resource-rich, often hazardous, and of immense impor-tance to maritime commerce and Alaska native subsistence. The U.S. Coast Guard is committed to ensuring safe navigation, collaboration with port stakeholders, and other initiatives. As ves-sel traffic continues to evolve in western Alaska, the U.S. Coast Guard will remain ready to be a part of sound solutions.
About the author:CDR Hector Cintron has served in the U.S. Coast Guard for 28 years. CDR Cintron has served in many capacities, most notably as the Prevention Department chief of Coast Guard Sector Anchorage, and has received five Coast Guard com-mendation medals, one joint service achievement medal, and four Coast Guard achievement medals, in addition to other personal and unit awards.
Endnotes:1. More information about the 2015 Aleutian Islands Risk Assess-
ment Summary Report is available at: www.aleutiansriskas-sessment.com/images/150313_AIRA_SummaryReport_vFI-NAL_hr.pdf.
2. Ibid.3. Innocent passage is the right of non-interference for a vessel tran-
siting inbound, outbound, or through a foreign territorial sea. For a vessel to enjoy this right, it must be engaged in “passage” that is “innocent.” “Passage” means a continuous and rapid traversing of the territorial sea, but may include anchoring in the course of ordinary navigation. Passage is “innocent” so long as it is not prejudi-cial to the peace, good order, or security of the coastal state. More information about innocent passage is available under Section 3 of the United Nations Convention on the Law of the Sea at: www.un.org/depts/los/convention_agreements/texts/unclos/unclos_e.pdf. With respect to the U.S. territorial sea, it means the waters, 12 nautical miles wide, adjacent to the coast of the U.S. and seaward of the territorial sea baseline, per 33 CFR 2.22.4. More information about Arctic vessel traffic off the coast of Russia is available
at the Northern Sea Route Information Office at: www.arctic-lio.com/node/229.5. The “10-Year Projection of Maritime Activity in the U.S. Arctic Region” report of
the Committee on the Marine Transportation System is available at: www.cmts.gov/Bulletin.aspx?id=87.
6. See www.ak-mprn.org.7. The U.S. Coast Guard will publish the draft port access route study via the Federal
Register with an additional comment period. Public comments are available by going to www.Regulations.gov, then searching for “USCG-2014-0941.”
8. Precautionary areas are “a routing measure comprising an area within defined limits where ships must navigate with particular caution and within which the direction of traffic flow may be recommended,” as defined by the National Oceanic and Atmospheric Administration. More information about precautionary areas in U.S. waters is available at: https://catalog.data.gov/dataset/precautionary-areas-in-u-s-waters.
federally recognized tribes and federal subsistence co-man-agement groups to coordinate planned operations that pro-mote safe maritime practices.
For example, in November 2010, the U.S. Coast Guard began a port access route study 7 of the Bering Sea and Bering Strait and solicited public comment on the need for a vessel rout-ing system in the region. Public comments overwhelmingly supported some form of vessel routing system, but cau-tioned that specific effects could not be determined until a vessel route was proposed.
Based on the public comments, the U.S. Coast Guard deter-mined the scope of the port access route study needed to expand, so they developed a proposed vessel route. In 2014, the U.S. Coast Guard reannounced the port access route
Port access route study routing measures. U.S. Coast Guard graphic.

55Summer 2016 Proceedingswww.uscg.mil/proceedings
The Remote Area Known as Western AlaskaWestern Alaska is an area where no roads lead, accessible only by boat or by plane from Anchorage or Fairbanks. It is an area where there are far more caribou than people, where polar bears still roam freely, where snow dominates the land and ice dominates the seas, and where a winter storm pro-ducing a 100-mph wind doesn’t get national news coverage as a hurricane.
It’s an area that TV viewers recognize from the show The Deadliest Catch, giving a glimpse of the environmental con-ditions mariners must endure to work on the waters to make a living. It is iced-in and inaccessible for six months, then ice-free for the other six months, allowing commerce a short and intense village resupply season.
We’re Not in Kansas AnymoreIt is an area where the oceans are lifelines for the villages, allowing marine solutions, trans-portation, and logistics company Crowley’s spe-cially built tugs and barges and highly trained crews to transit and resupply depleted fuel after a long winter of iced-in isolation.
It is a large area, extending from the Alaska peninsula on the Bering Sea side to the Cana-dian border in the Arctic Ocean; it is in this area that Crowley’s western Alaska fleet operates. The fleet has 180 days to deliver 50 million gal-lons of fuel before it retreats back south as ice begins forming again, isolating the communi-ties for another winter.
A Snapshot in TimeIt is day 70 of Crowley’s 180-day fuel deliv-ery season — another summer day in west-ern Alaska, and the fuel resupply season is in full progress. Many challenges lie before the
specialized fleet of shallow-draft tugs and combination fuel and deck cargo barges, a fleet charged each year with deliv-ering important fuel supplies on time to customers whose only other option is to fly the fuel in, which would be cost-prohibitive.
With seven tugs, 12 barges, and 48 crewmembers to get the job done, the stakes are high — more than 100 coastal and river communities and hundreds of customers within this geographical range all need fuel to keep their families warm during the winter and unleaded gasoline to help them sub-sist to survive. 1 The kicker: Almost none of these locations have charts or buoys to support navigation, nor do they have soundings to reference to ensure there’s enough water depth to operate.
Alaska Fuel DistributionSix months, 50 million gallons, 100 remote delivery locations.
by CAPTAIN GREG PAVELLAS Director, Marine Operations
Crowley Fuels
Regions
Graphic courtesy of Crowley.

56 Proceedings Summer 2016 www.uscg.mil/proceedings
Also taking advantage of the runoff, tug Toolik River heads toward the headwaters of the Kuskokwim River to deliver to McGrath, while the tug Rampart transits 178 river miles from Nenana on the Tanana River toward the operating area of the Yukon River to supply the local communities there.
Bristol Bay is coming alive as the commercial salmon fishing fleet amasses for the burgeoning sockeye salmon season. The tug Siku will join the fishermen in Bristol Bay for the next 45 days to support the fishing fleet with fuel and sup-plies.
Crowley’s first major supply of fuel has arrived via tanker in the Togiak region, and it’s time to start resupplying the tank farm in Bethel, the major hub in the area, on the Kuskokwim River. The U.S. Coast Guard has just recently finished plac-ing buoys in the Kuskokwim delta and lower river, marking the channel for the marine industry to safely navigate the Kuskokwim River to Bethel. Without these buoys mark-ing the controlling channel into the river, many operators
The Race to ResupplyCrowley’s specialized petroleum distribution lighter barges spread out along the coast in a northerly direction as the ice quickly recedes from the Norton Sound, an inlet of the Ber-ing Sea in the western part of the state.
Simultaneously, the company’s chartered tug-and-barge petroleum line haul supply arrives in the Bristol Bay area, loaded with fuel. The third (and last) river set is in Kotzebue, preparing for its first trip of 223 miles up the Kobuk River to resupply the villages there. The tug Aku is just preparing for its first trip because it winters above the Arctic Circle, where the ice is now just receding.
The Avik and her barge make a beeline for the village of White Mountain, on the Fish River in Norton Sound, to ensure they catch the first round of high spring tides and runoff in order to make their delivery to this isolated vil-lage. Without the components of tide and runoff, it would be unlikely to deliver there at all.
The Ikkat-class tugs Nachik and Sesok at the Bethel Tank Farm in Bethel, Alaska. Photo courtesy of Crowley by Michael Stanton.
The Crew The work schedule is another major challenge for Crowley and its mariners. When merchant mariners sign on, the company usually has some type of work schedule or time required to be out to sea versus time at home. Many tug companies o�er anywhere from 30 days on, 30 days o�, to 60 days on/60 days o�, with a total overall time of six months of work, and six months o� of work.
It doesn’t work this way for Crowley’s western Alaska �eet, whose mariners work six months straight and then have six months o�. The crewmembers do get a two- to three-week break sometime during the season to enjoy some summer activities with friends and family.
Working in this region is a big commitment for mariners and their families. It’s an inherently challenging job involving a long time away from home and family, and a long grind for these crews. However, the Arctic Ocean and the Bering Sea are among our last frontiers, so every day has the potential to bring once-in-a-lifetime experiences, such as observing migrating pods of whales or spotting beach-roaming polar bears.
“For me, the work schedule is fantastic. I work very hard for half the year, then I go home and play even harder for the other half.” — Kyle Erickson, mate in training
“The experience our deck officers have acquired through years of training and years spent learning the waters and nuances of western Alaska are the key to safely and successfully completing the job — just having a route into a village would spell trouble for anybody who thinks they could just input the route into the GPS and make it successfully.”
— Franky Merrigan, Tug Avik captain

57Summer 2016 Proceedingswww.uscg.mil/proceedings
with larger vessels would simply refuse to transit to Bethel. Even with the buoys placed, one of Crowley’s shallow-draft coastal sets will be used as a pilot boat to ensure a safe tran-sit. It will take three or four round trips to Bethel and about three weeks to resupply the tank farm that provides the heating fuel and unleaded gasoline the villages rely upon to survive through the winter.
Operational and Navigational ChallengesWith time and geography in mind, it’s easy to see the com-plexities of the logistics and coordination it takes to com-plete all deliveries to the villages ranging from Bristol Bay to Kaktovik (62 miles west of the Canadian border in the Arctic Ocean) in a 180-day period — all before the rivers freeze up and the weather becomes extreme and dangerous to the vessels and crews.
But this is only part of the story — one piece of the puzzle. There are many other challenges mariners face in western Alaska to get deliveries done safely, efficiently, and without incident.
Don’t Go Where the Seagulls WalkThe first major challenge is the lack of navigational charts, harbor charts, buoys, and soundings for a majority of the villages where we deliver. Crowley goes where most ves-sels have a “no go” zone marked on their charts (if they do, indeed, even have a chart) to get the fuel the last 100 feet to the beach. If we can’t deliver it the last 100 feet, the village can’t get the crucial resupply they require.
The majority of the routes we use have been handed down from past operators. Current vessel officers (who boast an average of 17 years of experience operating in western Alaska) constantly update them as river channels change and the coast shifts and erodes. Additionally, Crowley’s ves-sel crews regularly use a sounding skiff to lay out tempo-rary buoys and create GPS track lines on river crossings or coastal flats to identify where the water levels are low and to navigate difficult spots.
Using a sounding skiff is also a good way to identify whether saved routes from the prior year have changed due to ice
A Learning OrganizationOur success in Alaska has been attributed to the company’s collective ability to learn from its challenges and successes, incorporate lessons into its management system, and continually improve.
Some examples of the best practices we continue to build upon include:
✔ maintaining our American Waterways Operators responsible carrier program membership for manage-ment system guidance and external auditing;
✔ continual improvement of our vessel, cargo, and engi-neering manuals and processes;
✔ standardizing underway and simulated navigation assessments for deck o�cers;
✔ implementing corrective actions following near-misses, hazard recognition, and incidents;
✔ compiling village notes where port captains share route, hazard, and general village information;
✔ annual crew seminars providing regulatory and company training;
✔ annual testing and inspections for cargo hoses and equipment;
✔ participation in local and regional committees, such as the Cook Inlet harbor safety committee, Arctic Waterway committees, and Bering Sea Alliance committees;
✔ maintaining open communication with the local and regional Coast Guard to discuss regional and opera-tional topics.
Every fuel hose is hydro-tested and inspected annually to ensure hose integrity. Picture courtesy of Mr. Greg Gladieux of Alaska Rubber.
“The challenges that we face out on the water are daily and endless. It is a problem-solver’s dream job. We are constantly facing new challenges that require an extreme ability to adapt.”
— Kyle Erickson, mate in training

58 Proceedings Summer 2016 www.uscg.mil/proceedings
scouring or channels shifting from big spring run-offs, keeping vessels from unintentionally ground-ing during a transit. This “local knowledge” is then shared with other Crowley vessels.
Going DryOther challenges stem from the lack of dock infra-structure and port facilities. There are roughly 12 docks our vessels can tie up to with any type of port facility, and most of those are located in the Bristol Bay area. Once vessels get further west and north, only the larger hubs of Nome and Kotzebue have improved facilities and docks. This means that most vessel types can’t access these communities. Instead, Crowley’s crews either push to the beach or bank with the barge, or they double anchor at some locations to stay afloat, then float a hose to pump petroleum products to shore.
When vessels push to the beach, the crews have to plan transits carefully and monitor the tide, wind, weather, and more to remain safe while delivering. Typically, this means vessels transit the track line
Built for This Work
Crowley’s newest double-hulled lighterage barge under construction at the shipyard. Photo courtesy of Crowley by Captain Greg Pavellas.
The tug Avik skiff leads the way in the deep channel to the village of White Mountain, Alaska. Photo courtesy of Crowley by Bill Snider.
“These boats are designed to run shallow and operate where most vessels can’t. If we have water, we can continue to operate. Sometimes progress is measured in feet made even at .2 knots across the �ats, and sometimes we just run out of water and have to wait for more to come in to start moving again. The point is: This is what the area offers, so we have designed a system to operate successfully within the parameters we are given,” says Crowley’s Jeremy Grenville, captain.
Crowley’s latest class of vessels is the Ikkat-class tug, with “Ikkat” meaning “shallow” in the Alaskan Inupiaq language. Crowley built these vessels because the port infrastruc-ture simply doesn’t exist if repairs need to be made. Instead, crews can pull the vessels onto the beach to repair rudders and shafts, if need be, and then get back to work.

59Summer 2016 Proceedingswww.uscg.mil/proceedings
to the village during the highest tide of the day, continue to push to the beach while the water recedes, and then shut down the engines when there’s no longer enough water, going dry.
“Going dry” means the tug and barge sit on dry ground while the crew continues delivering the fuel to the village tank farm until the next high tide returns in approximately 24 hours. This is standard practice for the operators in western Alaska, as it’s the only way to get the job done in many locations.
The farther you head north from Norton Sound and into the Arctic waters, the less the tide becomes a dominant factor, but the more exposed the villages are to the weather ele-ments, especially now that the Arctic ice pack recedes to more than 200 miles offshore. 2 In the past, the ice pack remained much closer to the shore, helping to keep the swells down on the beach and prolonging the time the tug and barge could push to the beach. 3 In this area, there isn’t enough tide for the barge to go dry at all. The biggest challenge is to monitor the weather and be prepared to halt operations, clear the hose, and wait out the weather near the village.
Learning Through Experience Because we’ve been operating in this western area of Alaska for more than 60 years, we’ve adapted to the evolving times and have modified our delivery equipment to simplify the fueling process for a more efficient and safer operation.
The methods of pushing to the beach, double anchoring, and monitoring the changing weather conditions are often the only options to get the work done. This isn’t taught in any school. Rather, it is learned by being there, constant training, doing it, and then passing it on to the next genera-tion of mariners.
Our success in Alaska has been attributed to the company’s collective ability to learn from its challenges and successes, incorporate lessons into its management system, and con-tinually improve.
About the author:Captain Greg Pavellas started with Crowley in 1999 as a seaman. In 2003, he worked as a relief captain in the Bristol Bay region. In 2004, Greg outfit-ted the first of three of Crowley’s Ikkat-class tugs in Anacortes, Washington, then sailed as captain and chief mate. He went on to become the director of this group. Captain Pavellas started his maritime career with five and a half years in the Coast Guard, where he sailed on a 110-foot Island-class cutter as well as aboard the icebreaker Polar Sea.
Endnotes:1. There are at least two customers per village, according to Crowley’s database.2. Per U.S. National Oceanic and Atmospheric Administration ice charts.3. Historical U.S. National Oceanic and Atmospheric Administration ice chart data.
The Sesok and the double-hulled barge DBL 165-1 float hose in Russian Mission, Alaska. Photo courtesy of Crowley by Patrick Burns.
“There are many … things we try to do to improve our operations, but what it comes down to is to be socially responsible for the state we operate in, the customers we serve, and the people of Alaska. We are not only an industry partner in Alaska, but we are residents and stewards of Alaska as well.” — Pat Burns, Crowley port captain

60 Proceedings Summer 2016 www.uscg.mil/proceedings
However, the U.S.-flagged international fleet has declined steadily since the end of World War II. The U.S. oceangoing merchant marine fleet has declined by 82 percent since 1951, when the fleet peaked at 1,268 vessels. 1 At the end of 2014, the U.S.-flagged international fleet was down to 73 vessels. 2
There are multiple reasons for this decline in fleet size — the growth or rebuilding of other countries’ economies, the rise of flags of convenience, and the sale of American-owned shipping lines to foreign interests, to name a few. Holding on to remaining American vessels is a national security priority.
Cargo Preference LawsCargo preference is the reservation by law for transportation on U.S.-flagged vessels of all, or a portion of all, oceanborne cargo that moves in international trade either as a direct
result of the federal government’s involve-ment, or indirectly because of the financial sponsorship of a federal program or federal government guarantee. U.S. cargo prefer-ence laws are part of the overall statutory program to support the privately owned and operated U.S.-flagged fleet and mer-chant marine. (Note: This article does not deal with the Jones Act fleet, which are U.S.-flagged vessels trading within the United States and its territories.)
For U.S.-flagged operators operating in international trade, preference cargoes are the key incentive to remain under U.S. reg-istry, providing a vital cargo base to help offset foreign flag cost advantages.
On October 30, 2015, American Roll-on Roll-off Carrier (ARC)’s M/V Endurance moored at the port of Shubai, Kuwait, and discharged a mix of tanks, trucks, tractors, wreckers, fuel tanks, and cargo handlers to replenish stocks at Camp Arifjan. While Endurance is among the most militarily use-ful, multipurpose, and largest roll-on/roll-off vessels in the world, she is also one of a small number of commercial cargo vessels trading internationally in the U.S.-flagged fleet.
The U.S.-flagged international fleet today relies on several key policies devised to underpin a pressing national secu-rity need: having an American-flagged commercial fleet available for the military in a time of war. With such avail-ability, the military has American-owned and -crewed ves-sels to rely upon rather than counting on foreign vessels to support American aims.
Shifting TidesThe importance of holding on to the American-flagged commercial fleet.
by MR. CHARLES DIORIO General Manager
American Roll-on Roll-off Carrier
Regions
American Roll-on Roll-off Carrier’s M/V Endurance discharges U.S. Army cargo at Camp Arifjan, Kuwait. All photos courtesy of American Roll-on Roll-off Carrier.

61Summer 2016 Proceedingswww.uscg.mil/proceedings
The primary U.S. cargo preference laws are set forth in the Cargo Preference Act of 1904, the Cargo Pref-erence Act of 1954, and Public Resolution 17. The 1904 Act requires that 100 percent of all military cargoes purchased for or owned by U.S. military departments be shipped exclusively on vessels of the United States or belonging to the United States.
The structure of the Cargo Preference Act of 1904 applies to all supplies for which the military has contracted, including supplies to which it does not have title at the time of shipment. Congress’ over-riding purpose in creating this act was to protect and promote a sufficient merchant marine capable of providing sealift in time of war or national emer-gency.
The Cargo Preference Act of 1954 requires that at least 50 percent of civilian agency cargoes be trans-ported on U.S.-flagged vessels, and every depart-ment or agency is required to administer its pro-grams in compliance with the 50- percent minimum.
Public Resolution 17 requires that all cargoes generated by the U.S. Export-Import (Ex-Im) Bank be shipped on U.S.-flagged vessels unless the Maritime Administration grants a waiver. An example of this type of cargo would be when a foreign buyer purchases a fleet of fire trucks and arranges for a loan guarantee through the Ex-Im Bank.
U.S. cargo preference laws are crucial to the continued exis-tence of the active, commercially viable, privately owned U.S.-flagged commercial shipping fleet — the most cost-effective sealift capability available to the U.S. government. Proper enforcement by the Maritime Administration and vigilant adherence by the Department of Defense (DOD), Export-Import Bank, and other federal departments and agencies is critically important to the American interna-tional fleet and to the survival of the U.S. merchant marine.
In general, more than 90 percent of all overseas military equipment is shipped by sea because of the scale and scope of the cargo, and the cost efficiency of moving it by sea ver-sus by air.
The existence of a U.S.-flagged fleet ensures that the U.S. can implement any national security policy necessary without having to rely upon foreign nations.
The U.S.-flagged fleet is vital to U.S. national security, pro-viding essential sealift in peacetime and wartime, and the ships that carry these cargoes provide important jobs for American seafarers who are available in time of national emergency to crew the sizeable fleet of reserve government
vessels. By guaranteeing the availability of certain cargoes to U.S.-flagged ships, U.S. cargo preference laws ensure that the vessels and attendant intermodal systems, trained crews, and vessel service industries continue to exist and prosper.
Maritime Security ProgramThe Maritime Security Program (MSP), an amendment to the Merchant Marine Act of 1936, was first passed in 1996 and originally comprised a fleet of 47 U.S.-flagged, militarily useful vessels. 3 The program is a federal maritime financial sustainment program that provides for a fleet of modern U.S.-flagged and U.S.-crewed militarily useful sealift assets operating in international trade.
The MSP fleet enables the U.S. government to provide sealift for U.S. armed forces, utilizing the resources of the U.S.-flagged commercial fleet. In addition, the presence of a U.S.-flagged commercial fleet operating in international trade enables the government to pursue other economic and agri-cultural assistance programs overseas.
The MSP fleet provides a U.S. national security asset at a lower cost than the government owning and maintaining an equivalent capability. The MSP is critical to our nation’s ability to defend itself in time of war or national emergency, as it provides a framework where the U.S. government can utilize the active, commercially viable, privately owned U.S.-flagged commercial shipping fleet.
The Maritime Security Program provides its U.S.-flagged, ship-operating participants with a readiness retainer that helps to offset the relatively higher costs of flagging,
Vehicles wait to be loaded on an American Roll-on Roll-off Carrier vessel in Brunswick, Georgia.

62 Proceedings Summer 2016 www.uscg.mil/proceedings
Commercial FirstTo ensure the long-term renewal, recapitalization, and growth of the U.S.-flagged commercial fleet, the Department of Defense adheres to the longstanding policy of utilizing com-mercial transport as the most optimal and cost-effective means of provid-ing sealift support. National Security Directive 28, National Security Directive on Sealift, provides guidance on sealift transportation and requires DOD to use the commercial sector for sealift transportation to the maximum extent practicable when the commercial sector can meet operational requirements.
This policy also indicates that only to the extent that U.S.-flagged commer-cial vessels are unavailable will DOD rely upon its own vessels. First articu-lated in 1954 under the Wilson-Weeks
Agreement, a memorandum of understanding between the Departments of Defense and Commerce, this policy fur-nishes incentive for the U.S.-flagged industry to invest in shipping under the U.S. flag, promotes a sustainable sea-lift partnership with DOD, and serves as the backbone of a viable U.S.-flagged commercial fleet.
While the policy requires utilizing U.S.-flagged commercial carriers to the maximum extent practicable, it is important to balance the various components of sealift capacity — com-mercial, charter, and DOD-owned. The Department of Defense is required to, at least annually, determine the number of ships it needs to own or have under charter to meet its peacetime, contingency, and wartime projected requirements. The U.S. Transportation Command (TRANS-COM) also adheres to the policy of utilizing the U.S.-flagged commercial fleet to the maximum extent practicable, and to determine what other assets are necessary to carry out its mission when it is not possible to use U.S.-flagged com-mercial assets.
Current maritime programs are structured to function in a mutually beneficial manner through the Maritime Secu-rity Program and Voluntary Intermodal Sealift Agreement. Using these resources, TRANSCOM acquires access to global sealift from commercial sources using the privately owned U.S.-flagged vessels and intermodal networks of the U.S.-flagged ocean carriers at significantly lower cost than if those needs were to be met from DOD-owned resources. As a bonus, TRANSCOM is also able to avoid substantial up-front capital investment. However, though the MSP program
crewing, and operating a U.S.-flagged vessel. The program permits companies to re-flag foreign-built or foreign-flagged vessels less than 15 years old to U.S. registry, thereby provid-ing U.S.-flagged operators with the flexibility and increased efficiency to remain competitive in the international market-place. The program also requires all participating carriers to sign the Voluntary Intermodal Sealift Agreement (VISA), which sets forth obligations to the Department of Defense, specifying how the companies’ vessels and intermodal sys-tems may be utilized in support of U.S. national emergencies.
Funding for the Maritime Security Program is subject to the annual appropriations process. Congress authorized the current 60-ship MSP fleet on the basis that it was (and con-tinues to be) the most prudent, economical, and necessary solution to address the current and projected U.S. sealift requirements.
A key part of the MSP value proposition is the carriers’ net-work of global services. A study prepared for the National Defense Transportation Association (NDTA) by Reeve & Associates in August of 2006, The Role of the United States’ Commercial Shipping Industry in Military Sealift, indicated that the cost to the U.S. government to replicate the ves-sels provided for by the MSP is estimated at $13 billion. The study also noted that it would cost the government a fur-ther $52 billion to replicate the related global intermodal system provided by the carriers that participate in the MSP program. The sum of $186 million previously paid in total each year to the MSP participants seems moderately small, in comparison. 4
American Roll-on Roll-off Carrier’s M/V Freedom discharges U.S. Army cargo for NATO exercise Trident Juncture 2015.

63Summer 2016 Proceedingswww.uscg.mil/proceedings
is a far more cost-effective means of providing sealift than building new ships or recapitalizing the ready reserve force fleet, it is not alone sufficient to maintain the U.S.-flagged fleet without priority being given to U.S.-flagged commercial assets over DOD-owned assets to carry military cargoes. 5
A policy that seeks to utilize DOD-owned vessels on a pri-ority basis over U.S.-flagged commercial vessels may save a small amount of money in short-term freight rates, but will ultimately discourage U.S.-flagged carriers from enhancing their fleet or remaining in service. In the long term, com-mercial carriers will be forced to reduce service, while the U.S. government will be forced to spend huge sums activat-ing and chartering ships to cover for the missing commer-cial liner services and be forced to spend billions on future investment in organic assets and intermodal systems.
Therefore, the current U.S. policies to support the use of U.S.-flagged carriers wherever practicable should be enforced properly. Ultimately, these policies will ensure the govern-ment enjoys the longer-term cost benefits of leveraging the sealift and intermodal assets of U.S. carriers without sad-dling U.S. taxpayers with the costs of the government build-ing and operating their own fleet of commercial vessels.
Current StatusThe current state of the U.S.-flagged fleet is dire. The number of liner vessels in the international trading, U.S.-flagged fleet has declined from 151 in 1990 to 73 at the end of 2014, and these remaining 73 vessels are facing strong headwinds on preference cargo.
The end of major operations in Afghanistan and Iraq are the primary reasons for a major reduction in the amount of DOD cargo moved. The Export-Import Bank of the United States charter expired for a time in June 2015, and food aid is under attack from a variety of fronts. On a more positive note, Maritime Security Program stipends were recently increased to $3.5 million per vessel for 2016 and have been authorized at $5 million per vessel from FY 2017 through FY 2021. 6
In addition, the industry may face yet another round of con-solidations. The U.S.-flagged fleet went through this before in the 1990s when longtime American shipping companies, such as Sea-Land and American President Lines (APL), were bought by foreign companies — Maersk Line of Denmark and Neptune Orient Lines (NOL) of Singapore, respectively. In fact, APL/NOL is now the target of an acquisition by French container operator CMA CGM.
Future Issues U.S.-flagged international carriers depend on the Maritime Security Program stipend to help offset the additional costs
of flying the American flag. However, the industry is at a point where the current MSP stipend is not sufficient when combined with the drastically declining cargo base.
Various studies to examine the operating cost differential between U.S.-flagged vessels participating in the MSP and foreign-flagged vessels determined that when such factors as insurance, vessel maintenance and repair, total crew costs, and ship management are considered, U.S.-flagged vessel operational costs are approximately $5 million to $7 million more than the costs for equivalent foreign-flagged vessels. 7
These factors affect the ability of U.S.-flagged vessel oper-ators to reinvest in new U.S.-flagged ships. One way to counteract this is to extend the age of MSP eligibility out an additional five years. New ships are long-term assets, eligible to participate in the Maritime Security Program for 25 years. Most shipping lines operate vessels in a commer-cial capacity out to 30 years, and U.S. government reserve sealift assets are often operated to age 50 or older. There is little appreciable difference in the condition of an American vessel from 25 to 30 years. Most importantly, this would give the government five more years of MSP vessel usage at no additional cost to the federal budget.
A major benefit of extending the vessel’s useful age out to 30 years is the delay in replacing MSP tonnage. The sti-pend is meant to help defray the operating cost differential between the U.S. and foreign flags, but it does not cover the multi-million dollar investment costs that American ship-ping companies must make to purchase and bring ships into the U.S. fleet. Adding five years to the expected life of a new vessel acquisition makes the investment calculations more favorable for American shipping lines.
The commercial maritime industry, through the Maritime Security Program, is currently providing the DOD with 60 vessels and follow-on intermodal systems and networks at a cost of only $210 million to the taxpayer, or $3.5 million per ship in FY 2016. An increase in appropriations for the Maritime Security Program would provide the DOD this essential sealift capability at a cost of only $300 million, or $5 million per ship — still only a fraction of the estimated $65 billion that it would cost our government to replicate this capability. 8
Cargo preference volumes have declined precipitously in just the past few years. However, reductions in the size of the armed forces and continued closure of overseas bases all play a role in this downturn. The Maritime Administration calculated that government-impelled cargo fell from a high of 5.6 million tons in 1991 to 2.2 million tons in 2014, with the majority of the decline from DOD cargo. Military cargo is estimated to reach a nadir of 1 million tons per year in 2016. 9

64 Proceedings Summer 2016 www.uscg.mil/proceedings
the Korean War, and the Maritime Security Program follow-ing Operations Desert Shield/Desert Storm.
With Operations Enduring Freedom and Iraqi Freedom now in the rearview mirror, what is next for U.S. maritime pol-icy? As we encounter another change in the tide, the time for action is now — before the already-small U.S.-flagged fleet further shrinks. Strengthening the Maritime Security Program, both the vessel stipend and vessel age provisions, is a place to start.
About the author:Charles Diorio is a general manager at American Roll-on Roll-off Carrier. He is a graduate of the U.S. Coast Guard Academy and retired as a captain from the Coast Guard Reserve.
Endnotes:1. “Study of the Impediments to U.S.-Flag Registry Final Report,” Price Waterhouse
Coopers, September 20, 2011. 2. U.S. Maritime Administration, U.S. Department of Transportation, “A Report
to Congress — Impacts of Reductions in Government Impelled Cargo on the U.S. Merchant Marine,” April 21, 2015.
3. Maritime Security Act of 1996, Pub. L. No. 104–239 as amended (46 U.S.C. App. § 1171 et seq.).
4. National Defense Authorization Act for Fiscal Year 2013, Pub. L. No. 112–239, § 3508 (2013).
5. The ready reserve fleet provides a fleet of 46 vessels in reduced operating capacity.6. Consolidated Appropriations Act, 2016, Pub. L. No. 114–113.7. U.S. Maritime Administration, U.S. Department of Transportation, “Comparison
of U.S. and Foreign-Flag Operating Costs,” September 2011.8. The president’s “Budget for Fiscal Year 2017.”9. U.S. Maritime Administration, U.S. Department of Transportation, “A Report to
Congress — Impacts of Reductions in Government Impelled Cargo on the U.S. Merchant Marine,” April 21, 2015.
10. Fixing America’s Surface Transportation (FAST) Act, Pub. L. No. 114–94.11. Maritime Security Program Fleet (MSP) as of October 1, 2015, found at: www.
marad.dot.gov/wp-content/uploads/pdf/MSP-Fleet-10-1-2015-NEW1.pdf.
Additionally, Congress failed to reauthorize the Ex-Im Bank in June of 2015. This had the tangential impact of removing another cargo source from U.S.-flagged carriers. Reauthori-zation legislation was signed into law by President Obama on December 4, 2015. 10 However, at the time of this writ-ing, the Ex-Im Bank lacked a full complement of Senate-approved members of the board of directors in order to have the quorum needed to approve loans over $10 million.
The 60-ship MSP fleet was created in 2003 during a period of active warfare, and it remains to be seen if 60 ships can be maintained in peacetime. At the moment, there are two open slots of the 60 slots available under the MSP. 11 The fact that there are any open slots speaks to the perilous state of the fleet.
When M/V Freedom arrived at the port of Bilbao, Spain, on October 9, 2015, to discharge Army cargo to be used in the North Atlantic Treaty Organization’s Exercise Trident Juncture 2015, she was one of a small number of American vessels in the international trades. M/V Freedom and her 72 other U.S.-flag counterparts are on the brink of a new reality. The cargo preference laws and programs that have sustained them in the past may not be enough incentive to continue in the trade in the future.
The most important maritime policy planks have almost always been laid down in the immediate aftermath of the nation’s wars: the 1904 Cargo Preference Act following the Spanish-American War, the 1954 Cargo Preference Act and the Wilson-Weeks agreement following World War II and

65Summer 2016 Proceedingswww.uscg.mil/proceedings
A view of barges in low water on the Mississippi River. Normal water levels would allow more room for barge fleets and passing traffic. U.S. Coast Guard photo.

66 Proceedings Summer 2016 www.uscg.mil/proceedings
Fire Destroys Two Tank BargesA tank cleaning operation gone wrong.
by MS. SARAH K. WEBSTER Former Managing Editor, Proceedings
U.S. Coast Guard Public Affairs Specialist
U.S. Bureau of Reclamation
In this ongoing feature, we take a close look at recent marine casualties. We outline the U.S. Coast Guard marine casualty investigations that followed, which explore how these incidents occurred, including any environmental, vessel design, or human error factors that contributed to each event.
Article information, statistics, conclusions, and quotes come from the final, promulgated Coast Guard investigation report.
Lessons Learnedfrom USCG Casualty Investigations
Another Day at the DockOn April 24, 2013, a towing vessel moored two inland tank barges at a gas freeing marine facility in Mobile, Alabama, for contracted tank cleaning and gas freeing on all cargo tanks. The barges held approximately 11 barrels of residual product (460 gallons of natural gasoline — a flammable liq-uid and first distillation of crude oil).
The tank cleaning facility was hired by the inland tank barge owner to conduct what is commonly referred to in the industry as a “strip and blow.” The work order included the following steps:
• Secure barges and prepare equipment. • Open the vapor control system. • Open all cargo tank hatches and all deck hatches. • Prepare pneumatic fans and vacuum truck.• Start stripping, to include dropping and venting cargo
lines. • Finish stripping both barges and prepare for gas freeing.
On that morning, the facility person in charge (PIC) and the tank cleaning technician prepared for the tank cleaning and gas freeing operation. Between 1 and 2 p.m., the vessel PIC
In April 2013, workers from an oil spill removal company were conducting tank cleaning and gas freeing operations on two tank barges when a towing vessel pulled up to berth nearby. Flammable vapors entered inside the incoming tow-ing vessel’s engine room and ignited, starting a fire which ignited the flammable vapors around and inside the cargo tanks of the moored tank barges — causing the cargo tanks to explode.
The fire and explosions severely injured three persons, caused substantial dam-age to the towing vessel, and destroyed both tank barges.

67Summer 2016 Proceedingswww.uscg.mil/proceedings
The facility PIC and the tank cleaning technician also heard the towing vessel’s engines increasing in speed and tried to get the master’s attention. The towing vessel master attempted to shut down the main diesel engines from the pilothouse, but was unsuccessful. He then requested his deckhands to manually shut down the engines by closing the fuel supply lines. The deckhands activated the emer-gency shut-downs for the main diesel engines located on the main deck; however, despite their efforts, the engines kept on running.
and the tank cleaning technician opened all cargo tanks and hatches in preparation for residual cargo stripping using a vacuum truck and ventilation operations. After stripping operations commenced, flammable vapors escaped from all deck openings and hatches and started to accumulate on the deck of the barges as well as along the facility’s shoreline. The flammable vapors escaped at a natural rate for approxi-mately six hours before the workers installed mechanical blowers.
At approximately 8 p.m., another tank barge pulled up to dock at the facility to receive tank cleaning services on another day. The barge was about to moor next to the barges in service until the PIC guided them to the adjacent slip. After securing the barge, its towing vessel departed.
At around the same time, the facility PIC and the tank clean-ing technician completed residual cargo stripping and initi-ated operations to ventilate the atmosphere inside the cargo tanks. They connected two shoreside air compressors to six portable pneumatic fans placed on each barge.
Trouble Ahead, Trouble InboundBetween 8 and 8:30 p.m., the mechanical blowers started to fail. The tank cleaning technician attributed the failure to a loose air hose assembly connection. The facility PIC shut down both compressors to investigate the failure. At this time, another towing vessel arrived at the facility to drop off a radio technician and deckhand, mooring in between one of the tank barges in service and the tank barge that arrived earlier, awaiting service.
As the radio technician and a deckhand disembarked the towing vessel, the deckhand overheard the towing vessel’s master speaking on the radio — warning that the revolu-tions per minute of the vessel’s port main diesel engine were increasing uncontrollably.
Essential Procedures for Tank Cleaning Operations 1
1) Provide appropriate procedures and supervision:
a. Develop a facility operations manual consistent with applicable regulations and guidance.
b. Ensure facility and vessel PICs hold the required training and authorizations.
c. Prior to oil transfers and tank cleaning operations, complete declaration of inspection.
2) Avoid the simultaneous presence of a �ammable atmo-sphere and sources of ignition.
a. To control the �ammability of the tank atmosphere:
● Identify and continuously monitor the tank atmosphere.
● Flush and strip the cargo lines and tank bottom with water.
● Properly ventilate to reduce gas concentra-tions.
● Wash the tanks with water.
3) To control the presence of ignition sources:
a. Minimize the number and duration of other vessels alongside the operation.
b. Eliminate spark-producing tools and machinery.
Endnote:1. In completing its marine casualty investigation, Sector Mobile developed
the Essential Procedures for Tank-Cleaning Operations. Because facility operators must pay special attention to numerous key factors when devel-oping operations manuals that include tank cleaning, the application of these procedures will help responsible, compliant tank cleaning facilities to holistically consider risk factors consistent with regulations and estab-lished best practices. See the related marine casualty report of investiga-tion under Coast Guard MISLE Activity #4576288.
The fire.

68 Proceedings Summer 2016 www.uscg.mil/proceedings
proceeded to safety, aided the injured, and contacted emer-gency response agencies.
Within the next half-hour, local fire and police departments were dispatched to the scene. Coast Guard Sector Mobile watchstanders notified search and rescue assets and estab-lished a safety zone on the water surrounding the facility. First responders arrived and rendered aid to the injured.
At approximately 8:57 p.m., another explosion occurred on the tank barges, damaging nearby structures and first responder vehicles. Emergency responders evacuated everyone from the neighboring buildings and evacuated vessels within a one-mile radius. Coast Guard Sector Mobile personnel prohibited vessel traffic within the safety zone, closing the mouth of the Mobile River.
The barges continued to burn, and several explosions occurred over the next six hours. All told, three work-ers — one deckhand, one radio technician, and the facility PIC — sustained serious burn injuries. The fire also caused substantial damage to the towing vessel and destroyed both tank barges.
Investigation FindingsThe following morning, shortly after sunrise, the fire burnt itself out, and the Mobile Fire Department declared the area safe for responders. Sector Mobile’s pollution response and marine casualty investigation personnel attended the scene.
Investigators noticed a sheen and discoloration on the water’s surface in the barge slip. They soon found a 500- gallon die-sel tank turned upside-down on the edge of the pier and the prime mover engine on one of the barges destroyed, pouring its oily contents onto the dock.
Investigation personnel found the fire and explosions caused significant damage to both tank barges. All cargo tanks were ruptured or severely deformed, with deck plat-ing over two cargo tanks on each barge completely peeled over. One 90-foot section of deck plating landed on the shore facility more than 100 feet away. All cargo tank hatches and openings on the barges were found opened.
Investigators also found non-intrinsically safe (spark-producing) tools on the deck of the serviced barges, and mechanical blowers that remained on board were unbonded with incorrect bonding wire. Upon further investigation, they discovered the tank cleaning facility workers had not maintained adequate means of two-way communication with vessel operators.
Coast Guard investigators and the fire marshal examined the towing vessel that pulled into the dock for fire damage.
Shortly after, flammable vapors in the towing vessel’s engine room ignited, starting a fire that then spread back to the moored tank barges that were undergoing tank cleaning operations. The immediate surrounding area erupted into an explosion and fire. The fire ignited the flammable vapors around and inside the cargo tanks, causing the cargo tanks to explode, and flames engulfed both barges as well as the immediate area.
Abandon ShipThe two towing vessels at the facility sounded their general alarms and commenced emergency actions. The crew of the towing vessel that pulled up to the facility abandoned their vessel, while the crew of the tank barges now engulfed in flames disengaged their towing vessel from the barges and proceeded to safety. Shoreside and company personnel and the crew from the recently moored towing vessel quickly
Barge damage followng the fire and explosion. All images from the marine investigation report.
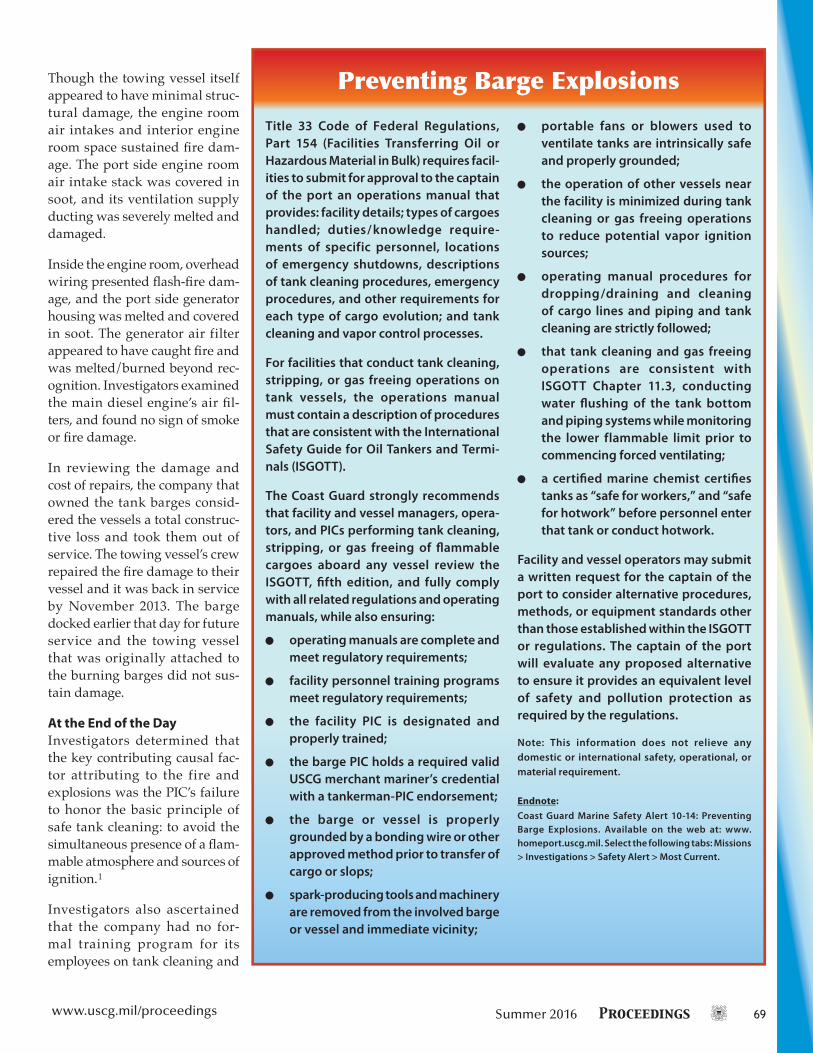
69Summer 2016 Proceedingswww.uscg.mil/proceedings
Though the towing vessel itself appeared to have minimal struc-tural damage, the engine room air intakes and interior engine room space sustained fire dam-age. The port side engine room air intake stack was covered in soot, and its ventilation supply ducting was severely melted and damaged.
Inside the engine room, overhead wiring presented flash-fire dam-age, and the port side generator housing was melted and covered in soot. The generator air filter appeared to have caught fire and was melted/burned beyond rec-ognition. Investigators examined the main diesel engine’s air fil-ters, and found no sign of smoke or fire damage.
In reviewing the damage and cost of repairs, the company that owned the tank barges consid-ered the vessels a total construc-tive loss and took them out of service. The towing vessel’s crew repaired the fire damage to their vessel and it was back in service by November 2013. The barge docked earlier that day for future service and the towing vessel that was originally attached to the burning barges did not sus-tain damage.
At the End of the Day Investigators determined that the key contributing causal fac-tor attributing to the fire and explosions was the PIC’s failure to honor the basic principle of safe tank cleaning: to avoid the simultaneous presence of a flam-mable atmosphere and sources of ignition. 1
Investigators also ascertained that the company had no for-mal training program for its employees on tank cleaning and
Preventing Barge Explosions
Title 33 Code of Federal Regulations, Part 154 (Facilities Transferring Oil or Hazardous Material in Bulk) requires facil-ities to submit for approval to the captain of the port an operations manual that provides: facility details; types of cargoes handled; duties/knowledge require-ments of specific personnel, locations of emergency shutdowns, descriptions of tank cleaning procedures, emergency procedures, and other requirements for each type of cargo evolution; and tank cleaning and vapor control processes.
For facilities that conduct tank cleaning, stripping, or gas freeing operations on tank vessels, the operations manual must contain a description of procedures that are consistent with the International Safety Guide for Oil Tankers and Termi-nals (ISGOTT).
The Coast Guard strongly recommends that facility and vessel managers, opera-tors, and PICs performing tank cleaning, stripping, or gas freeing of �ammable cargoes aboard any vessel review the ISGOTT, �fth edition, and fully comply with all related regulations and operating manuals, while also ensuring:
● operating manuals are complete and meet regulatory requirements;
● facility personnel training programs meet regulatory requirements;
● the facility PIC is designated and properly trained;
● the barge PIC holds a required valid USCG merchant mariner’s credential with a tankerman-PIC endorsement;
● the barge or vessel is properly grounded by a bonding wire or other approved method prior to transfer of cargo or slops;
● spark-producing tools and machinery are removed from the involved barge or vessel and immediate vicinity;
● portable fans or blowers used to ventilate tanks are intrinsically safe and properly grounded;
● the operation of other vessels near the facility is minimized during tank cleaning or gas freeing operations to reduce potential vapor ignition sources;
● operating manual procedures for dropping/draining and cleaning of cargo lines and piping and tank cleaning are strictly followed;
● that tank cleaning and gas freeing operations are consistent with ISGOTT Chapter 11.3, conducting water �ushing of the tank bottom and piping systems while monitoring the lower flammable limit prior to commencing forced ventilating;
● a certi�ed marine chemist certi�es tanks as “safe for workers,” and “safe for hotwork” before personnel enter that tank or conduct hotwork.
Facility and vessel operators may submit a written request for the captain of the port to consider alternative procedures, methods, or equipment standards other than those established within the ISGOTT or regulations. The captain of the port will evaluate any proposed alternative to ensure it provides an equivalent level of safety and pollution protection as required by the regulations.
Note: This information does not relieve any domestic or international safety, operational, or material requirement.
Endnote:Coast Guard Marine Safety Alert 10-14: Preventing Barge Explosions. Available on the web at: www.homeport.uscg.mil. Select the following tabs: Missions > Investigations > Safety Alert > Most Current.

70 Proceedings Summer 2016 www.uscg.mil/proceedings
revolutions per minute. These vapors most likely powered the engines after the crew manually shut off the fuel supply. Allowing the towing vessel to pull up and moor at the facility in such close prox-imity to the tank cleaning operations introduced an ignition source to an atmosphere with an already-high concentration of flammable vapors.
Environmental factors also contributed to this inci-dent. During the day and evening of the event, the wind speeds were calm to almost nonexistent. These conditions — coupled with the tank cleaning employees’ failure to employ proper tank ventila-tion procedures, the ensuing failure of the mechani-
cal blowers, and the flammable vapors generated during the tank cleaning operations — created a hazardous accu-mulation of flammable vapors on the deck and in the cargo tanks of the two barges, on the water’s surface, and at the facility.
The tank cleaning operation employees were not prop-erly qualified to do the job. Investigators found that the employees working at the facility, including the person in charge, did not hold a tankerman-PIC endorsement on a Coast Guard merchant mariner’s credential.
Therefore, the company’s failures to hire and train employ-ees with the correct certifications and knowledge resulted in the extensive release of flammable vapors. The resultant explosion and fire caused subsequent injury to the three workers, and contributed to the total destructive loss of two tank barges.
Acknowledgments:Proceedings would like to thank CDR Scott W. Muller, chief of the Inspection and Investigation Branch at U.S. Coast Guard District 5; and Mr. Ken Olsen, Office of Investigations and Analysis at USCG headquarters, for contributing to this story.
About the author:Ms. Sarah K. Webster is a public affairs specialist at the Bureau of Reclama-tion. She was previously the managing editor of the USCG Proceedings of the Marine Safety & Security Council magazine, a beat reporter for Micromedia Publications, and a news reporter and feature writer for Gannett Company, Inc. She has an M.A. in communication from Kent State University, a B.A. in communication from Monmouth University, and an A.A. in humanities from Ocean County College.
Endnote:1. The description of procedures for tank cleaning and stripping operations required
by 33 CFR §154.310 (a) (23) states: “Tank cleaning and stripping will be done in accor-dance with the International Safety Guide for Oil Tankers & Terminals, ISGOTT, Chap-ter 9. (Appendix 6).”
gas freeing operations, and failed to develop and enforce appropriate tank cleaning procedures consistent with Coast Guard regulations and best practices.
The company also failed to:
• provide properly trained and qualified oversight, • conduct cargo line and bottom flushing with water
before commencing forced ventilation,• monitor for flammable vapors,• use effective ventilation procedures,• prevent the introduction of ignition sources, including
allowing for other vessels to berth at its facility.
Lessons LearnedFailing to use water to first flush and strip the cargo pipes and tank bottoms of residual cargo before ventilating the tanks allowed an unsafe concentration of flammable vapors into the atmosphere. The concentration level of flammable vapors was so high that, when the vapors were absorbed into the approaching towing vessel’s engine air intakes, this actually introduced additional fuel to speed up the engine’s
Views of the two damaged tank barges from the starboard stern.

25 percent biodiesel. Any blend with greater than 25 per-cent biodiesel content would be considered a MARPOL Annex II cargo, and any blend with less than 25 percent biodiesel would be considered a MARPOL Annex I cargo, or oil.
As with any other flammable liquid, biodiesel must be carefully controlled when shipping. The flammable vapors generated must be dealt with safely, and electrical equipment in the hazardous areas of the ship must meet the electrical installation requirements for those areas.
What is the Coast Guard doing about it?The Coast Guard and the international community have robust regulations in place to ensure the safe transporta-tion of biodiesel. Both MARPOL and the IBC code have strict regulations on construction standards and safety requirements for the international carriage of oils or chemicals; 46 CFR Subchapter D also contains strict safety and construction requirements for the domestic shipment of flammable and combustible liquid cargoes.
There has been a recent push by some in the international community to reclassify biofuels as “MARPOL Annex I oil” instead of its current designation as a MARPOL Annex II chemical. Most of the emphasis for this change is on renewable diesel — not biodiesel — since renewable diesel has more chemical similarities to petroleum diesel oil.
About the author: LT Andrew Murphy has served in the U.S. Coast Guard for more than 8 years. He received a master’s degree in chemical engineering from the University of Rhode Island in 2014 and currently works as a staff engineer for the Coast Guard’s Hazardous Materials Division.
References:American Standards of Testing Materials Designation: D6751-12.National Biodiesel Board, Biodiesel Production Fact Sheet, www.biodiesel.org.Diesel Technology Forum, Renewable Diesel Fuels Fact Sheet, www.dieselforum.org.46 Code of Federal Regulations Part 30-39 (Subchapter D).International Convention for the Prevention of Pollution from Ships (MARPOL), Consolidated Edition, 2011.International Maritime Organization, 2011 Guidelines for the Carriage of Blends of Petroleum Oil and Biofuels, as Amended (MEPC.1/Circ.761/Rev.1), 1 February 2013.
What is it?Biodiesel, or fatty acid methyl ester (FAME), is derived from raw vegetable oil or animal fats and produced through a chemical process called transesterification. In the most common type of transesterification process, the oil or fat reacts with an alcohol in the presence of a catalyst (usually sodium or potassium hydroxide). The resulting products are biodiesel and glycerin.
If a fuel is identified as biodiesel, it should meet the speci-fications outlined in the American Society of Testing Materials Standard D6751. In a broader sense, biodiesel falls under the umbrella of renewable fuels, which also includes renewable diesel, but take note — renewable die-sel and biodiesel are two chemically different fuels, so the terms should not be used interchangeably.
While both are produced from vegetable or animal fat feedstocks, they are differentiated by the method of their production. Biodiesel is produced by transesterification, as described above, whereas renewable diesel is produced via hydrotreating or biomass-to-liquid conversion pro-cesses, the results being a fuel that is chemically similar to standard diesel.
Why should I care?Shipping Concerns:Domestically, biodiesel is shipped as a flammable and combustible liquid in bulk under 46 CFR Subchapter D (30-39). Internationally, it is shipped as a chemical under the International Code for the Construction and Equip-ment of Ships Carrying Dangerous Chemicals in Bulk (IBC) code entry “fatty acid methyl esters.”
Under the International Convention for the Prevention of Pollution from Ships (MARPOL), pure biodiesel is con-sidered a chemical and a MARPOL Annex II cargo. How-ever, the majority of biodiesel is shipped as a blend, com-bined with petroleum-derived diesel fuel. Under these conditions, depending on the ratio of biodiesel to petro-leum-derived diesel, the blend can be considered either a MARPOL Annex I or Annex II cargo. The International Maritime Organization issued MEPC.1/Circ.761/Rev.1, which set ratio limits at 75 percent petroleum diesel to
Understanding Biodieselby LT ANDREW MURPHY
Staff Engineer Hazardous Materials Division
U.S. Coast Guard
Ch
emical of th
e Qu
arter
71Summer 2016 Proceedingswww.uscg.mil/proceedings

72 Proceedings Summer 2016 www.uscg.mil/proceedings
Prepared by NMC EngineeringExamination Team
NauticalEngineeringQueries
NauticalEngineeringQueries
1. Large machines undergoing a resistance insulation testing using a megohmmeter should be discharged to remove any accumulated electrostatic/capacitive charge stored. When should this discharge be performed?
A. prior to conducting the insulation resistance check onlyB. while performing the insulation resistance check onlyC. after conducting the insulation resistance check onlyD. prior to and after conducting the insulation resistance check
2. The pump packing gland has been repeatedly tightened by small increments until the gland has bottomed. Which of the actions listed should be carried out next if the leakage continues to be excessive?
A. Replace all of the packing.B. Replace with larger cross-sectional turns of packing.C. Replace soft packing with packing turns that are covered with lead wrap.D. Continue to add more turns of packing.
3. In a medium-speed marine propulsion engine equipped with direct admission air starting valves, the cylinders without air starting valves fire first because the .
A. operation is under higher compression B. fuel is admitted only to these cylinders during cranking C. compression is released during starting by opening the exhaust valve D. cylinders are not chilled by the expansion of the starting air
4. The most troublesome corrosive substances in boiler water are oxygen and .
A. hydrogen sulfide B. sulfur dioxide C. carbon dioxide D. ammonia
Questions

73Summer 2016 Proceedingswww.uscg.mil/proceedings
Prepared by NMC DeckExamination Team
NauticalDeckQueries
NauticalDeckQueries
1. INTERNATIONAL ONLY: Which of the following statements is true when your vessel is moving from a berth alongside a quay (wharf)?
A. You must sound a prolonged blast.B. You must sound three short blasts.C. You must sound a long blast.D. No signal is required.
2. Which firefighting method is an example of an indirect attack on a fire?
A. spraying foam on a bulkhead and letting it flow down and over a pool of burning oilB. cooling adjacent bulkheads with water to prevent the spread of the fire by conductionC. bouncing a straight stream of water off the overhead to create spray effectD. flooding a paint locker with CO2 and sealing the compartment
3. When a buoy is in position only during a certain period of the year, where may the dates the buoy is in position be found?
A. in the Notice to MarinersB. on the chartC. in the Coast PilotD. on the Light List
4. What is the computed breaking strength of a 4-inch manila line?
A. 5,280 lbs.B. 7,700 lbs.C. 12,200 lbs.D. 14,400 lbs.
Questions

74 Proceedings Summer 2016 www.uscg.mil/proceedings
Answers
Engineering
1. A. prior to conducting the insulation resistance check only
Incorrect answer. While any accumulated electrostatic/capacitive charge stored must be removed prior to conducting the insulation resistance check, this is not the only time this discharge is performed.
B. while performing the insulation resistance check only
Incorrect answer. While performing the insulation resistance check, the machine windings and frame will accumulate an electrostatic/capacitive charge that must be removed after the comple-tion of the check.
C. after conducting the insulation resistance check only
Incorrect answer. While any accumulated electrostatic/capacitive charge stored must be removed after conducting the insulation resistance check, this is not the only time this discharge is performed.
D. prior to and after con-ducting the insulation resistance check
Correct answer. For reasons of safety and the prevention of erroneous megohmmeter readings, any accumulated electrostatic/capacitive charge stored must be removed both prior to and after conducting the insulation resistance check.
2. Note: To properly seal the shaft while performing lubrication and cooling functions, the correct number of properly installed packing rings of the correct type must be properly taken up to achieve the designed leak-off rate.
A. Replace all of the packing. Incorrect answer. Replacing an insufficient number of correct packing rings with an equal num-ber of correct packing rings will yield the same result: a bottomed-out gland with excessive leakage.
B Replace with larger cross-sectional turns of packing.
Incorrect answer. Replacing an insufficient number of correct packing rings with an equal num-ber of packing rings with larger cross-sectional dimensions will only substitute one problem for another: inadequate lubrication and cooling accompanied by insufficient leak-off.
C. Replace soft packing with packing turns that are covered with lead wrap.
Incorrect answer. Replacing an insufficient number of correct packing rings with an equal num-ber of soft packing rings with lead wrap will also substitute one problem for another: inadequate lubrication and cooling accompanied by scoring of the pump shaft.
D. Continue to add more turns of packing.
Correct answer. Adding more rings of the correct packing to augment an insufficient number of correct packing rings will properly seal the shaft while performing the necessary lubrication and cooling functions as long as the gland is taken up properly to achieve the designed leak-off rate.
3. Note: On V-type medium-speed diesel engines, typically only one bank of cylinders is fitted with air starting valves. A. operation is under higher
compressionIncorrect answer. Compression pressures are essentially the same for all cylinders, whether or not they are fitted with air starting valves.
B. fuel is admitted only to these cylinders during cranking
Incorrect answer. During cranking, fuel is admitted to all cylinders in the sequence of their fir-ing order.
C. compression is released during starting by opening the exhaust valve
Incorrect answer. During cranking, compression is not released by any means. The exhaust valves open toward the end of the power stroke, as they would normally when the engine is in operation.
D. cylinders are not chilled by the expansion of the starting air
Correct answer. Even though the compression pressures are essentially the same for all cylin-ders — whether or not fitted with air starting valves — those cylinders fitted with air starting valves would tend to have a lower final compression temperature due to the chilling effect of starting air. Therefore, those cylinders not fitted with air starting valves would tend to fire first.
4. Note: Corrosion within boilers may occur on the boiler firesides or watersides. Hydrogen sulfide and sulfur dioxide are troublesome corrosive substances that impact boiler firesides. Oxygen and carbon dioxide, on the other hand, are troublesome corrosive substances that impact boiler watersides. A. hydrogen sulfide Incorrect answer. Hydrogen sulfide, a byproduct of fuel containing sulfur, is a troublesome corrosive
substance present in boiler flue gas impacting boiler firesides corrosion patterns.B. sulfur dioxide Incorrect answer. Hydrogen sulfide, a byproduct of fuel containing sulfur, is a troublesome corrosive
substance present in boiler flue gas impacting boiler firesides corrosion patterns.C. carbon dioxide Correct answer. Carbon dioxide, a result of faulty deaeration and/or inadequate chemical treatment, is a
troublesome corrosive substance which forms carbonic acid, which can lead to carbon dioxide attack of boiler watersides and condensate systems.
D. ammonia Incorrect answer. Hydrazine is used as an oxygen scavenger that volatizes into ammonia in helping to maintain condensate and boiler water at the correct levels of alkalinity for corrosion control.

75Summer 2016 Proceedingswww.uscg.mil/proceedings
Answers
Deck
1. A. You must sound a prolonged blast. Incorrect answer.B. You must sound three short blasts. Incorrect answer.C. You must sound a long blast. Incorrect answer.D. No signal is required. Correct answer.
Reference: International Rule 34. The COLREGS do not require a vessel to sound any specific signal when leaving a dock or berth as required in Inland Rule 34(g).
2. A. spraying foam on a bulkhead and letting it flow down and over a pool of burning oil
Incorrect answer.
B. cooling adjacent bulkheads with water to prevent the spread of the fire by conduction
Incorrect answer.
C. bouncing a straight stream of water off the overhead to create spray effect
Incorrect answer.
D. flooding a paint locker with CO2 and sealing the compartment
Correct answer. Reference: Marine Fire Prevention, Firefighting and Fire Safety, Maritime Administration, page 202. “An indirect attack is employed when it is impossible for firefighters to reach the seat of the fire.” The incorrect choices represent a direct attack on a fire.
3. A. in the Notice to Mariners
Incorrect answer.
B. on the chart Incorrect answer.C. in the Coast Pilot Incorrect answer.D. on the Light List Correct answer.
Reference: Light List, Introduction, Other Short Range Aids to Navigation, page XV. “Seasonal aids to navigation are placed into service or changed at specific times of the year.”
4. A. 5,280 lbs. Incorrect answer.B. 7,700 lbs. Incorrect answer.C. 12,200 lbs. Incorrect answer.D. 14,400 lbs. Correct answer.
Reference: American Merchant Seaman’s Manual, Hayler and Keever, 17th Edition, pages 1-13. Where: B = Breaking strength of manila in pounds 900 is a constant. C = Circumference in inches B = 900 × C2 B = 900 × 42 B = 14,400 lbs.

COMMANDANT (CG-DCO-84)
ATTN: PROCEEDINGS
US COAST GUARD STOP 7318
2703 MARTIN LUTHER KING JR AVE SE
WASHINGTON, DC 20593-7318
Official BusinessPenalty for Private Use, $300
PRSRT STD
POSTAGE & FEES PAID
U.S. COAST GUARD
PERMIT NO.G-157