proceedings of'theworkshop on the prevailing … · ing declined from a range of22-70ugm (mean...
TRANSCRIPT
PROCEEDINGS OF'THE WORKSHOP ON
THE PREVAILING ACTIVITIES ON THE LAKE VICTORIA
BASIN WITH PARTICULAR REFERENCE TO THE
F'ISHERIES OF THE LAKE
Mwanza K-9 March, 1990
,/
•
1
THE PHYSIC~HEMISTRYOF THE NORTHERN WATERS OF LAKE VICfORIA.
By F.B. Bugenyi nd K.M. Magumba
INTRODUCfION
43
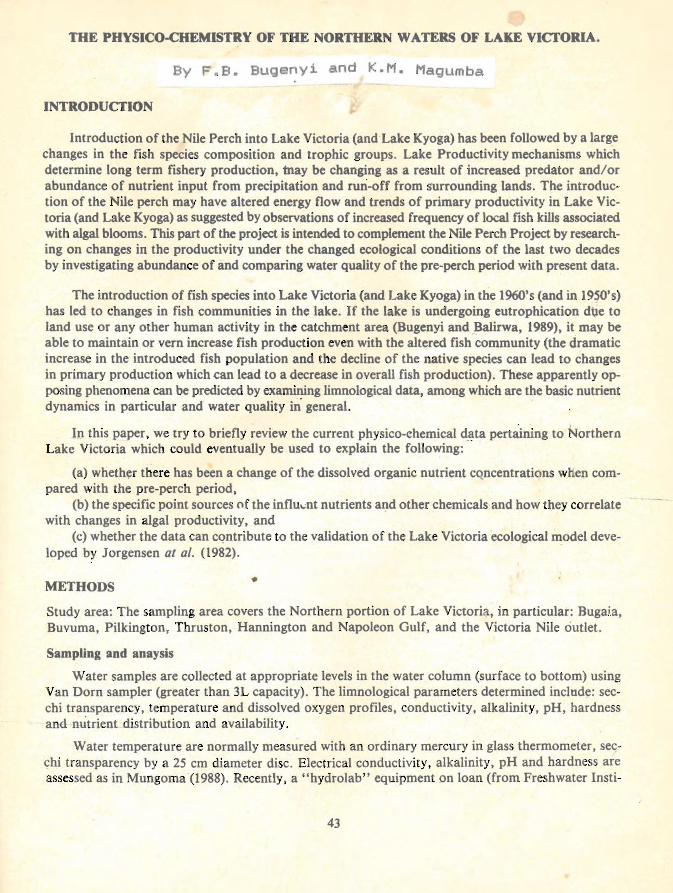
Introduction of the Nile Perch into Lake Victoria (and Lake Kyoga) has been followed by a largechanges in the fish species composition and trophic groups. Lake Productivity mechanisms whichdetermine long term fishery production, tnay be changing as a result of increased predator and/orabundance of nutrient input from precipitation and ruri-off from surrounding lands. The introduc~
tion of the Nile perch may have altered energy flow and trends of primary productivity in Lake Victoria (and Lake Kyoga) as suggested by observations of increased frequency of local fish kills associatedwith algal blooms. This part of the project is intended to complement the Nile Perch Project by researching on changes in the productivity under the changed ecological conditions of the last two decadesby investigating abundance of and comparing water quality of the pre-perch period with present data.
•METHODS
The introduction of fish species into Lake Victoria (and Lake Kyoga) in the 1960's (and in 1950's)has led to changes in fish communities in the lake. If the lake is undergoing eutrophication dtle toland use or any other human activity in the catchment area (Bugenyi andBalirwa, 1989), it may beable to maintain or vern increase fish production even with the altered fish community (the dramaticincrease in the introduced fish population and the decline of the native species can lead to changesin primary production which <:an lead to a decrease in overall fish production). These apparently opposing phenomena can be predicted by examining limnological data, among which are the basic nutrientdynamics in particular and water quality in general.
In this paper, we try to briefly review the current physico-chemical data pertaining to NorthernLake Victoria which could eventually be used to explain the following: --
(a) wheth~r there bas been a change of the dissolved organic nutrient cQncentrations when compared with the pre-perch period,
(b) the specific point sources of the influ""nt nutrients and other chemicals and how they correlatewith changes in algal productivity, and
(c) whether the data can cQntribute to the validation of the Lake Victoria ecological ~odel developed by Jorgensen at al. (1982) .
Study area: The sampling area covers the Northern portion of Lake Victoria, in particular: Bugaia,Buvuma, Pilkington, Thruston, Hannington and Napoleon Gulf, and the Victoria Nile outlet.
Sampling and anaysis
Water samples are collected at appropriate levels in the water column (surface to bottom) usingVan Dorn sampler (greater than 3L capacity). The limnological parameters determined inclnde: secchi transparency, temperature and dissolved oxygen profiles, conductivity, alkalinity, pH, hardnessand nutrient distribution and availability.
Water temperature are normally measured with an ordinary mercury in glass thermometer, sec9hi transparency by a 25 cm diameter disc. Electrical conductivity, alkalinity, pH and hardness areassessed as in Mungoma (1988). Recently, a "hydrolab" equipment pn loan (from Freshwater Insti-

tute of Winnipeg, Manitoba, Canada) has been used for insitu determination of temperature, pH,dissolved oxygen and conductivity. Other important mineral constituents are analysed under a cooperative programme on Lake Victoria bctwe n Uganda Freshwater Fisheries Research Organisation(UFFRO) and Freshwater Institute (FWI), Winnipeg, Manitoba, Canada, for analyses and as checksamples. Nutrients are analysed by a pectrophotometer according to methods of Stainton et. al. (1977)
RE~ lTS AND DISCUSSION
In Table I is displayed the morphometric, hydrological and physical data of Lake victoria, andits chemical composition compared to what it was during the pre-perch period is portrayed in Table
2. Since rainfall is the mojor source of nutrient input and water balance (Hecky and Bugenyi,1989) into the Lake. chemical c,omposition of rain and the lake waters are compared in Table 3.
The Lake Victoria basin i~ do~ed and an ancient one and it has endured different geological histories (Hecky 1984). Its size, tlOpical location, history anti hydrology create unusual, if not uniquebiochemical environments for thc productive 'nora and fauna which inhabit it. Paleolimnologicalstudies have lllJicated that the lake wa, closed in pre-historic times (Kanclall {')69). Haberyan 1988,Habclvan and Hecky, (987). It was greally r duced in area during the late Pleistocene, if not dry,and \Vd~ certainly more. aline than it i~ today (Kendall 1969, Stager 1984). It has a relatively shortflushillg'time (Volume/Outflow) of 140 years (compared to Malawi 750 years and Tanganyika 7,000year,). It is slowly flushed in comparison to most other world lakes
I he water c lumn is continuously in excess of noc and being in the tropics, high temperatureslead to high evaporative losses both in the watershed and the lake. The high evaporative loss in the\\ .\ter~hed and the lakes larg surface area make it extremely dependent on precipitation for its waterb.i1,lllCC (Table I) and nutrien incn1l1e Fv"norativ losse~ equal to or exceed precipitation.
II hough high temperatures allow rapid nutrient recycling, the annual cycle of nutrient concentl. ill! l!l in I he mi ed la ·er of the lake b controlh.:d probably by mixing and stratification (Hecky &Kllllg 1987, Talling 1966).
Lake Victoria is a dilute lake having the "commo "water type (Kilham & Hecky In3). It mixesthroughout its depths at least once annually (TaIling 1966). It has also the rainfall dominating its waterbudget Cfable I Fig.I). This, combined with the relatively short residence time make the lake quitedilute. Lake Victoria is one of the few lakcs in Africa for which the annual cycles of stratification,nutrient concentration and producti ity hav been determined (Taning 1966). In recent years, increasing internal ional attention has been focused on the lake a the fishery has been undergoing araelical transformation because of the success of introduced specie. (the Nile perch and Nile tilapia)which arc rcsrcctively a voracious predator and a herbivore. The e species now dominate the catchlJ I I he lake, 0 the near-cxdusion of the native sp 'cies (Ogutu-Ohwayo 1989; Coulter et a1. 1986). Therei~ cVldence that the nutrient chemistry of the lake has also changed. In particular, the Si concentrariom have declined by an order of magnitude in inshor waters (Table 2). Conditions in the offshorewaters are not fully known at present. In Fig.2 a,b, and c are the results comparing the profiles of(ondllctivil" Oissohed Oxygen (DO), pH a~d Temperature for the inshore areas: Napoleon andPilkingt n and for the offshore area, Bugaia. In the latter, stratification occurs at about 2 metersbelo'v\ ant! at ~O-32 meters deep, and for quite a stretch of depths there is complete mixing.
P con.ccnlrations have apparently not cflanged. The recent analyses fail within the same rangefound by Tailing (1966). The difference in sulphate concentration noted in (Table 2) is likely to be[he result of new more specifk and more precise analvtical methods. The new low results indicate

that Lake Victoria has remarkably low sulphate concentrations, probably the lowest of any large waterbody on earth. In this lake, sulphate is behaving as a nutrient and deserves serious consideration asa limiting nutrient for phytoplankton growth.
Nitrogen has g nerally been considered to be the most likely nutrient to imit phytoplankton growth(Tailing & Tailing 1965) in East African Lakes although there have been several demonstrations ofP limitation on the smaller lakes (Melack et al. 1982). Talling & Tailing (1965) cited the low nitrateconcentrations in Victoria in suggesting nitrogen as a likely limiting factor. Such an influence neglectsammonia~ (NH3) as a source of nitrogen as its concentrations ere not measured by TaIling & Tailing(1965). Remineralisation from dissolved organic compounds may be an important source (perhap.scomparable to the rainfall in magnitude of contribution) of the nutrients to support algal productivity in the short term. The physical mechanisms of the nutrient enrichment have been observed in LakeVictoria (Kitaka 1972). We have not yet determined/and or calculated the quantitative contributionfrom the bottom sediments.
Chlorophyl values 0 f 1-5 ug/l in the deep waters were reported by Tailing (1966) and the inshorevalues were 3-20 ug/l. The'same inshore areas now contain values of 13-71 ug/l, indicating muchhigher standing crops of algae. Ochumba & Kibaara (1989) observed the same high values (up to 77.6ug/l in the open waters of the Nyanza Gulf, Kenya. Dissolved Si data show the inverse pattern having declined from a range of 22-70 ugM (mean 69.80 ugM) during pre-perch period to a mean valueof 7.10 ugM today (Table 2). TI e decrease in Si is similar to, but even more extreme, than that observed in the Laurentian Great Lakes during their eutrophication (Schelske 1988). Tn these, increasedP loading was responsible for i depleti n because of the increased phytoplankton biomass. However,in Lake Victoria total P is evidently unchanged from 1961 to 1989. The P concentrations in 1961were certainly in excess of those required to support algal crops. The observed increase in chlorophyllconcentration in the lake must be attributed to an increa e in the supply of some other nutrients whichhave increased while Si has decreased and P remained nchanged. Both Nand S which are primarilysupplied from atmosphere contamination of East Africa from increased savanna burnihg may provide a mechanism for explaining the increased deposition of Nand S to Lake Victoria especialy withthe gradually increasing rainfall (Fig. I). An alternati e hypothesis would involve changes in trophicstructure in the lake after the introduction of Nile perch and Nile tilapia. If these changes have resulted in reduc~d herbivory and a disruption of the regeneration of Si becau"s of the elimination of keyfish species then similar water quality changes might result. The evidence for increased algal biomassis worrying because this would certainly iead to eutrophication which would lead to.increased oxygendemand in the lake's deep waters and decreases in the hypolimnetic volumes habitable by fish duringseasonal stratification. Work is still continuing to unravel and seek an explanation for the noted changesin the Lake Victoria ecosystem. (Bugenyi & Balirwa 1989).
ACKNOWLEDGEMENTS:
We wish to thank all UFFRO staff who have always helped us in t e sampling and analysis, inparticular Mr. L. Kibirige and Mr. F. Mugume. Similarly, we would like to register our appreciationto Mr. D. Mugerwa for typing the manuscript and guiding it aU through both the word and dataprocessors to the printer. Our thanks go to the FWT (Winnipeg, Manitoba, Canada) through Dr.R.E. Hecky for collaboration and strengthening of our Limnologicallaboratory in instrumentationand analysis. This work was carried out with the aid of a grant from the International DevelopmentResearch Centre, Ottawa, Canada.
45

-
REFERENCES:
Bugenyi, F. W.B. & J .S. Balirw" 1989. Human intervention in natural processes of the Lake Victoriaecosystem - the problem. In Solanki J. & S. Herodek (eds.) Conservation and management ofLakes. Symp. BioI. Hung. 38. Akademiai Kiado, Budapest. p311-34O.
Coulter, G.W., B.R. Allanson, M.N. Bruton, P.H. Greenwood, R.C. Hart, P.B.N. Jackson and A.J.Ribbink. 1986. Unique Env. Bio. Fish. 17: 161-184.
Haberyan, K.A. 1988. Phycology, sedimentoloty and paleolimnology near Cape Maclear Lake Malawi,Afr,ica. Ph.D. Thesis, Duke University, Durham, N.C. 246p.
Haberyan, K.A. & R.E. Hecky, 1987. The late Pleistocene and Holocene stratigraphy and paleolimnology of Lakes Kivu and Tanganyika. Paleo. 61: 160-197.
Hecky, R.E., 1984. African Lakes and their trophic efficiencies: a temporal perspective, p. 405-448.In D.G. Meyers & J .R. Strickler (eds.) Trophic interactions within aquatic ecosystems. AAASSelected Symposium 85.
Hecky, R.E. & F.W.B. Bugenyi, 1989. Hydrology and Chemistry of the African Great Lakes andWater quality issues: Problems and solutions. Paper presented at the "International Symposium on Resource Use and Conservation of the African Great Lakes", Bujumbura, 29 Nov.2 Dec. 1989.
Hecky, R.E. & H.J. Kling, 1987. Phytoplankton ecology of the Great Lakes in the Rift Valleys ofCentral Africa. Arch. Hydrobiol. Beih.25: 197-228.
Jorgensen, S.E., L. Kamp-Nielsen, L.A. Jorgensen & H.F. Mejer, 1982. An envir~nmentmanagement model of the Upper Nile lake system. ISEM Journal 4:5-72.
Kendall, R.L., 1969. An ecological history of la Lake Victoria basin. Ecol. Monogr. 39: 121-176.
Kilham, P & R.E. Hecky., 1973. Fluoride geochemical and ecological significance in East Africanwaters and sediments. Limnol. Oceanogr. 18:932-945.
Kitaka, G.E.G., 1972. An instance of cyclonic upwell~g in the Hydrobiol. Fish. 1:85-92.
Melack, J.M., P. Kilham & T.R. Fisher, 1982. Responses of phytoplankton to experimental fertilization with ammonium and phosphate in an African soda lake.
•Mungoma, S., 1988. Horizontal differential in the Limnology of a tropical river-lake (Lake Kyoga,Uganda). Hydrobiologia 162: 98-96.
Ochumba, P.B.O. & D.1. Kibaara, 1989. Observations on blue-green algal blooms in the open watersof Lake Victoria, Kenya. Afr. J. Eco!. 27:23-34.
Ogutu-Ohwayo, R., 1989. The decline of the native fishes of Lakes Victoria and Kyoga (East Africa)and the impact of introduced species, especially the Nile perch, Lates niloticus and the Nile tilapia, Oreochromis nilotieus. Environ. BioI. Fish. (In press).
Schelske, 1988. Historic trends in Lake Michigan silica concentrations. Int. Revue ges. Hydrobiol.73: 559-591. ~
46
I.

Table 1. Morphometric, hydrological and physical parameters of Lake Victoria.
Stager, J .C., 1984. The diatom record of Lake Victoria (East Africa): the last 17,000 years, p.455-476.In D.G. Mann (ed.) Proc. 7th Diatom Symp., Philadelphia, 1987.
Stainton, M.P., M.J. Capel & A.J. Armstrong, 1977. The Chemical analysis of freshwater. Fisheriesand Environment, Canada. Fi heries and Marine Service. Misc. special Publication No. 25. 180.
Tailing, J.F., 1966. The annual cycle of stratification and phytoplankton growth in Lake Victoria(East Africa). lnt. Revenue ges. Hydfobiol. 51:545-621.
Talling, J.F. & LB. Tailing, 1965. The chemical composition of African Lake waters. Int. Revue ges.Hydrobiol. 50:421-463.
•
2,760
184,000
68,000
-84
40
1,136
22 - 28
8.1 - 9.5
85 -120
20
20
100 (1002)
140
23
"Max depth (m)
Mean depth (m)
Volume (V) (km3)
Altitude (m)
Temperature (oq
pH
Flushing time (V10) (yr)
Residence time (VIR + 1) (y )
Conductivity (us cm-1
Outflow (0) (km3)
Inflow (1) (km3)
Rainfall (R) (km) (mm)
Lake Victoria
Catchment area (km2)
47

.J.[. - ...._~
"-
Table 2. Chemistry of Lake Victoria (Northern) in (a) pre-perch era (Talling & TaIling, 1965) and(b) currently (Henky & Bugenyi, 1989).
(a) (b)
Na (~M) 0.450 0.340
K " 0.097 0.090 f.
Ca " 0.140 0.120
Mg " 0.110 0.090
DIC" - 0.920
CI " 0.110 0.093
504 ., 0.024 0.003.
Alkalinity (me L-J) 0.920 0.840
Si (M) 69.80 7.10
N03 (M) 0.00 0.20
P04 (M) 0.42 0.23
Total P (M) 1.52 1.13
Conductivity (us cm-I ) 97 94
•
l:=
-:-;;::
•;; 48
{10.:

Table 3. Chemical composition of rain on to/and Northern Lake Victoria.
Parameters Rain Northern L. Victoria
pH i.9 -- 7.4 (7.3) 8.1 -- 9.5
Conductivity. us em:l 16 - 59 (43) 85 - 120
Alkalinity, ueq 1:1 85 - 144 (114) 780 - 855
DIC uM 1:1 130 - 230 (180) 855 - 1030
DOC uM 1:1 160 (205) 200 - 500
SRSi mg 1:1 0.215 - 0.400 (0.307) 0.02 - 0.760
SRP u~ 1:1 155 - 500 (327) 2 - 9
TOP ugr~1 155 - 530 (342) 6 - If)
N03 ug FI 1~5 - 272 (228) 5 -5
S04 Ulg FI 0.18 - 0.39 1.47
CI mg Fl 3.29 - 3.53 1.31
Na mg 1:1 0.37 - 0.46 (0.41) 7.59 - 9.50
Kmg n 0.70 - 2.09 ( .39) 3.14 - 5.60
Ca mg Fl \ 3.93 - 5.80 o.R5 '
Mg mg Fl 2.16 - 2.55 012
•
49

./ t
1 !iB7
Y.// ,
1./ /'...,
1/" ./ ri '.c""." ...,
""lIS,....'"
•. ' T
,. /' .- i r ' ..' ,
I ... " ,. -1 I." .' -1 1.-' ",1 -...J
....... .,1 yo., .. , V//I ..·.1
~ ..- ,,- ... ;., L" .1 ! f' ... ,,1 I ..- ~ ...
1_'- /'.01'1
19RC.
I I",-"JI \//./1 l .... '.,f./ ~ l' ... I I..,,, J ; ...·.f.... I., ,~. r -' ,'.;
LJ" .' ,-; \.' ."" ...... r \.... '-1 l,.I'
.' l"'~"/'f'".".;'r.·.,-. I//J
I.' I' " ...., t,..... r,l"'1 ,.' .' "...
/' J ,.. /" ..~ l ~ r /' ,. l , -' /' I t.r ,.., ,
/ I t •.- '-1
,r /' _~ 1/ /' ~
!<t,'"
I/" J ......
'iU!:'
(/,/ .., 1/'..-" 1
I" ~-i.~ .(::.~_-' "-:...L'-""C.L<'C.L/C;''-''~'''-'-''-''-''-''''-'~/~-'':''''.l.J_~4....1-..r~L.Jfee 1 9ft'i1
, ,.
__ oJ' .-
"" I' .. ·1
1990
Annual rainfall1980 - 191N
"
I.'
, " ,
.... '
Fig. 1: Annual Rainfall Record (1980 - 1989) 'and average annualrainfall by month (l9~3 - 1989) over Northern Lake Victoria.
Average annual rainla.u by month ~81 . 1989
1\,(."'".•.. ,-... - ..... ""V"\~_I ,,"",,:1 r_i..-. ...,:.~II :::.'/ ,'"Y""},................... l-....
•.~'! -----,
I .' I
r.C"T
1// )
( ..........,~ l./ .- ,r'/ .-1 r/ .... .'
1../ ../'J i> - ,r<'/ .-'1 ,.'./ ,"1
,./ .- , I / J
I......... ,. ./ A
t " ,., ~'7:::;.... ".J t/ ,/",
r ~;' ,--I r --/ ~·I "/..;1
r::r::Tl '/ .", J 1/ ~' i J/.-/ 1
..... /-A "'/.r1 .... ,·.A ,..' /,,1«'"....,~.l...L..r..:.L..l..r:"_~L.L .L~•.-:',.!. J..~•• L~ ••:.:: :
JU~ . tl.H. l\ U;~ 'iiF'r:.."'".."..
" ./ ..i v,;' ..,
1'- /1 j r"/'" • ./ V·,./.-I
) /' ..... , (.,/ .r/ ---:......,
If / I t/ ...·-.J V'''./ j
f / ......, " ,/ ~rl r" ",'" /1
{/ r.l I,/./,J v~'/)
r ,- .~l ./..-1 f" .'~ -'""
1/,/ I J/ /1 I ........ "" J
r-:::r-'?1 r ."1"",/ .~l ,.~ ,/,,4r;:7"'TJ J/' '...-j 1/ -' ! i.r /'~ 1/ ./ J
20 +' / ..:", ~ /~ V'/ /'1 V //1 V /'J1'l.L.L.l.....J...L,L·j ,£ r/r~L ,...-j
.!'>

Conductivity variation with depth
' ........
.-r--.----,..-----.--.-.--,--------''4' TO I~ \3 ,.. t~ lb
-,-1 ....
..
Do variation with .depth
..
f :~nQI l...-f-j,/,tv \/0 ... t"'ii(~.n \.Ivitn rt~0thf.!IL,'f' 7_?_q,r"'I
a!O;, +--~__-r-_
:::~ ~------,~-
'00 ~Ilia
H! ~
:: ~
--',
III
I
Of) v('Iriati","'l witr d;:>r,t h
MaPCJf~ aLl"', ""-"'-90-_.-----.- .
.'.... ~--.~-......,......~
". ,..Q..
k, ............. '-1I
:2 3 £ !I & .. II 10 12 13 ,£ "' '"~(f'T"l'
6.11
51
a
!J.n15.7.....B .•a.£..~•. 2 •
15.1S
£94B
4."....£O."-£4.3
"-24.1£+_......_--:,-- -,-_~-__.------~---.--r----,...---r-~
8

pH variation with depth
~ ...1
u~I
•.111I::It . ~.
•.e
8,1 .
IUI-l
II.tl -+------------- -.- --..-..----,--- -.u 11 I:"
•=
TemRerature variation with depth
20. "-r-' _.- -.. - -'--. ", .... )
I~l
I! all.. --e- '-J '- ...., ,., ",,,\ I \
~ " / ,.! _.~ • h---o' )'--_~'R'-f,",~.._"
II;ta/U -I
I101," I
u " .. ,." .. ,. '0 '2 '3 '4 ,to It,
S2

I'
'0
"
---- .. n·
"
..
\
\
\
...
.-_._-- ._----I
'.
\.
\" I", I
"'---<1>.. .....,-._...._._-.J
7
'\
6
l.
+i
.. ..__• .. __.__._-l
-,,·I'.;l. .....
).. " ..""~h (,-'"\
\.
'-,
'" ~'l' "_.- ~--..'. t 1-·
.,
• pH variation with tj·epH'f:':~ ~, '7-:3-'$'0. - _.__.....----_._------.--_._.~._-
Cc·r'l'::! ur:-t:ivity 'fC ric t i ~n I/vit"h r!"" !""+i-·PHk~ 1!JrTy, .,-::z-.~(\---_.....~ _._._--~.-.._-_.- ..--_..
--.--_.~-r------.,.-.12"
----.... ~-- - - --~._. -u,~
DO variotlon with depthPI"'.......... Bay. Y-:f--110
''';0 ·r--·-----·------··,"" +--._._--,
I . '-l\.'r "t "~'"
I".J \.~ 1
" .iI·:,U 'j
.JI
-.r; .i, \ I
<; I '" -~, I
,., • .1.... -.-_._.-----....,---.---. ... ...lo 1 "2 3' .. !II 5 ? "-I) ~ 1('1
Slo.:;I
9,4 .
".:18.2•..
.."i:.. ....
II.•
R.>
II.•
IUS....1!I:!
0
'" l- .J,
!i
" 'j
I
-. -I'" !.....:.l
I"" i,., j
I
I.. i
-l..
"
Q)
~~....8-e~ >.
C'll~ CQs::C'll s::~~o.s::~~0_ f1'
Clji; ~~ .... ~Co
";; "<Il"0 Q)
uS::J 0~ ....§ 0.U.DN
cO~
/ 53
- ----_.._-----

,•
i
i~-
" .
'--'
.._--~---..........,..
:z
TeMpe!'"ctu!'"e variation with ,'iepthP"l" ....,..,g,~ Bav. '7-~-~O
I
I.II
+----.,...-----,----,----,-----,----,---.--...'-,------;-----!II II ., .• .. '0
('
:17:M.a_,II2&,7:BUI3.11".4a.1
I••:1_..
lI......_,II••7
•••:III.••.4:Ill. II•.:1211. ,
2ft0
.:1 14 1. 1.
'3 I.. I. 1.'0 111
10 12
8
•II7II
II 7 II
QoooIh (Oft)
•
•
..
DO variation with ,depth" __ ....... 7-:1-110
I:I
:I
Conductivity variatIon with depthN~--. ..tf'. 7-2--=t
'Oil
10:Z
10'
'DO
f,U."II
'07
'UI
••• 4
.,.0
•
Fig.2C...
•••Conductivity, Do, pH and •.11
•. 7
Temperature prof1.les of off· •.....shore Bugaia •.4
••1III."..,
8 •...4..4.74.114..4. ..4.1I4.:14.,..
0
Sol

,f;
1~ 16
."
i--.,,--:l
, i
.., .- - .... :0.- .... ~\'.
_'I' - -
./ '.\ ,
b-~---o
II r
--~
·-r----r------·... -.---.,~.~..-.-:--- --r-" .._,. __.-.., a 1(1):( \.'1 1.1.-
.,.- --~,
\\ ,'~
\/ t J ,'1,· t i "It',
'-'
"o
•
r-- ------------j
~-_e--~
jLori---,----,----,----.,---,.---....,.----r---,---,---,.-----.-----'I~---
S 5 7 a ~ .~ t~ I&.
~ 'I
::t5
I e-tl"lf:'c:?'-"-lture \. '..,r·i.:Jtj()n ·.....,·jt-.h ,....:~.,rtr·;
,.. l-=-""I. Gul. .. -"2 ---;>-:.
g, 1ill ~ l?'r:, 1 '.,.,'0::' 1
I
~:L~,_~--~
2G
~"
! =~ e
tf~ ::S 1
'::'5,6
2tII"
5S