proceedings - institut für informatik · discussing objectives, problems, and results is part of...
TRANSCRIPT

5th
International Summer Workshop
on Multimodal Interfaces
eNTERFACE’09
Proceedings
Antonio Camurri, Maurizio Mancini, and Gualtiero Volpe
Editors


5th
International Summer Workshop
on Multimodal Interfaces
eNTERFACE’09
Casa Paganini – InfoMus, Genova, Italy July 13 – August 7, 2009
Proceedings
Antonio Camurri, Maurizio Mancini, and Gualtiero Volpe
Editors
http://www.infomus.org/enterface09/ http://www.casapaganini.org http://www.infomus.org

DIST – University of Genova ISBN: 13-978-88-901344-7-0

I
With the support of
EU ICT Project 215749 SAME (www.sameproject.eu)

II
eNTERFACE’09 Committees
Chairs Antonio Camurri Maurizio Mancini Gualtiero Volpe
Scientific Committee Massimo Bergamasco, Scuola Superiore S.Anna, Pisa, Italy Massimo Bertoncini, Engineering Ingegneria Informatica SpA, Italy Silvia Boi, Engineering Ingegneria Informatica SpA, Italy Roberto Bresin, KTH, Stockholm, Sweden Antonio Camurri, University of Genova, Italy Virginio Cantoni, University of Pavia, Italy Ginevra Castellano, Queen Mary University of London, United Kingdom Cristophe d'Alessandro, CNRS-LIMSI, Orsay, France Petros Daras, CERTH, Informatics and Telematics Institute, Greece Giovanni De Poli, University of Padova, Italy Thierry Dutoit, Faculté Polytechnique de Mons, Belgium Antonio Gentile, University of Palermo, Italy R. Benjamin Knapp, Queen's University, Belfast, United Kingdom Annie Luciani, ACROE, Grenoble, France Benoît Macq, Université Catholique de Louvain, Louvain-la-Neuve, Belgium Ferran Marques, Univertat Politécnica de Catalunya PC, Spain Anton Nijholt, Twente University, The Netherlands Igor Panzic, Zagreb University, Croatia Frank E. Pollick, University of Glasgow, United Kingdom Bulent Sankur, Bogazici University, Turkey Oliviero Stock, IRST, Trento, Italy Dimitrios Tzovaras, Informatics and Telematics Intsitute, Greece Vesa Välimäki, Aalto University, Espoo, Finland Jean Vanderdonckt, Université Catholique de Louvain, Louvain-la-Neuve, Belgium Hugues Vinet, IRCAM, Paris, France Gualtiero Volpe, University of Genova, Italy
Organising Committee Antonio Camurri, Roberta Fraguglia, Donald Glowinski, Maurizio Mancini, Barbara Mazzarino, Giovanna Varni, Gualtiero Volpe Casa Paganini - InfoMus, University of Genova

III
Preface
The eNTERFACE'09 workshop was organised by Casa Paganini - InfoMus, Department of Communication, Computer, and System Sciences (DIST) of University of Genova, Italy. The previous eNTERFACE workshops (www.enterface.net) had an impressive success and proved the viability and usefulness of this original workshop. eNTERFACE workshops have inspired competitive projects in the area of multimodal interfaces, have secured the contributions of leading professionals, and have encouraged participation of a large number of graduate and undergraduate students. eNTERFACE'09 at Casa Paganini - InfoMus continued this line of fruitful collaboration one step further. The ultimate goal of this workshop was to make this event a unique opportunity for students and experts to meet and work together, and to foster the development of tomorrow’s multimodal research community.
eNTERFACE’09 had a duration of four weeks and consisted of 8 projects covering several themes in the area of multimodal interfaces. A short report from each project, discussing objectives, problems, and results is part of these Proceedings. Participants included academicians, researchers, doctoral, and graduate students. The program also encompassed invited presentations by internationally renowned leaders in the field (Prof. Elisabeth André, Institut für Informatik, Universität Augsburg; Prof. Chris Chafe, CCRMA, Stanford University; Prof. Marc Cavazza, Teeside University), periodic plenary meetings with all the participants for sharing problems and results, informal seminars on selected topics by participants, and a presentation of the Casa Paganini – InfoMus research centre.
The workshop was indeed a very fruitful occasion of international collaboration for Casa Paganini – InfoMus, an International Centre of Excellence having since 2005 its premises in the recently restored monumental building of S. Maria delle Grazie La Nuova. Casa Paganini – InfoMus aims at cross-fertilizing scientific and technological research with humanistic and artistic research in the exploration of the relationships between music, science, and emerging technologies (e.g., in networked and user-centric media, embodied social networks, the Future Internet). Innovative multimodal interfaces and computational models of non-verbal human behaviour are at the core of its research activities in the direction of improved quality of life (e.g., therapy and rehabilitation, leisure, sport, edutainment), of novel industrial applications and services (e.g., innovative interfaces and multimedia applications), of contribution to culture (e.g., active experience of cultural heritage through new technologies). In this framework, the eNTERFACE workshop was a unique occasion for Casa Paganini to present on the one hand its research outcomes and activities to the scientific community and on the other hand to get inspiration and feedback for future work.
Organising eNTERFACE’09 was a huge effort, which was affordable only with the help of many people. In particular, we would like to thank Thierry Dutoit and the members of the eNTERFACE’09 Scientific Committee for the precious and wise suggestions, the local organising committee, and the whole staff of Casa Paganini - InfoMus for their precious help and the hard work.
Antonio Camurri, Maurizio Mancini, and Gualtiero Volpe eNTERFACE’09, Chairs

IV
Program
The Workshop is held daily at Casa Paganini from 13 July to 7 August, 2009, 9:30 a.m. - 5:30 p.m. in projects parallel sessions and includes the following joint events: Mon. July 13 2.30 p.m. Kick-off meeting: welcome speech and projects presentations
Thu. July 16 3 p.m. Prof. Dr. Elisabeth André Multimedia Concepts and Applications, Institut für Informatik, Universität Augsburg "Multimodal emotion recognition in artistic installations: Experiences and lessons learnt from the Callas project" Tue. July 21 3 p.m. Casa Paganini - InfoMus Lab staff Presentation of the Casa Paganini research center with demos Mon. July 27 3 p.m. Prof. Chris Chafe Director of The Stanford University Center for Computer Research in Music and Acoustics "Tapping into the Internet as a Musical / Acoustical Medium" Tue. July 28 9:30 a.m. Mid-term meeting (reports from projects)
Mon. Aug 3 3 p.m. Prof. Marc Cavazza University of Teesside, School of Computing "Relationship between affective interfaces, affective media content, and user experience" Fri. Aug 7 9:30 a.m. Final meeting (reports and conclusions from projects)

V
Table of Contents
D. Giakoumis, A. Vogiannou, I. Kosunen, D. Devlaminck, M. Ahn, A. M. Burns, F. Khademi, K. Moustakas, and D. Tzovaras Multimodal monitoring of the behavioral and physiological state of the user in interactive VR games ............................................................................................ 1
C. Frisson, L. Reboursière, W.Y. Chu, O. Lähdeoja, J. A. Mills III, C. Picard, A. Shen, and T. Todoroff Multimodal Guitar: Performance Toolbox and Study Workbench ............................. 16
D. Tardieu, R. Chessini, J. Dubois, S. Dupont, S. Hidot, B. Mazzarino, A. Moinet, X. Siebert, G. Varni, and A. Visentin Video Navigation Tool: Application to browsing a database of dancers’ performances ................................. 35
C. Mühl, H. Gürkök, D. Plass-Oude Bos, M. E. Thurlings, L. Scherffig, M. Duvinage, A. A. Elbakyan, S. Kang, M. Poel, and D. Heylen Bacteria Hunt: A multimodal, multiparadigm BCI game ............................................ 41
J. Kleimola, M. Mancini, G. Varni, A. Camurri, C. Andreotti, and L. Zhao A sensor pairing and fusion system for a multi-user environment ............................ 63
D. Glowinski, M. Mancas, P. Brunet, F. Cavallero, C. Machy, P.J. Maes, S. Passchalidou, M. K. Rajagopal, S. Schibeci, L. Vincze, and G. Volpe Toward a model of computational attention based on expressive behavior: applications to cultural heritage scenarios ................................................................ 71
J. Urbain, E. Bevacqua, T. Dutoit, A. Moinet, R. Niewiadomski, C. Pelachaud, B. Picart, J. Tilmanne, and J. Wagner AVLaughterCycle: An audiovisual laughing machine ............................................... 79

VI

�
Abstract— This is the eNTERFACE 09 Project 1 final report.
Within this project two experiments were conducted using the
same experimental setup. This consisted of a VR “Labyrinth”
game and a biosignals monitoring system. The first experiment
aimed to compare gameplay features and challenges with
“purely” technical game parameters like graphics and sound. The
second experiment focused on the identification of
psychophysiological and behavioral correlates of the changes in
the user’s affective state during repetitive tasks in HCI. During
the workshop, 21 subjects played different versions of the VR
game repeatedly, while their EEG, EMG, ECG and GSR signals
were monitored. Features were extracted from the collected data
and analyzed. Statistically significant correlation to the ground
truth data was found for some of the extracted features.
Index Terms— Biosignals, Multimodal Monitoring, Affective
Interfaces, Virtual Reality, Immersion, Drowsiness, Flow
I. INTRODUCTION
HE application of Virtual Reality methods and tools into a
variety of research fields and commercial solutions is a topic
receiving large interest recently. The major benefit of virtual
environments is the ability to easily immerse users into
controlled simulations and monitor their behavior according to
various parameters, which is otherwise difficult or even
D. Giakoumis, A. Vogiannou are with the Informatics and Telematics
Institute Centre for Research and Technology Hellas, 6th Km Charilaou-
Thermi Str. 57001 Thermi-Thessaloniki, Greece and the Aristotle University
of Thessaloniki ([email protected], [email protected] )
K. Moustakas and D. Tzovaras are with the Informatics and Telematics
Institute Centre for Research and Technology Hellas, 6th Km Charilaou-
Thermi Str. 57001 Thermi-Thessaloniki, Greece ([email protected],
I. Kosunen is with Helsinki Institute for Information Technology Pilotti
Building, Mets�nneidonkuja 4, 02100 Espoo, Finland ([email protected])
D. Devlaminck is at the Department of Electrical Engineering, Systems
and Automation of the Ghent University, Technologiepark 913, 9052
Zwijnaarde-Gent, Belgium ([email protected])
Minkyu Ahn is with Information and Communication Dept. in Gwanju
Institute of Science and Technology, South Korea. ([email protected])
A. M. Burns is with the M2S Laboratory, UFR APS, Université de Rennes
2, avenue Charles Tillon, CS 24414, 35044 Rennes (anne-
F. Khademi is with the Industrial Dept.in Tarbiat Modares University,Iran.
impossible to implement. These systems usually involve
different modalities that need to robustly operate in real-time
under the restrictions and the specifications of the same setup.
The evaluation of the user experience in Virtual Reality
applications is a subject receiving much interest for at least 10
years now. The term presence [1], which generally refers to the
sense of “being” into a virtual world, is now considered as a
reliable measure of the level of immersion in VR worlds, even
though there has been a long discussion among experts about
the methods that can be used to quantify presence [2]. In the
literature, these methods refer to questionnaires and semi-
structured interviews [3], biofeedback information [4] and
behavioral observations [5] during VR related tasks.
Regarding the evaluation of gaming experience, the same
methods have been recently employed in a similar manner in
order to extract some initial indicative results [6][7].
However, the role of presence in typical games is not as
significant as in VR systems since most video games are
usually played in PCs and therefore the level of immersion is
rather limited compared to the use of complex VR setups with
HMDs, Caves and real-time tracking. On the contrary, what is
of high interest in games is the level of entertainment and/or
fun that the player experiences and not at which level s/he feels
that the virtual environment is real. Therefore, new approaches
have been introduced to describe the gaming experience and
usually include immersion as one of the factors that affect the
user [8][9]. The most notable of them is flow [10][11] which
refers to a balanced feeling between frustration and boredom
as the game progresses. Despite the fact that game flow is
well-defined, the methods used to measure flow are primarily
based on questionnaires and interviews [10] which are known
to have a subjective bias [2].
Moving towards more objective methods for the assessment
of the user experience, the development of automatic affect
recognition systems based on features extracted from the
user’s monitored biosignals has attracted much attention
recently. During the last years, several important attempts have
been made towards this direction [37]. However this research
area is still in its infancy and one may say that is still an under-
explored field. Regarding video games, the development of
systems that are able to assess affective states related to flow
would be of great importance. A pre-requisite for the proper
development of such systems is the extraction of appropriate
Multimodal monitoring of the behavioral and
physiological state of the user in interactive
VR games Dimitris Giakoumis, Athanasios Vogiannou, Ilkka Kosunen, Dieter Devlaminck, Minkyu Ahn, Anne
Marie Burns, Fatemeh Khademi, Konstantinos Moustakas, Dimitrios Tzovaras
T
Proceedings of the 5th International Summer Workshop on Multimodal Interfaces - eNTERFACE'09
1

Figure 1. Project Overview
features from monitored biosignals, which correlate to the
player’s actual affective states of interest. These features can
then be used in order to train appropriate classifiers, able to
effectively classify the player’s affective states.
Contribution: The main objective of this project was to
work towards the development of a multimodal system for
evaluating the level of immersion in games and VR
applications and for measuring the psychophysiological impact
of the gaming experience to the player. Special attention was
paid on the transition of the user’s affective state from an
initial enjoyment - excitement to loss of interest -
“drowsiness”, caused from repetitive tasks during HCI.
II. PROJECT OVERVIEW
During the eNTERFACE 09 workshop, two experiments
were conducted, forming a single experimental session for the
recording of biosignals from different modalities while
subjects were playing a 3D labyrinth game. As shown in
Figure 1, Electromyogram (EMG), Electrocardiogram (ECG),
Galvanic Skin Response (GSR) and Electroencephalogram
(EEG) were used to continuously monitor the state of the user.
From the recording of these signals, the Project’s Biosignals
DB was populated. Using this DB, several features were
extracted from the signals of each modality and analyzed, with
the aim to identify correlations between them and the actual
affective state of the subjects. The ground truth regarding the
actual affective state of the subjects while playing the labyrinth
game was formed from the analysis of the project’s
questionnaires, filled in by the players during the experimental
session (Appendix A).
III. MONITORING FRAMEWORK MODALITIES
As shown in Figure 1, the project’s monitoring framework was
based on the following biosignal modalities:
A. EEG
Electroencephalography (EEG) is the recording of electrical
activity along the scalp, produced by the firing of neurons
within the brain. Until now, lots of BCI systems have been
developed on the basis of Electroencephalography, however,
EEG has not been widely used for the assessment of the human
affective state.
According to [20] there is one EEG measure that can be
used to quantify one of the emotional dimensions. This
particular dimension corresponds to the approach and
avoidance behavior. Researchers discovered that this state can
be quantified using frontal alpha asymmetry. Other works
[17][18][19] investigating attention in human EEG relate alpha
power changes with the level of attention in a target-response
paradigm. Also, an increase in low frequencies and a decrease
of high frequencies seems to be correlated with drowsiness as
reviewed in [21]. Changes in theta rhythm seemed to be more
prominent in the frontal regions while changes in alpha rhythm
are more generalized. The use of ratios of theta, alpha and beta
for assessing alertness was suggested by the authors of this
work. Based on relevant findings already reported in the
literature, in our study we considered several features extracted
from the EEG modality, in order to identify statistical
correlations between them and the changes in the actual
subject’s affective state.
B. ECG
For the purpose of our experiments, we used the ECG
modality in order to extract features regarding the subject’s
Heart Rate Variability (HRV). Heart Rate Variability
describes the variations between consecutive heartbeats. The
regulation mechanisms of HRV originate from sympathetic
and parasympathetic nervous systems and thus HRV can be
used as a quantitative marker of autonomic nervous system
[27]. Stress, certain cardiac diseases, and other pathologic
states affect on HRV. Furthermore, features reflecting the
HRV have already been used together with features derived
from other modalities in a number of studies targeting
automatic emotion recognition like [32] and [33]. A good
review of physiological origins and mechanisms of HRV can
be found in [28]. Generally, HRV analysis methods can be
divided into time-domain, frequency-domain, and nonlinear
methods.
The time-domain parameters are the simplest ones,
calculated directly from the RR interval time series. These are
Proceedings of the 5th International Summer Workshop on Multimodal Interfaces - eNTERFACE'09
2

the time series produced from the time intervals between the
consecutive “R-peaks” of the raw ECG signal. The simplest
time domain measures are the mean and standard deviation of
the RR intervals (IBI – Inter-beat Intervals). The standard
deviation of RR intervals (SDNN) describes the overall
variation in the RR interval signal.
In the frequency-domain analysis, power spectral density
(PSD) of the IBI series is usually calculated. Methods for
calculating the PSD estimate may be divided into
nonparametric [e.g. fast Fourier transform (FFT) based] and
parametric [e.g. based on autoregressive (AR) models]
methods. The commonly used frequency bands for HRV are
very low frequency (VLF, 0-0.04 Hz), low frequency (LF,
0.04- 0.15 Hz), and high frequency (HF, 0.15-0.4 Hz). The
most common frequency-domain parameters include the
powers of VLF, LF, and HF bands in absolute and relative
values, the normalized power of LF and HF bands, and the LF
to HF ratio. In our study, we extracted features from the IBI’s
time and frequency domains in order to examine their
correlation to the user experience and affective state
transitions.
C. GSR
Galvanic Skin Response (GSR), also referred to as
Electrodermal activity (EDA), is a measure of skin
conductance, which can be seen as an indirect measure of
sympathetic nervous system activity [12]. The outer level of
skin is highly resistive while the deeper layers of skin are
highly conductive. These levels are “connected” by sweat
glands, that when opened, create a pathway from the surface of
the skin to the deeper, conductive level of the skin [13]. There
are two kinds of sweat glands, apocrine and eccrine. Apocrine
glands are the glands found in, for example, arm pits, and are
what people normally consider as sweat glands. Eccrine glands
are the most interesting ones, and are thought to correlate with
sympathetic nerve activity. Eccrine glands are found around
the body, but typical locations for practical measurements are
the soles of the feet and the palms of the hand.
EDA measures the amount of skin conductance, which is
positively correlated with eccrine gland activity which in turn
is correlated with sympathetic nerve activity. These eccrine
glands respond only weakly to certain level of heat (the normal
sweating) and strongly to psychological and sensory stimuli.
The sweating to psychological stimuli has sometimes been
termed “arousal” sweating. There are two main types of
fluctuations of EDA that occur with stimulation: the
momentary phasic responses and the more stable tonic level.
GSR has been connected to “arousal” but the exact meaning
of arousal is somewhat fuzzy. Some define arousal as the
general increased activation of Sympathetic Nervous System.
Some conceptualize it as “as something that describes the
intensity of an experience but not its quality”. Because EDA
has been associated with several psychological processes, it
has been criticized as not being a clearly independent measure
of any particular psychological process [14].
In this study, we extracted a set of features from the GSR
modality in order to identify correlations to the player’s
experience and affective state changes. As an initial hypothesis
regarding “GSR and drowsiness”, we have considered arousal
to be diametrically opposed to boredom, but this definition of
course cannot be absolute. For example, it is unclear whether
the orienting response of EDA can be seen as indication of
lack of boredom.
D. EMG
EMG stands for electromyography. It is the study of muscle
electrical signals. Muscle tissue conducts electrical potentials
similar to the way nerves do and the name given to these
electrical signals is the muscle action potential. Surface EMG
is a method of recording the information present in these
muscle action potentials. Various signal-processing methods
can be applied on raw EMG [29]. The most commonly used
ones are based on the time-domain analysis of the rectified
averaged or the RMS of the raw EMG signals.
There are many applications for the use of EMG. EMG is
used clinically for the diagnosis of neurological and
neuromuscular problems. It is used diagnostically by gait
laboratories and by clinicians trained in the use of biofeedback
or ergonomic assessment. EMG is also used in many types of
research laboratories, including those involved in
biomechanics, motor control, neuromuscular physiology,
movement disorders, postural control, and physical therapy.
Moreover, EMG has been used several times to study
expressive aspects of emotions in HCI [30]. For example,
Partala & Surakka [30] studied the effects of affective
interventions. They recorded facial EMG responses from the
zygomaticus major and corrugator supercilii muscle sites, that
control smiling and frowning.
Moving away from facial electromyography, in our
experiment, we tried to explore the evolution of the
coordination of the player’s muscles responsible for moving
the mouse through trials and time. Our initial hypothesis was
that the coordination between the agonist and antagonist
muscles would change through trials and this could be
indicative of changes in the user’s affective state, when
combined with features derived from the other modalities
used.
IV. THE VR LABYRINTH GAME
A basic 3D labyrinth game was developed for the purposes
of the project’s experiments. In order to complete the game,
the players had simply to find the exit.
Figure 2. Screenshot of the game version 1 (Graphics)
Proceedings of the 5th International Summer Workshop on Multimodal Interfaces - eNTERFACE'09
3

The player could walk through the mazy corridors of the
labyrinth using a 3D first person camera which is controlled by
the WASD/Arrow keys and the mouse, a standard method in
commercial games. The game was developed in C++ using
OGRE [34] for graphics, OpenAL [35] for sounds and the
Bullet physics library [36] for physics simulation. The tests
were performed on a Laptop PC with an Intel Core 2 Duo
[email protected] CPU, 2 GBs of RAM and a NVIDIA
GeForce 8600M GT graphics card. The game ran steadily on a
60 frame/sec rate.
Figure 3. Screenshot of the game version 2 (Gameplay)
Figure 4. A «hole» game trap
Three different versions of this basic labyrinth game were
developed. The first, Graphics version (Figure 2) displayed
advanced real-time graphic techniques such as parallax
mapping, dynamic lighting and particle effects (rain), as well
as sound effects (footsteps, raindrops). However, this version
lacked of any kind of gameplay features, leaving the player to
just find the exit after wandering for a short time in the
labyrinth. On the other hand, the second, Gameplay version
(Figure 3) used much simpler graphical techniques but
contained distinct gameplay features such as a time limit and
death traps (Figures 4, 5) that would enable the user to think
more while playing and have a more intense experience in
order to win the game. The differences between versions 1 and
2 are summarized in Table 1. The third version developed
combined the “low” features of the two previous games,
namely low graphics rendering and a complete lack of
challenges. This version was used to induce boredom after
several repetitions,
Figure 5. A «ball running towards the player» game trap
TABLE 1
DIFFERENCES BETWEEN THE TWO GAME VERSIONS
Game Feature Version 1
(Graphics)
Version 2
(Gameplay)
Advanced graphics YES (parallax
and bump
mapping,
dynamic lighting)
NO
Sound Effects YES (footsteps,
raindrops)
NO
Particle Effects YES (rain) NO
Game Challenges NO YES (traps)
Time Limit NO YES (10 mins)
Checkpoints (if the
player dies, she/he
restarts from the
last checkpoint)
NO YES
Estimated time to
finish game
1-2 mins ~5 mins
V. EXPERIMENTAL SETUP
The experimental setup was based on the project’s
biosignals monitoring system and the three different versions
of the same labyrinth game developed. The project
experiments along with the experimental setup used are
described in this section.
A. Project Experiments
Two different experiments based on the same setup were
conducted, focusing on different aspects of the VR experience:
1) Experiment 1
Experiment 1 focused more on the evaluation of the
importance of gameplay features and challenges in comparison
with the purely technical game parameters like graphics and
sound. The aim of this experiment was to evaluate the gaming
experience of a player in two different versions of the same
Proceedings of the 5th International Summer Workshop on Multimodal Interfaces - eNTERFACE'09
4

game, our developed 3D labyrinth. Besides the standard
questionnaire based surveys that have been used in the past to
define structural game characteristics and their effect to the
gaming experience, this experiment employed psycho-
physiological analysis from biofeedback information. Our goal
was to provide a first quantitative result in the long debate of
the game industry: “graphics vs gameplay?” which can be
taken into consideration when designing commercial or
educational games.
2) Experiment 2
In this experiment we tried to identify psychophysiological
correlates of the human affective state of reduced attention and
loss of concentration during human-computer interaction. One
great challenge of affective computing is for computer systems
to be able to identify whether the user has lost interest in the
interaction, and thereafter adapt the interaction context
properly in order to draw the user’s attention again. A major
cause of reduced attention and concentration is repetition;
when a computer-system user is repeating the same actions
again and again, it is very possible that s/he will lose interest in
the interaction context, and thus stop paying attention to it.
This can even become a very dangerous situation, when for
instance referring to safety critical systems.
In the future, computer systems have to be provided with the
ability to identify whether the user has lost interest and is not
paying the required attention to the interaction. In this context,
Experiment 2 was based on the concept of “repetition that
causes loss of interest”. In our particular situation, the subjects
were asked to play the same simple (labyrinth) game
repeatedly until they got tired of it and bored. By measuring a
set of different biosignals (EEG, ECG, GSR and EMG) and
monitoring their evolution through time during the
experimental session, we tried to identify correlations between
features extracted and the affective state of drowsiness,
reduced attention and loss of concentration as reported in the
questionnaire by the subjects.
B. Hardware setup
1) Sensors
For the purpose of the project’s experiments we used:
a. Two three-electrode EEG sensors placed on the Fp1 and
Fp2 positions of the 10/20 System (Figure 6).
Figure 6. EEG electrode placement
b. One three-electrode ECG sensor placed at the subjects’
forearms, or in cases that the subject had very low
cardiac pressure, on its chest (Figure 7).
Figure 7. ECG electrode placement
c. One two-electrode GSR sensor placed at the subject’s
ring and small fingers (Figure 8).
Figure 8. GSR electrode placement
d. Two pairs of autoadhesive Ag/AgCl bipolar surface
electrodes (bandwidth 10-500 Hz, pickup surface 0.8
cm2, inter-electrode distance 2 cm), to record the
muscle activity of “Abductor Policis Longus” and
“Flexor Carpi Ulnaris” (Figure 9).
Figure 9. EMG electrode placement
2) Biosignals Monitoring Devices
The biosignals’ monitoring system was mainly based on the
Procomp5 Infiniti device. In particular, 2 EEG, 1 ECG, and 1
GSR sensors were connected on it. Furthermore, a second A/D
device was used for the recording of the signals derived from
the two EMG channels used (Figure 10). Both monitoring
Proceedings of the 5th International Summer Workshop on Multimodal Interfaces - eNTERFACE'09
5

devices were connected at the same PC. This was a Laptop PC
with an Intel Core 2 Duo [email protected] CPU, 2 GBs of
RAM, a NVIDIA GeForce 8600M GS graphics card and
Windows Vista Home Premium edition. The synchronization
of the measurements was based on a custom-made application,
while the two different PC’s were synchronized on the basis of
the Network Time Protocol (NTP).
Figure 10. The Project’s Biosignals Monitoring Devices
C. Experimental protocol
Experiments 1 and 2 were performed during a unique
session due to the time required to install correctly the sensors
on the subject. The entire experiment lasted for one to one and
a half hour, half an hour of it being devoted to the sensors
placement. Subjects were consequently advised to be ready for
a one and a half hour session without possible interruption due
to the cables linking them to the monitoring devices and
computers. All subjects were informed that they could stop the
experiment at any point without any consequences or
questions, however every subject completed the entire
experiment.
Initially, the subjects were asked to sign a consent form, to
certify that they were not having any medical problem that
could prevent them from taking part in the experiment and to
specify if they were left or right handed. After that, one of the
experimenters would start to install the sensors on the subject
while another experimenter helped the subject to complete the
pre-questionnaire. The purpose of the pre-questionnaire was to
collect personal data on the subject and on his/her previous
experience as a gamer for experiment validation purposes
only.
Once the sensors were placed, the subjects were asked to
relax with eyes-closed for one minute in order for the signal to
stabilize (rest session). After this point, three reference
captures were performed. The subjects would watch a boring
and an entertaining movie for 2 minutes with a relaxation
pause of 1 minute between the two movies in order to acquire
some calibration data for drowsiness/boredom and attention.
One of the movies displayed a fixed cross (boring movie)
while the other movie contained first person scenes of extreme
sports (interesting movie to elicit attention). The movies did
not contain music in order to exclude emotions that could be
induced from it.
In order to draw the subject’s attention effectively we
compiled the interesting movie on our own. This was a movie
that none of the subjects had ever seen before as was done in
[16]. We did not use the standardized database of pictures [15]
as the pictures included were not rated for interest/alertness
and are especially used to elicit emotions. Additionally,
according to [16] subjects did pay less attention to pictures
than to movies. The movie database given in [22] did rate the
movies according to interest/alertness, however we were not
able to download and use this database.
The two videos were presented in altered order between
subjects; ten watched the attention movie first and eleven the
boring one. The "data acquisition session questionnaire"
served to confirm that the movies induced the desired emotion
to the subjects.
The third reference capture was related to the calibration of
the EMG signal recorded. For this purpose, the effect on the
EMG of maximum isometric contraction to the left and to the
right of the right wrist of the subject was measured at this
point. This data was needed in order to normalize each
subject’s actual EMG signal, recorded while moving the
mouse during playing the labyrinth game.
After all these measurements and another period of
relaxation, the subject would start experiment one. Subjects
were only informed on the way to control the game and on
their objective to find the exit of the labyrinth; this information
was also provided at the game start. Subjects would play either
the Graphics or the Gameplay version of the game first. Eleven
subjects played the Graphics version first and ten the
Gameplay one. After each trial, subjects were asked to fill in
the mid-trials questionnaire and to relax for one minute before
starting the next game.
Once experiment one was completed, the subjects were
presented with a third version of the game displaying low
graphics and no challenges. After a period of relaxation, they
would play the game repeatedly taking time to fulfill the
questionnaire and one minute of relaxation between each trial.
The experiment continued until the subject had played a
minimum of ten trials and had signaled its boredom in the
questionnaire at least two times in a row.
At the end of the two experiments, ten subjects were asked
to play the Gameplay version again with the instruction to do
the best time possible. This was done in order to observe if
their inexperience with the game had influenced their first trial
and if playing the challenging game again would reduce their
amount of boredom. All subjects were also asked to fulfill the
post-questionnaire, which was used for the collection of their
impression on the entire experiments.
VI. DATA ANALYSIS
A. Subject Statistics and behavioral analysis
The experiments were performed on 21 subjects chosen
among the participants of the eNTERFACE'09 summer
workshop held in Genova, Italy from July 13th to August 7th
2009. Participants were from universities of seventeen
different countries mostly from the European Union but also
from North and South America, Asia and the Middle East
Proceedings of the 5th International Summer Workshop on Multimodal Interfaces - eNTERFACE'09
6

countries. Most participants were computer scientists or
worked in the computer arts, media or technologies domains.
Therefore, all participants frequently used computers in their
work. Subjects were between 23 and 44 years old with 48
percent of them being 25 and 26 years old, 14 were males and
7 females, only one was left-handed but was using his right
hand the move the mouse anyway.
Although 71 percent of the subjects claimed that at the
present time they play an hour or less of video games per
week, 81 percent of them reported to have five years or more
of video game experience. Consequently, only four subjects
(19 percent) had one year or less of game experience among
which two claimed to have played only casual and educational
games on extremely rare occasions. Also 42 percent of the
subjects were already familiar with 3D maze but only four (19
percent) of them played this type of game frequently (more
than one hour per week).
Game experience doesn't seem to interfere with the subject’s
ability to perform the task of playing the basic version of the
game used for experiment two. In fact, in the course of the
experiment, all subjects achieved a best time under 52 seconds
with a maximum of two errors (ending in a dead end or going
back to a path more than once). Moreover, 52 percent of the
subjects were even able to complete the game doing a perfect
path on one or more of their trials with an average completion
time of 34 seconds. Among the four players who claimed to
have less than one year of game experience, two were able to
complete the game with a perfect path and a best time under
the average on one or more of their trials, but the best time of
the two others was over the average completion time of all
subjects.
On the other hand, five subjects were unable to complete the
version of the game including gameplay features used in
experiment one. Three of them were among the declared
inexperienced player as the two others claimed 5 and 10 years
of gaming experience, one of them even mentioned having
played 3D maze games before. One subject could not complete
the game because he was unable to find the path, another
managed to arrive to the end but missed the exit by a few
seconds; three others were blocked by their inability to jump.
It is important to note that all of them played this version of
the game on their first trial. This implies that 46 percent of the
subjects who were assigned this version on their first trial
failed to complete it. Furthermore, three of them were asked to
replay the Gameplay version of the game at the end of the
second experiment and two of them succeeded with
completion time and amount of errors under the average.
The difference in the gaming background is evident in the
analysis of the questionnaires for the comparison of the two
different game versions (Table 2). Subjects with at least 10
years of game experience and 1 hour of gaming per week are
considered to be “Experienced” while the rest are considered
to be “Novice”. The increase in Flow (+0.8) and Positive
Affect (+0.67) for experienced subjects strongly indicates a
trend in favor of gameplay challenges. On the other hand, less
experienced players do not show a clear preference between
the two game versions. While Challenge is indeed increased
for the second version (+1.46) this does not result in a
significant increase in Competence or Flow as happens with
experienced players.
Further analysis on the game and behavioral data showed
that novice players felt rather frustrated and annoyed by the
traps and the time limit, instead of regarding them as fun and
enjoyable features of the game. This explains the inconclusive
results on Flow, since these players would probably prefer
much simpler and easier games, e.g. casual or educational
games. Therefore it is clear that game characteristics have
quite opposite affect on players with different gaming
backgrounds.
TABLE 2
QUESTIONNAIRE SCORES FOR THE TWO VERSIONS OF THE GAME
Experienced Novice
Gameplay Graphics Gameplay Graphics
Flow 3.9 3.1 3.35 3.32
Pos. Affect 3.73 3.06 3.1 3
Neg. Affect 1.56 1.93 1.96 2.07
Competence 3.83 3.17 2.57 3.14
Tension 1.67 2.7 2.25 2.64
Challenge 3.26 2.4 3.6 2.14
B. Biosignal Features Extraction and Analysis
1) Statistical Analysis Method
After preprocessing we ended up with 21 test subjects and
over 70 features for each of the trials. All of this data was
inputted into SPSS for statistical analysis. Correlations
regarding Experiment 2 were calculated only for trials 3 to 10,
to remove the first 2 trials (the Gameplay and the Graphics
one) and also the trials beyond 10, since there were only few
players with that many trials.
As an exploratory phase of the data analysis, non-parametric
correlations (Kendall’s tau) were calculated between the
questionnaire data and the physiological data. Significance
level was set at p<0.05 (*) and p<0.01 (**). Partly due to
relatively large sample size, there were several statistically
significant correlations (p� 0.001), but the correlation
coefficient only a few times reached values higher than 0.25.
2) EEG modality
We investigated a number of features derived from the
processing of the EEG signal:
� Theta, alpha and beta power (divided by total power),
both for Fp1 and Fp2
� Theta/alpha ratio and theta/beta ratio, both for Fp1
and Fp2
� Alpha asymmetry
The features were computed in a 25 second long window,
starting five seconds after the beginning of the game. One of
the difficulties of processing the EEG signals in our case was
the large number of eye blinks per trial. Eye-blinks are
considered to be artifacts that could severely distort the results
and thus we tried to remove them prior to the feature
extraction. For this purpose, the aforementioned features were
calculated and evaluated after applying the eye blink detection
and removal algorithm explained in the following.
Proceedings of the 5th International Summer Workshop on Multimodal Interfaces - eNTERFACE'09
7

a. Eye-blink detection
Initially, the position of the eye blinks had to be detected.
For this purpose, a cross-correlation method [23] was used.
The EEG signal recorded during the “rest” session of each
subject was used as a normal signal, without artifacts, since
during the rest session, subjects had their eyes closed and
consequently, the effect of eye-blinks was absent. To exclude
noise of other sources we manually select a period of rest data
without noise. To compute the cross-correlation coefficients a
window of 128 samples was used. By moving this window and
calculating the correlation coefficient for each of these
windows, we were able to get an averaged value for this
coefficient. This gives a threshold to determine in which
window we have an eye blink. We considered the maximum
amplitude of the window as a second condition for eye blink
detection. This was done to exclude detection of other artifacts
such as head movement and eye movement. The discrete cross
correlation method was calculated with the formula:
22 )()(
))((
yyxx
yyxxr
ii
ii
��
���
�
�
The threshold was determined by averaging over 70 eye
blinks across all trials of 5 subjects. The eye blink was chosen
randomly from the start, middle or end of the trial. The start of
the eye blink was marked 30 samples before the detected eye
blink position and the end was marked 90 samples after.
226.7
+-
Scale
65 66 67 68 69 70 71 72 73 74 75 76 77 78 79 80
2
1
Figure 11. Raw EEG signal and Detected blink position using cross-
correlation
b. Eye-blink removal
The most popular eye-blink removal techniques are based
on independent component analysis (ICA) or principal
component analysis (PCA). Generally, the ICA based method
has been known to give the best performance. However, these
studies use more EEG channels than the two we used. This
makes it quite hard for ICA to completely separate the eye
blinks from the neural information. Even if we find an eye-
blink related independent component (EBIC), the recovered
signals after deleting the EBIC, Fp1 and Fp2, are just a
linearly scaled version from the remaining independent
component. Therefore, we developed three methods:
� 1st method (Remove): Remove the eye-blink region of
the signal.
� 2nd
method (Filter): Filter the eye-blink region in the
beta band.
� 3rd
method (ICA): Filter the eye-blink region in the
beta band of the EBIC and project the components
back to the original signal.
Figure 12. Power Spectral Density of Initial data, band-pass
filtered(3~40hz), 1st method(remove), 2nd method(filter), 3rd
method(ica)
Figure 12 shows the power spectral density associated with
the three methods. The 1st method seems to affect the power in
the beta region. In the second and third method we lose some
information in the alpha and theta band, while information in
the beta band remains unaffected. However, the 3rd
method is a
bit different from 2nd
as we retain some extra information in
the theta and alpha region during the eye blink, because some
of the frequencies are still in the second independent
component and are thus recovered. Therefore, we decided to
use the last method for further feature extraction.
3) ECG modality
Regarding our project’s ECG modality, we explored the
potential of using three different features representative of the
subject’s Heart Rate Variability, which derived from the ECG
IBI (Inter Beat Intervals): the “IBI Mean” and “IBI SD
(Standard Deviation)” from the time domain (TD) and the
“LF/HF (Low Frequency (0.014-0.15 Hz) power / High
Frequency (0.15-0.4 Hz) power) Mean” from the frequency
domain (FD). Our aim was to identify correlations between the
features’ evolution through time and the user’s affective state
changes. We extracted these features from the IBI data
collected during the whole of each trial
Prior to the feature extraction, we removed IBI artifacts by
applying a filter excluding IBIs over 1200 and under 500 ms.
We decided to apply this filter, since an IBI under 500ms
which is not an artifact means that the subject suddenly has a
Heart Rate over 120 beats/minute and a not-an-artifact IBI
over 1200ms means that the subject suddenly has a Heart Rate
lower than 50 beats per minute.
Furthermore, in order to overcome difficulties imposed from
the between-subjects variations within the features used, we
normalized the extracted features to the minimum and
maximum values retrieved from each subject by using the
formula:
minmax
min
IBIIBI
IBIIBIIBI norm
�
��
Where:
Proceedings of the 5th International Summer Workshop on Multimodal Interfaces - eNTERFACE'09
8

maxIBI = The maximum IBI value recorded for the specific
subject in all trials
minIBI = The minimum IBI value recorded for the specific
subject in all trials
4) GSR modality
In this study, we measured both the tonic and phasic
electrodermal activity. For the tonic EDA we initially
calculated the sum of the GSR signal during a trial (sEDA).
Then, tonic EDA was measured in three ways: as the amount
of sEDA during a trial, divided by the trial length and
normalized to the pre-exam baseline, as the amount of sEDA
that was normalized to the pretrial resting period before each
trial and divided by the length of the trial, and as the amount of
EDA during the first 20s of each trial.
Three kinds of phasic features were extracted: the number
of phasic responses during a trial, the average length of phasic
responses during a trial, and the average amplitude of the
phasic response during a trial. There are no clear rules of
defining what constitutes a phasic response, but we used a
measure of %5 increase of EDA during 1 second interval as an
onset of phasic response. The 5% was measured from the
range of EDA during that trial.
Furthermore, after applying a within-subject normalization
of the mean EDA level per trial, we investigated this feature’s
alteration between the Gameplay and Graphics trials (by taking
into account now only trials 1 and 2). In particular, for each
subject, we normalized the GSR signal to the subject’s
minimum and maximum GSR values recorded, by using,
similarly to the case of the ECG modality the formula:
minmax
min
GSRGSR
GSRGSRGSRnorm
�
��
Where:
maxGSR = The maximum GSR value recorded for the
specific subject in all trials
minGSR = The minimum GSR value recorded for the
specific subject in all trials
Then, we calculated the average of the normalized GSR for
all the Gameplay and all the Graphics trials of all subjects.
5) EMG modality
We tried to assess the agonist-antagonist muscle
coordination by calculating the ratio between the average
amplitude of the raw EMG’s rectified average signal of the
agonist muscle to the one of the antagonist, for each subject’s
mouse movement during each trial. Since all of our subjects
used their right hand in order to move the mouse, for the right
mouse movements, the agonist muscle was set as the Flexor
Carpi Ulnaris and the antagonist was the Abductor Policis
Longus. This configuration was inversed for left mouse
movements.
For the purpose of our experiment we extracted a set of
three features from the rectified average EMG signal. These
were: “Right mouse movements Agonist / Antagonist muscle
Ratios, averaged for each trial” (EMG_AvgRatiosR), “Left
mouse movements Agonist / Antagonist muscle Ratios,
averaged for each trial” (EMG_AvgRatiosL), “All mouse
movements Agonist / Antagonist muscle Ratios, averaged for
each trial” (EMG_AvgRatiosA). In order to calculate these
features, first we had to identify the time window for each
(right or left) mouse movement and then to calculate the
average ratio of the agonist-antagonist signal amplitudes for
each window. Finally, for each trial, we calculated the average
of these ratios. In order to overcome the between-subjects
variations in our analysis, prior to the feature extraction, we
normalized all data collected from each subject’s muscle to the
corresponding maximum values taken from the maximum
isometric contractions conducted at the beginning of each
session.
VII. RESULTS
As explained in the Data Analysis section, in order to
identify correlations between biosignal features and the
subject’s actual affective state (as this had been indicated
within the mid-trials questionnaires), a set of features for each
of the modalities used was analyzed on the basis of the
Kendall’s tau correlation coefficient. Several statistically
significant correlations (below the 0.001 level of significance)
were identified. In the following, the most significant of them
regarding each modality are summarized.
A. ECG
First of all, as shown in Table 3, a statistically significant
correlation was identified between the IBI Mean value per trial
and the question indicating the subject’s drowsiness (Q3),
�=0.258 (p=0,001). This positive correlation of the IBI Mean
per trial with the subject’s drowsiness was an expected result,
since higher Inter Beat Intervals mean decreased heart rate, a
feature indicative of low arousal and drowsiness according to
the literature.
The IBI Mean per Trial value was also found to be
negatively correlated with the question indicating the subject’s
level of concentration to the game (Q5). In particular, as
shown in Table 3, these variables demonstrated a Kendall
correlation coefficient value of �=-0.176 (p<0.001). This result
indicated that during the trials that the subjects were more
concentrated; their heart rate had the tendency to be increased.
TABLE 3
STATISTICALLY SIGNIFICANT CORRELATIONS OF THE IBI MEAN PER TRIAL
FEATURE OF THE ECG MODALITY
IBI Mean per trial
Q3 (Drowsiness) 0.258** Sig=0,001
Q5 (Concentration) -0.176 ** Sig=0,001
A statistically significant negative correlation was also
identified between the boredom question (Q3), and the
frequency-domain feature of the LF to HF ratio. In particular,
the LF to HF ratio mean value during each trial demonstrated a
correlation coefficient value of �=-0.205 (p<0.001) regarding
Q3. This was also an expected result, since in our experiment
the state of drowsiness is connected with a decrease in mental
workload, correlated in the literature with an increase in the
HR LF/HF Ratio.
Proceedings of the 5th International Summer Workshop on Multimodal Interfaces - eNTERFACE'09
9

Furthermore, we investigated the normalized IBI mean per
trial feature’s overall alteration between the Gameplay and
Graphics trials. In order to do so, we calculated the feature’s
average value for all the subjects’ Gameplay and Graphics
trials respectively. For the Gameplay trials, this feature had the
average value of 0.269, whereas for the trials using the
graphics game version, this average was 0.447. Since the Heart
Rate is calculated as the inverse of the Inter-Beat Intervals, we
conclude that subjects had in average an increased heart rate
during the Gameplay trials, than during the graphics ones.
Taking into account that increased heart rate is strongly related
in the literature with higher levels of arousal, this result is a
strong indication that during the Gameplay trials, subjects felt
more aroused. This arousal could either mean enjoyment,
tension or frustration but nevertheless shows a higher level of
involvement and immersion into the game world.
B. GSR
As shown in table 4, the level of EDA during the first 20s
seemed to correlate positively with Flow (the negative
correlation in Table 4 is due to the fact that the score of Q4
was inversely proportional to the Flow) and positively with
concentration questionnaire. This indicates that both
concentration and flow increase EDA, which is an expected
result, as flow is thought to be a combination of high arousal
and pleasure.
TABLE 4
EDA CORRELATIONS: CORRELATION BETWEEN EDA(FIRST 20S OF THE
TRIAL) AND QUESTIONNAIRE DATA FOR FLOW AND CONCENTRATION
EDA First 20s
Q4 (Flow) -0.241** Sig=0,000
Q5 (Concentration) 0.235** Sig=0,000
The average value of the normalized “GSR mean per trial”
feature for all the Gameplay trials was found to be 0.295,
whereas the corresponding one for all the graphics trials was
0.395. Furthermore, for the vast majority of the subjects the
average of the normalized GSR mean for the Gameplay trial
was much higher than the one for the trial with the graphics
version. By taking into account the fact that higher average
EDA levels are strongly connected to higher levels of arousal
and pleasure, this result came to further support our conclusion
regarding the subjects’ higher levels of arousal during playing
the challenging version of the labyrinth, as was indicated also
from the corresponding game experience questionnaires and
ECG modality analysis described above.
C. EEG
Some of the features extracted from the EEG modality
slightly correlated with the subjects self assessment of
boredom before the eye blinks were removed. However, an
extra feature was included in this analysis, namely a rough
estimate of the number of eye blinks. This number displayed
the same correlation as the above mentioned features. This
could be expected as eye blinks severely contaminate the
power estimates in the theta and alpha regions [24]. This could
mean the correlations found in the EEG features were due to
eye blink artifacts. This is confirmed in the section about eye
blink removal, where we show that the power in the theta and
alpha regions is strongly reduced after removal of the eye
blinks. After the removal of the eye blinks none of the
correlations seemed to be significant anymore, which again
confirms the fact that the eye blinks are responsible for the
correlation. For future work, we could consider the number
(and maybe the length) of the eye blinks as a measure for
attention.
We also tried the sample entropy [25] for quantifying the
regularity of the signal as regularity seems to change
depending on the mental state (drowsiness or attention) of the
subject. This is by no means confirmed in literature and is just
an extra possibility we wanted to check. This feature, too, did
not seem to correlate with the information in the questionnaire.
D. EMG
After analyzing the correlations between the extracted EMG
features and the answers to the questionnaires, we found out
that our most representative of the overall muscle activity
feature, “EMG_AvgRatiosA”, was positively correlated to the
questions identifying the subject’s drowsiness / boredom and
frustration. In particular, a significant correlation was found
between this feature and the boredom (Q3) question (�=0.122,
p=0.008) as well as the frustration (Q2) question (�=0.293,
p<0.001).
This result can be considered as an indication that through
trials, as the subjects get tired, bored and frustrated of the
repetitive task, their overall behavior changes, and this is
reflected within the change of the agonist/antagonist ratios
extracted as features from the rectified averaged EMG signals.
In particular, by taking into account the fact that higher values
of this feature in our case usually appeared in mouse
movements of higher range of motion and velocity, one may
conclude that the specific correlation found is an indicator of
the subject’s tendency for mouse movements of higher velocity
and range of motion while getting more frustrated during the
experimental session.
VIII. CONCLUSIONS
In this work we aimed to combine outcomes obtained from
various research fields such as presence, affective computing
and psychology in order to evaluate video gaming experience
and identify psychophysiological correlates of changes in the
user’s affective state during HCI. For this purpose, within the
eNTERFACE 09 project 1, two VR-biosignals experiments
were conducted. The first experiment compared gameplay
features and challenges with “purely” technical game
parameters like graphics and sound, whereas the second
focused on the identification of psychophysiological and
behavioral correlates of the changes in the user’s affective
state during repetitive tasks in HCI. During the workshop, data
was collected from 21 subjects who played different versions
of the VR game repeatedly, while their EEG, EMG, ECG and
GSR signals were recorded.
Regarding the graphics vs gameplay debate, both subjective
and objective assessments conducted for the purposes of
Experiment 1, showed an increase in involvement and
immersion for the game version with the game challenges.
These results are strongly supported by the analysis of
Proceedings of the 5th International Summer Workshop on Multimodal Interfaces - eNTERFACE'09
10

biosignals features related to pleasure and arousal (mean GSR
activity level and mean IBI) which showed that during playing
the challenging version of the labyrinth game, subjects were in
average more excited than during playing the version with
graphics of high quality and no challenges. This excitement
showed to correlate to different causes between subjects with
significant gaming background and the ones without. In
particular, experienced players clearly enjoyed the gameplay
version more than the others, as indicated by the questionnaire
scores, while players not familiar with games found the
challenges difficult for them and therefore did not seem to
prefer any particular version. This is an important outcome
that can be used in the analysis of gaming experience and
specifically the affect of the gameplay design in players with
different gaming experience.
During Experiment 2, by having a large number of
repetitions of the same labyrinth game as stimuli, we managed
to elicit the affective state of drowsiness / boredom to all
subjects participated. After appropriate analysis (based on the
Kendall’s tau correlation coefficient) of the data collected we
managed to identify statistically significant correlations
between features extracted from the monitoring modalities and
the changes in the subjects’ affective state during the
experimental session. The most significant correlations
identified at the p=0.001 level were related until now to the
ECG, GSR and EMG modalities.
Conclusively, the main outcomes of the project’s
experiments were the development of a rich biosignals
database related to gaming experience, of techniques regarding
the pre-processing of the raw data collected, the identification
of more objective measures regarding the gaming experience,
and the extraction and statistical analysis of features from
biosignals. The focus was towards the development of
classification methods regarding the changes of the user’s
affective state during HCI. One task of high importance for the
development of automatic biosignals-based classifiers, able to
distinguish effectively the transitions in the human affective
states during VR games and HCI in general, is the selection of
appropriate features derived from the monitored biosignals.
Towards this direction, this work has examined such features,
in an attempt to identify significant ones that could be used in
the future for the automatic classification of the affective states
of a VR game player.
ACKNOWLEDGEMENTS:
We would like to thank all eNTERFACE participants that
participated as subjects for the purposes of the Project 1
experiments.
REFERENCES
[1] Sanchez-Vives, Maria and Slater, Mel. From presence
to consciousness through virtual reality. Nature
reviews. Neuroscience, 6(4):332-9, 2005.
[2] Slater, Mel. How Colorful Was Your Day? Why
Questionnaires Cannot Assess Presence in Virtual
Environments. Presence: Teleoper. Virtual Environ.
13(4): 484-493, 2004.
[3] Usoh, Martin and Catena, Ernest and Arman, Sima and
Slater, Mel. Using Presence Questionnaires in Reality.
Presence: Teleoper. Virtual Environ, 9(5):497-503,
2000.
[4] Friedman, D. and Brogni, A. and Guger, C. and Antley,
A. and Steed, A. and Slater, M.. Sharing and analyzing
data from presence experiments. Presence: Teleoper.
Virtual Environ. 15(5):599-610, 2006.
[5] V. Vinayagamoorthy, A. Steed, and M. Slater. The
impact of a character posture model on the
communication of affect in an immersive virtual
environment. IEEE Transactions on Visualization and
Computer Graphics, 14(5):965–982, 2008.
[6] N. Ravaja, T. Saari, J. Laarni, K. Kallinen, M.
Salminen, J. Holopainen, and A. Ja”rvinen. The
psychophysiology of video gaming: Phasic emotional
responses to game events. In DiGRA Conference:
Changing Views–Worlds in Play, 2005.
[7] T. Tijs, D. Brokken, andW. Ijsselsteijn. Creating an
emotionally adaptive game. In ICEC ’08: Proceedings
of the 7th International Conference on Entertainment
Computing, pages 122–133, Berlin, Heidelberg, 2009.
[8] D. King, P. Delfabbro, and M. Griffiths. Video game
structural characteristics: new psychological taxonomy.
International Journal of Mental Health and Addiction,
2009.
[9] D. Clarke and P. R. Duimering. How computer gamers
experience the game situation: a behavioral study.
Comput. Entertain., 4(3):6, 2006.
[10] P. Sweetser and P. Wyeth. Gameflow: a model for
evaluating player enjoyment in games. Comput.
Entertain., 3(3):3–3, 2005.
[11] B. Cowley, D. Charles, M. Black, and R. Hickey.
Toward an understanding of flow in video games.
Comput. Entertain., 6(2):1–27, 2008.
[12] Andreassi, J. L. (1995). Psychophysiology: human
behavior and physiological response. Hillsdale, N.J.,
Lawrence Erlbaum Associates.
[13] Schwartz, M. S. (1995). Biofeedback: A Practioner’s
Guide. New York: Guilford Press
[14] Ravaja, N. (2004). Contributions of psychophysiology
to media research: Review and recommendations.
Media Psychology, 6, 193-235
[15] International Affective Picture System (IAPS) website:
http://csea.phhp.ufl.edu/media.html
[16] Y. Shigemitsu, and H. Nittono. Assessing interest level
during movie watching with brain potentials. Second
Internation Worskhop on Kansei., 39-42, 2008.
[17] W. Limesch, M. Doppelmayr, H. Russegger, T.
Pachinger, and J. Schwaiger. Induced alpha band power
changes in the human EEG and attention. Neuroscience
Letters. 73-76, 1998.
[18] T.-P. Jung, S. Makeig, M. Stensmo, and T.-J.
Sejnowski. Estimating alertness from the EEG power
spectrum. IEEE Trans. Biomed. Eng. 44 (1997) 60–69
[19] R.-S. Huang, T.-P. Jung, and S. Makeig. Multi-scale
EEG brain dynamics during sustained attention tasks.
Proceedings of the 2007 IEEE International Conference
Proceedings of the 5th International Summer Workshop on Multimodal Interfaces - eNTERFACE'09
11

on Acoustics, Speech, and Signal Processing
(ICASSP2007), Honolulu, Hawaii, April 15–20, 2007,
vol. 4, pp. 1173–1176
[20] I.B. Mauss, and M.D. Robinson. Measures of emotion:
a review. Cognition and Emotion. 23(2),209-237, 2009.
[21] B.S. Oken, M.C. Salinsky, and S.M. Elsas. Vigilance,
alertness, or sustained attention: physiological basis and
measurement. Clinical Neurophysiology. 117, 1885-
1901, 2006.
[22] A. Schaefer, F. Nils, X. Sanchez, and P. Philippot.
Assessing the effectiveness of large database of
emotion-eliciting films: a new tool for emotion
researchers.
[23] Removal of Eye Blink Artifacts From EEG Signals
Based on Cross-Correlation
[24] EEG Eye-Blinking Artefacts Power Spectrum Analysis
[25] S.M. Pincus, and A.L. Goldberger. Physiological time-
series analysis: what does regularity quantify?
[26] C.-C Chang, and C.-J. Lin. LIBSVM: a library for
support vector machines.
http://www.csie.ntu.edu.tw/~cjlin/libsvm, 2001
[27] Task force of the European society of cardiology and
the North American society of pacing and
electrophysiology. Heart rate variability – standards of
measurement, physiological interpretation, and clinical
use. Circulation, 93(5):1043–1065, March 1996.
[28] G.G. Berntson, J.T. Bigger Jr., D.L. Eckberg, P.
Grossman, P.G. Kaufmann, M. Malik, H.N. Nagaraja,
S.W. Porges, J.P. Saul, P.H. Stone, and M.W. Van Der
Molen. Heart rate variability: Origins, methods, and
interpretive caveats. Psychophysiol, 34:623–648, 1997
[29] M. B. I. Reaz, M. S. Hussain, F. Mohd-Yasin,
“Techniques of EMG Signal Analysis: Detection,
Processing, Classification and Applications”,
Biological Procedures Online, vol. 8, issue 1, pp. 11–
35, March 2006
[30] Branco, P., Firth, P., Encarnao, L. M. & Bonato, P.
(2005). Faces of emotion in human-computer
interaction. In CHI '05 extended abstracts on Human
factors in computing systems (pp. 1236-1239). New
York: ACM Press.
[31] Partala, T. & Surakka, V. (2004). The effects of
affective interventions in human-computer interaction.
Interacting with Computers, 16, 295-309
[32] Kim, J. and Andr´e, E. (2008). Emotion recognition
based on physiological changes in music listening.
IEEE Transactions on Pattern Analysis Machine
Intelligence, 30(12):2067–2083
[33] K. H. Kim, S. W. Bang, and S. R. Kim, "Emotion
recognition system using short-term monitoring of
physiological signals," Medical & Biological
Engineering & Computing, vol. 42, pp. 419-427, May
2004
[34] OGRE official site, http://www.ogre3d.org/
[35] OPENAL cross-platform 3D audio API official site,
http://connect.creativelabs.com/openal/default.aspx
[36] Bullet Physics Library official site,
http://www.bulletphysics.com
[37] Picard, R. W., Vyzas, E., and Healey, J. (2001).
Toward machine emotional intelligence: Analysis of
affective physiological state. IEEE Transactions on
Pattern Analysis and Machine Intelligence,
23(10),1175-1191
[38] K. Poels, Y. A.W. de Kort & W. A. IJsselsteijn, "Game
Experience Questionnaire", FUGA The fun of gaming:
Measuring the human experience of media enjoyment
[39] Witmer, B.G and Singer, M.J. (1998) Measuring
Presence in Virtual Environments: A Presence
Questionnaire, Presence: Teleoperators and Virtual
Environments, 7(3), 225-240
[40] Usoh, M., E. Catena, S. Arman and M. Slater (2000).
Using Presence Questionnaires in Reality. Presence:
Teleoperators and Virtual Environments, 9(5): 497-503
Proceedings of the 5th International Summer Workshop on Multimodal Interfaces - eNTERFACE'09
12

APPENDIX A
QUESTIONNAIRES
eNTERFACE Project1 experiment questionnaire
Pre-questionnaire Participant ID:
Briefing
In this experiment we try to identify psychophysiological correlates of the human affective states during Human – Computer
Interaction. For the purpose of the experiment, you will play a “Labyrinth” VR game repeatedly, while your biosignals will be
monitored from EEG, ECG, GSR and EMG sensors. You are free to withdraw from the experiment at any time.
Questions asked before starting placing the sensors
Do you have any known to you medical problem that would not allow you to participate in the experiment?
Yes No
Right - Left Handed
I consent to take part in the experiment
Personal Information
Name:
Age:
Sex:
Height:
Weight:
Do you use biofeedback in your work? Yes No
Game Experience
1. How often do you play video games? (hours / week)
2. How often do you play 3D maze or first-person shooter games? (hours/week)
3. How many years of game experience do you have?
4. What type of games do you usually play?
� First / Third - Person Shooter
� Strategy Games
� Role Playing Games (e.g. WoW)
� Adventure (e.g., Monkey Island, King’s Quest…)
� Action (e.g. Prince of Persia)
� Sports / Racing Games
� Casual Games (e.g. Tetris, Chess, Music games etc.)
� Educational Games / Serious Games
Train Data acquisition session questionnaire Video 1
1. How much attention did you pay on the video?
Not at all 1 2 3 4 5 Very much
2. The video was
Unpleasant 1 2 3 4 5 Pleasant
Video 2
1. How much attention did you pay on the video?
Not at all 1 2 3 4 5 Very much
2. The video was
Unpleasant 1 2 3 4 5 Pleasant
Proceedings of the 5th International Summer Workshop on Multimodal Interfaces - eNTERFACE'09
13

3. How do you feel?
- calmed 1 2 3 4 5 agitated
- interested 1 2 3 4 5 bored
- happy 1 2 3 4 5 sad
- 1 2 3 4 5 frustrated
Mid-trials questionnaire Trial 1
Do you want to play the game again?
No, I’d rather do something else 1 2 3 4 5 Yes
How do you feel?
Frustrated Not at all 1 2 3 4 5 Very much
Bored of the game Not at all 1 2 3 4 5 Very much
How aware were you of events occurring in the real world around you and of your personal thoughts?
Not at all 1 2 3 4 5 Very much
How concentrated were you on the game?
Not at all 1 2 3 4 5 Very much
Trial 1 game experience questionnaire (Game Version 1)*
not at all slightly moderately fairly extremely
I felt successful
I felt bored
I found it impressive
I forgot everything around me
I felt frustrated
I found it tiresome
I felt irritable
I felt skilful
I felt completely absorbed
I felt content
I felt challenged
I felt stimulated
I felt good
Trial 2
Do you want to play the game again?
No, I’d rather do something else 1 2 3 4 5 Yes
How do you feel?
Frustrated Not at all 1 2 3 4 5 Very much
Bored of the game Not at all 1 2 3 4 5 Very much
How aware were you of events occurring in the real world around you and of your personal thoughts?
Not at all 1 2 3 4 5 Very much
How concentrated were you on the game?
Not at all 1 2 3 4 5 Very much
Trial 2 game experience questionnaire (Game Version 2)*
not at all slightly moderately fairly extremely
I felt successful
I felt bored
I found it impressive
I forgot everything around me
I felt frustrated
I found it tiresome
Proceedings of the 5th International Summer Workshop on Multimodal Interfaces - eNTERFACE'09
14

I felt irritable
I felt skilful
I felt completely absorbed
I felt content
I felt challenged
I felt stimulated
I felt good
Trial 3-10+
Do you want to play the game again?
No, I rather do something else 1 2 3 4 5 Yes
How do you feel?
Frustrated Not at all 1 2 3 4 5 Very much
Bored of the game Not at all 1 2 3 4 5 Very much
How aware were you of events occurring in the real world around you and of your personal thoughts?
Not at all 1 2 3 4 5 Very much
How concentrated were you on the game?
Not at all 1 2 3 4 5 Very much
Post-questionnaire** 1. How much did the visual aspects of the environment involve you?
Not at all 1 2 3 4 5 Very much
2. How aware were you of events occurring in the real world around you?
Not at all 1 2 3 4 5 Very much
3. How well could you concentrate on the assigned task?
Not at all 1 2 3 4 5 Very much
4. Did the sensors disturb you while trying to complete the game?
Not at all 1 2 3 4 5 Very much
5. Were you involved in the experimental task to the extent that you lost track of time?
No 1 2 3 4 5 Yes
* Based on [38]
** Based on [39] and [40]
Proceedings of the 5th International Summer Workshop on Multimodal Interfaces - eNTERFACE'09
15

Project #03 Multimodal Guitar:
Performance Toolbox and Study Workbench
Christian Frisson 1,♮, Loıc Reboursiere 2,♭, Wen-Yang Chu 1,♯, Otso Lahdeoja 3,
John Anderson Mills III 2, Cecile Picard 4, Ao Shen 5, Todor Todoroff 2
1 TELE Lab, Catholic University of Louvain (Be); 2 TCTS Lab, Polytechnic Faculty of Mons (Be);1,2 numediart Research Program on Digital Art Technologies; 3 CICM, University of Paris 8 (Fr);
4 INRIA-REVES Lab, Sophia-Antipolis (Fr); 5 EECE Dept., University of Birmingham (UK)♮ Project coordinator; ♭ Performance Toolbox coordinator; ♯ Study Workbench coordinator
Abstract—This project aims at studying how recent interactiveand interaction technologies would help extend how we play theguitar, thus defining the “multimodal guitar”. We investigate twoaxes, 1) “A gestural/polyphonic sensing/processing toolbox to aug-ment guitar performances”, and 2) “An interactive guitar scorefollowing environment for adaptive learning”. These approachesshare quite similar technological challenges (sensing, analysis,processing, synthesis and interaction methods) and disseminationintentions (community-based, low-cost, open-source wheneverpossible), while leading to different applications (respectivelyartistic and educational), still targeted towards experiencedplayers and beginners.
We designed and developed a toolbox for multimodal guitarperformances containing the following tools: Polyphonic PitchEstimation (see section III-A1), Fretboard Grouping (see sectionIII-A2), Rear-mounted Pressure Sensors (see section III-B),Infinite Sustain (see section III-C2), Rearranging Looper (seesection III-C3), Smart Harmonizer (see section III-C4). TheModal Synthesis tool (see section III-C1) needs be refined beforebeing released.
We designed a low-cost offline system for guitar score following(see section IV-A). An audio modality, polyphonic pitch estima-tion from a monophonic audio signal, is the main source of theinformation (see section IV-B), while the visual input modality,finger and headstock tracking using computer vision techniqueson two webcams, provides the complementary information (seesection IV-C). We built a stable data acquisition approachtowards low information loss (see section IV-E). We built aprobability-based fusion scheme so as to handle missing data;and unexpected or misinterpreted results from single modalitiesso as to have better multi-pitch transcription results (see sectionIV-D). We designed a visual output modality so as to visualizesimultaneously the guitar score and feedback from the scorefollowing evaluation (see section IV-F). The audio modality andparts of the visual input modality are already designed to runin realtime, we need to improve the multimodal fusion andvisualization so that the whole system can run in realtime.
Index Terms—Audio- and polyphonic multi-pitch transcrip-tion, audio synthesis, digital audio effects, multimodal interactionand gestural sensing, finger tracking, particle filtering, multi-modal fusion, guitar score following.
I. INTRODUCTION
A. The guitar, a marker of telecommunications technologies
The evolution of the guitar as a musical instrument has been
showcasing several milestones in telecommunication engineer-
ing technologies discovered in the last centuries, from vac-
uum tube amplification, effect pedals with built-in electronic
diodes and chips, magnetic/piezoelectric/optical sensing, wire-
less linking, and so on [20]. The “guitar synthesizer”, ex-
tending the palette of guitar sounds with synthesis algorithms
and effect processing, is composed of a guitar, a monophonic
or hexaphonic pickup (the latter allowing signal analysis of
individual strings, with magnetic [64] or optical [57, 48] or
piezoelectric sensing) and an analog or digital processing
device (the latter embedding a microprocessor). However,
these processing devices still don’t offer today an ergonomic,
customizable and freely extendable user interface, similar to
the one featured on modular environments for audiovisual
analysis and synthesis such as PureData (pd-extended [59])
and EyesWeb [29], that can be run on most laptops.
Additionally, guitarists have been developing a body lan-
guage vocabulary adding a visual communication to their
musical performance [8] (from full-body gestures to facial
expressions). The multiple sensing methods available at a
low cost nowadays, from remote cameras [5, 6] to built-
in accelerometers among other sensors [40], would allow to
better understand the gestural intention of the guitarist and em-
phasize hers/his musical expression, renaming the instrument
an “augmented guitar” [41, 43].
B. From guitar learning towards educational games
Plenty of methods have been proposed to learn and teach
guitar playing: from the academic study and interpretation of
classical scores, to the more popular dissemination of guitar
tabs providing a simplified notation, or teaching by playing
within nomadic communities, playing by ear in an improvised
music context, and so on... However, most of these methods
require a long training before the user is proficient enough to
become autonomous.
After efficiency, usability, ergonomics; an important factor
when designing today’s user interfaces is pleasurability. “Gui-
tar Hero” [38], a video game featuring a controller inspired by
a “diminished” [2] version of the guitar, consisting in having
players challenge each-others in following a “4 on/off” note
version of a guitar score, has recently caught a lot attention.
Blend pleasure and learnability in educational games [21, 7].
Proceedings of the 5th International Summer Workshop on Multimodal Interfaces - eNTERFACE'09
16

II. TWO SUBPROJECTS, TWO APPLICATIONS
We proposed two sub-projects blended together in this
project. While the first is aimed at artists and the second at
“standard users”, while the first would help create artistic per-
formances and the second would enrich educational learning;
we believed that these two projects share enough similarities
among their work packages and deliverables so as to merge
them together in a single eNTERFACE’09 project.
A. A gestural/polyphonic sensing/processing toolbox to aug-
ment guitar performances
The purpose of this subproject is to study and refine
the methods employed in the sound analysis, synthesis and
processing of the guitar and in the gestural expression of the
guitarist, so as to provide a low-cost and opensource, software
and hardware, toolbox that can allow guitarists to personalize
their performance settings, from beginners to experts.
B. An interactive guitar score following environment for adap-
tive learning
The purpose of this project is to propose an open-source,
community-based, standalone application to guitar players,
from beginners to experts, for helping them to master mu-
sical pieces, with different adaptive layers of difficulty. The
application would be used with real guitar to perform and
follow a musical piece displayed on a screen, while a real-
time polyphonic transcription of the guitarist’s playing would
allow the evaluation of its performance in an enjoyable way.
III. ARTISTIC SUB-PROJECT: PERFORMANCE TOOLBOX
For this sub-project we decided to work on every part of
the chain of the use of an augmented guitar :
• Audio analysis : how to use features of the guitar sound
to detect events or to control parameters
• Gestural control : how to use movements made by the
guitarist to add control on the sound the computer pro-
duces
• Audio synthesis : how can we enhance guitar perfor-
mance with hexaphonic effects or not
As these categories are quite general, we decided to focus
on the tools listed below :
• Polyphonic Pitch Estimation (see section III-A1)
• Fretboard Grouping (see section III-A2)
• Rear-mounted Pressure Sensors (see section III-B)
• Modal Synthesis (see section III-C1)
• Infinite Sustain (see section III-C2)
• Rearranging Looper (see section III-C3)
• Smart Harmonizer (see section III-C4)
To build and test these tools we used a Fender Stratocaster
guitar with a Roland GK3 pickup [68] mounted on in and
a String Port interface made by Keith McMillen [51]. Con-
cerning the pressure sensors, as well as the wireless sensors
interface, we used the ones from Interface-Z [31]. All the tools
have been developped for Max/MSP [15] and/or PureData [59]
environments.
A. Audio Analysis
1) Polyphonic Pitch Estimation: As mentioned in the in-
troduction, there are several ways to capture the vibrations
of the six strings of the guitar separately. Several sources
point out that the crosstalk between strings is smaller using
piezoelectric pickups than with electromagnetic ones, because
the latter sees the magnetic flux in the coil beneath one string
being influenced by the movement of adjacent strings. But we
only had the possibility to test a GK3 hexaphonic magnetic
pickup from Roland [68].
The YIN method by de Cheveigne and Kawahara [10, 9] is
recognized as one of the most accurate pitch estimator when
there is no background noise. While similar to autocorrelation,
YIN uses a difference function that minimizes the difference
between the waveform and its delayed duplicate instead of
maximizing the product. Changes in amplitudes between suc-
cessive periods will both yield an increase in the difference
function. This compares to the autocorrelation function, known
to be quite sensitive to amplitude changes, where an increase in
amplitude tends to cause the algorithm to chose a higher-order
peak and hence a too low frequency estimate; while a decrease
in amplitude has the opposite effect. The introduction of
the cumulative mean normalized difference function removes
the need for an upper frequency limit and the normalization
allows the use of an absolute threshold, generally fixed at 0.1.
This threshold can also be interpreted as the proportion of
aperiodic power tolerated within a periodic signal. A parabolic
interpolation step further reduces fine errors at all F0 and
avoids gross errors at high F0. We used the yin˜ external
Max/MSP object developed at IRCAM.
In a paper dedicated to guitar patches [65] and also us-
ing the Roland hexaphonic microphone [68], Puckette, who
wrote both fiddle˜ and sigmund˜ pitch extractors, both
widely used within Max/MSP and PureData, suggests using
the later. We found it was interesting to combine an time-
with a frequency-domain pitch estimator. yin˜ gave overall
better results, but we kept the possibility to combine it
with sigmund˜ as they yielded close results during stable
sections.
The pitch detection algorithm is based on yin˜. Post-
processing, based on the quality factor of yin˜ frequency
extraction and on the level of each guitar string signal,
allows to remove the spurious notes present mainly during
transitions and when the volume fades out because of crosstalk
between the strings. Though not critical in most conditions,
the following parameters allow the user to fine-tune the pitch
detection to his needs:
• Quality threshold: we didn’t let a pitch estimate be taken
into consideration while the average of the last quality
factors was below a user-defined threshold.
• Level threshold: as the coupling between strings is shown
to be higher from higher pitch to lower pitch strings than
in the opposite direction [54], we defined a level threshold
deviation per string, applied cumulatively from string to
string.
• Outside range: an allowed range is attributed to each
string, depending on the tuning and on an amount of
Proceedings of the 5th International Summer Workshop on Multimodal Interfaces - eNTERFACE'09
17

Fig. 1. The view meters showing signals coming from the hexaphonic
microphone on the left and the user parameters of the pitch estimation on
the right
semi-tones per string. This allows to exclude notes that
may be detected outside that range because of coupling
or crosstalk.
• Mean-Median divergence, expressed in half tones, and
median window size: the difference between the mean
and the median of the pitch estimates over a user-defined
window length is a good measure of pitch stability.
• YIN-Sigmund divergence, expressed in half tones, allows
to limit note detection when an even higher stability is
achieved, at the cost of a bigger latency. But it might be
desirable in some situations.
One issue is to detect a note being played, but another one
potentially as important is to detect the end of a note. There
is no consensus about when a note is ended except the start
of a new note. Several factors make it indeed a difficult task:
• Guitar strings, mainly the lower pitch ones have a very
long decay. The pitch estimation algorithm can keep
detecting a pitch with a good quality factor even when
the sound of a string becomes masked by the other strings
for the human ear.
• String coupling inherent to the instrument design [54] can
have the effect of keeping strings vibrating, mainly open
strings, as they keep receiving energy from the vibration
of other strings.
• Crosstalk between the amplified string signals induced
by the hexaphonic microphone, picking up the sound
of adjacent strings, might give a reading even when the
string doesn’t vibrate.
• Depending on the application, one may want to keep the
note living on one string until another note is played; for
instance, to provide a synthetic or re-synthesized sustain.
• Fingers on adjacent strings, on the touch or near the
bridge can inadvertently damp or re-trigger a note.
For all those reasons it was obvious that we couldn’t provide
a Fit them All method. Instead, we provide a comprehensive
set of parameters that will define when a note is supposed
to be considered ended. Conditions that will clear the notes
are depicted in Fig. 2. Most of those conditions depend on
parameters already tuned for the pitch detection:
• Quality: clears the note if the yin˜ quality falls below
the threshold.
• Level: clears the note if the input level is below the
level threshold associated with the deviation per string
as explained above.
• Outside range: clears the note if its frequency evolves
Fig. 2. There are five conditions that help the user tailor how notes will be
cleared depending on his application.
outside the range attributed to each string, something that
might happen if the microphone crosstalk bleeds notes
from adjacent strings.
• Mean-Median divergence: when a note dies or changes,
its frequency changes and the difference between the
mean and the median of the last values increase.
• YIN-Sigmund divergence: in the same way, only very
stable frequencies yield similar results when comparing
the yin˜ and sigmund˜ outputs. Putting a threshold
in half-tones between both outputs allows to clear notes
when instability occurs.
Those conditions have an effect both on the OSC note
output sent to the Fretboard Grouping patch, on the synthesizer
(currently a simple sawtooth oscillator followed by a resonant
filter used only as a prove of concept) and on the harmonizer
algorithm if Mute harmonizer if cleared notes is selected.
2) Fretboard Grouping: Hexaphonic pickups appeared in
the 80’s and were first aimed at making the guitar a synthe-
sizer: some might want to put a bass sound on the 6th and
5th strings, an organ sound on the next two ones and then
keeping the guitar sound for the last two strings. This is one
example of what could be done with an hexaphonic pickup
and an hexaphonic-to-MIDI hardware converter. Plugin that
kind of pickup in software applications such as Max/MSP [15]
and PureData [59] can expand the guitar sound effects string
by string but allows more particularly to go even further in
the segmentation of the fretboard. As an hexaphonic pickup
directly provides a string-per-string control of the guitar,
coupling it with a polyphonic pitch estimation as described
below enables you to use the fret as the smallest element of
your segmentation and to go deeper in the management of
your fretboard. One can think in a “classical way” in terms
of chords and scales or, in a more plastic way, in terms of
fretboard zones and shapes (chord or geometrical).
The tool we made gives one the possibility to create groups
of notes on the fretboard and then checks whether the played
note(s) belong(s) to one of the defined groups or not. Using
the example of the synthesizer guitar again, one can not only
decide of the sound or effect to apply on only one string but
on all the note of a defined group. Zones of effects can then
be defined on all the guitar fretboard. We added a graphical
visualization to this tool so as to have a graphical feedback
for the created groups or for the played notes.
Another feature that our object handles is the possibility to
detect if a group has been entirely played, meaning if all notes
have been played without one extra note (not present in the
Proceedings of the 5th International Summer Workshop on Multimodal Interfaces - eNTERFACE'09
18
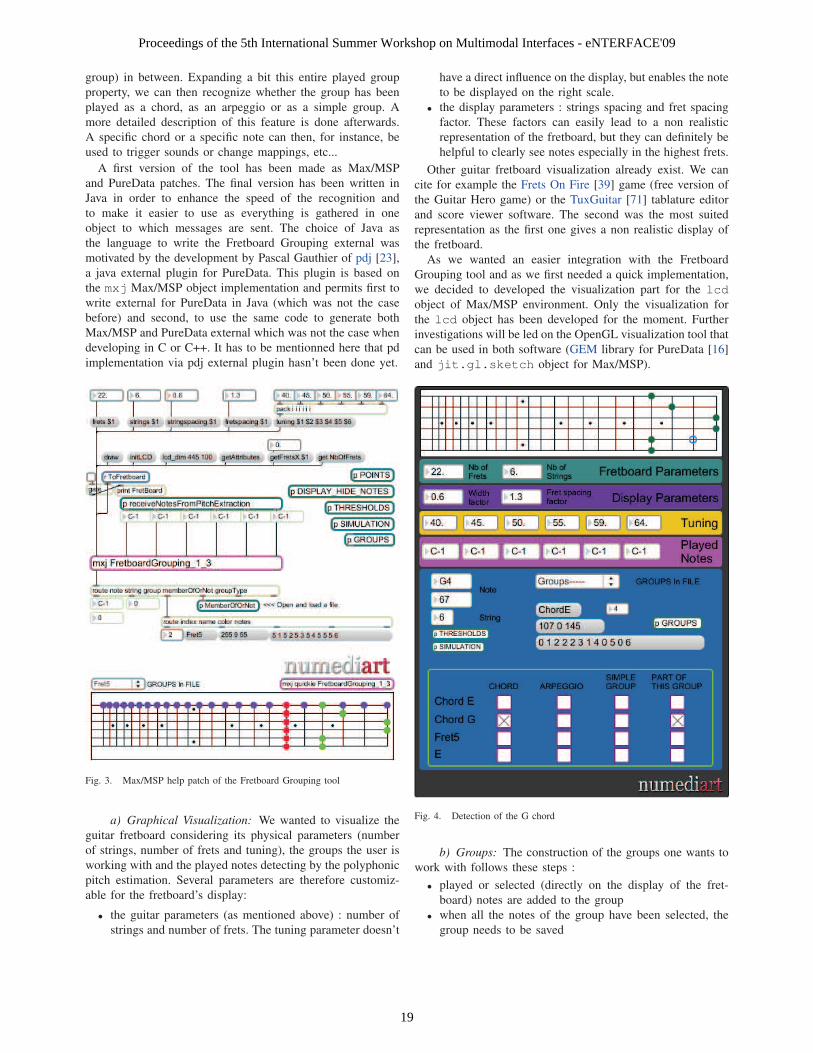
group) in between. Expanding a bit this entire played group
property, we can then recognize whether the group has been
played as a chord, as an arpeggio or as a simple group. A
more detailed description of this feature is done afterwards.
A specific chord or a specific note can then, for instance, be
used to trigger sounds or change mappings, etc...
A first version of the tool has been made as Max/MSP
and PureData patches. The final version has been written in
Java in order to enhance the speed of the recognition and
to make it easier to use as everything is gathered in one
object to which messages are sent. The choice of Java as
the language to write the Fretboard Grouping external was
motivated by the development by Pascal Gauthier of pdj [23],
a java external plugin for PureData. This plugin is based on
the mxj Max/MSP object implementation and permits first to
write external for PureData in Java (which was not the case
before) and second, to use the same code to generate both
Max/MSP and PureData external which was not the case when
developing in C or C++. It has to be mentionned here that pd
implementation via pdj external plugin hasn’t been done yet.
Fig. 3. Max/MSP help patch of the Fretboard Grouping tool
a) Graphical Visualization: We wanted to visualize the
guitar fretboard considering its physical parameters (number
of strings, number of frets and tuning), the groups the user is
working with and the played notes detecting by the polyphonic
pitch estimation. Several parameters are therefore customiz-
able for the fretboard’s display:
• the guitar parameters (as mentioned above) : number of
strings and number of frets. The tuning parameter doesn’t
have a direct influence on the display, but enables the note
to be displayed on the right scale.
• the display parameters : strings spacing and fret spacing
factor. These factors can easily lead to a non realistic
representation of the fretboard, but they can definitely be
helpful to clearly see notes especially in the highest frets.
Other guitar fretboard visualization already exist. We can
cite for example the Frets On Fire [39] game (free version of
the Guitar Hero game) or the TuxGuitar [71] tablature editor
and score viewer software. The second was the most suited
representation as the first one gives a non realistic display of
the fretboard.
As we wanted an easier integration with the Fretboard
Grouping tool and as we first needed a quick implementation,
we decided to developed the visualization part for the lcd
object of Max/MSP environment. Only the visualization for
the lcd object has been developed for the moment. Further
investigations will be led on the OpenGL visualization tool that
can be used in both software (GEM library for PureData [16]
and jit.gl.sketch object for Max/MSP).
Fig. 4. Detection of the G chord
b) Groups: The construction of the groups one wants to
work with follows these steps :
• played or selected (directly on the display of the fret-
board) notes are added to the group
• when all the notes of the group have been selected, the
group needs to be saved
Proceedings of the 5th International Summer Workshop on Multimodal Interfaces - eNTERFACE'09
19

• when all the groups are defined, the file, containing the
groups definition, needs to be saved too
• read the file to use the groups
A display feature is accessible to give one the possibility to
have a visual feedback of which notes are in the group.
Two parameters define a group : completeness and time.
Therefor three types of group are defined :
• chords : all notes of a group are played (without extra-
group notes) simultanesouly
• arpeggio : all notes of a group are played (without
extra-group notes) not simultaneously but under a certain
threshold
• simple group : all notes of a group are played (without
extra-group notes) above a certain threshold
The discrimination between the different types of groups
is, for the moment, based on the time factor. Two thresholds
are then defined : one, discriminating between chord and
arpeggio and the other one discriminating between arpeggio
and simple group. If all notes of one group are played under
this chord / arpeggio discrimination threshold the played group
is recognized as a chord, if they are played above this threshold
and under the arpeggio / simple group threshold it will be
recognized as an arpeggio, and if it is below this last threshold,
it will be recognized as a simple group. If notes are played
interlaced with other notes (of other groups or not in any
groups), notes are just recognized as part of the groups.
B. Gestural Control : Rear-Mounted Pressure Sensors
The basic premise of this gestural control subproject was to
add pressure sensors to the back of an electric guitar in order to
add another expressive control to the sound for the guitarist.
We decided that one goal of this control should be that it
should not require the player to spend much time learning the
controller, but should feel like a natural extension of playing
the guitar.
1) Sensors: Due to familiarity, we chose FSR pressure
sensors to use for this implementation. They are well-known
as reliable and easy to use. We made the decision to use their
4 cm square pressure sensors because we felt that they would
cover more area of the back of the guitar. After some testing,
it was determined that the 4 cm square sensors may have
been more sensitive than necessary for this application, and
the 1.5 cm round FSR pressure sensors might have been a
better choice for both sensitivity and placement on the guitar
body. This will need to be tested further in the future.
The sensors came with a prebuilt adjustment and op-amp
circuit as well as an interface connector so that they could be
used with an Interface-Z MIDI controller interface [31].
Due to familiarity, ease, reliability, and interoperability with
the FSR pressure sensors, the Interface-Z was chosen as the
interface between the physical sensors and the computer using
a MIDI controller interface. The Interface-Z allows for up to
8 sensors which vary a control voltage between 0 and 5 volts
to be translated into either a 7-bit or 10-bit MIDI controller
value. Although the 10-bit controller value is split across two
MIDI controllerrs. 7-bit resolution was chosen because it was
sufficient for this project.
Pressure-voltage curves are supplied by the manufacturer to
describe how the output voltage varies with supplied pressure.
It was experimentally determined that for the pressure levels
seen at the back of the guitar, the pressure sensors were
operating nonlinearly. A y = x3 mapping was implemented to
linearize the output of the sensors.
An array of pressure sensors were chosen as the interface to
use instead of a position sensor, because the array of pressure
sensors could also provide total pressure as another control
value It was unknown how many sensors would need to be
included in the array to provide enough feedback for the type
of control that we wanted. Initially tests were run using only
two sensors, but after several players tested the system, we
decided that three sensors would be more appropriate. A four
sensor array was never tested.
Fig. 5. Rear of the guitar with the three pressure sensors
By having several different guitarists test the three array
system, we made two important discoveries: the system was
extremely sensitive to the bodyshape of the player, and the
playing position of some players often caused one of the
Proceedings of the 5th International Summer Workshop on Multimodal Interfaces - eNTERFACE'09
20

pressure sensors to be favored inappropriately. The solution
which we found for this was to put a block of foam along
the array between the guitar body and the player’s body.
This solution was excellent from a technical standpoint, but
something more durable would need to be used for a longterm
solution.
2) Mapping of Sensor Data to Control Values: In order to
acquire the total pressure, ptot from the array, the following
equation was used.
ptot =
∑n
i=1pi
n(1)
where n is the number of sensors and pi is the linearized
control value representing pressure on an individual sensor.
The center of pressure, Pc, along the array is given by a
weighted average of particles as follows.
Pc =
∑n
i=1piPi
ptot
(2)
where Pi is the position of an individual sensor. This
equation is useful because the positions of the sensors do not
need to be evenly spaced.
The velocity of Pc, vc is derived using the following
equation.
vc =Pc(t +△t)
△t(3)
where △t is 20 msec.
Control of effects and other parameters was tested using
both this velocity and a derived acceleration. We decided
that in this particular configuration using these higher order
controls to directly control effects parameters was generally
uncomfortable and unnatural, but using a velocity threshhold
as a trigger for effects did feel natural. To allow for a
natural velocity trigger, the threshhold values are different in
the positive (or right-turning) and negative (or left-turning)
directions.
After trying several different effects parameters, the choice
made for the proof of concept video was the following.
• Pc is mapped to the center frequency of a bandpass
filter. The range of Pc is mapped logarithmically between
600 Hz and 4000 Hz.
• ptot is mapped to the Q of the same bandpass filter. The
range of ptot is mapped linearly to a Q value between 10
and 30.
• The velocity trigger is mapped to a gate to a delay line.
The gate opens for 300 msec and the delay is set to
300 msec with a feedback factor of 0.8. The trigger values
are −7.8 and 8.8 normalized pressure units per second.
These mappings provide an effective demonstration of the
capabilities of the pressure sensor array as a sound/effects
controller.
C. Audio Synthesis
1) Modal Synthesis:
a) Background: Acoustics guitars, naturally producing a
certain level of sound thanks to their resonating hollow bodies,
faced feedback issues once amplifiers were introduced. Solid-
body guitars, first designed to solve these issues, are perceived
by some players to afford less playing nuances due to the
reduced mechanical feedback of their less resonating body,
yet offering a more widespread palette of sounds. Christophe
Leduc designed an hybrid solution: the U-Guitar [46, 47], a
solid-body guitar with resting or floating soundboard. Guitars
with on-board DSP such as the Line6 Variax allows the player
to virtually choose several models of plucked stringed instru-
ments on one single real instrument. Amit Zoran’s Chameleon
Guitar and reAcoustic eGuitar [76] allow the guitarist to
redesign the instrument virtually (by digital methods) and
structurally (by mechanical methods).
There has been much work in computer music explor-
ing methods for generating sound based on physical sim-
ulation [32, 14]. With Modalys, also usable in Max/MSP,
Iovino et al. propose to model an instrument by connecting
elements and calculating the modal parameters of the resulted
assembly [32], yet it is tedious to build complex models for
any given geometry.
Penttinen et al. [60, 61] proposed a method for real-
time guitar body modulation and morphing, which has been
recently implemented in Matlab and C/C++ [73]. However,
their method is based on digital signal processing, essentially
for computational issues, and in particular maximal efficiency.
b) Theory: We propose to bring a physics-based ap-
proach to the multimodal guitar, so as to give control pa-
rameters that can be easily mapped to parameters from the
sensors. For this purpose, we chose the modal analysis which
consists of modeling the resonator, here the guitar body, with
its vibration modes. The microscopic deformations that lead
to sound are expressed as linear combinations of normal
modes. Modal parameters, i.e., frequencies, dampings, and
corresponding gains are extracted by solving the eigenproblem
with the use of a finite element method (see, for example, [55]
for more details). The sound resulting from an impact on a
specific location on the surface is then calculated as a sum of
n damped oscillators:
s(t) =1∑
n
aisin(wit)e−dit (4)
where wi, di, and ai are respectively the frequency, the decay
rate and the gain of the mode i. The method preserves the
sound variety when hitting the surface at different locations.
In the multimodal guitar, the sounding guitar (the main body
without the strings) is modeled through a modal approach. In
a pre-processing, the modal parameters are extracted for each
point on the surface. We chose the method described in [63]
due to its robustness and multi-scale structure. It uses the
SOFA Framework [30] to get the mass and stiffness matrices .
Specific material properties and resizement can be set for the
sounding guitar. Modal synthesis is especially well suited to
model irrealistic objects.
Proceedings of the 5th International Summer Workshop on Multimodal Interfaces - eNTERFACE'09
21

During real-time, the resulted sounds are calculated through
a reson filter (similar to [17]). Modal sounds can also be
convolved with outputs of sensors on the fly, giving the user
extended flexibility for interactive performance.
Fig. 6. Screenshot of an acoustic guitar modelled in the SOFA Framework
c) Interacting with modal sounds: Using the C/C++ code
for modal synthesis of bell sounds from van den Doel [18],
we implemented a flext object [27, 28], thus compliant with
the PureData and Max/MSP environments.The purpose of this
tool is to provide more experience with modal sounds. In
this manner, interesting sounds can be easily obtained by
convolving modal sounds with user-defined excitations.
2) Infinite Sustain: The guitar is an instrument with a
relatively short sustain (compared to for ex. wind instruments).
The electric guitar has addressed this problem with various
methods; overdrive, compression and feedback. In our ap-
plication, we use additive and granular synthesis to create a
continous sound from a detected note or chord.
The Infinite Sustain tool goes through these steps :
• Attack (”note on”) detection with Max/MSP bonk˜
object
• Spectral composition analysis of the detected note at 2
points (attack time + 100ms and 120ms)
• Synthesis of the sustained note using the 2 analysed
spectrums (additive synthesis with Todor Todoroff’s
add_synthw˜ object)
• Synthesis of a granular sustained tone using the
munger˜ object [3, 4] rewritten using flext object [27,
28]
• Mix of the two synthesis methods to create a lively
sustained tone, with lots of timbral variation possibilities
• A tilt sensor controls the sustained tone playback volume
3) Rearranging Looper: Loop pedals are often used in a
performance context to create sound textures and grooves. One
can be frustrated with the static quality of the looped audio; the
same loop is played over and over again, leading to boredom
and to aesthetic similarity in mixed music performances. We
wanted to create a looper which could rearrange the recorded
audio. The program works like a beat slicer: the incoming
Fig. 7. Screenshot of the Infinite Sustain tool
audio is analysed looking for attacks. An “event map” is
created according to the attack times. The events may then
be played back in any order. In this first version of the tool,
the playback options are straight, backwards, and a specific
random factor ranging from 0 to 100. With random 0 the
playback stays true to the recorded audio, with random 100
the audio events are played back totally randomly, creating a
sonic mess highly inspiring.
The Rearranging Looper tool goes then through these steps:
• Record on and off activated by a 1-axis accelerometer on
the guitar’s head
• Write to a buffer, create a temporal event map with attack
detection (bonk˜ object)
• Playback from the buffer
• Adjust behavior; playback mode and randomness
The program is in its first version and will evolve towards
more complex/interesting playback behavior, controlled by the
player via sensors and playing.
Fig. 8. Screenshot of the Rearranging Looper tool
Proceedings of the 5th International Summer Workshop on Multimodal Interfaces - eNTERFACE'09
22

4) Smart Harmonizer: The ability to know the exact note
being played before harmonizing, thanks to the hexaphonic
pitch extraction algorithm described above (section III-A1),
opens new interesting possibilities. In the framework of tonal
music, those possibilities start with the choice of a scale,
referenced to a base or root note. We have implemented some
common scales like major, minor natural, minor harmonic,
minor melodic ascending and descending. Currently, there is
a coll object that loads a file containing the intervals in half
tones within an octave for each defined scale:
major, 0 2 4 5 7 9 11;
minor_natural, 0 2 3 5 7 8 10;
minor_harmonic, 0 2 3 5 7 8 11;
minor_melodic_asc, 0 2 3 5 7 9 11;
minor_melodic_desc, 0 2 3 5 7 8 10;
The selected set of intervals, chosen by name with a menu, are
repeated over the whole range of MIDI notes, starting from
the root note defined by the user, and stored in another coll
object containing all the notes of the chosen, now current,
scale that will be used by the harmonizer. More scales can
be defined by the user and it would also be quite easy to
define a set of notes that don’t repeat at each octave, simply
by loading in the current scale coll a list of notes belonging
to the set contained in a text file. Those sets could be defined
using a virtual keyboard, a MIDI or OSC input, defined with
the Fretboard Grouping tool, or simply in a text editor.
In order to define how to harmonize, we also need rules to
modify the desired intervals depending on whether or not the
harmonized note with the desired transposition factor is part
of the chosen scale. Therefore we use the following rules, also
stored in a text file loaded by a coll object, where the first
interval is the preferred one, and the second, the choice if the
first fails to transpose the note within the chosen scale:
unison, 0 0;
second, 2 1;
third, 4 3;
fourth, 5 6;
fifth, 7 6;
sixth, 9 8;
seventh, 11 10;
octave, 12 12;
In order to augment the flexibility of the program, those first
and second intervals can be freely entered by the user, includ-
ing fractional half-tones. Though the two proposed choices in
the predefined intervals will always yield at least one note in
the scale for traditional western scales, it may not be the case
for non-western ones or with non-integer half-tones. Therefore
we added a third choice (see Fig. 9). Experiments with a viola
player and quarter or eight-tones yielded very surprising and
interesting results. But the availability of three levels of choice
allow also to force an interval by specifying three times the
same one, or to allow only one interval if it fits within the
scale and no transposition otherwise, by specifying the desired
interval as the first choice and 0 for the second and the third
ones. We also added the possibility to shift the result one
octave down or up with the red menu (-, 0, +) at the right
of the interval menu. The actual harmonization is done with
a combination of the psych˜ and gizmo˜ objects whose
levels may be adjusted differently for each string. We kept the
two algorithms, the first in the time domain and the second
in frequency domain, as they do sound quite differently. And,
at almost no cpu cost, one may define two additional sound
transpositions with psych˜. This can be used for chorus-like
effects or for octave doubling.
Thus, using the knowledge of the played notes, a scale or a
set of notes, and rules determining the desired harmonization
factor depending on the formers, we defined an adaptive
transformation, depending on the input notes. And different
intervals or rules may be applied individually to each guitar
string.
We described how the transposition factor can be chosen
in a smart way, but there are times where one wants to mute
the output of the harmonizer. We implemented the following
mute functions:
• Mute input notes outside the chosen scale: if the played
note is not in the scale, there will be no harmonizing.
• Mute output notes outside the chosen scale: if the input
note transposed following the user-defined rule doesn’t
fit in the chosen scale, it won’t be harmonized.
• Mute output notes outside range: a range is defined for
each string, from the lowest note playable on that string
(the tuning can be easily defined) to that note transposed
by a user-defined amount of semitones; if the harmonized
note would fall outside the range, it isn’t harmonized.
• Mute harmonizer if cleared notes: the pitch extractor has
parameters that define what conditions stop the note. the
harmonization can be muted when a clear note condition
is met.
We might also want to prevent some played notes to be heard
on some strings. That would for instance be the case if some
string/note combinations are used as a kind of program change,
to change a preset that would for instance change the scale or
the harmonizing choices. This hasn’t been implemented yet.
Finally, it is possible to Harmonize using float pitch de-
tection: the harmonized note is ”retuned”, that is, transposed
to the closest tempered scale note, by taking into account
the detected deviation from the tempered note given by the
pitch extractor. Besides allowing the harmonizer result to be
exactly in tune, it opens another interesting application: if the
harmonizing interval is set to unison, the resulting note can
create beatings in regard to the played note when the string is
bent, or simply thicken the sound as no played note is exactly
in tune, and as the deviation in cents from the perfect tuning
evolves over the duration of a note.
Proceedings of the 5th International Summer Workshop on Multimodal Interfaces - eNTERFACE'09
23

Fig. 9. Shown here with a synthetic test tone, the Max/MSP patch that extracts the pitches independently for each string, using an hexaphonic microphone,and harmonizes the played notes in a smart way, i.e. taking into account the notes being played, a chosen scale and desired intervals defined independentlyfor each string.
IV. EDUTAINMENT SUB-PROJECT: STUDY WORKBENCH
Knowing that fitting an hexaphonic pickup requires a struc-
tural modification of the guitar, will it help enhance the
ergonomics (non-invasiveness) and allow a better performance
in terms of signal processing? Should we use a low-cost alter-
native that requires a webcam to analyse the guitarist’s gestures
using computer vision techniques [5, 6] and a monophonic
guitar sound, so that to extract all the necessary information
of both methods through multimodal fusion [66]? In the
following part, we will narrow down the scope to focus on
the multimodal musical transcription.
The precursor of the multimodal musical transcription is
Gillet’s work transcribing drum sequences [25], where joint
features are used. Ye Wang borrowed the philosophy of the
audio-visual speech recognition to try to realize the violin
transcription based on the weighted sum of ouput values of
modalities [72]. They both show the trend and promising
future of multimodal transcription. Garry Quested and Marco
Paleari separately proposed different methods on the guitar
with various modalities and deterministic fusion methods [66,
58], where [58] produced 89% of the recognition rate. How-
ever, their simple deterministic nature of the fusion schemes
fails to handle missing samples in audio and dropping frames
in video, which are always an issue in the real-time applica-
tion, and unexpected output of modalities. Hence, the recorded
experiment data requires no information loss, which leads to
the demand of very expensive high end recording equipment
and unaffordable computation load for a real-time application.
Moreover, the static weights on each modality in the fusion
scheme do not allow the system to adjust according to the
reliability of modalities, such as change of lighting condition
to cameras, and our crucial objective—user skills.
Considering their experience and working towards a real-
time audio-visual system of the multimodal musical transcrip-
tion, we build the system with the following characteristics:
1) Have low-cost hardware and software setup
2) Provide reliable real-time modalities
3) The audio modality is the main source of the information
(see section IV-B), while the video modality provides
supplementary information (see section IV-C)
4) Provide low information loss by building a stable data
acquisition approach (see section IV-E)
5) Have a probability-based fusion scheme to handle miss-
ing data, and unexpected or misinterpreted results from
single modalities to have better multi-pitch transcription
results (see section IV-D)
6) Include the updatable weights of each modalities in the
fusion scheme to allow system to adjust according to
users and reliability of modalities.
7) Visualize simultaneously the guitar score and feedback
from the score following evaluation (see section IV-F)
A real-time system of the multimodal musical transcription
mainly consists of three parts: data acquisition, modality
construction, machine learning and multimodal fusion. In
Proceedings of the 5th International Summer Workshop on Multimodal Interfaces - eNTERFACE'09
24

the following sections, we first introduce our design and
implementation of the overall system, and then detail them
right after that.
A. System Overview
In our system, two webcams and a finger tracking algorithm
form the video modality, soundcard and a polyphonic pitch
estimator form the audio modality, and finally a multimodal
algorithm fuse these two modality, shown in the top figure of
Fig. 10. A recording is system is also necessary during all the
process from design and fine-tune modalities, to multimodal
fusion mechanism design, shown in the bottom figure of
Fig. 10. The system hardware overview is shown in Fig. 11,
where we adopts the most common and low-cost devices,
including:
• 1 laptop with Microsoft Windows XP
• Two USB Logitech webcams (two concurrent high speed
Sony PS3 Eye cannot currently run at the same time on
the same computer)
• 1 Line6 Variax 300 guitar
• 1 TASCAM US-144 USB soundcard
• 1 external FireWire/USB hard-drive for storing offline
training data (non-necessary for the final system)
We also use an ARToolKitPlus [1] marker on the guitar
headstock and colored markers for fingertracking on finger
nails.
The problem now urns to choose a open source/low cost
platform which can provide stable, simple, and quick de-
velopment on data acquisition, modality construction, and
machine learning and multimodal fusion, where any of them
requires tedious work and complicated analysis process, based
on our low cost hardware setup. EyesWeb [29] from InfoMus
Lab, DIST-University of Genova, has been a very successful
platform for audio-visual real-time applications since 1997,
providing an intuitive visual graphical development environ-
ment and powerful support without charge. Pure Data is also
another effective open source real-time graphical programming
environment for audio, video, and graphical processing [59].
However, they can not easily make lossless synchronized
recording using multi-cameras and one microphone at the
same time. Their lack of support of easily integrating programs
in various languages slows down the early prototyping process.
OpenInterface [44, 45], developed by TELE Lab, University
of Louvain, is an ideal choice in our application, which allows
to fast prototype real-time multimodal interactive systems (or
online system with constant delay), and implement synchro-
nized raw data recorder. It provides a graphical programming
environment and interfacing programs in all the main-stream
programming languages such as C/C++, Java, Matlab [50] and
.NET. Shown in Fig. 10, all of the data acquisition, finger
tracking, pitch estimation, and multimodal fusion algorithm,
and recording function is implemented in OpenInterface.
Providing higher abstraction and statement power, Matlab
allows programmers to design and implement algorithm more
easily and faster. Thanks to the easy integration of the Matlab
engine by OpenInterface, we can easily have a recording
system of raw data, quickly integrate an “online” complete
�����������
���� ����
���� ����
���������������� �����
� ���� �������������� ����� �����
�����
� �����
���� �
!����� ������� �
�����������
���� ����
���� ����
�����
� �����
���� �
"� �����
Fig. 10. System Software Architecture Overview. Top: Runtime. Bottom:Recording
!"#"$%&'($)%$*
External FireWire/USB Hardisk
+,-.($/(0&/1$.""#)-.2#,*/'($)%$
2 WebcamsExternal USB Soundcard
Laptop
Fig. 11. System Hardware Overview
system with a short constant delay, and comfortably display
the results. Our finger tracking and pitch estimation algorithm
implementation also benefit from the same fact.
Our system diagram using OpenInterface both for online
and offline recording is shown in Fig. 12, including the
multi-cameras, audio, and ARToolkitplus components. Except
the other components for video-driving strict synchronization,
the Matlab processor component calls recording function of
raw data, finger tracking, and pitch estimation algorithms in
Matlab.
B. Audio Analysis: Polyphonic Pitch Estimation from a Mono-
phonic Signal
1) Background: As opposed to the method proposed in
section III-A1, we wanted to perform an estimation of the
fundamental frequency of each note played by the musical
instrument without using expensive or non-factory devices
such as hexaphonic pickups, not available on most affordable
guitars.
Proceedings of the 5th International Summer Workshop on Multimodal Interfaces - eNTERFACE'09
25

Fig. 12. System Diagram (online and offline recording) using OpenInter-face [44, 45]
The third running of the annual Music Information Re-
trieval Evaluation eXchange (MIREX) [19] gives an up-to-
date overview of methods and algorithms for multiple fun-
damental frequency estimation & tracking (see the contest
results here [53]), yet it focuses on accuracy of the results,
thus algorithms don’t need to run in real time, a mandatory
feature for our system.
Due to the limited time available, we decided to use
methods that we already implemented, whose source code was
available, and which were designed to work in real time.
Klapuri’s method [37] doesn’t implement polyphony esti-
mation, but the output salience values can be used to estimate
polyphony (eq.(8) in [37]). The polyphony estimation is not
very reliable however, especially if levels of component sounds
vary (not equal levels).
Arshia Cont’s realtime algorithm [13] is based on a non-
negative sparse decomposition of the incoming signal as a
product of two matrices:
• the first matrix is filled with the spectrum of all the single
notes that the instrument can produce, the notes being
recorded offline one-by-one so as to train the system;
• the second matrix, a vector, indexes all the notes that are
detected in the audio signal, containing a high value at
each row that corresponds to each detected note, a low
value for all other non-present notes.
As sound is harmonic by nature, harmonics can overlap
between notes. “Sparse” means that the whole playing should
be described by the smallest number of note components,
given a predefined maximum number of decomposition it-
erations. Arshia Cont offers for free his algorithm as a
transcribe˜ [13, 12] object, for Max/MSP [15] and Pure-
Data [59]: to our knowledge, it is the only realtime imple-
mentation available, for free, working inside the opensource
PureData modular environment.
O’Grady and Rickard also proposed an algorithm based on
non-negative matrix decomposition, but running offline and
requiring an hexaphonic pickup [56].
2) Implementation: We used Arshia Cont’s realtime algo-
rithm. In order to have the algorithm work with guitar sounds,
we had to record guitar notes one-by-one so as to train the
algorithm, using the Matlab code Arshia Cont provided us.
We modified the C++ transcribe˜ [13, 12] flext ob-
ject [27, 28] object and the Matlab template training source
codes so as to exchange template files between the two using
MAT files, instead of the former text files that caused us issues
with parsing on different OS platforms. We used libmatio,
a LGPL C library [49]. Additionaly to the template matrix
contained in the template file, we added metadata that is
written on the MAT file after the template training and loaded
and parsed in the flext object:
• lowest_midi_pitch (21 for piano, 40 for guitar,
38 for “Drop-D” guitar), defining how the pitch list is
indexed;
• fft_size and hop_size for a consistency check
(MAT file and the transcribe˜ object settings values
won’t match, the user is adviced to change the object
settings)
• (optional) instrument, author, institute, date
and email for further contacts
We hope that Arshia Cont will integrate our modifications
to the next transcribe˜ release. Note that everything in
the chain can rely on free software as the template training
works as well with Octave [26].
Due to the fact that this algorithm has been shown to provide
accuracy of at most 88% [11] for the piano, visual modality
should help increase the robustness of the pitch transcription
and provide extra information such as identifying which strings
have been played.
C. Computer Vision Analysis
As a role to provide finger positions and complement the
audio modality, we survey the literature and seek a robust
method, which should estimate the three dimensional posi-
tion of four fingers—the two dimensional position above the
fingerboard plane and the distance between fingers and the
fingerboard. [74] detected fingers on the violin by using the
Condensation algorithm [34], in which the joint finger model
dynamics and the Gaussian skin color model are employed.
However, for the note inference, it does not provide satis-
fying results (14.9% full-matches and 65.1% partial matches
between audio and video results), perhaps because of lack of
another camera to provide three-dimensional information.
We adopt a method based on Chutisant Kerdvibulvech’s
work which made use of two webcams and an integration
of the bayesian classifier, ARTag, and Particle Filtering and
colored markers to provide four finger three dimensional
positions relative to the marker mounted on the guitar [36].
Though Chutisant Kerdvibulvech’s paper does not provide
scientific evaluation of precision under a large scale test,
which is one of the drawbacks and challenges to adopt this
method, his survey based on several user survey did showed
a subjective positive tracking result.
In his method, the ARTag marker appearing on the images is
used to calculate projection matrices used later in the tracking
Proceedings of the 5th International Summer Workshop on Multimodal Interfaces - eNTERFACE'09
26

algorithm to map the three dimensional guitar coordinate into
two dimensional image coordinate [36]. Bayesian classifier
and image processing techniques form a probability map for
each pixel of the whole images using pre-trained classifier
and adaptive classifier, which is used to reduce the impact
from slight change of the lighting condition [36]. Combining
these parameters, particle filtering tracks finger markers by
generating particles in a three-dimensional guitar coordinate
system, and has them mapped onto the two dimensional
coordinate using the projection matrices given the probability
map as weights on each particle, and finally obtain the average
finger markers three-dimensional positions. Two images are
used to enhance the precision of the results [36].
Based on the main concepts, we re-implement this method
with some modifications: Instead of using ARTag to calculate
the projection matrix for calibration of the guitar position,
we make use of ARToolKitPlus [1] due to its advantages of
high recognition performance, free charge, and the lack of
availability of ARTag. Image processing techniques also have
been modified. The simplified structure of our implementation
has been shown in Fig. 13. The tracking result is shown in
Fig. 14. Since we use OpenCV as a main interfacing for video
acquisition, the maximum frame rate we can reach is 15 fps
due to the limitation of the OpenCV.
!"#$%&'(#$)'*+,--./#$'0%&/1&
2#31-'*45"#6#$#-7
8&-914$#-7'0%$&#:';<
8&-914$#-7'0%$&#:';=
8-6#$#-7'->'*+,--./#$'0%&/1&'%73'?#7@1&A-%&3
2#31-
B>>.#71',&%#7#7@ 8%&$#4.1
?#.$1@
C%D16#%7E.%66#>#1&
*+,--./#$
0%&/1&',&%4/#7@
B>>.#712#31-
B7.#71'C%D16#%7,&%#7#7@
0%&/1&'8-6#$#-76
#7!"#$%&'
E--&3#7%$1
0%&/1&6
BF17E2
?"&$)1&'?"6#-7'
?#7@1&A-%&3'%73'0%&/1&'G&%(#7@
Fig. 13. Our Finger Tracking Implementation
Fig. 14. Tracking Result of Our Implementation
D. Multimodal Fusion and Mapping Scheme
1) State-of-the-art: Since each modality has its own recog-
nition in each modality, we should choose one among methods
of intermediate fusion. The intermediate fusion methods, like
probabilistic graphical model methods, such as Bayesian net-
works, can handle the imperfect data, generate its conclusion
so that its certainty varies according to the input data [35].
Bayesian Networks or Dynamic Bayesian networks is very
suitable for fusing our noisy or sometimes even missing
results of locating finger position and audio pitch recognition
results. Hence, for the fusion method, we adopt the Bayesian
Networks method here. In our proposed scheme, weights of
each modalities, representing the reliability of each modality,
and majority vote techniques are included. The overall system
is shown in Fig. 15.
Fig. 15. Overall Fusion Scheme
2) Preprocessing system: In order to produce the best
reasonable finger-pitch pairs to train and test the Bayesian
Networks (BN). We need first to synchronize the recognition
streams of the two modalities, and then the paring process is
needed as the proposed system is a multi-pitch score follower,
where more than one finger is tracked and maybe more than
one pitch may be played at the same time.
3) Synchronization problem of two modalities: For the
video modality, the frame rate is fixed as 30fps. For the audio
modality, consisting in estimating the fundamental frequency
of each note played by the musical instrument, we used Arshia
Cont’s realtime algorithm [13]. The frame rate of informative
data stream produced from this algorithm is not fixed. It
presents the pitch and its amplitude when there are one or more
onset(s) are detected. Thus we use these onset signals as the
signs of synchronization. When there is an onset appearence
at time TP , we look for the closest TF from the video frames
and the corresponding frame FTp. Then we group the pitch
happened at TP and fingers positions from frame FTp together
and mark these groups by TP .
4) Event pairing problem of synchronized data: After the
synchronization processing, now we have the temporal groups
containing the data from the audio and video modalities. What
we do following that is to pair the pitch data with the most
probable finger that played this pitch. In order to do that, we
Proceedings of the 5th International Summer Workshop on Multimodal Interfaces - eNTERFACE'09
27

first mapping the pitch to the guitar finger board area according
to Fig. 16. As a single pitch could be related to three String-
Fret combinations in maximum, we list all possible String-Fret
combinations down.
Fig. 16. Pitch-Finger board mapping table
Then, we need to map the finger data (X, Y, Z) to the
corresponding String-Fret as well. In guitar playing, there are
six notes that can be played without pressing any fret. They
are called 0-Fret notes and they appear commonly during the
guitar playing. In the cases that a 0-Fret note is played, it
is highly possible that no finger would be tracked on the
corresponding 0-Fret area. Our solution to this problem is
setting the default frets that are pressed on all strings to 0 at
each video modality frame. Then a later modification is made
when the finger position data (X, Y, Z) indicates so. When
we deal with the finger data (four fingers in maximum) in a
temporal group. We look at the Z first. If Z is smaller than or
equal to Zth , then we map the corresponding X-Y pair to the
String-Fret combination to change the default fret(which is 0)
on that string. The Zth here means the threshold Z of pressing.
If a Z is smaller than Zth, we consider this finger as in the
pressing status. In our case, we chose 8 mm as the Zth. During
the mapping from X-Y pair to String-Fret combination, we
use the idea of ’area’ to classify the finger position. The ’area’
of ’string SA and fret FB’ is defined as from the midpoint of
SA−1 and SA, Mid(SA−1, SA), to Mid(SA, SA+1) vertically
and from Mid(FB−1, FB) to Mid(FB and FB+1) horizontally.
In the case of first string or zero fret, we use Mid(S2, S1) and
Mid(F1, F0) as the low vertical boundary and left horizontal
boundary respectively. The distance from the nut to the nth
fret can be expressed as
D = L−L
2n
12
(5)
So the distance from the nut to the midpoint of nth and
(n + 1)th fret can be expressed as
Dm = (1−1 + 2
112
2n+13
12
)L (6)
In our case, L is equal to 640mm and the distance between
two strings is 7.2mm in average. Due to the lack of absolute
parallelism of six strings, the square area we use here is an
approximate one. In order to achieve higher accuracy, we are
going to use Neural Networks as the nonlinear transformation
function between X-Y and String-Fret in the future improve-
ment. As this is the proto type of system and the lack of
parallelism is so little, we will use these square areas for now.
After we scan all the finger data in one temporal group, we
will have six Fret-String combinations from video modality
and in maximum three Fret-String combinations from audio
modality from that group. Then, we calculate the closest
(highest possibility) finger that related to the pitch. Now, we
have the pitch that is played and the related finger area ready
for the BN.
5) Fusion System: Bayesian Network: Inspired by [52], we
created a Bayesian network as our fusion scheme, shown in
Fig. 17. According to [52], a Bayesian network over universe
U with observed evidence e is expressed in the following
equation:
P (U, e) =∏
A∈U
P (A|pa(A)) ·∏
i
ei (7)
where P (U, e) is the joint probability of U and e, and pa(A)is the parent set of A. In our network, the observed evidence
e is the observed outputs from the pitch detection, the frets
and strings from the finger position tracked, as well as their
corresponding weight. The evidences are represented by the
nodes Pitch Detected (PD), Fret Detected (FD), String De-
tected (SD) and their corresponding weight is represented by
node WA and WV respectively. Note (N ), Fret(F ), String(S)
and Image(I) are the unobserved variables. The Combination
Played node (C) is the played score and the fret as well
as string that player used which we are trying to find. Each
arrow represents a conditional probability. The values of the
observed evidence are represented by PD = pd, FD = fd,
SD = sd, WA = wa, and WV = wv, respectively. The
inference equation is then derived as:
P (C|N, I) =P (Pd) · P (wa) · P (fd) · P (sd) · P (wv)
· P (N |PD,Wa) · P (F |fd,wv)
· P (S|sd, wv) · P (I|F, S)
(8)
Fig. 17. The Bayesian Network Diagram
Proceedings of the 5th International Summer Workshop on Multimodal Interfaces - eNTERFACE'09
28

6) Modality Weight Computation and Majority Vote: Be-
fore we feed the data to the BN, the Modality Weight WA and
WV reflect the reliability of the two modalities and how much
they affect the fusion result. WA and WV are decided by two
factors: modality failure detection and modality reliability.
Modality failure detection try to detect if the device is
failure: if either audio or video signal within a time frame
has no values, then the modality should be give zero weight
until non-zero signals are detected.
It is not easy to determine reliability of the each modalities,
though many parameters in the algorithm of the two modalities
provide limited clues. Hence, instead of having an explicit
setup of the weights of the two modalities, by the concept of
majority vote, we can generate several reasonably distributed
sets of weights. They are multiplied by corresponding failure
detection result and then normalized. Each pair of weights will
lead to a specific classification results in the Bayesian network,
and the result of the majority is our final result. It provide a
way to avoid calculating weights explicitly, which might not
improve or even degrade the performance of the system.
E. Data Recording for Training
While our aim is to recognize multiple notes at the same
time, it is reasonable to first reach the single note recognition
and the the two note recognition as our preliminary goals.
We further limit the range to recognize notes into first 30
positions, that is, from 1E to 29Ab in Fig. 16. To train the
system, at least 10 pairs of video and audio information in each
class should be recorded. We have made 300 data samples for
single notes, while having to make 10 notes for each common
frequent pair(should be much less than C302 · 10 = 4350).
In the recording setup, projection matrices from two images
are computed, synchronized, and stored together with an audio
vector of 4096 samples in 44.1 kHz, and two images in the
size of 288×352 in the same data packet. All these data will
be fed to the following recognition algorithm to produce the
results. The two images with the ARToolKitPlus [1] output
are shown in Fig. 18. The runtime display of the recording
system is shown in Fig. 19, where sound samples, projection
matrices are drawn at the right hand side using the function
of Matlab.
F. Visualization
1) Available guitar score visualization tools: So as to
provide both a visualization of the score to be played by the
guitarist and visual feedback on how accurately the score is
actually played by the guitarist, we initially planned to modify
an open-source equivalent of the Guitar Hero video game,
named Frets On Fire [39], because of its engaging and fun
visual interface. While we are still in the design phase of our
system and it can not yet estimate in real time the accuracy of
the guitar playing, we needed to use a tool that assisted us for
the recording of the system training database and the testing
of the system. A guitar score visualization application such as
TuxGuitar [71] is better aimed for that purpose, as it allows to
browse the score backwards in time once the score has been
played and annotated. Once the real time implementation of
Fig. 18. Guitar tracking with ARToolkitplus
Fig. 19. Data Recording Runtime
our system will be ready, TuxGuitar will also position itself
a perfect companion to Frets On Fire, complementary to the
entertaining feel of the latter because the former displays the
score with classical and tablature notations necessary to learn
the guitar further than technique and fluidity.
The FTM library [69, 33], already available for Max/MSP
and in development for PureData [75], offers a classical
score visualization with the ftm.editor object. Once the
porting in PureData is mature enough and if a guitar score
visualization is added to the ftm.editor, this could be seen
as another alternative that would be more tightly integrated
into the main framework integrating modalities, PureData for
the realtime version of our system.
2) Choice and modifications: We achieved initial results
by creating an OpenSoundControl plugin for TuxGuitar that
allows remote control through the OSC protocol, both on
Matlab and patcher applications such as Pd and Max/MSP.
Proceedings of the 5th International Summer Workshop on Multimodal Interfaces - eNTERFACE'09
29

Currently supported commands are:
• loading a score file (/load <file_location>),
• initiating the playback (/play),
• stopping or pausing the playback (/stop).
We still need to modify the plugin so as to provide the
visual feedback on the accuracy of the playing. Current notes
to be played on the score are colored in red by default
in TuxGuitar. We plan to use colors as well to label and
distinguish accurately played notes (for example, in green)
and wrong/missed notes (for example, in orange) and the note
to be played on the score (for example, in red, the most salient
color).
Fig. 20. Mockup of the TuxGuitar [71] interface featuring colored notesgiving a visual feedback of the score following. A first version of our OSCcommunication plugin is also set on.
V. CONCLUSION AND PERSPECTIVES
A. Performance Toolbox
We achieved a usable toolbox for hexaphonic or mono-
phonic guitar. These tools are available for the Max/MSP [15]
and/or PureData [59] environments. We worked on all the part
of the chain of augmented music, from extraction and use
of audio signal features to digital audio effects manipulated
by gestural control with sensors. All the tools (Polyphonic
Pitch Extraction, Fretboard Grouping, Rear-Mounted Pres-
sure Sensors, Modal Synthesis, Infinite Sustain, Rearranging
Looper, Smart Harmonizer) need to be developed for both
environments (i.e Max/MSP and PureData) and documentation
and/or tutorials will be provided so that everything can be
freely downloadable on the eNTERFACE’09 and numediart
websites and be directly usable.
Concerning the Fretboard Grouping tool, more efforts will
be put in the chord / arpeggio discrimination (i.e not to base it
only on the time needed to play the group). To achieve a better
discrimination, one track that we will follow, will be to add
time between notes directly in the group definition. Doing that,
the chord / arpeggio discrimination would become obsolete as
groups will not be considered anymore only as a gathering of
notes but as a gathering of notes through time. A group record
feature can then be added to the module so that one can record
a group played in a specific way.
Physical sound synthesis sometimes lacks realism. One in-
teresting approach can be to use pre-recorded sounds relevant
to specific play on guitar such as sliding, slapping, etc.., to add
more texture to the modal sounds. Since we proposed granular
synthesis to enrich the guitar sustain, we could collect audio
grains for enhancement of both modal sounds and sustains. By
using the approach from Picard et al. [62], audio grains could
be automatically extracted from recordings. In addition, the
audio grains could be properly retargeted to specific outputs
of sensors during runtime.
B. Study Workbench
We built a careful design of the multimodal score following
system. We prototyped many algorithms for: finger tracking,
guitar headstock 3D location, multiple pitch estimation from
a monophonic audio signal of the guitar, bayesian networks
for multimodal fusion and synchronized modalities recording
(mono audio, multiple cameras). Each module works effi-
ciently offline and separately. We build an initial synchronized
recordings database.
We still need to do a proper study and working implementa-
tion of the score visualization and visual feedback of the score
following. We need to test and improve the system so that it
can run in real time. We also need to undertake user testing so
as to evaluate and validate the precision and performance of
the system. To complement the multimodal fusion, we could
build an ontology of the guitar playing domain, by extract-
ing, classifying and interpreting “guitar techniques”, such as
“bends”, “hammer-ons”, “pull-offs”, “artificial harmonics”, the
plucking position [70].
ACKNOWLEDGMENT
Christian Frisson, Anderson Mills, Loıc Reboursiere and
Todor Todoroff are supported by numediart, a long-term
research program centered on Digital Media Arts, funded by
Region Wallonne, Belgium (grant N◦716631).
Wen-Yang Chu is funded by the FRIA grant of FNRS,
Region Wallonne, Belgium.
Otso Lahdeoja’s work is partially funded by Anne Sedes
from CICM, University of Paris 8.
Cecile Picard work is partially funded by Eden Games, and
ATARI Game Studio in Lyon, France.
Ao Shen is supported and funded by his supervisor Neil
Cooke and EECE Department, University of Birmingham.
We would like to thank Ashia Cont (IRCAM) for having
provided us the source codes for the transcribe˜ flext
object (C++) [12] and the related template training (Matlab).
We are grateful to Damien Tardieu (FPMs/TCTS) for having
Proceedings of the 5th International Summer Workshop on Multimodal Interfaces - eNTERFACE'09
30

helped us modify the aforementioned code to adapt it to the
guitar.
We offer thanks to Emmanuel Vincent and Anssi Klapuri
who provided us their implementation of the polyphonic pitch
estimation.
We show our appreciation to Jean-Yves Lionel Lawson
(UCL-TELE) for assisting building the recording and inte-
grated OpenInterface system of the “edutainment” part.
We would like to thank Otso Lahdeoja, Anne Sedes and
the organizing team from CICM, for having welcomed us
at Identites de la Guitare Electrique - Journees d’etude in-
terdisciplinaires a la Maison des Sciences de l’Homme Paris
Nord, on May 18-19 2009, to present the objectives of the
Multimodal Guitar project. A publication on the proceedings
will follow [22].
REFERENCES
Scientific references
[2] John Bowers and Phil Archer. “Not Hyper, Not Meta,
Not Cyber but Infra-Instruments”. In: Proceedings of
the 2005 International Conference on New Interfaces
for Musical Expression (NIME05). 2005. Pp. 5–10. P.:
1.
[3] Ivica Ico Bukvic et al. “munger1˜ : towards a cross-
platform swiss-army knife of real-time granular synthe-
sis”. In: Proc. ICMC. 2007. URL: http://ico.bukvic.net/
PDF/ICMC2007 munger1.pdf. P.: 7.
[5] Anne-Marie Burns. “Computer Vision Methods for Gui-
tarist Left-Hand Fingering Recognition”. MA thesis.
McGill University, 2006. Pp.: 1, 9.
[6] Anne-Marie Burns and Marcelo M. Wanderley. “Visual
Methods for the Retrieval of Guitarist Fingering”. In:
Proceedings of the 2006 International Conference on
New Interfaces for Musical Expression (NIME06). Paris,
France 2006. Pp. 196–199. Pp.: 1, 9.
[7] Ozan Cakmakci, Francois Berard, and Joelle Coutaz.
“An Augmented Reality Based Learning Assistant for
Electric Bass Guitar”. In: Proceedings of the Inter-
national Conference on Human Interaction (CHI03).
2003. P.: 1.
[8] Gavin Carfoot. “Acoustic, Electric and Virtual Noise:
The Cultural Identity of the Guitar”. In: Leonardo Music
Journal 16 (2006). Pp. 35–39. P.: 1.
[9] Alain de Cheveigne. “Procede d’extraction de la
frequence fondamentale d’un signal sonore au moyen
d’un dispositif mettant en oeuvre un algorithme
d’autocorrelation”. Pat. 01 07284. 2001. P.: 2.
[10] Alain de Cheveigne and Hideki Kawahara. “YIN, a fun-
damental frequency estimator for speech and music”. In:
J. Acoust. Soc. Am. 111.4 (Apr. 2002). Pp. 1917–1930.
P.: 2.
[11] Arshia Cont. “Realtime Multiple Pitch Observation
using Sparse Non-negative Constraints”. In: Interna-
tional Symposium on Music Information Retrieval (IS-
MIR). 2006. URL: http://cosmal.ucsd.edu/arshia/papers/
ArshiaCont ismir2006.pdf. P.: 11.
[13] Arshia Cont, Shlomo Dubnov, and David Wessel. “Re-
altime Multiple-pitch and Multiple-instrument Recog-
nition For Music Signals using Sparse Non-negative
Constraints”. In: Proceedings of Digital Audio Effects
Conference (DAFx). 2007. URL: http://cosmal.ucsd.
edu/arshia/index.php?n=Main.Transcribe. Pp.: 11, 12.
[14] Perry R. Cook. Real Sound Synthesis for Interactive
Applications. A. K. Peters, 2002. P.: 6.
[17] Kees van den Doel, Paul Kry, and Dinesh K.
Pai. “FoleyAutomatic: Physically-based Sound Ef-
fects for Interactive Simulation and Animations”. In:
ACM SIGGRAPH 01 Conference Proceedings. 2001.
Chap. Modal Synthesis for Vibrating Objects. ISBN:
978-1568812151. URL: http://www.cs.ubc.ca/∼kvdoel/
publications/foleyautomatic.pdf. P.: 7.
[18] Kees van den Doel and Dinesh K. Pai. “Audio Anec-
dotes III: Tools, Tips, and Techniques for Digital Au-
dio”. In: ed. by Ken Greenebaum and Ronen Barzel.
3rd ed. Source code available at http://www.cs.ubc.
ca/∼kvdoel/publications/srcmodalpaper.zip. A. K. Peter,
2006. Chap. Modal Synthesis for Vibrating Objects,
pp. 99–120. ISBN: 978-1568812151. URL: http://www.
cs.ubc.ca/∼kvdoel/publications/modalpaper.pdf. P.: 7.
[19] J. Stephen Downie. “The music information retrieval
evaluation exchange (2005-2007): A window into music
information retrieval research”. In: Acoustical Science
and Technology 29.4 (2008). Pp. 247–255. P.: 11.
[20] Richard Mark French. Engineering the Guitar: Theory
and Practice. Springer, 2008. ISBN: 9780387743684.
P.: 1.
[21] G. Friedland, W. Hurst, and L. Knipping. “Educa-
tional Multimedia”. In: IEEE Multimedia Magazine
15.3 (2008). Pp. 54–56. ISSN: 1070-986X. DOI: 10.
1109/MMUL.2008.71. P.: 1.
[22] Christian Frisson et al. “eNTERFACE’09 Multimodal
Guitar project: Performance Toolkit and Study Work-
bench”. In: Actes des Journees d’etude interdisci-
plinaires sur l’Identites de la Guitare Electrique. (to
appear). Maison des Sciences de l’Homme Paris Nord,
Paris, France 2010. URL: http://www.guitarelectrique.
fr. P.: 16.
[24] Francois Gautier et al. “Helmoltz: un outil de car-
acterisation des deux premiers modes de la guitare”. In:
Journees Professionnelles Facture Instrumentale “Met-
tre en Commun”. 2005. P.: 19.
[25] O. Gillet and G. Richard. “Automatic transcription of
drum sequences using audiovisual features”. In: IEEE
International Conference on Acoustics, Speech, and Sig-
nal Processing, 2005. Proceedings.(ICASSP’05). Vol. 3.
2005. P.: 9.
[27] Thomas Grill. “flext - C++ layer for Pure Data &
Max/MSP externals”. In: The second Linux Audio Con-
ference (LAC). 2004. URL: http://lad.linuxaudio.org/
events / 2004 zkm / slides / thursday / thomas grill - flext .
pdf. Pp.: 7, 11.
[32] Francisco Iovino, Rene Causse, and Richard Dudas.
“Recent work around Modalys and Modal Synthesis”.
Proceedings of the 5th International Summer Workshop on Multimodal Interfaces - eNTERFACE'09
31

In: ICMC: International Computer Music Conference.
Thessaloniki Hellas, Greece 1997. Pp. 356–359. P.: 6.
[34] M. Isard and A. Blake. “Contour tracking by stochastic
propagation of conditional density”. In: Lecture Notes
in Computer Science 1064 (1996). Pp. 343–356. P.: 11.
[35] Alejandro Jaimes and Nicu Sebe. “Multimodal human-
computer interaction: A survey”. In: Computer Vi-
sion and Image Understanding 108.1-2 (2007). Spe-
cial Issue on Vision for Human-Computer Interaction.
Pp. 116–134. ISSN: 1077-3142. P.: 12.
[36] Chutisant Kerdvibulvech and Hideo Saito. “Guitarist
Fingertip Tracking by Integrating a Bayesian Classifier
into Particle Filters”. In: Advances in Human-Computer
Interaction 2008 (2008). Pp.: 11, 12.
[37] A. Klapuri. “Multiple fundamental frequency estima-
tion by summing harmonic amplitudes”. In: 7th In-
ternational Conference on Music InformationRetrieval
(ISMIR-06). 2006. P.: 11.
[38] David Kushner. “The Making of The Beatles: Rock
Band”. In: IEEE Spectrum (Oct. 2009). Pp. 26–31.
URL: http://spectrum.ieee.org/consumer- electronics/
gaming/the-making-of-the-beatles-rock-band. P.: 1.
[40] Otso Lahdeoja. “An Approach to Instrument Augmen-
tation : the Electric Guitar”. In: Proceedings of the 2008
Conference on New Interfaces for Musical Expression
(NIME08). 2008. P.: 1.
[41] Otso Lahdeoja. “Guitare electrique augmentee: une ap-
proche du controle gestuel des “effets” de la guitare
electrique”. In: Articles des Journees d’Informatique
Musicale. 2008. P.: 1.
[43] Otso Lahdeoja. “Une approche de l’instrument aug-
mente: Le cas de la guitare electrique”. In: Actes
de la conference francophone d’Interaction Homme-
Machine (IHM). 2007. URL: http://www.lahdeoja.org/
ftplahdeoja/augmented guitar/otso.lahdeojaIHM08.pdf.
P.: 1.
[44] J.Y.L. Lawson et al. “An open source workbench for
prototyping multimodal interactions based on off-the-
shelf heterogeneous components”. In: Proceedings of
the 1st ACM SIGCHI symposium on Engineering inter-
active computing systems. ACM. 2009. Pp. 245–254.
Pp.: 10, 11.
[46] Christophe Leduc. “Instruments de musique a cordes
frottees ou pincees”. Pat. FR2677160. Dec. 4, 1992. P.:
6.
[47] Christophe Leduc. “Musical instruments having bowed
or plucked strings”. Pat. US5339718. Aug. 23, 1994.
P.: 6.
[48] Nicolas Leroy, Emmanuel Flety, and Frederic Bevilac-
qua. “Reflective Optical Pickup For Violin”. In: Pro-
ceedings of the 2006 International Conference on New
Interfaces for Musical Expression (NIME06). 2006. P.:
1.
[52] Ankush Mittal and Ashraf Kassim. Bayesian Net-
work Technologies: Applications and Graphical Mod-
els. Hershey, PA, USA: IGI Publishing, 2007. ISBN:
1599041413, 9781599041414. P.: 13.
[54] Axel Nackaerts, Bart De Moor, and Rudy Lauwereins.
“Measurement of guitar string coupling”. In: Proceed-
ings of the International Computer Music Conference
(ICMC). 2002. URL: ftp://ftp.esat.kuleuven.ac.be/pub/
SISTA/nackaerts/reports/report ICMC2002.ps.gz. Pp.:
2, 3.
[55] James F. O’Brien, Chen Shen, and Christine M.
Gatchalian. “Synthesizing sounds from rigid-body sim-
ulations”. In: Proceedings of the 2002 ACM SIG-
GRAPH/Eurographics symposium on Computer anima-
tion (SCA’02). ACM, 2002. Pp. 175–181. ISBN: 1-
58113-573-4. P.: 6.
[56] Paul D. O’Grady and Scott T. Rickard. “Automatic
Hexaphonic Guitar Transcription Using Non-Negative
Constraints”. In: Proceedings of the Irish Signal and
Systems Conference. 2009. URL: http://eleceng.ucd.ie/∼pogrady / papers / OGRADY RICKARD ISSC09 . pdf.
P.: 11.
[57] Dan Overholt. “The Overtone Violin”. In: Proceedings
of the 2005 Conference on New Interfaces for Musical
Expression (NIME05). 2005. P.: 1.
[58] M. Paleari et al. “A multimodal approach to music tran-
scription”. In: 15th IEEE International Conference on
Image Processing, 2008. ICIP 2008. 2008. Pp. 93–96.
P.: 9.
[60] Henri Penttinen, Aki Harma, and Matti Karjalainen.
“Digital Guitar Body Mode Modulation With One
Driving Parameter”. In: Proceedings of the COSTG-6
Conference on Digital Audio Effects (DAFX-00). Sound
samples available at http://www.acoustics.hut.fi/demos/
dafx2000-bodymod/. 2000. P.: 6.
[61] Henri Penttinen, Matti Karjalainen, and Aki Harma.
“Morphing Instrument Body Models”. In: Proceedings
of the COSTG-6 Conference on Digital Audio Effects
(DAFX-01). Sound samples available at http://www.
acoustics.hut.fi/demos/dafx2001-bodymorph/. 2001. P.:
6.
[62] Cecile Picard, Nicolas Tsingos, and Francois Faure.
“Retargetting Example Sounds to Interactive Physics-
Driven Animations”. In: AES 35th International Con-
ference on Audio for Games. 2009. URL: http://www-
sop.inria.fr/reves/Basilic/2009/PTF09. P.: 15.
[63] Cecile Picard et al. “A Robust And Multi-Scale Modal
Analysis For Sound Synthesis”. In: Proceedings of
the International Conference on Digital Audio Effects.
2009. URL: http://www-sop.inria.fr/reves/Basilic/2009/
PFDK09. P.: 6.
[64] Cornelius Poepel. “Synthesized Strings for String Play-
ers”. In: Proceedings of the 2004 Conference on New
Interfaces for Musical Expression (NIME04). 2004. P.:
1.
[65] Miller Puckette. “Patch for guitar”. In: Pd-convention.
Workshop Pd patches available here http://crca.ucsd.
edu/∼msp/lac/. 2007. URL: http://crca.ucsd.edu/∼msp/
Publications/pd07-reprint.pdf. P.: 2.
[66] G Quested, R D Boyle, and K Ng. “Polyphonic note
tracking using multimodal retrieval of musical events”.
In: Proceedings of the International Computer Music
Proceedings of the 5th International Summer Workshop on Multimodal Interfaces - eNTERFACE'09
32

Conference (ICMC). 2008. URL: http://www.comp.
leeds.ac.uk/roger/Research/Publications/Garry08.pdf.
P.: 9.
[69] Norbert Schnell et al. “FTM - Complex Data Struc-
tures for Max”. In: Proceedings of the International
Conference on Computer Music (ICMC). 2005. URL:
http://recherche.ircam.fr/equipes/temps- reel/articles/
ftm.icmc2005.pdf. P.: 14.
[70] Caroline Traube and Philippe Depalle. “Extraction of
the excitation point location on a string using weighted
least-square estimation of comb filter delay”. In: Pro-
ceedings of the Conference on Digital Audio Effects
(DAFx). 2003. URL: http : / /www.elec .qmul .ac .uk /
dafx03/proceedings/pdfs/dafx54.pdf. P.: 15.
[72] Y. Wang, B. Zhang, and O. Schleusing. “Educational
violin transcription by fusing multimedia streams”. In:
Proceedings of the international workshop on Educa-
tional multimedia and multimedia education. ACM New
York, NY, USA. 2007. Pp. 57–66. P.: 9.
[73] Shi Yong. Guitar Body Effect Simulation: a warped
LPC spectrum estimation and a warped all-pole fil-
ter implemented in Matlab and C++. Course Project
MUMT 612: Sound Synthesis and Audio Processing.
McGill University, 2007. URL: http : / /www.music .
mcgill.ca/∼yong/mumt612/mumt612.html. P.: 6.
[74] B. Zhang et al. “Visual analysis of fingering for peda-
gogical violin transcription”. In: Proceedings of the 15th
international conference on Multimedia. ACM New
York, NY, USA. 2007. Pp. 521–524. P.: 11.
[75] IOhannes Zmolnig et al. “Freer Than Max - porting
FTM to Pure data”. In: Proceedings of the Linux
Audio Conference (LAC-2008). 2008. URL: http://lac.
linuxaudio.org/2008/download/papers/20.pdf. P.: 14.
[76] Amit Zoran and Pattie Maes. “Considering Virtual and
Physical Aspects in Acoustic Guitar Design”. In: Pro-
ceedings of the 2008 Conference on New Interfaces for
Musical Expression (NIME08). 2008. P.: 6.
Software, hardware and technologies
[1] “ARToolKitPlus”. v.2.1.1. 2006. URL:
http : / / studierstube . icg . tu - graz . ac . at / handheld ar /
artoolkitplus.php. Pp.: 10, 12, 14.
[4] Ivica Ico Bukvic et al. “munger1˜ : towards a cross-
platform swiss-army knife of real-time granular synthe-
sis”. v. 1.3.2. 2009. URL: http://ico.bukvic.net/Max/
disis munger∼ latest.zip. P.: 7.
[12] Arshia Cont. “transcribe , Pd/Max/MSP object for Real-
time Transcription of Music Signals”. 2007. URL: http:
//cosmal.ucsd.edu/arshia/index.php?n=Main.Transcribe.
Pp.: 11, 15.
[15] Cycling’74. “Max/MSP”. URL: http://www.cycling74.
com. Pp.: 2, 3, 11, 15.
[16] Mark Danks et al. “GEM (Graphics Environment for
Multimedia)”. v.0.91. 2009. URL: http://gem.iem.at. P.:
4.
[23] Pascal Gauthier. “pdj, a java external plugin for pure
data”. URL: http://www.le-son666.com/software/pdj/.
P.: 4.
[26] “GNU Octave”. v.3.2.2. 2009. URL: http://www.octave.
org. P.: 11.
[28] Thomas Grill. “flext - C++ layer for Pure Data &
Max/MSP externals”. retrieved from SVN. 2009. URL:
http://puredata.info/Members/thomas/flext/. Pp.: 7, 11.
[29] DIST-University of Genova InfoMus Lab. “The Eye-
sWeb XMI (eXtended Multimodal Interaction) plat-
form”. Version 5.0.2.0. URL: http://www.eyesweb.org.
Pp.: 1, 10.
[30] INRIA. “The SOFA Framework (Simulation Open
Framework Architecture)”. GPL license. 2009. URL:
http://www.sofa-framework.org. P.: 6.
[31] Interface-Z. “Sensors and sensor interfaces”. URL: http:
//interface-z.com. Pp.: 2, 5.
[33] IRCAM. “FTM”. URL: http://ftm.ircam.fr. P.: 14.
[39] Sami Kyostila et al. “Frets On Fire”. Version 1.3.110.
URL: http://fretsonfire.sourceforge.net. Pp.: 4, 14.
[45] Lionel Lawson. “The OpenInterface platform”. 2009.
URL: http://www.openinterface.org. Pp.: 10, 11.
[49] “MAT File I/O Library”. v. 1.3.3 used, LPGL license.
2009. URL: http://sourceforge.net/projects/matio/. P.:
11.
[50] MathWorks. “Matlab”. v. 2008b. URL: http://www.
mathworks.com. P.: 10.
[51] Keith Mc Millen. “StringPort”. URL: http : / /www.
keithmcmillen.com. P.: 2.
[53] “Multiple Fundamental Frequency Estimation & Track-
ing Results”. 2007. URL: http://www.music- ir.org/
mirex/2007/. P.: 11.
[59] “pd-extended, a PureData installer including most of
the libraries from the Pd CVS repository”. Most recent
release (0.40.3). URL: http://puredata.info/downloads.
Pp.: 1–3, 10, 11, 15.
[68] Roland. “GK3 hexaphonic pickup and related hard-
ware”. URL: http://www.roland.com. P.: 2.
[71] “TuxGuitar”. v. 1.1, GPL license. 2009. URL: http://
tuxguitar.herac.com.ar. Pp.: 4, 14, 15.
Artistic references
[42] Otso Lahdeoja. MAA. URL: http://www.myspace.com/
maamusique. P.: 19.
[67] Loıc Reboursiere. Quand deux verites se rencontrent,
que se disent-elles? URL: http://lilacwine.free.fr. P.:
19.
Proceedings of the 5th International Summer Workshop on Multimodal Interfaces - eNTERFACE'09
33

BIOGRAPHIES
Christian Frisson received his M. Eng. degreein Acoustics and Metrology from Ecole NationaleSuperieure d’Ingenieurs du Mans (ENSIM) at Uni-versite du Maine, France, in 2005. He graduateda M. Sc. specialized in “Art, Science, Technology(AST)” from Institut National Polytechnique deGrenoble (INPG) and the Association for the Cre-ation and Research on Expression Tools (ACROE),France, in 2006; for which he visited the MusicTechnology Department of McGill University, Mon-treal, Canada. Since October 2006, he has been a
PhD student at the Communication and Remote Sensing Lab (TELE) ofUniversite de Louvain (UCL), Belgium.
Besides playing the guitar, he participated during his MEng studies to thedevelopment of a workbench aiding luthiers to design acoustic guitars withacoustical modal analysis [24].
Web: http://www.tele.ucl.ac.be/view-people.php?name=Christian.FrissonEmail: [email protected]
Loıc Reboursiere obtained his MArts in digitalscenography and audiovisual design in Valenciennesin 2008. He has been blending for several yearsdigital arts technologies with artistic performances,what he is now pursuing at the TCTS lab fromthe Polytechnic Faculty of Mons. He created andinterpreted a performance for spatialized hexaphonicguitar in 2008 [67].Web: http://lilacwine.free.frEmail: [email protected]
Wen-Yang Chu received the B.S. degree in elec-tronic engineering from Fu Jen Catholic University,Taipei, Taiwan in 2004, and the M.S. degrees ininformation and communication technologies fromUniversitat Politecnica de Catalunya and Univer-site catholique de Louvain(UCL) (MERIT-ErasmusMunds) in 2008. He currently is pursuing the Ph.Ddegree in Communication and Remote Sensing Lab(TELE), UCL, funded by the FRIA grant of FNRS,Region Wallonne, Belgium. His research interestsinclude adaptive mapping, educational applications,
multimodal signal processing and fusion, human-computer interaction, anddigital interactive arts.Web: http://www.tele.ucl.ac.be/view-people.php?name=Wen-Yang.ChuEmail: [email protected]
Otso Lahdeoja is a Finnish guitarist, composer andmusic researcher [42]. He obtained Bachelors andMasters degrees in Music and Musicology from Uni-versity of Paris 8. He is currently working on a PhDat Paris 8 University on augmented instruments.
As a musician and bandleader, he participates ina number of musical projects, playing frequently inFrance and abroad.Web: http://www.myspace.com/maamusique
John Anderson Mills holds a Computer Engineer-ing degree (1992) from Clemson University (USA).He received his master’s degree (1997) from ThePennsylvania State University in Acoustics with athesis on noise prediction for jet engines. He re-ceived a doctorate (2008 from The University ofTexas in Electrical Engineering with a dissertationon algorithmic analysis of electroacoustic musicusing psychoacoustic models. He joined numediartat the TCTS lab in 2009 with current interests insound analysis, computer music, social DSP, and
musician-instrument interaction.Web: http://academic.konfuzo.netEmail: [email protected]
Cecile Picard is currently a Computer GraphicsPh.D. candidate at INRIA, France, in the REVESteam. After receiving her diploma in MechanicalEngineering with specialization in Acoustics in 2005at the Universite de Technologie de Compiegne(UTC), France , she continued in the domain ofsound and obtained in 2006 a Msc. in Sound andVibrations at the Chalmers University in Goteborg,Sweden.
Her current research focuses on real-time soundrendering for virtual reality and in particular, on the
synthesis of sounds resulting from physical interactions of various objects ina 3D virtual environment. The main goal is to address different techniquesfor sound rendering based on the constraints that sounds are highly dynamicand vary depending on the interaction type and objects.Web: http://www-sop.inria.fr/reves/Cecile.Picard/Email: [email protected]
Ao Shen has a bachelor’s degree in Communica-tion Science & Engineering at Fudan University,Shanghai, China and a bachelor’s degree in Elec-tronic Communication Engineering at BirminghamUniversity, UK. He is experienced in coding mobileapplication and won the second prize in VodafoneBetavine Student Competition. Now he is doing hissecond year of PhD study in Electronic Electrical& Computer Engineering Department, University ofBirmingham.
His main interests are noise-robust multimodalsystem, semantic level application and fusion scheme for multimodal system.Email: [email protected]
Todor Todoroff holds an Electrical Engineering de-gree from the Universite Libre de Bruxelles (1987),a First Prize (1993) and a Higher Diploma (1996)in Electroacoustic Composition from the Royal Con-servatories of Music in Brussels and Mons.
After doing research in speech processing at theULB, he led between 1992 and 1997 a computermusic research project at the FPMs. He pursued atARTeM (Art, Recherche, technologie et Musique,Brussels) the development of real-time softwaretools for transformation and spatialisation of sounds
as well as the conception of interactive systems for sound installations anddance performances.
His music has been played in many concerts and festivals around the worldand he received the Prize of the Audience at the Noroit Competition (France,91), was finalist at the Luigi Russolo Competition (Italy, 1992), CIMESP(Brazil, 1995) and Musica Nova (Czekia, 2000) and received Mentions(2002, 2005 and 2009) and First Prize (2007) at the International BourgesCompetitions.Email: [email protected]
Proceedings of the 5th International Summer Workshop on Multimodal Interfaces - eNTERFACE'09
34

Video Navigation Tool: Application to browsing a
database of dancers’ performances
D. Tardieu∗, R. Chessini∗, J. Dubois∗, S. Dupont∗, S. Hidot∗, B. Mazzarino†, A. Moinet∗,
X. Siebert∗, G. Varni† and A. Visentin†
∗ TCTS Lab - Faculte Polytechnique de Mons, Belgium† InfoMus Lab, DIST - University of Genova, Italy
Abstract—The purpose of this project is to provide a methodand a software for browsing a dance video database. Thiswork has been done in collaboration with the artistic project“DANCERS!” [1]. A set of features describing dance are pro-posed, to quantify the gesture of the dancer, the usage of itspersonal space, the occupation of the stage and the temporalstructure of the choreography. These quantities are extractedusing the EyesWeb XMI platform [2], to which new featureswere added. The description of the video is used to compute thesimilarity between the dancers and then to help the explorationof the database. The management of the video and featurecollection is done using the Mediacycle software [3] which hasbeen extended from sounds and images to videos databases.
I. INTRODUCTION
This project aims at creating a navigation software for
browsing video databases. In the context of the eNTER-
FACE09 workshop, we focused on dance videos, in association
with the artistic project “DANCERS!” [1]. To allow content
based navigation in the database, features describing the
performance have to be extracted from the video. We propose
a set of features that can be divided into three categories:
first, gesture features that describes how a dancer moves in
the closely surrounding space (the kinesphere); second, space
occupation features describing how a dancer uses the whole
stage space; third, features describing the temporal structure
of the choreography.
The feature extraction is done in three steps. First, the
silhouette of the dancer is extracted using a simple background
subtraction technique and the bounding box is computed. Then
frame by frame features (also called temporal features) are
calculated. Finally, those temporal features are summarized
using several statistical methods. One of the main contributions
of this project is the proposition of a reduced set of features
aiming at summarizing the characteristics of the performance.
More precisely, we propose a low-dimensional set of features
for the description of the space occupation and a technique for
the discovery of the temporal structure of the choreography
borrowed from the music analysis field. The extraction of the
temporal features was performed using the EyesWeb XMI
software platform [2] and in particular using the EyesWeb
Gesture Processing Library [4]. A new EyesWeb module for
rotation detection was also developed. The global features
are computed by the Mediacycle software which is as well
in charge of the feature database organization and browsing.
Manual annotation of the videos were also performed, to allow
the objective validation of the extracted feature.
The paper is organized as follows : In the first section
we describe the dance video corpus that has been used and
the manual annotation. In the second section we detail the
proposed features and their extraction method and finally we
give an overview of the navigation system.
II. DANCE VIDEO CORPUS
This project focuses on short videos of dancer performances,
that have been filmed in a calibrated setup described below.
It is associated with the artistic project ”DANCERS!” [1] of
the choreographer Bud Blumenthal, which aims at providing
a high quality audiovisual database of professional dancer
performances, that can be browsed via a website. The website
will be presented in a public installation in November 2009 at
the Biennale of Charleroi-Danses 1 in Belgium.
A. Setup
The stage setup is described on Fig. 2: each dancer performs
a two-minutes improvisation in the space colored in red, either
in silence or with a piece of music. Two videos are recorded:
one from the front (labeled ”EX1” on the picture) and one from
the top. For technical reasons, the top camera (wide angle) was
placed about 6 meters from the floor, and the sides of the stage
are slightly cut on the top-camera video recording (see Fig 1,
right). The front videos are recorded in High Definition (HD),
25 frames per second, interlaced, using the XDCAM-EX codec.
Fig. 1. Snapshot of a front and top videos (dancer: Claire O’Neil).
About 140 videos (two trials per dancer) were available at
the time of the eNTERFACE09 workshop, and more record-
ings are planned after the summer. Finally, it is important to
1www.charleroi-danses.be
Proceedings of the 5th International Summer Workshop on Multimodal Interfaces - eNTERFACE'09
35

mc
05
74
55
cm
390 cm
1030 cm
buffer zone
Curtain
Proscenium
EX1
cardioid microphone
Omnidirectionnal
microphone
cardioid microphone
cardioid
microphone
cardioid
microphone
buffer zone
Fig. 2. Top view of the recording stage setup. The front camera is labeled”EX1”. The dancer can occupy the red area, delimited by buffer zones inpink. Microphones are placed around and above the stage to record.
note that no sensors were embedded on the dancers, so that
the analysis fully relies on raw video analysis.
B. Video annotation
To be able to perform an objective evaluation of the pro-
posed features, the video were manually annotated during the
workshop. The annotation criteria are the following:
- smoothness: the position evolves in a natural and fluid
way;
- rigidity: the body keeps a rigid posture while moving in
space;
- number of attacks: an attack is defined as a moment
when the dancer changes abruptly the speed of his/her
movements;
- twirl: the dancer performs a rotation while standing or
jumping;
- laying rotation: the dancer rotates while being on the
ground or with a very low center of gravity;
- number of jumps: small and big jumps are grouped into
this category;
- video cut: in some videos the dancer becomes invisible,
either by exiting on the side, or by reaching the dark
region at the very back of the stage. Note that the exit
on the side can be deliberate, or can be only apparent on
the top shot, which does not cover the whole stage, as
mentioned above;
- segmentation of the choreography: this attempts to grasp
changes in the ”intention” of the dancer;
- amount of gestures: in this context a gesture is considered
as a small motion that seems to engage in a communica-
tion;
- temporal rhythm: as opposed to the concept of ”attack”
defined above, this concerns the longer-term rhythm of
the performance (e.g., slow at the beginning, growing at
the middle, then slowing down again).
The first seven characteristics can be considered as objec-
tive, while the latter three are more subjective. Additionally,
comments can also be provided by the person doing the
annotation, to refine the description of some features or to
try to verbalize the scenario communicated by the dancer.
III. DANCE MOTION DESCRIPTION
A. Automatic top and front videos alignment
To correlate the features extracted from the front and top
cameras, the two corresponding videos have to be synchro-
nized, which was not done during the live recordings. Several
techniques could be used to align the videos in time, for
example using the sound stream to match the ”clap” signal. We
have chosen to focus on the image and to detect the moment
when the dancers enters the stage. For the top shots, this
amounts to finding when the first pixels are moving (after
noise filtering). However, the first pixels to move on the front
shot are coming from the clapping signal of the cameraman.
We thus had to detect when the dancer enters the stage after
the clap of the cameraman, which was done by a background
subtraction followed by a blob detection, as described below.
B. Background subtraction and silhouette detection
The analysis of the videos implies detection and tracking of
the dancer’s silhouette. This essentially involves background
subtraction, and is complicated by two factors. On the one
hand, the stage is somewhat shiny and reflects the dancers’
image, especially when they are wearing light/bright clothes.
On the other hand, some dancers have a dark skin color,
dark hair, or are wearing dark clothes. Therefore, a simple
background subtraction with a binary threshold will either cut
some parts of the dancer (threshold too high), or include its
reflection on the dance floor (threshold too low). We thus tried
to find a compromise between these two extremes, but it is
difficult to define automatically the best threshold, without
checking visually. Indeed, since the objective of our work it to
provide an automatic and autonomous way to extract motion
characteristics from the videos, the background subtraction has
to be fast and efficient for all the movies currently available,
as well as for new ones. Other approaches were tried (e.g
Proceedings of the 5th International Summer Workshop on Multimodal Interfaces - eNTERFACE'09
36

statistical and adaptive methods), but those either failed to
provide a uniform solution for all the movies of the corpus
or required much computational power, for a marginal gain in
accuracy. We finally used an analysis of each color channel
separately. Indeed, the dance floor contains about twice less
red (R) than green (G) or blue (B). Therefore, the background
detection was generally performed on the R channel, which
reduces the risk of including the reflection of the dancer. The
B and G channels can then be added with a higher threshold
to eventually fill in the dominantly blue or green clothes of
some dancers. The background itself was computed by finding
the pixel-per-pixel median of the image over time.
C. Temporal features
In the following sections, we make a distinction between the
General Space and the Personal Space or Kinesphere, concepts
first introduced by Laban [5]:
“Whenever the body moves or stands, it is surrounded by
space. Around the body is the sphere of movement, or Kine-
sphere, the circumference of which can be reached by normally
extended limbs without changing ones stance, that is, the place
of support. The imaginary inner wall of this sphere can be
touched by hands and feet, and all points of it can be reached.
(...) Thus, in actual fact, he never goes outside his personal
sphere of movement, but carries it around with him like a
shell. ”
1) General Space features: General Space features describe
how dancers use the stage during the performance. For this
analysis the dancer’s movement can be approximated by the
movement of a point in space (on stage in this case). In our
work we considered this point to be the center of gravity
(CoG) of the dancer, and we extracted the following low-level
characteristics from each frame recorded by the top camera:
- position (x,y) of the CoG, normalized with respect to the
dimension of the image;
- the velocity of the CoG along the x and y axes, calculated
using a small window of 3 points in each direction;
- the acceleration of the CoG along the x and y axes,
calculated the same way.
2) Personal Space features: Personal Space features de-
scribe the movement inside the kinesphere. They can be
related to the nature of the movements and, to some ex-
tent, to the quality of the performance. These features have
been implemented following the theory of Effort [6], theories
from cognitive science and psychology such as Boone and
Cunningham [7]. In our work we focused on the following
measurements (see [8] for further details):
- the Quantity of Motion (QoM) corresponds to the fraction
of the dancer’s body that moves in time, and is related
to the energy;
- the Contraction Index (CI) provides information on the
spatial occupation of the kinesphere by the body. More
specifically, it measures the contraction/expansion of the
dancer’s body with respect to its centre of gravity and
can be calculated as the ratio between the area of the
silhouette and the area of the rectangular box surrounding
it (the so-called ”bounding box”). For example, if a
dancer extends his/her limbs far from the body, the CI
will be low (close to 0). On the contrary, if a dancer
keeps his/her limbs close to the body, the CI will be high
(close to 1).
- the Bounding Box dimensions (width and height).
3) Rotation detection: We adapted an existing algorithm [9]
to detect when a dancer rotates with respect to the top camera.
The algorithm first extracts the optical flow of the dancer
by the Lukas-Kanade method [10]. This gives essentially a
vector field corresponding to the pixels that have moved from a
frame to another. A threshold is then applied to the magnitude
of these vectors to detect fast-moving points (”high-energy
points”, marked as white dots in the left panel of Fig. 3).
The curl of the resulting vector field then indicates rotations
of high-energy points in the plane parallel to the top camera.
Indeed, when the maxima of the curl are correlated in several
successive frames, we consider it to be a meaningful rotation
of the dancer. The maxima of the curl of the optical flow for
a few successive frames are shown on Fig. 3 (yellow points
in the middle panel). On Fig. 3 (right panel) the variance
of the relative distance between these high-energy points is
computed over time. A low variance thus indicates regularly
spaced points corresponding to a concerted rotation. In this
example it corresponds to a rotation of the legs of the dancer,
around the green point in the middle panel of Fig. 3. At the
resolution of the images, it is possible to distinguish a rotation,
but not to differentiate between the rotation of a part of the
body and a full body rotation. We implemented this algorithm
in the EyesWeb platform using its Software Development Kit.
Fig. 3. Rotation detection based on the high energy points from the curl ofthe optical flow. The white dots on the left image are the points that movedmost (the extremity of the dancer’s left leg). The yellow dots on the centralimage are the maxima of the curl over time and are regularly spaced. Theright image shows the standard deviation of the rotation movements over time.A small deviation indicates a concerted rotation.
D. Global features and Temporal Model
After extraction of the features for each frame of the video,
statistical tools are necessary to summarize this huge amount
Proceedings of the 5th International Summer Workshop on Multimodal Interfaces - eNTERFACE'09
37

of information. Indeed, two-minutes videos recorded at 25
frames per second represent about 3000 frames. For each
frame, all the above features are extracted, leading to several
thousands of data. It is therefore necessary to summarize them
to obtain a small set of relevant features that could be further
linked to a semantic description of the performance.
1) Mean and standard deviation: The simplest way to
summarize the temporal features is to calculate their basic
statistics such as mean and standard deviation. Whereas it can
be meaningful for some features, other methods need to be
explored. For instance the mean position of the dancer on the
stage could be similar (e.g., the center of the stage) for very
different kind of trajectories. Other important characteristics of
a choreography are its temporal evolution and its segmentation,
which we propose to summarize in two ways. The first one
focuses on the dancer’s space occupation. It is based on a three
dimensional mid-level description of the trajectory and on the
most occupied place on the stage. The second one focuses on
the segmentation of the choreography.
2) Space occupation: The stage occupation can be studied
using the Occupation Rate concept [11]. The image was
divided in a 10 by 10 grid (corresponding to 100 cells of
approximately 80x70 cm each) to compute a space-occupation
map representing the percentage of time that the dancer spends
in each cell. From this map we can extract different global
characteristics of the performance:
- the size of the occupied space (large vs. small global
trajectory),
- the compactness vs. sparsity of the trajectory,
- an indication about the preferred zone where dancers
developed their improvisation with respect to the position
of the camera (in terms of proscenium, centre or rear of
the stage).
These notions are illustrated on Fig. 4, showing our results
for four different types of dancers.
Other features of the dancer’s performance can be extracted
from the relationships between some of the above-mentioned
descriptors, for example:
- the distance between the CoG of the trajectory and the
most occupied cell.
- the distance between the most occupied cell and the
camera
The first distance gives an indication about the time distri-
bution in space, while the latter provides information about
the emphasis that the dancer gives to a special sector of the
stage.
3) Choreography segmentation: To characterize the tempo-
ral development of the choreography we use the segmentation
method of [12] that was initially applied to music. This method
is based on the computation of a feature similarity matrix. The
similarity matrix can be computed for any feature or any set
of features. It is obtained by computing the similarity between
all the time frames of the feature set. The similarity matrix M
is defined as :
Mi,j = S(di, dj) (1)
Large Dense Center Large Sparse Proscenium
Small Compact Proscenium Small Compact Centre
Fig. 4. Results of the General Space Occupation for four different dancers.The yellow line is the trajectory of the Center of Gravity of the dancer, seenfrom the top. The space is divided into cells, colored in red (the darker thered, the most occupied the cell). The front camera is located on the left (notshown).
where S is the similarity measure and di is the value of the
feature, that can be multidimensional, at frame i. An example
of such a matrix is given on the middle plot of Fig. 5. It is
computed on the speed of the dancer (top plot). High similarity
is represented by white color and low similarity by black color,
the axis are the frame numbers. Looking at this figure we
can see that the choreography can be divided into three main
segments in term of speed. This is showed by the three big
white squares along the diagonal. We can also notice that the
first segment (between frame 0 and 80) and the last one (frame
640 to the end) are similar by looking at the to left white
rectangle.
From this matrix we can extract the so-called novelty score.
This score is computed by correlating the matrix with the
appropriate kernel (see [12] for details). Extrema in this score
correspond to large changes in the choreography. In the bottom
plot of Fig. 5 we can see that the two biggest peaks corre-
sponds to the limits of the previously mentioned segments.
Then by using this measure we can automatically segment the
choreography and also find repeating segments. This method
allows to find a temporal structure of the choreography and
to describe the temporal evolution of the feature. There are at
least two open question on the use of this temporal structure
for dance similarity measure. The first one is the choice of
the feature to be used in the calculation of the similarity
matrix. Since any feature or set of feature can be used, we can
obtain many different time structure. The second question is:
“how to compare two choreographies using this representation
?”. We can choose to either extract a description from the
segmentation itself, such as the number of segments or the
mean segment length, or to find direct comparison measure
of the segmentation. Those question have not been addressed
yet.
Proceedings of the 5th International Summer Workshop on Multimodal Interfaces - eNTERFACE'09
38

! "!! #!! $!! %!! &!! '!! (!! )!! *!!!
!+!!#
!+!!%
!+!!'
!+!!)
!+!"
!+!"#
! "!! #!! $!! %!! &!! '!! (!! )!! *!!!
!+&
"
"+&
#,-"!
!$
"!! #!! $!! %!! &!! '!! (!! )!!
"!!
#!!
$!!
%!!
&!!
'!!
(!!
)!!
Fig. 5. Speed of the dancer (Top), Similarity matrix computed on the speed(middle) and novelty score (bottom)
IV. SYSTEM IMPLEMENTATION
A. Overview
The system for analysis and navigation is mainly composed
of two parts, EyesWeb and Mediacycle, that are both described
in the following sections. EyesWeb is in charge of the extrac-
tion of the temporal features whereas Mediacycle compute
the global features through a plugin and manage the database.
Communication between the Mediacycle plugin and EyesWeb
is done with the OSC protocol. The global architecture is
shown in Fig. 6.
B. EyesWeb
EyesWeb XMI (for eXtended Multimodal Interaction) is
a platform for real-time multimodal processing of multiple
data streams in the direction of multimodal and cross-modal
processing. EyesWeb XMI allows to: (i) connect a large num-
ber of heterogeneous external devices; (ii) exploit features of
multi-processors/multi-core architectures; (iii) use optimized
type system and software modules; and (iv) synchronized
multimodal data streams having different clocks. The platform,
distributed for free on the web www.eyesweb.org, consists of
two main components: (i) a kernel, and (ii) a graphical user
interface (GUI).
The kernel is a dynamically pluggable component which takes
care of most of the tasks performed by EyesWeb XMI. in
Plugin
Videos EyesWeb
OSC
Features
Mediacycle
Fig. 6. Architecture of the system
particular the kernel contains the EyesWeb Execution Engine
which manages the patch execution, handles data flow, syn-
chronization and notification of events to GUI.
The GUI manages interaction with the user and provides all the
features needed to design patch. It is noteworthy that the kernel
and the GUI are not tightly coupled: it means that several GUIs
may be developed for different applications.
EyesWeb XMI consists of a number of integrated hardware
and software modules, implemented in C++, which can be
easily extended and interconnected. It includes a development
environment and a set of libraries of reusable software compo-
nents that can be assembled by the user in a visual language to
build applications called patches. EyesWeb libraries include:
- Input-Output: support for frame grabbers (from webcams
to professional video-cameras), wireless on-body sensors
(e.g. accelerometers), audio, MIDI input, serial, TCP/IP,
UDP, OSC, visual and auditory displays;
- Libraries for data manipulation as Image and Video,
Audio, Math and filters, Midi, Machine Learning;
- Expressive Gesture Processing: a collection of software
modules devoted to an automated analysis of human
movement and extraction of expressive gesture cues; and
- Expressive Gesture and Social Processing: a collection of
software modules devoted to an automated extraction of
social cues like, for instance, synchronization index and
leadership index.
C. Mediacycle
Mediacycle is a Software developed by the TCTS laboratory
in the university of Mons in the context of the Numediart
project. The goal of this software is to allow easy management
of multimedia collections and content based browsing through
the database. It is composed of three entities : the kernel, the
GUI and plugins. The kernel manages the features and media
database, it allows to perform similarity queries via a nearest
neighbor search and k-means clustering. The kernel uses
the plugins to compute the media features. Until now three
plugins have been developed for sound, images and dance
video analysis. The interface showed in Fig. 7, developed
Proceedings of the 5th International Summer Workshop on Multimodal Interfaces - eNTERFACE'09
39

in Cocoa and OSG, allows to display the media according
to similarity information. The architecture is meant to allow
easy extensions, such as the addition of new plugins for media
analysis or the implementation of new user interfaces.
Fig. 7. Overview of the MediaCycle software, to navigate the video databasebased on the similarity between the videos. The sliders on the top right canbe used to defined the weights of the different features extracted from thevideos.
D. OSC Communication
The Open Sound Control [13] is used to exchange informa-
tion between EyesWeb and MediaCycle in two ways :
1) MediaCycle → EyesWeb : MediaCycle browses the
directories containing the videos, sends their names by
OSC to EyesWeb
2) EyesWeb → MediaCycle : after processing the videos,
EyesWeb returns the extracted features to MediaCycle.
V. CONCLUSION
In this project we have addressed several aspects of the real-
ization of a dance video browsing software. We proposed a set
of features allowing the description of the dance performances.
The proposed set allows the description of three different
aspects of the performance. First a compact description of
the stage occupation based on the position of the center of
gravity of the dancers, second a description of the gestures
of the dancers and of the usage of its personal space mainly
based on the contraction index and the quantity of motion
and finally a method based on feature similarity matrix to
extract the temporal structure of the choreography. Those
features will allow content based navigation in the database
of the DANCERS! project. The proposed description is low-
level and many research is still necessary. First of all the
description of the personal space can be extended. For instance
description of the smoothness or the impulsiveness of the
gesture can be added [14]. Second the use of the temporal
structure of the features still needs to be studied. Some open
questions regarding the comparison of temporal structures,
the choice of the features have been raised in the project
but need further research. Finally an objective evaluation of
the proposed features has to be performed in the context of
database exploration and query by similarity. A first step in
this direction has been done by selecting manual annotation
criteria and performing a first annotation.
VI. ACKNOWLEDGEMENTS
We would like to thank Bud Blumenthal, the members of
his collective (www.bud-hybrid.org) and the dancers for
making it possible to work with their high-quality videos.
REFERENCES
[1] “Dancers!” [Online]. Available: http://www.dancersproject.com[2] A. Camurri, M. Ricchetti, and R. Trocca, “Eyesweb - toward gesture
and affect recognition in dance/music interactive systems,” Multimedia
Computing and Systems, International Conference on, vol. 1, p. 9643,1999.
[3] S. Dupont, T. Dubuisson, J. Urbain, R. Sebbe, N. d’Alessandro, andC. Frisson, “Audiocycle: Browsing musical loop libraries,” Content-
Based Multimedia Indexing, International Workshop on, vol. 0, pp. 73–80, 2009.
[4] A. Camurri, B. Mazzarino, and G. Volpe, “Analysis of expressivegesture: The eyes web expressive gesture processing library,” Lecture
notes in computer science, 2004.[5] R. Laban, Modern Educational Dance. Macdonald & Evans Ltd., 1963.[6] R. Laban and F. C. Lawrence, Effort. USA: Macdonald & Evans, 1947.[7] R. T. Boone and J. G.Cunningham, “Children’s decoding of emotion
in expressive body movement: The development of cue attunement,”Developmental Psychology, vol. 34, pp. 1007–1016, 1998.
[8] A. Camurri, B. Mazzarino, M. Ricchetti, R. Timmers, and G. Volpe,“Multimodal analysis of expressive gesture in music and dance perfor-mances,” Lecture Notes in Computer Science, pp. 20–39, 2004.
[9] D. Lennon, N. Harte, and A. Kokaram, “Rotation detection using thecurl equation,” in ICIP07, 2007, pp. I: 473–476.
[10] Bruce D. Lucas and Takeo Kanade, “An Iterative Image RegistrationTechnique with an Application to Stereo Vision,” in Proceedings of the
Joint Conference on Aritificial Intelligence, Aug. 1981, pp. 674–679.[11] G. Volpe, “Computational models of expressive gesture in multimedia
systems,” Ph.D. dissertation, Faculty of engineering, Department ofcommunication, computer and system sciences, 2003.
[12] J. Foote, “Automatic audio segmentation using a measure of audio nov-elty,” in Proceedings of IEEE International Conference on Multimedia
and Expo, vol. 1, 2000, pp. 452–455.[13] M. Wright and A. Freed, “Open sound control: A new protocol for
communicating with sound synthesizers,” in International Computer
Music Conference, 1997.[14] B. Mazzarino and M. Mancini, “The need for impulsivity & smoothness
- improving hci by qualitatively measuring new high-level human motionfeatures,” in SIGMAP, 2009, pp. 62–67.
Proceedings of the 5th International Summer Workshop on Multimodal Interfaces - eNTERFACE'09
40

Bacteria Hunt:A multimodal, multiparadigm BCI game
C. Muhl (1), H. Gurkok (1), D. Plass-Oude Bos (1), M. E. Thurlings (2,3),
L. Scherffig (4), M. Duvinage (5), A. A. Elbakyan (6), S. Kang (7),
M. Poel (1), D. Heylen (1)
(1) University of Twente, The Netherlands, (2) TNO Human Factors, The Netherlands,(3) Utrecht University, The Netherlands, (4) Academy of Media Arts Cologne, Germany,(5) Faculte Polytechnique de Mons, Belgium, (6) Kazakh National Technical University,
Kazakhstan, (7) Gwangju Institute of Science and Technology, South Korea
Abstract—Brain-Computer Interfaces (BCIs) allow users to control applications by brain activity. Among their possible
applications for non-disabled people, games are promising candidates. BCIs can enrich game play by the mental and
affective state information they contain. During the eNTERFACE’09 workshop we developed the Bacteria Hunt game
which can be played by keyboard and BCI, using SSVEP and relative alpha power. We conducted experiments in order
to investigate what difference positive vs. negative neurofeedback would have on subjects’ relaxation states and how
well the different BCI paradigms can be used together. We observed no significant difference in mean alpha band power,
thus relaxation, and in user experience between the games applying positive and negative feedback. We also found that
alpha power before SSVEP stimulation was significantly higher than alpha power during SSVEP stimulation indicating
that there is some interference between the two BCI paradigms.
Index Terms—brain-computer interfaces, computer games, multimodal interaction.
F
1 INTRODUCTION
The study of Brain-Computer Interfaces (BCI)is a multidisciplinary field which combines en-gineering, cognitive neuroscience, psychology,machine learning, human-computer interactionand others. Applications using this direct com-munication channel from brain to machine arejust as diverse, from rehabilitation to affectivecomputing.
With methods like electroencephalography(EEG) it is possible to measure voltage dif-ferences over the scalp, which are the resultof brain activity in the neocortex. With thismethod neuroscience has identified several pat-terns of activity that are associated with dis-tinct cognitive functions. EEG opens thereforea window into the mind, which can be usedfor a direct communication between brain andcomputer [17]. It has a number of advantagesover other methods, as it is non-invasive, hasa high temporal resolution, does not require a
laboratory setting, is relatively cheap, and it iseven possible to create wireless EEG head-sets.Downsides of EEG are a low spatial resolutionand its sensitivity to noise and artifacts [28].The hardware also requires some time to set up,and afterwards everything needs to be cleaned.Dry caps which do not need conductive gel andare just as easy to set up as head phones are indevelopment, which will solve this problem.
Where originally BCI research has been fo-cused on paralyzed patients, new develop-ments as affordable and wireless dry cap tech-nology make BCI viable for healthy users. Be-sides the novelty factor, and the magic of beingable to use your brain directly for control, BCIalso provides private, hands-free interaction.It increases the information users can provideapplications, and applications in turn can reactmore appropriately, for example by also takingthe user’s mental state into account.
A large potential target group are gamers, asgames are an area where novelty is appreciated
Proceedings of the 5th International Summer Workshop on Multimodal Interfaces - eNTERFACE'09
41

and learning new skills is often part of the chal-lenge [19]. For research with patients, gamescan be a very interesting option as well. Virtualworlds can provide a safe environment to learnto produce specific brain activity: Accidentallysteering your wheel chair off the stairs is lesspainful in a virtual environment. Additionally,the game element can keep tedious training funand motivating.
Unfortunately, there are still issues that causeproblems when trying to use a BCI. There arelarge differences between the brain activity be-tween people, and even within one person thebrain activity changes quite quickly over time[5]. This makes it difficult to create a systemthat will understand what the user is trying todo, especially for a longer duration. Dependingon the BCI paradigm used a lot of training maybe required (ranging from minutes to months),for the user to be able to generate the correctsignal for the system. Alternatively, the systemmay be trained with user specific data to recog-nize the user’s brain activity associated with acertain (mental) action. However, it is possiblethat the person trying to use the system fallsinto the category of the so-called BCI illiteratelike 20% of the population [20]. This means thatthis particular user may not be able to generatethe signal in a way that is measurable to thesystem, and hence will not be able to control it.As a result from using EEG as a measurementmethod, the recorded brain activity has a lowsignal-to-noise ratio and is susceptible to arti-facts stemming from eye or muscle movements.These problems cause a high level of uncer-tainty when analyzing and interpreting brainsignals. There are also issues with speed andtiming, as relevant brain activity needs to beinduced, recorded, analyzed, and interpreted,before the corresponding action can be per-formed in the application.
Although paralyzed patients for which BCIis the only interaction modality left may bewilling to accept resulting problems with ro-bustness and speed, healthy subjects will beless forgiving. For them many other inputmodalities are available. Therefore, now othermore traditional usability and user experiencechallenges have to be solved as well, in orderto exploit the full potential of this innovative
technology and increase its acceptance amongthe general population.
Current BCI research applications are oftenvery limited, restricting themselves to the useof one modality (BCI) and one BCI paradigm,to control one type of interaction in a verysimplified game [22]. It is a big step from thissituation to interaction found in current com-mercial video games. Besides the large amountof actions that can be taken in game worldsnowadays, gamers will not behave accordingto the restrictions often applied in current BCIresearch in order to reduce artifacts in EEG.Gamers will move, multi-task, and use multi-ple interaction modalities. Because of the prob-lems with BCI at the moment, applying BCI incombination with traditional control modalitiesenables the use of its advantages, while itsdownsides can be avoided by other modes ofinput. The same is true for the use of multipleBCI paradigms.
The goal of this project has been the devel-opment of a game that combines traditionalgame control (e.g. mouse or keyboard) withBCI. This game is a platform for the studyof the use of BCI in a game environment,to learn more about the situations mentionedabove: using BCI in an efficient and naturalway considering usability and user experience,using it in combination with other modalities,using multiple BCI paradigms within one ap-plication, allowing for a realistic setting, andpossible multiplayer interaction. Besides thesespecific interests, this platform can also help inyielding new insights into more general issuesof applying BCI.
To explore some of these previous issues, anexperiment has been conducted using a mul-timodal, multiparadigm, single-player varietyof the game. This functions also an illustrationof how this platform can be used for suchresearch. This investigation is focused on onehand on the influence of using a certain BCIparadigm on the user experience, and on theother hand on possible interference effects ofusing two BCI paradigms simultaneously.
Applying neurophysiological input in gamesgives rise to specific considerations in the de-sign space. Hence, to start off, this new gamedesign space for BCI is clarified in Section 2.
Proceedings of the 5th International Summer Workshop on Multimodal Interfaces - eNTERFACE'09
42

The third section provides more informationon those BCI paradigms that were initiallythought suitable for game control, consider-ing the zero amount of training they requiredand the different types of input they could beapplied to. Pilot studies were run to explorethe most appropriate paradigm and parame-ters for the game. The full system consistingof the game and the pipeline for BCI controlhas been designed according to our specificrequirements, as described in Section 4. Thisis followed by Section 5, which focuses onthe conducted experiment and the obtainedresults. The paper concludes with a discussionand conclusions about the design space, thedeveloped research platform, and the results ofthe conducted experiment.
2 A BCI GAME DESIGN SPACE
During the last decade, computer games havereceived increased attention from the scientificcommunity. The academic field of game studies,while still in formation, already has given birthto a number of conferences and journals andthe design of computer games is taught atuniversities around the world. These develop-ments created techniques that may support thedesign of computer games and terminologiesthat may standardize the description and anal-ysis of games and game design efforts. Withinthe project, game studies terminology was usedto create a coherent description of what formsof BCI are possible in different forms of com-puter gaming. This “BCI game design space”first of all was needed to enable a precise defi-nition of the couplings of neurophysiologicalinput and game mechanics within the gameand its various levels. In addition, it suggests aterminology that may be used to standardizethe hitherto incoherent descriptions of thesefactors in BCI gaming projects.
2.1 Game studies terminology
Computer games, according to [1], consist of agame world, rules and gameplay. The former twocomprise the entities that are present withina game as well the rules that connect theseentities and define their behavior. Gameplay in-stead results from interaction. It emerges when
a player applies the rules to the world byplaying the game.
In order to be able to elicit gameplay, acoupling of the player to the game world mustbe established. This possibility of interactionyields a subjective experience of causal agencythat results from a player’s activity and itsdirectly perceivable results in the game world.This experience has been named effectance [14].While effectance is rooted in feedback on thelevel of in- and output, a player will alsoexperience a game on the level of its rules:She will, for instance, not only move entitiesin the game world but eventually also win orloose the game. The experience of successfullyinteracting with a game’s rules has been calledthe perception of control [14]. Both, effectanceand control, are thought to be crucial factorsfor the induction of computer game enjoyment[14].
Computer games that not only rely on tradi-tional forms of interaction, but that use phys-iological sensors pose new challenges for thedefinition of both: the direct application ofinputs to the game world – and therewiththe influence of these sensors on the level ofeffectance – as well as the role of the sensors forthe game rules, on the level of control. Noticethat neurophysiology is a part of physiologythat deals with the nervous system. Therefore,while a BCI component (like an EEG sensor)is better classified as a neurophysiological one,it is also not wrong to refer to it simply as aphysiological one.
2.2 Classification of BCI paradigms
A number of BCI paradigms exist and eachof those may be suitable to support differentforms of effectance. In the following, a two-dimensional classification of this BCI inputspace is suggested. While being formulatedfor BCI input, this classification generalizes toall forms of physiological input to computergames.
The dimensions of this classification are de-fined by (i) the dependence on external stimuliand (ii) the dependence on an intention tocreate a neural activity pattern as illustrated inFigure 1.
Proceedings of the 5th International Summer Workshop on Multimodal Interfaces - eNTERFACE'09
43

Fig. 1: A classification of BCI paradigms, spanning vol-untariness vs. stimulus dependency.
Axis (i) stretches from exogenous (or evoked)to endogenous (or induced) input. The for-mer covers all forms of BCI which necessarilypresuppose an external stimulus. SSVEPs asneural correlates of stimulus frequencies, forinstance, may be detected if and only if evokedby a stimulus. They hence are a clear exampleof exogenous input. Endogenous input insteaddoes not presuppose an external stimulus. Oneprominent example is the usage of alpha bandpower in neurofeedback applications. Whilealpha activity may be influenced by externalstimuli, it in principle can be measured whenno stimulus is present and hence classifies asendogenous. Another way of separating bothpoles of the axis is the possibility of buildinga self-paced (or asynchronous) BCI [25]: Onlyendogenous input can be used to build a sys-tem that is self-paced, in the sense that it candecide if a user initiates an action by brainactivity, whenever she does so. On the otherhand, all forms of exogenous BCI necessarilyare synchronous.
Axis (ii) stretches from active to passiveinput. Active input presupposes an intentionto control brain activity while passive inputdoes not. Imagined movements, for instance,can only be detected if subjects intend to per-form these, making the paradigm a prototypi-cal application of active BCI. Alpha and othermeasures of band power instead can also bemeasured if subjects exhibit no intention to
produce it.
A summary of BCI Games by Reuderink[22] distinguishes between the application ofband power feedback (F), P300, VEP and theneural correlates of imagined, planned and realmovements (M). According to the scheme pro-posed here, all cases of F listed in [22] clas-sify as passive-endogenous, all applications ofP300 and VEP classify as active-exogenous andall cases of M classify as active-endogenous.However, other applications are possible or –outside the context of gaming – even are inuse: P300 lie-detectors, for instance, classify aspassive-exogenous. Using the changing VEPstrength evoked by a stimulus that constantlyis present as a correlate of attention would alsoclassify as passive-exogenous.
2.3 Physiological effectance and control
If a BCI input directly affects the game world,the whole BCI feedback cycle is found on thelevel of effectance. In this case we speak ofdirect interaction. Direct interaction is usuallyassociated with active BCI in which the usermakes an effort to create a control signal inorder to succeed at an aim. To the contrary, ifnot the game world but its rules are affected,parts of the interaction take place on the levelof control. Here, BCI may be used to changeoverall parameters of the game, such as itsspeed or difficulty. Such forms of interactionare less directly perceived and hence can benamed indirect. Indirect interaction is usuallyrealized through passive BCI in which the userdoes not put much of his effort on using theBCI but rather on a more important controlmodality.
Moreover, if physiological activity does affectthe game world or the rules, but if influencingthese is not necessary in order to win the game,it constitutes a form of interaction that merelyis auxiliary. An example for auxiliary interac-tion would be a game in which physiologicalactivity changes the game’s appearance or isused to gain bonus points. This sort of interac-tion is used mostly for non-critical features, andthus is very suitable to employ BCI paradigmswhich are hard or time consuming to detect.
Proceedings of the 5th International Summer Workshop on Multimodal Interfaces - eNTERFACE'09
44

2.4 Multiplayer BCI
In multi-player games the number of pos-sibilities of affecting the game world or itsrules increase: First, the game may be com-petitive, cooperative or generative. While com-puter gaming started with competitive gamesmostly (such as Spacewar! and Pong) in theage of online multi-player games cooperativegaming has gained much importance. Genera-tive games are comparably rare, one prominentexample is Electroplankton by Toshio Iwai.
Second, the mapping from physiologicalmeasurements to the game may either takeplace separately for each player or in con-junction. In BrainBall for instance, alpha bandpower of two players is combined to alterthe position of one single ball, making it anexample for conjunct control of the game [10].Of course, it also would be possible to controlthe positions of two balls by one player each,creating a game using separate controls.
3 THE BCI PARADIGMS
Existing BCI paradigms in BCI applications canbe divided in several ways. The previous sec-tion distinguishes the classification into passivevs. active, and evoked vs. induced paradigms.To control an active BCI, one has to activelyperform mental tasks such as motor imagery.For example by imagining left or right handmovement a cursor can be controlled to moveup or down. This principle was applied inthe game brainpong, where a bat is controlledto move up or down to block an approach-ing ball, using motor imagery [16]. Typically,active BCIs demand the most intensive usertraining. Evoked BCIs require probe stimuli,stimuli presented by the system. By attendingto one of the stimuli, an interpretable brainsignal can be elicited. In an evoked BCI thisinterpretation is translated into a command ofthe system. The type of brain signal that iselicited is dependent on the characteristics ofthe stimuli provided. The Steady State VisuallyEvoked Potential (SSVEP) and the P300 areboth features in the EEG that can be elicitedby certain probe stimuli and are explained inmore detail later on. These features are inter-esting for BCI applications, because the signal-
to-noise ratio is relatively high and they donot require user training. Passive BCIs detectthe changes in cognitive and affective states,and do not require the user’s active attentionor the performance of cognitive mental tasks.In principle BCIs that belong to this categoryare not used for direct control (e.g. of cursormovement), but are more suitable for indirectcontrol. Alpha band power can be used in thispassive context, as it is related to a relaxedmental state [3]. However, the users can alsolearn to control their alpha activity, thus com-plicating the location of this approach along thepassive/active dimension.
For the current game, it was decided toforgo paradigms that need extensive user train-ing or machine learning, while at the sametime a variety of different types of paradigmswas wanted. This resulted in the selection ofSSVEP, P300, and neurofeedback based on thepower in the alpha band. This section de-scribes these BCI paradigms. Two pilot studieswere carried out to check the feasibility ofthe exogenous BCI paradigms in this gameimplementation, explore appropriate parame-ters and test classification algorithms for theBCI paradigms intended for the game control.The first study explored the neurophysiologicalresponses to stimuli flickering with a fixedfrequency (SSVEP). The second study investi-gated the responses to slower changing stimuli(P300). The final subsection provides informa-tion about alpha activity, based on literature.
3.1 SSVEP
SSVEPs can be induced if a person is attend-ing to a flickering visual stimulus, such as anLED. The frequency of the attended stimulus[21], as well as its harmonics [18], can thenbe found in the EEG. SSVEPs are interestingfor BCI-applications, because multiple stimulican be provided simultaneously in contrast tothe P300 for which stimuli have to be pre-sented sequentially (see subsection 3.2). If thestimuli are all flickering with a different fre-quency, then the attended frequency will dom-inate over the other presented frequencies inthe observers EEG. A commonly used methodto detect SSVEPs is to apply a Fast Fourier
Proceedings of the 5th International Summer Workshop on Multimodal Interfaces - eNTERFACE'09
45

Transformation on the EEG and compare theamplitudes in the frequency bins correspond-ing to the frequencies of the stimuli provided. Ifonly one stimulus is used, the amplitude of thecorresponding frequency bin is compared to aset threshold. Frequencies of stimuli between5-20 Hz elicit the highest SSVEPs [9]. SSVEPsare recorded over the visual cortex; O1, Oz andO2 according to the 10-20 system.
So SSVEPs are dependent on provided flick-ering stimuli, which need to flicker very con-stantly. The goal of this offline study was toinvestigate if it is possible to create such stimulithat are able to elicit the SSVEP response withGame MakerTM. Furthermore, the parametersfor this BCI paradigm were investigated interms of appropriate frequency and the size,shape and pattern used for the stimulus.
3.1.1 Method
Stimuli: For the creation of visual flicker-ing stimuli, several factors have to be taken inaccount. Firstly, is the bandwidth of frequenciesthat in principle can elicit robust SSVEPs, asmentioned above this is between 5 and 20 Hz.Secondly, in the current study it is desiredthat the stimuli are offered on the screen, sothe possible frequencies are dependent on thescreen refresh rate and characteristics. Previousexperience showed that the SSVEP inductioncan not done reliably when the stimulus ap-pearance is changed in every frame. At leasttwo frames after each other need to show thesame stimulus (color). Accordingly, the maxi-mum stimulus frequency that can be obtainedwith a screen refresh rate of 60 Hz is 15 Hz(see Table 1). Therefore, a simple flickeringstimulus is created by the alternation of twoframes presenting a black stimulus and twoframes presenting a white stimulus. Similarly,more complex stimuli are created, for exampleflickering checkerboards, which are often usedto elicit SSVEPs. To investigate the robustnessof the stimuli created with Game MakerTM,such flickering checkerboards were presentedwith the frequencies 7.5, 8.57, 10, 12 and 15Hz. To this end, one color of the stimulus waspresented for two images, while the other colorwas presented for 2-6 images (see Table 1),
resulting in four to eight images that wereconnected in one stimulation period.
Framesper period
Frames on (1)and off (0)
Frequency of stimulus(at 60 frames per second)
4 ...1100... 15 Hz5 ...11000... 12 Hz6 ...110000... 10 Hz7 ...1100000... 8.57 Hz8 ...11000000... 7.5 Hz
TABLE 1: Possible frequencies of a flickering stimuluson a LCD with a screen refresh rate of 60 Hz are shown.
As imaginable, flickering checkerboards arevisually not appealing and are annoying tolook at. Therefore besides the standard checker-board, also other shapes and appearances ofstimuli were investigated. The appearance andcharacteristics are shown in Table 2. To limitthe number of experimental sessions, the diskstimuli were only presented in one frequency,namely 12 Hz.
Experimental Setup: For this pilot studyonly two participants were involved. Theywere seated in front of a laptop, approximately60cm in front of the screen. Each stimulus waspresented for 60 seconds, and appeared in themiddle of the screen. After each stimulus pre-sentation, a pause screen appeared. For detailson the recording of EEG, see Subsection 5.1.The sample frequency for this EEG recordingwas 2048 Hz.
Task: Participants had to sit still in frontof the laptop and attend to the stimulus pre-sented. They were instructed to blink as fewas possible and to avoid any other movementcompletely during stimulus presentation. Par-ticipants controlled the start of each condition.
3.1.2 Results
Offline Analysis: The EEG recorded at O1,Oz and O2 was first cut out for each stimu-lus presentation from 40.000 until 100.000 datapoints after the start of the stimulus (60.000data points recorded with a sample frequencyof 2048 Hz corresponds to approximately 30seconds). These extracted signals were firstcommon-average referenced (CAR, see Subsec-tion 4.2.2), and then transformed to the fre-quency domain with a Fast Fourier Transfor-mation.
Proceedings of the 5th International Summer Workshop on Multimodal Interfaces - eNTERFACE'09
46

Checkerboard Small disk Large disk Large disk withhorizontal stripes
Large disk withvertical stripes
Large disk withhorizontal andvertical stripes
Stimulus freq. of0, 7.5, 8.57, 10, 12,
15Hz
12Hz 12Hz 12Hz 12Hz 12Hz
Inner diameter of4o
1o 4o 4o 4o 4o
TABLE 2: The table shows the presented stimuli and the presentation parameters frequency and size. The imageson top were altered with the bottom images to create the flickering stimuli. The third row shows the frequencieseach flickering stimulus was presented with. The last row relates the size of the stimuli to the smallest, namely thesmall disk (o).
Fig. 2: The frequency spectrum of a participants EEGrecorded at Oz during: no stimulus presentation (left)and checkerboard presentation of 12 Hz (right). Here themain response of the SSVEP and its first harmonic areclearly visible.
For the checkerboard stimuli, clear SSVEP re-sponses were found in the EEG of both partici-pants for 7.5, 8.57 and 10 Hz (see also Figure 2).In one participant also the stimuli flickering ata frequency of 12 and 15 Hz evoked SSVEPresponses, although from the latter one onlythe second harmonics was found. From thealternative stimuli, the large disk and the largedisk with horizontal and vertical stripes were
able to evoke SSVEP responses in both partic-ipants. For one participant the large disk withhorizontal stripes and for the other participantthe large disk with vertical stripes also inducedSSVEP responses. No significant differenceswere found for responses recorded at O1, Ozand O2.
Classification: In order to develop a BCIthat uses the SSVEP paradigm, an online classi-fication algorithm is needed. To simulate an on-line situation, the recording of 60 seconds wassliced into four-second windows, with steps ofone second between the start of each window.After CAR and FFT is applied, the SSVEPdetection consists of comparing the target fre-quency power to the maximum peak in thefrequency bin around the target, with a sizeof 3 Hz. If the ratio between these two energypeaks exceeds an experimentally determinedthreshold of 0.8, the window was said to con-tain SSVEP. This SSVEP detection method isdescribed in detail in Subsection 4.2.2, and isdepicted in Figure 7.
After applying the method described aboveon the OZ channel the results presented inTable 3 were obtained. The table shows the true
Proceedings of the 5th International Summer Workshop on Multimodal Interfaces - eNTERFACE'09
47

Stimulationfrequency
Checkerboard Small disk Large disk Large disk withhorizontal
stripes
Large diskwith vertical
stripes
Large disk withhorizontal andvertical stripes
Subject 017.5Hz 84% - - - - -
8.57Hz 93% - - - - -10Hz 98% - - - - -12Hz 90% 56% 92% 79% 76% 97%15Hz 90% - - - - -
Subject 027.5Hz 87% - - - - -
8.57Hz 68% - - - - -10Hz 82% - - - - -12Hz 52% 44% 84% 48% 63% 73%15Hz 80% - - - - -
TABLE 3: The true detection rates of SSVEPs for the different stimuli. The perfect rate is 100 % in the data usedhere.
detection rates (the recognition of SSVEP dur-ing actual SSVEP stimulation) for the differentobjects and stimulation frequencies. Please notethat the optimal performance is 100%, as thetrue detection rate was calculated only on datawith the stimulation present.
Assuming that the ability of the stimulus toelicit SSVEP is the main reason for the obtainedtrue detection rates, those stimuli that yieldedthe best results qualify for further exploration.The stimuli that resulted in a good classifica-tion result for both subjects were:
• Checkerboard pattern flickering at fre-quencies of 7.5, 10 and 15 Hz
• Large disk and the large disk with bothvertical and horizontal stripes, flickering ata frequency of 12 Hz
From these the checkerboard at 7.5 Hz andthe large disk at 12 Hz were selected for furtherevaluation. The large disk was selected be-cause it seemed less obtrusive than a flickeringcheckerboard, which is relevant for applicationin the game. The checkerboard flickering at7.5Hz was selected for further analysis becauseof the potential interferences of the frequenciesfrom 8 to 12 Hz with the other BCI paradigmused in the game. At all frequencies, except7.5 and 15 Hz, the SSVEP would be in thealpha frequency range used in the game for theneurofeedback BCI paradigm. Between the truedetection rates for 7.5 Hz and 15 Hz stimulationonly a minor difference was observed.
For these selected stimuli, the optimal win-
dow length was explored. For this, for eachwindow duration, besides the true detectionrates, also the false detection rates (detectionof the stimulus when no stimulus was pre-sented) and the classification accuracies (totalnumber of correct classifications divided bythe total number of classifications) were calcu-lated. The results are presented in Figure 3. Asexpected, the classification accuracy improveswith longer window durations, as it containsmore data. The figure shows that windows ofat least 3 seconds are required to obtain properclassification results. For shorter windows thetrue detection rate is still high, but the false de-tection rates increase dramatically, decreasingthe classification accuracies to below 70%.
3.1.3 Conclusion
The offline analysis of EEG recorded whileattending to flickering stimuli created withGame MakerTM, shows that SSVEPs can beelicited with these stimuli. The offline analy-sis and the offline classification both showedwell detectable SSVEPs for both subjects forthe stimuli: checkerboards flickering at 7.5, 10,and 15 Hz, and the plain large disk and largedisk with both horizontal and vertical stripesflickering at 12 Hz. Of these stimuli, the plainlarge disk is thought to be the least obtrusive,and therefore is implemented in the game. Thedeveloped classification algorithm seems to berobust enough for implementation in an onlineclassification structure. Analysis showed that
Proceedings of the 5th International Summer Workshop on Multimodal Interfaces - eNTERFACE'09
48

Fig. 3: The classification accuracy, true and false detection rates for the checkerboard and large disk stimuli flickeringat 7.5 and 12 Hz, respectively.
windows of at least 3 seconds are required. Sothe game requires the user to focus for at least3 seconds at flickering stimuli if presented.
3.2 P300
A P300 is an event-related potential (ERP). TheP300 (also referred to as the P3) is a positivepeak in the EEG that occurs approximately300ms after the presentation of a target stimulusthat stands out from other standard stimuli ordistractors. One reason why the stimulus standsout can be due to differences in appearance,e.g. when one black sheep is presented afterten white ones. The experimental paradigmis called an oddball paradigm [12]. The P300amplitude decreases if the target and stimuliare more similar [6]. Another reason is becausea person is attending to a certain stimulus. TheP300 is thought to be related to a higher levelattentional process or orienting response. Ingeneral P300s are detected at Fz, Cz and Pz asdefined by the 10-20 system. To elicit a P300,probe stimuli can be presented in the visual,auditory and tactile modality [2].
The first BCI application that used the P300paradigm is the P300-matrix speller [8]. In this
application letter and numbers are placed ina 6 by 6 matrix. The rows and columns flashup sequentially. Every time the symbol of one’schoice flashes up and the user is attendingto it, a P300 is (potentially) elicited. In thisway, users (e.g. patients with neuromusculardiseases) can spell words and communicatewith their environment, although very slowly(approximately 1-2 words per minute). As theP300 can be easily modulated with attention, itis an interesting component to use in games.
To test the feasibility of using P300 withina game, an offline experiment has been con-ducted that tested visual stimuli created inGame MakerTM. The stimuli were shaped likebacteria, testing the potential applicability ofsuch a stimulus in a game. Additionally, thepossibilities to let a stimulus stand out (insteadof flashing up) were investigated by changingstimulus’ color, size and angle.
3.2.1 Methods
Experimental Setup: The general setup wassimilar to the previous pilot experiment (seeSubsection 3.1). Comparable to the spelling ma-trix, stimuli are grouped, similar to rows andcolumns. However, visually, the positioning of
Proceedings of the 5th International Summer Workshop on Multimodal Interfaces - eNTERFACE'09
49

the stimuli is unstructured, to simulate a gamesituation. At the start of each trial in this offlineexperiment, a target stimulus was indicated.Each group was highlighted for 150 ms fol-lowed by an inter-stimulus interval of 150ms.The presentation of the groups was done inrandom order and repeated nine times.
Stimuli: Three different possibilities to leta stimulus stand out were tested. See Table 4for the visuals.
Task: A target was indicated at the startof each trial, by highlighting it for 2 seconds.The participants were instructed to count thenumber of times this particular target stimuluswas changed, to keep their attention focused onthe target. Furthermore they were instructed tosit still, move and blink as few as possible.
Analysis: The P300 potentials were ana-lyzed by averaging the signal of a certain elec-trode (the most important ones were Cz andPz) that was recorded from 200 ms before until800 ms after the stimulus-onset. The signalswere baseline-corrected by the subtraction ofthe average of the 200 ms before stimulus-onset. After that the signals that were related tothe target-stimuli were averaged (two signalsper trial), and the signals that were relatedto the non-target-stimuli were averaged (foursignals per trial).
3.2.2 Results
The results of the analysis for EEG responsesand also the average over the nine trials areshown in the graph below (see Figure 4). Thegraph shows the P300 elicited by the stimulithat changed color (orange stimuli were neu-tral and black stimuli were highlighted), asa highlight-effect. The other conditions used,’change size’ and ’rotation’, also elicited P300s.However they were lower in amplitude.
3.2.3 Conclusion
Based on this offline analyses, it is expectedthat the P300 paradigm may be usefull in thegame, and good results can be expected if atleast two trials are used. This would require3.6 seconds of data before a classification canbe done. The highlight effect that gave the bestresults was changing the color of the stimu-lus from orange to black. Unfortunately there
Fig. 4: EEG response of one participant to target stimuli(red) and non-target stimuli (blue) recorded at Cz. Thestimulus was present during the grey area. The two thicklines represent the averages over nine trials: the EEGresponse to targets is clearly different from the responseto non-targets. The averaged target line shows a peak at285 ms after stimulus onset, indicating the presence of aP300.
was not enough time during the eNTERFACEworkshop to also complete the online P300-pipeline. Therefore this is recommended forfuture work.
3.3 Alpha
The term ‘alpha rhythm’ is restricted to brainactivity in the alpha range occurring at the backof the head, which is related to a relaxed wake-fulness and best recorded with eyes closed,according to the definition of the InternationalFederation of Societies for Electroencephalog-raphy and Clinical Neurophysiology [4]. In ourreport, alpha band power is used in the moregeneral sense of energy in the frequency bandof the alpha rhythm: 8 to 12 Hz, which can beobserved over all cortical regions.
Alpha activity used to be considered to beinversely related to neuronal activity. This canbe interpreted either as cortical inhibition, orcortical idling. This view is shifting, as alphais now seen to have functional correlates tomovement and memory [26].
As a correlate to relaxed wakefulness, alphaactivity could be an interesting measure forpassive BCIs. Alpha activity is also consideredan important tool in neurofeedback. Besides
Proceedings of the 5th International Summer Workshop on Multimodal Interfaces - eNTERFACE'09
50

Standard stimulus Size change Color change Rotation
TABLE 4: The stimuli for the P300 paradigm. The standard stimulus, and the changes in size, color, and rotationused to elicit the P300.
helping patients, it might also be used to im-prove our mental capabilities, as research hasindicated relations between alpha activity andintelligence [7], and the ability to cope withstress [27]. This is another reason why alphaneurofeedback and neurofeedback in generalcould be interesting BCI paradigms to use ingames.
3.4 Conclusions
For this project, three potential paradigms werelooked into, which were selected based on theircharacteristics and the minimal amount of usertraining and machine learning they required.These paradigms were looked up in literature,and for the two evoked paradigms small pilotstudies have been conducted.
SSVEPs can be elicited with a stimulus look-ing like a plain large disk, which is consid-ered to be less obtrusive then for examplethe checkerboard stimulus often used for thisparadigm. Although this disk was only testedat 12 Hz, the frequencies of 7.5 and 15 Hzobtained good results for the checkerboardstimuli. To minimize interference with the al-pha frequency range used in the neurofeedbackparadigm, the flickering of the disk with 7.5 Hzseemed a good stimulus choice for the SSVEPparadigm. To obtain an acceptable accuracy ofdetection, windows of at least three seconds arerecommended.
Alpha could be an interesting correlate forthe mental state of relaxed wakefulness, to beused as a passive BCI modality, or in a moreactive way with potential mental benefits as aresult of the training.
For P300, the highlight effect of changing thecolor of the stimulus from orange to black gavethe best results. At least two trials would berecommended for classification, which wouldrequire 3.6 seconds of data. An online pipelinefor this paradigm has not been implementedduring this workshop, but is recommended asfuture work.
4 THE GAME AND BCI DESIGN
The application was built in guidance of prin-ciples and requirements defined in §4.1.1 and§4.2.1. For the ease of maintainability and opti-mal performance the system was decomposedinto subsystems, namely the game and the dataprocessing. The game subsystem is responsiblefor running the game and sending the markersdepending on the input received from EEGanalysis results and other traditional modali-ties. On the other hand, the data processingsubsystem returns to the game the results itcomputed according to the markers and theEEG signals received. The overview of the sys-tem architecture can be seen in Figure 5.
4.1 The Game
This subsection describes how the game world,game levels and game rules are implementedin accordance to the requirements defined.
4.1.1 Requirements
1. Scientific: The game is intended to be abasis for investigation of (1.1) the possibilityof combining BCI with conventional controlsand (1.2) the possibility of using multiple
Proceedings of the 5th International Summer Workshop on Multimodal Interfaces - eNTERFACE'09
51

Fig. 5: Overview of the system architecture.
BCI paradigms. In addition, (1.3) it shouldbe possible to easily extend the game withmultiplayer functionality.
2. Usability: The game should be easy tounderstand and uncomplicated in use, andthus (2.1) be playable without training. Inorder to elicit subjective perception of control,(2.2) the game should provide persistent visualinformation indicating progress in terms of itsrules. Finally, if players are meant to perceivecausal agency based on neurophysiologicalrecordings, (2.3) the game must provide directfeedback on the neurophysiological inputsused.
The game should equally fulfill both scien-tific and usability requirements.
4.1.2 Game world
The game was built using the Game MakerTM
development platform. The game world con-sists of a small number of entities: playeravatar(s) (the amoeba), targets (bacteria), a nu-meric representation of the points obtained sofar, a graph depicting the recent history ofalpha band power and SSVEP classification andSSVEP stimulus (which always is associatedwith one of the target items) when it is trig-gered. The numeric representation of pointsfunctions as a high-level indicator of progress
Fig. 6: The game world. Nine targets (orange “bacteria”)and one player (blue “amoeba”) are present. The player’sscore is shown at the top left. The histogram above theline depicts her recent alpha band power, below the linethe SSVEP classification results are marked.
in terms of the game rules (req. 2.2) while thegraph depicting alpha band power and SSVEPclassification results functions as a low-levelindicator of the neurophysiological coupling ofthe player and the game (req. 2.3).
4.1.3 Game levels
The game comprises various levels, each usingthe same game world but slightly differing interms of rules. The levels Keyboard only (K), Key-board+Alpha (KA) and Keyboard+Alpha+SSVEP
Proceedings of the 5th International Summer Workshop on Multimodal Interfaces - eNTERFACE'09
52

(KAS) have been implemented and tested. Fur-thermore, a Keyboard+Alpha+P300 (KAP) levelhas been realized, but not tested. The decisionto use alpha band power, SSVEP and P300was guided by the requirement that it shouldbe possible to play the game without training(req. 2.1). Imagined movements, for instance,presuppose a training phase and thus wouldviolate this requirement. The decision to com-bine alpha band power with SSVEPs or P300respectively was taken because it should bepossible to analyze the combination (and possi-ble interactions) of multiple BCI paradigms inone game (req. 1.2).
4.1.4 Game rules
Some general rules are the same for all levels,others vary with the specific level which willbe explained in this subsection.
General rules: The game world always containsnine target items, which never may overlap. Ifthe distance d between the center of a playeravatar and a that of a target is below the radiusof dmin, the target can be “eaten”. Eaten targetsdisappear and are replaced by a new target,randomly placed on a free spot on screen. Thus,visual disappearance of target items, in addi-tion to the numeric display of score, indicatesthe progress in terms of game rules (req. 2.2).Target successfully eaten results in points forthe player. Eating failures result in negativepoints. The rules for eating are defined differ-ently in each level. The ultimate goal of thegame is to obtain as much points as possible.
Movement is performed using the keys, re-sulting in direct feedback through changedavatar position. Avatar position also jitters bysome random noise and the effect of pressinga key depends on some external values, i.e.game controllability varies. Since the influenceof key presses on the position is variable, thechange of position per key press also providesdirect feedback on how the player currentlyaffects game controllability. If controllability isaffected by neurophysiological measures (asin KA, KAS, and KAP), this implies that thefeedback provided is direct feedback on neuro-physiological activity (req. 2.3). In addition, by
affecting controllability with neurophysiologi-cal measures, keyboard input (a conventionalcontrol) is combined with neurophysiologicalinput (req. 1.1).
Let x and y denote a player avatar’s position,s its speed , c ∈ [0, 1] the external factordetermining controllability and random(x) afunction that returns a real value from [1, x].Pressing the “right” key results in the followingcalculation:
xnew = xold + (s + (random(s)−s
2))× c
ynew = yold + (random(s)−s
2)× c
In addition, even if no key is pressed, the avatarposition changes from frame f to frame f + 1as follows:
xf+1 = xf + (random(s)−s
2)× c
yf+1 = yf + (random(s)−s
2)× c
Level K rules: This level uses no EEG data atall. Hence the factor c is set to a random valuein [0.4, 0.6]. In this way controllability will varybut stay within a range from which large de-viations of controllability are possible for theother levels. Eating is triggered by pressing akey. It is a success if the nearest target meets thedistance condition described above (d ≤ dmin).Points p are calculated by:
p = 100× (1−d
dmin
)
If the eating attempt is triggered while thedistance is above the threshold, p is assignedto −50.
Level KA rules: Eating is performed and evalu-ated as in level K. However, c is linked to theplayer’s relative alpha band power (α ∈ [0, 1]).In a pilot study, relative alpha power wasfound to be in [0.15, 0.23] for most subjects.Thus, an ad hoc scaling [0.15, 0.23] → [0, 1] wasintroduced, creating a scaled αs. For futureversions of the game, subject dependent scaling
Proceedings of the 5th International Summer Workshop on Multimodal Interfaces - eNTERFACE'09
53

methods or adaptive scaling are to be consid-ered.
αs =(α− 0.15)
0.08
c = αs
Therefore, controllability is to be affected bythe player’s mental state, while the influenceon controllability is visualized by the jitterexhibited by the avatar (req. 2.2) and bothkeyboard and BCI input are combined (req.1.1).
Level KAS rules: The factor c is linked to alphaband power as in level KA. The process ofeating is changed as follows: approaching atarget closer than the eating distance dmin trig-gers a SSVEP stimulus appearing next to thetarget. The association of stimulus and targetis visualized by a line connecting both. Thestimulus consists of a circle with a diameterof 64 pixels and flickers with a frequency of7.5 Hz, changing from black to white. It isdisplayed for 6 seconds on the screen. Betweenthe seconds 3 − 6, SSVEP classification resultsare recorded (this specific interval depends onthe window size of 4 seconds used in theanalysis pipeline). If the mean output of theclassifier is above 0.5, the target gets eaten.Points are calculated using the mean alphapower measured between the seconds 3− 6.
p = 100×mean(αs)
Thus, for players, it is of benefit to control bothalpha band power and SSVEP simultaneously(req. 1.3). If SSVEP classification fails, -50points are given, the target “escapes” and ismoved away from its current position.
Level KAP rules: Instead of triggering a SSVEPstimulus, approaching a target now triggers re-peated highlighting of groups of targets. To doso, the nine targets on screen are organized insix groups. Each group consists of three targetsand each target is part of two groups. Groupsare highlighted by replacing the image of itsmember objects by a bigger version of the sameimage for 150ms. Between each flash, an inter-stimulus interval of 150ms is used. After eachgroup has flashed once, a P300 response for
the selected target is measured and, if classifiedcorrectly, the target is eaten successfully. Again,alpha activity during that process is used toscale points received for eating. If no target ora non-target is classified using P300, the targetescapes.
4.1.5 Effectance and control
On the level of effectance, players interact withthe game world by controlling their avatar’sposition using the keys. In addition, theycontrol eating and target “escape” behaviorby focusing SSVEP or P300 stimuli (in anexogenous-active condition).
On the level of control, players change thegame rules based on their alpha band power:a high alpha is to enhance the controllability ofthe game using keys (in an endogenous-passivecondition).
4.1.6 Single- and multi-player
The initial prototype of the game is single-player only. But in principle it can easily bescaled to larger number of players (req. 1.3). Ina competitive mode, players compete for points.In a cooperative mode, players try to clear a levelfrom all targets as soon as possible. Both modesemploy separate BCI control. Other ways ofcooperative game play are planned, such as amode in which player avatars are merged forconjunct control.
4.2 Data acquisition and processing
This subsection defines the requirements andsteps for data acquisition and processing.
4.2.1 Requirements
1. Hardware considerations: The EEG signalsshould to be acquired by the BioSemiActiveTwo system. For this purpose, the gameshould run on a computer with a parallel portto be able to send the signals and markers.The game and analysis pipeline should be ableto communicate with each other via TCP. Thecomputer running the game should possessa monitor with a resolution of 1024x768 anda minimum refresh rate of 60 Hz to be ableto correctly display the SSVEP frequency. Theanalysis pipeline should be able to receive
Proceedings of the 5th International Summer Workshop on Multimodal Interfaces - eNTERFACE'09
54

the signals from the ActiveTwo system viaUSB. BioSemi active electrodes should be usedin measurements as advised by the BioSemicompany.
2. Performance: The time lag between theanalysis pipeline, game engine, and ActiveTwosystem should be kept at minimum for the sakeof analysis accuracy and game amusement.Both the gaming and pipeline computersshould be fast enough to run continuously,without any halts or delays.
3. Physical environment: All the equipmentshould be operated, preferably, in a room freeof electrical noise. Users should be able toaccess the gaming computer but better be keptaway from the analysis computer to avoid dis-traction.
4.2.2 Design
For signal processing and machine learningpurposes, Golem and Psychic libraries by BorisReuderink were employed in the pipeline [23],[24]. The EEG signals are continuously readas overlapping 4-second-sliding-windows, theinterval between window onsets being 1 sec-ond. The steps for processing a window isdisplayed in Figure 7. Brain potentials have tobe measured with respect to a reference. Thisreference can be based on some electrodes (e.g.placed on ear lobes or mastoids) but also beelectrode-free by re-referencing, i.e. the refer-ence potential is created from a computationbased on a set of electrodes. Common averagereferencing (CAR) is such a spatial filter usedfor re-referencing. It consists of computing themean of the whole set of electrodes per sampleand then subtracting it from each EEG channel.It was shown to be superior to the ear-referenceand other re-referencing methods [15]. There-fore a data window is first re-referenced byCAR.
Regarding the relative alpha power compu-tation, the data in channel Fz was extractedfrom the window. Applying fast Fourier trans-form (FFT) on the data the power within thealpha band [8 Hz, 12 Hz] was calculated anddivided by the total power within the frequen-cies [4 Hz, 40 Hz].
For the detection of SSVEP presence, thedata in channel O2 was extracted from thewindow. Channel O2 was used since no sig-nificant difference was found in the responserecorded at O1, Oz and O2 (see §3.1) andduring experiments recording sites O1 and Ozwere problematic. Then the power in the fre-quency domain was computed by FFT. Thepower spectrum is expected to contain a peakat the flickering frequency of the circle objecton the screen. The flickering frequency (fflicker)of 7.5 Hz was used as it was one of the bestperforming frequencies (see §3.1) and does notinterfere with the alpha band. But detectionof this peak is a bit tricky task. Sometimesthe amplitude of the flickering frequency maynot be present in the spectrum but, instead, inthe frequencies that are close to it. It can stillbe approximated by increasing the resolutionof FFT, or calculated from known values forneighboring frequencies, but result can be in-accurate. Another point is that the flickeringfrequency may be unstable on custom comput-ers and LC displays. Therefore, SSVEP in somecases might not be detected correctly. Taking allthese challenges into consideration, followingprocedure was defined for detecting the peaksin the spectrum:
1) Look for the frequency with the maximalamplitude (fmax) between the range of[fflicker - 1.5 Hz, fflicker + 1.5 Hz].
2) If fflicker is not represented in the spec-trum obtained by FFT, look for the nearestrepresented frequency (fnearest) and setamp(fflicker) = amp(fnearest).
3) If fmax is next to fflicker in the spectrum,set amp(fflicker) = amp(fmax).
4) If amp(fflicker)/amp(fmax) > thresholdthen conclude that a peak is present. Dur-ing experiments the optimum thresholdwas found to be 0.8.
where amp(F ) is the amplitude of the fre-quency F obtained by FFT.
The relative alpha power value and presenceof SSVEP were continuously sent to the gamePC via TCP.
Proceedings of the 5th International Summer Workshop on Multimodal Interfaces - eNTERFACE'09
55

Fig. 7: The signal processing pipeline of Bacteria Hunt.
5 EXPERIMENTS
The overall goal of the project was to developa game that would be suitable for the useas experimental platform to answer researchquestions related to BCI. From the underlyingresearch questions on applicability andcombinability of BCI control in a game specifichypotheses were posed:
Hypothesis I: The use of a positiveneurofeedback paradigm, based on thereward of high alpha values, as a controlmodality results in an increase in alpha powerand in a state of higher relaxation and lesstension.
Hypothesis II: The combination of positive alphaneurofeedback and SSVEPs causes no detri-mental effects. As alpha feedback should resultin a state of relaxed attentiveness, we assumedthat the attention on the flickering SSVEP stim-uli should not necessitate a change of overallrelaxation state.
5.1 Methodology
In order to test the hypotheses stated above,an experimental protocol was devised. Partic-ipants were asked to play two versions of agame. Each version was constructed from threelevels, namely K, KA, and KAS (see §4.1.3). Inkeyboard only level K the participant had time
to get acquainted with the game. Furthermore,it can be used as an alpha baseline conditionlater on. The difference between both gameswas in the way the alpha neurofeedback wasapplied. In the positive feedback version (pF)an increase of alpha yielded an increase in con-trollability of the game. In the negative feed-back version (nF) we inverted the relationshipbetween alpha level and controllability.
Five participants (2 female, mean age: 26)took part in the experiment. The participantswere seated in front of the notebook runningthe game (1.8 GHz Pentium M). They readand signed an informed consent and filledin a questionnaire assessing prior drug con-sumption and amount of sleep. After that theelectrode cap was placed and the electrodesconnected. 32 Ag/AgCl Active electrodes wereplaced according to the 10-20 system [13]. TheEEG signals were recorded with 512 Hz sam-ple rate via a BioSemi ActiveTwo EEG systemand processed and saved on a separated datarecording and processing notebook (2.53 GHzQuadcore) running BioSemi ActiView software.
The blocks contained the 3 games in thefollowing order: K, KA, and KAS. Each gamelasted for 4 minutes. That made a total durationof 12 minutes per feedback session, excludingsmall breaks between the games. After eachfeedback session the participants were givena questionnaire to evaluate their experience
Proceedings of the 5th International Summer Workshop on Multimodal Interfaces - eNTERFACE'09
56

during the game session.
5.2 Analysis
To test the first hypothesis the alpha powerwas analyzed as an objective indicator andthe user experience as a subjective indicator.Specifically a higher level of alpha power forthe positive feedback condition compared tothe negative feedback condition was predicted,as alpha power increases were rewarded in theformer and punished in the latter.
The Game Experience Questionnaire GEQ[11] was used to measure user experience ac-cording to the concepts of competence, im-mersion, flow, tension, challenge, negative, andpositive affect in separate scales. We added acontrol scale that assessed the felt controllabil-ity of the player in each feedback condition.It was predicted that positive neurofeedbackwould lead to a decrease of tension and subse-quently an increase of positive affect.
To test the second hypothesis we analyzedonly the objective indicator of relaxation, i.e.alpha power. We compared the power in thealpha band between the KA and the KAS con-dition of the positive feedback session. Weexpected an equal level of alpha power, thusno interference from the SSVEP stimulationin KAS. Additionally, to check for tempo-rally limited interactions between the two BCIparadigms, we compared the level of alphapower before and during SSVEP stimulationand expected also there an equal amount ofalpha.
5.3 Results
The analyses on the data collected have twosorts of implications. They provide conclusionsabout applicability and combinability of BCIswhile answering the hypotheses posed previ-ously.
5.3.1 Applicability of BCI
As result of the first hypothesis, concerningthe applicability of a BCI paradigm in a game,an effect of the applied neurofeedback on al-pha power and user experience was predicted.However, neither objective nor subjective indi-cators for an effect of the feedback were found
(see table 5). No significant difference in meanalpha band power could be shown betweenthe games applying positive and negative feed-back. Accordingly, there was no significant dif-ference in the user experience between the pos-itive and negative alpha-feedback conditions.
The failure to find an effect of the feedbackon alpha power and user experience mighthave different causes. In general, it might bedue to the small sample size of 5 participants.Furthermore, for both feedback conditions theparticipants were instructed to relax, whichmight have lead them to relax in both condi-tions despite the difference in feedback. Possi-ble differences might be covert then by a flooreffect. Complying with this possible caveat,table 5 shows very low scores for the tensionscale. This lack of excitement was also reportedby the participants in informal interviews afterthe experiment. To exclude this possibility thestress level during gaming would have to beincreased, possible by a higher difficulty and amore dynamic and faster nature of the game.
Interestingly, we found a marked differenceof the pre-SSVEP alpha power between nF andpF conditions, with higher alpha power forthe pF condition (p ≤ 0.006). In the absenceof an overall difference of alpha power thiseffect seems contradictory. However, it couldindicate the effectiveness of alpha feedback forconditions with higher difficulty, as the KASconditions were potentially more stressful dueto the more difficult SSVEP-based scoring. Thiseffect might be too small though to be reflectedin overall alpha power and the conscious expe-rience of the players assessed via the GEQ.
5.3.2 Combinability of BCI
As a result of the second hypothesis, concern-ing the combinability of two BCI paradigmsin an application, we expected no interactionof both paradigms, that is no effect of SSVEPon alpha power. Accordingly, we found nosignificant difference in mean relative alphapower between KA and KAS.
Unexpectedly, an influence of the SSVEPstimulation on alpha power was found for thealpha feedback condition pF. Specifically, alphapower before SSVEP stimulation was signifi-
Proceedings of the 5th International Summer Workshop on Multimodal Interfaces - eNTERFACE'09
57

negative F positive F ttest(nF,pF)mean std mean std H P
Questionnaire datacompetence 2,03 0,81 2,13 0,81 0 0,850immersion 1,67 1,10 1,33 0,75 0 0,230flow 2,17 0,72 1,93 0,85 0 0,535tension 0,97 0,69 0,87 0,62 0 0,591challenge 1,47 0,55 1,40 0,25 0 0,688negative 1,20 0,74 1,37 0,59 0 0,561positive 1,90 0,74 1,73 0,51 0 0,430control 2,35 1,05 2,15 0,68 0 0,767
EEG dataα KA 0,18 0,02 0,18 0,01 0 0,723α KAS 0,18 0,02 0,18 0,02 0 0,593preSSVEP α 0,18 0,01 0,19 0,01 1 0,006SSVEP α 0,18 0,02 0,18 0,01 0 0,938preSSVEP α - 0,00 0,01 0,01 0,00 1 0,006SSVEP α
Behavioral dataScore K 4348,34 1118,47 4343,24 1295,33 0 0,991Score KA 4040,04 1038,16 2909,89 1491,15 0 0,176Score KAS 496,70 798,15 205,53 740,25 0 0,621
TABLE 5: The questionnaire results for positive (pF) and negative (nF) feedback sessions. The items were assessedon a scale from 0 to 4, with 0 indicating the least, and 4 the most agreement to the concepts assessed. The EEGwas analyzed in terms of mean relative alpha band power on the Fz electrode during the game 2(α KA) and game3 α KAS), the mean alpha power in the 4 seconds before SSVEP stimulation (preSSVEP α) and during SSVEPstimulation (SSVEP α). The minimum observed and the maximum were 0.15 and 0.23, respectively. The behaviorwas analyzed as points scored in the game.
cantly higher than alpha power during SSVEPstimulation (p ≤ 0.0001).
The contrast of the pre-SSVEP alpha be-tween the different feedback sessions discussedbefore, showed that this effect resulted fromthe higher alpha power during the pre-SSVEPepochs of the pF condition. This suggeststhat positive feedback might work in moredifficult conditions, leading to higher alpha.Consequently, the SSVEP stimulation interfereswith this state of higher alpha and potentiallygreater relaxation. This interference could bedue to several mechanisms. For example, itcould be caused by purely dynamic character-istics of the stimuli. As we compute the relativealpha power, an increase of power in SSVEP-related frequency bands would automaticallylead to a decrease of the alpha power. On theother hand, it could be a result of the task thatis executed during the stimulus presence.
5.4 Discussion
It was hypothesized that the positive feedbackwould lead to higher levels of alpha power,lower tension, and more positive affect. No
general alpha increase for positive feedbackcould be shown. Similarly, no effect of thealpha feedback was found in terms of userexperience.
Furthermore, we hypothesized that SSVEPstimulation would have no side effect on thealpha power. This was true for the compari-son of alpha level between the levels KA andKAS. However, a difference between the alphapower before SSVEP stimulation to the alphapower during stimulation was observed forthe positive feedback condition. This differencewas due to a higher alpha power before stim-ulation. In the negative feedback condition nosuch difference was found. Hence, we arguethat at least for the KAS condition the positivealpha feedback led to higher alpha, which wasthen attenuated by the SSVEP stimulation.
To explore the applicability and value ofneurofeedback in computer games the manip-ulation of the difficulty level of the applicationmight be interesting. Further studies of theinfluence of SSVEP on alpha power could focuson the origin of the decrease of alpha power.
Proceedings of the 5th International Summer Workshop on Multimodal Interfaces - eNTERFACE'09
58

6 DISCUSSION
We have developed a computer game that usestwo BCI paradigms in addition to a conven-tional control via a keyboard. In pilot studiesdifferent BCI paradigms were explored to de-termine the viability within the game environ-ment and to develop algorithms.
Despite the efforts to develop a BCI pipelinethat could be used without prior training of thesubject or the classifier, the results of our anal-yses and interviews with participants suggestthat a subject-dependent classifier would over-come the shortcomings of the general classifiersapplied. For example, the power in the SSVEPfrequency band varied among subjects. Thus asubject-dependent classifier, applying a thresh-old based on a prior training session, couldincrease the control of the subjects over theavatar. Similarly every individual has his/herown range for the alpha power measured. Inpilot experiments, a generic range determinedby observing the lowest and highest alphapower values of the majority of the subjectswas used. A more elegant approach could beadapting this range per subject. This can beaccomplished via a training session run beforethe game or by dynamically adjusting the val-ues during the game play.
The SSVEP detection method was developedso as to use signals from only one EEG chan-nel (O2) but as shown in §3.1 SSVEP can bedetected in all three occipital channels. Thus,information from these channels can be com-bined to make detection more robust. Also,instead of relying on peak detection solelyin the stimulation frequency, the peaks at thesecond or later harmonics can be employed. Inaddition, the parameters like the bin size andthe reference amplitude can also be tailored foroptimized performance.
The original intention of the project was tobuild a multiplayer game. For this purpose,during the workshop, multiplayer versions ofthe game and the analysis pipeline were im-plemented. However, during the workshop, itwas discovered that the proprietary softwaredelivered with the EEG hardware could notsend information from multiple systems as nec-essary for online multiplayer BCI. When this
restriction is revoked, the multiplayer versioncan also be tested.
The results reported in this paper are basedon 5 participants and especially the non-findings concerning the first hypothesis mightbe due to the low number of samples. Despitethe missing overall effect of neurofeedback, adifference between alpha power in the positiveand negative feedback condition was foundin the pre-SSVEP epochs of the KAS games.This effect might indicate that the failure tofind significant differences in alpha power anduser experience might be due to a floor effectcaused by the high degree of relaxation inboth feedback conditions. To avoid this effectin future studies, it is suggested to increase thedifficulty level and thereby decrease the overallstate of relaxation during the game.
Furthermore, negative feedback was em-ployed to examine the effect that feedback hason the player. While this method is in principlevalid to determine the existence of an effect, itdoes not enable the differentiation of the effectsof positive and negative feedback. To delin-eate these, an additional no-feedback conditioncould be employed.
A possible problem of the interpretationof the results could also result from thegame instructions given before the experiment.The participants were informed that relax-ation would increase controllability. This mighthave caused confusion or other negative effectswhen the opposite effect was realized in thenegative feedback condition. Differences be-tween feedback conditions could thus be dueto this clashing expectations rather than due tothe effect of feedback directly.
Finally, the application of small user expe-rience questionnaires after each game wouldenable the delineation of the effect of the dif-ferent BCI controls on user experience. How-ever, the difficulty lies with the avoidance ofconfounds due to entirely different game me-chanics, which could also be implemented byother techniques.
7 CONCLUSION
With the new branch of the BCI research whichnow considers non-disabled people also as the
Proceedings of the 5th International Summer Workshop on Multimodal Interfaces - eNTERFACE'09
59

potential users, BCIs started to be incorpo-rated into everyday applications, like computergames. BCI is an invaluable communicationchannel that can directly convey informationno other modality can: the state and intentionof the user. This information can be used tocontrol, modify or adapt a game tailored tothe player, and could thereby provide addedvalue. However, the extent that BCIs can tol-erate the dynamic environment of games orthe existence of other modalities is still underinvestigation.
In this paper we proposed a design spacefor physiological game design and describeda multimodal, multiparadigm BCI game calledBacteria Hunt which is controlled by keyboard,SSVEP, and relative alpha power. We inves-tigated how well different paradigms can beused together and what effect positive vs. neg-ative neurofeedback creates. The experimentsconducted on the initial prototype game devel-oped revealed that in the tested setup no sig-nificant difference in mean alpha band powerand in user experience between the gamesapplying positive and negative feedback werefound. Furthermore alpha power before SSVEPstimulation was significantly higher than alphapower during SSVEP stimulation. Thereforeone needs to consider this when combiningthese two paradigms for control.
Bacteria Hunt is suitable for use as an ex-perimental platform for BCI research. We havethe intention to continue experimenting on thisplatform, especially within multimodality andinteraction domains.
ACKNOWLEDGMENTS
The authors would like to thank Boris Reud-erink for his help with the BCI pipeline.
This research has been supported by theGATE project, funded by the Netherlands Or-ganization for Scientific Research (NWO) andthe Netherlands ICT Research and InnovationAuthority (ICT Regie), by the BrainGain SmartMix Programme of the Netherlands Ministryof Economic Affairs and the Netherlands Min-istry of Education, Culture and Science, andby the European Community’s Seventh Frame-work Programme (FP7/2007-2013) under grantagreement no. 231287 (SSPNet).
REFERENCES
[1] E. Aarseth. Playing research: Methodological approachesto game analysis. In Proceedings of DAC, Melbourne,Australia, 2003.
[2] A. Brouwer and J. Van Erp. A tactile P300 BCI andthe optimal number of tactors: Effects of target proba-bility and discriminability. In Proceedings of the 4th In-ternational Brain-Computer Interface Workshop and TrainingCourse 2008, pages 280–285, Graz, Austria, 2008.
[3] J. Cantero, M. Atienza, C. Gomez, and R. Salas. Spectralstructure and brain mapping of human alpha activities indifferent arousal states. Neuropsychobiology, 39(2):110–116,1999.
[4] G. Chatrian, L. Bergamini, M. Dondey, D. Klass,M. Lennox-Buchthal, and I. Petersen. A glossary of termsmost commonly used by clinical electroencephalogra-phers. Electroencephalography and Clinical Neurophysiology,37:538–548, 1974.
[5] B. A. Cohen and A. Sances, Jr. Stationarity of the humanelectroencephalogram. Medical and Biological Engineeringand Computing, 15(5):513–518, 1977.
[6] M. Comercho and J. Polich. P3a and p3b from typicalauditory and visual stimuli. Clinical Neurophysiology,110(1):24–30, January 1999.
[7] M. Doppelmayr, W. Klimesch, W. Stadler, D. Pollhuber,and C. Heine. EEG alpha power and intelligence. Intelli-gence, 30(3):289–302, 2002.
[8] L. A. Farwell and E. Donchin. Talking off the top ofyour head: toward a mental prosthesis utilizing event-related brain potentials. Electroencephalography and ClinicalNeurophysiology, 70(6):510–523, December 1988.
[9] C. Herrmann. Human EEG responses to 1–100 Hz flicker:resonance phenomena in visual cortex and their potentialcorrelation to cognitive phenomena. Experimental BrainResearch, 137(3):346–353, 2001.
[10] I. S. Hjelm and C. Browall. Brainball - using brain activityfor cool competition. In Proceedings of the first nordicconference on HCI, Stockholm, Sweden, October 2000.
[11] W. IJsselsteijn, Y. de Kort, K. Poels, A. Jurgelionis, andF. Bellotti. Characterising and measuring user experiencesin digital games. In International Conference on Advancesin Computer Entertainment Technology, Salzburg, Austria,2007.
[12] B. Jansen, A. Allam, P. Kota, K. Lachance, A. Osho, andK. Sundaresan. An exploratory study of factors affectingsingle trial P300 detection. IEEE Transactions on BiomedicalEngineering, 51:975–978, 2004.
[13] H. H. Jasper. The ten-twenty electrode system of theinternational federation. Electroencephalography and clinicalneurophysiology, 10:371–375, 1958.
[14] C. Klimmt, T. Hartmann, and A. Frey. Effectance andcontrol as determinants of video game enjoyment. Cy-berPsychology & Behavior, 10(6):845–848, 2007.
[15] D. J. McFarland, L. M. McCane, S. V. David, and J. R.Wolpaw. Spatial filter selection for EEG-based communi-cation. Electroencephalography and Clinical Neurophysiology,103(3):386–394, 1997.
[16] K. Muller and B. Blankertz. Toward noninvasive brain-computer interfaces. IEEE Signal Processing Magazine,23(5):125–128, 2006.
[17] K. Muller, M. Krauledat, G. Dornhege, G. Curio, andB. Blankertz. Machine learning techniques for brain-computer interfaces. Biomedical Engineering, 49(1):11–22,2004.
[18] G. Muller-Putz, R. Scherer, C. Brauneis, andG. Pfurtscheller. Steady-state visual evoked potential(SSVEP)-based communication: impact of harmonic
Proceedings of the 5th International Summer Workshop on Multimodal Interfaces - eNTERFACE'09
60

frequency components. Journal of neural engineering,2(4):123–130, 2005.
[19] A. Nijholt, B. Reuderink, and D. Plass-Oude Bos. Turningshortcomings into challenges: Brain-computer interfacesfor games. In Intelligent Technologies for Interactive Enter-tainment, pages 153–168, May 2009.
[20] A. Nijholt, D. Tan, G. Pfurtscheller, C. Brunner, J. D. R.Millan, B. Allison, B. Graimann, F. Popescu, B. Blankertz,and K.-R. Muller. Brain-computer interfacing for intelli-gent systems. IEEE Intelligent Systems, pages 76–83, 2008.
[21] D. Regan. Human brain electrophysiology: Evoked potentialsand evoked magnetic fields in science and medicine. Appleton& Lange, 1989.
[22] B. Reuderink. Games and brain-computer interfaces: Thestate of the art. Technical report, HMI, University ofTwente, 2008.
[23] B. Reuderink. golemml: Python machinelearning library for EEG processing, October 2009.http://code.google.com/p/golemml.
[24] B. Reuderink. psychicml: Python signal processinglibrary for EEG processing, October 2009.http://code.google.com/p/psychicml.
[25] R. Scherer, A. Schloegl, F. Lee, H. Bischof, J. Jansa, andG. Pfurtscheller. The self-paced graz brain-computerinterface: Methods and applications. Computational Intel-ligence and Neuroscience, 2007.
[26] M. Schurmann and E. Basar. Functional aspects of alphaoscillations in the EEG. International Journal of Psychophys-iology, 39(2-3):151–158, 2001.
[27] P. D. Tyson. Task-related stress and EEG alpha biofeed-back. Applied Psychophysiology and Biofeedback, 12(2):105–119, 1987.
[28] B. L. A. van de Laar, D. Oude Bos, B. Reuderink, andD. K. J. Heylen. Actual and imagined movement in BCIgaming. In Proceedings of the International Conference onArtificial Intellingence and Simulation of Behaviour (AISB2009), Aberdeen, Scotland, 2009.
Christian Muhl earned his Master’s de-gree in the Cognitive Sciences in 2007 atthe University of Osnabruck, Germany. Hiseducation was focused on neuroscientificmethods, specifically electroencephalogra-phy. Since then he is working as a researchassistant in the Human Media InteractionGroup at the University of Twente, TheNetherlands. In his PhD thesis he searches
for neurophysiological and physiological correlates of affectivestates in the context of brain-computer interaction.
Hayrettin Gurkok received his B.S. andM.S. degrees in Computer Engineeringfrom Bilkent University, Turkey. His M.S.thesis was on linguistics and text retrieval.He is currently a member of the HumanMedia Interaction group at the University ofTwente. He is conducting research on mul-timodality and realistic settings for BCIs.His research interests also include human-
computer interaction, social computing and information re-trieval.
Danny Plass-Oude Bos got her first ex-perience with online BCI during an intern-ship at the University of Nijmegen in 2007.There she implemented physiological arti-fact detection in an online EEG-based BCIsystem. In 2008 she obtained her masterdegree in Human Computer Interaction,looking into the user experience of usingBCI for games. At the moment she is work-
ing as a PhD student at the University of Twente, still attemptingto merge BCI with HCI by researching how BCI can be made amore intuitive means of interaction.
Marieke E. Thurlings started as a PhDcandidate at TNO (The Netherlands Or-ganization for Applied Scientific Research)and at the Utrecht University, in 2008.She currently investigates navigating inVirtual Environments using brain signalsas an input, involving the fields of Brain-Computer Interfacing, Games and VirtualWorlds. Marieke is especially interested in
using event-related potentials, such as P300s and SSEPs, andexploring covert attention to probe stimuli to evoke these, e.g. bypresenting them in unconventional modalities. Marieke obtainedher Master of Science degree in Design for Interaction from theDelft University of Technology.
Lasse Scherffig is a PhD student at theLab3, Laboratory for Experimental Com-puter Science of the Academy of MediaArts Cologne (Germany). Since July 2006he also is a member of the artistic/scientificstaff of the academy. He graduated in cog-nitive science at the university of Osnabrck(Germany) and received a M.Sc. in digitalmedia from the University of Bremen (Ger-
many). His dissertation project focuses on the relation of actionand perception in Human-Computer Interaction.
Proceedings of the 5th International Summer Workshop on Multimodal Interfaces - eNTERFACE'09
61

Matthieu Duvinage graduated as an elec-trical engineer in signal processing andtelecommunications from the Facult Poly-technique de Mons (Belgium) and SUP-ELEC (France) in june 2009. He also got amaster of fundamental and applied physicsfrom the University of Orsay (France) injune 2009. He has just started a PhD atthe Signal Processing and Circuit Theory
Lab at the University of Mons (Belgium) on the development ofa neuroprothesis to control an artificial leg via BCI.
Alexandra A. Elbakyan graduated fromKazNTU with a Bachelor degree in IT inJune 2009. She conducted a study regard-ing person identification by EEG in her finalyear thesis. She is going to continue herresearch in brain-computer interfaces andbrain implants.
SungWook Kang received the B.S. de-gree in electronic communication engineer-ing from the Kwangwoon University, Seoul,Korea, in 2009. He is currently workingtowards the M.S. and Ph.D degree atBiocomputing Lab., Dept. Information andCommunication, Gwangju Institute Of Sci-ence and Technology. His research inter-ests include bio-signal processing espe-
cially EEG and MEG, feature extraction, information theory andbrain-computer interface.
Mannes Poel is assistant professor in theHuman Media Interaction group at the Uni-versity of Twente. His main research in-volves applied machine learning for visionbased detection and interpretation of hu-man behavior and the analysis and classi-fication EEG based brain signals.
Dirk Heylen is associate professor in theHuman Media Interaction group at theUniversity of Twente where his researchinvolves the automatic interpretation ofverbal and nonverbal communication andthe of modeling conversational and cogni-tive functions of embodied conversationalagents. His work on the analysis and syn-thesis of nonverbal communication in (mul-
tiparty) conversations has been concerned with gaze, and headmovements in particular. His research interests extend to thestudy of physiological signals that can be used to interpret themental state of user.
Proceedings of the 5th International Summer Workshop on Multimodal Interfaces - eNTERFACE'09
62

������������������������������ ��������������������
��������������� �� ������ ������������ �������� ����� ��
� � �� �� � ������ � ������ � ��� � ���� � ���� ��� � �� �����
�������� ���������������� �� ����� ������������ ��������
����� ������������� ������� ��� �� ����������������
���� �� � ����� � �� � �� � ����� ��� ������� � ������� � � �����
� ��� �� ��� �������� ������������ ������ ������� ���
����� ������������� �������� �� ������� �������������
� � � ��� � ������ � �� � ��� � ���� � ������� � � ����� � �� � ���
��� ����� ����!����� ������� ��������� �� ��������
��������� ����� ������ ������� ������ ������ �������������
���������� �� ���������� �����
��� �������� �� ������ ��������� �����������������
���������������� ������ ������
�� �����������
���� � � ��������� ������ ���� �� � �� ����������
��� ���� ��� ! �������������� ���� ��������� ���
" ���� ������ � �� ���� �� ��� ������� � �� �� ���� �� ���
������ � #�����#���� ��� ���� � �� ���� � ��� � ���
��� ������������$% ���������� ����������� &� ����
���� ����������� ������������� ������ &����� ����#���'
������� ������� ���� �� ��� ������ ���#�������������'
������ �������!���� ���� ��� � �����#������ ��������'
������ �'� ������ ���������������(�� ����� �� ������'
���������� ���� ����� �������������� �������#������ �
������ � �������� ��
)�� � �� �� � &� �� ���������������� ��� ��� ������'
�* ������� ���������� ������ ������������������ � ��� �'
����� �������������� ������ &�������#��& � &� ����� �����
+��� &���� ���& ���� �����������������������"��#,����
������ -�����������-"������������� ���������� &�����'
������� ������������� ��� ��� ���������� ���� ��
!��� �� �� ������ � ������� ���� ������ �������'
�����# ���� ��� �� ����������� ������ .�� &���� � � ����
��� ������ �� ��������� �����&���� ��������� ����'
���������#����������������� � ������#��������� ������'
������� � /�" ��� � �� ��� #��� � ��� � ��� � � ���������
0!���������� � �� ���� �� �12�3442��������"���������� �������
���� 5���� �������+5�,���������� 6 �� .��� ���"%��#���� ����
�� 7!5���8 ��+� ��3196:2,�
;���<� ������������� � ����� �#���%��� ����#���7���������) �'
���"� ���� ����� �� � ������#� +�<<,� 5����� .������ +8����"� �����=
�""���,�
!����*��!�������$�������>�������7�������������� ������ ��'
�����/���� ����������������������� ���� ��� � �� �� �+�� �,�
���� ����� �� $ ����� ����� +�����*����������=��������# ���� $��'
�����������=#������������������������=���# ���,�
����7��� �������/��#� �?����� ������ � ������������������
����� ���� ��� � �� �� �+�� �,����� �������$ �����������
��#� � �������� ��� � ������ ���� ���� �� �� ��� � ��� �� �
����� '��� #��� ����������� ��������� ������������ ����'
����� ��������� ���� ����#���� � �������� &��������
�������"��������������#� ���������������� �� �����
������� � �� ���� ����� �������������� ����#���� ������
� �� ������������� ����@� ���� ��� ������� ����� �����
+ �#�� ��& � ��� � ��� ���, ��� �� �� � ����� � ������
�������� ��������� � ����#� �������������������.��
&���� ��������������� ��'��� �����"��#�������� � �����'
������� � ������� ����������� # ������#(�� ��� �������'
�� ������������������� � �������������� ������ ���� ��
���� ������� � ������������� ��� ��������� � ��� � ��
������ �� ��� ��� � �������������������������� ��������
�� ������ ������� ��� #�������
�� ���"� �� �� � ����#��������� ������ ����� ��'
������������� �� ��@�����#���������* ������������� �'
�� � ����� ����������� �� ��� % �������# ��� ���������
���� ������ �� �� ����� �� ����� �� � ��� ���� � � �� ���
���������������� �� �� ��� ���� �� ���� ����'
��� ������������� � ��� ������ � ����#�� � �����#� �� ��
!�� �� ��� ������� ��5�.75���8 ������ �� ��� ���'
�����#� � ��������� �������� ���� ������� ���#�� �����
7!5���8 ��(
• )���������� ����� �����& ������������ ��A
��� ���������"��#�������� �� �� ���� � ��'
� � � ����"��#� ����� ������ #��� ��� &�������
� ������ ��� ��������������� �B
• ��������� �� ������������ �� &�������#�� � �
������� ���� ��� &�������#������� #������B
• �������� ��������� �� ��������������� ���
������@��������� ������
.���� � ������ ������ ����� ����� ����������#���
������ ��������'�� � ������� ��� �� ����������� � ���� '
� �� ��������� ��������� ���#�� ������(�� 7����������
7��������� �������� !���� ���������
���� ��� �������� �����#��� ������ ���� ���#������#��
������� ����� � ����� � ��� ������ ����� ����� ����
5&���� ���������#�� ������������������#�� ����� ��������
���� ������������ �� &���� �� ������� � �� ���� ������
������#������������������� ��'��� �� ������ �����'
��� �����#� &�� ���� ����'������� � �����# ���� �C�
���"��#��������#���� ������ � �� �� ������� �� ���
���#� ������� ���������� ��� �����#�� � &�� ���� # �'
��� ����� ������� � �� ������� ����������#��� ��� ���'
����������#�� � ��� ����� ���� ����5&���� ��������#��
��� ����� ���� ��������#�������������������� �� �
�� ���� ����������� ����� ���� ���� ���� ����5&���� �
7� ����������#������������� �
���������'�� � ������� ��;���<� ������!����*��!�������$�������>�����7�����������������7��� �����/��#� �?���
Proceedings of the 5th International Summer Workshop on Multimodal Interfaces - eNTERFACE'09
63

������#���� � � ���� � �� � �� ������� � �� �� �������
�� ���������� ����� ������"��#����& ���� ���� �����'
� ����#�� � ������ ���� �� � �� �+�,�������#�� �����'
� ���������� � ���������� ����������� �����7� ����� �'
���� �� ��� � �� ����� ���� �� +��"�� D4 ������ ��
����� �,��� � �� �������E���� � ��� � ����� ������'
�#�� ������ �������������� �� � ����#�� ���� ������
�� ���� ��������
������ � ��� ������ ���� � ��� ����������� � �����
���� ���#������#���� � ������� �� �������������������#'
�� � ����������������� � � ����� �� &������# ��B ����� ��
�� ������� �� � ���� ������ �������� ��������#���
������#��� &�� ���� ���� ����� ��'��� �����#����� ����
����'������� � ����� &�� ���� # ���� �7����� � ���'
���� �� ���� ���� �� ��� � !��� � � 7�� ��� 5������� ���
�� � �� � �� �� ���� ���" �� �� ��� �� &��������
F! ���������� � ���G�� �������%�#������$ �������
����� �A��� �� �3446���������������!��� � �7�� ���
5��������������� ��������� ����������� � �������� �
�� � ���� ���������� �����#���* ����������� �����
�� ������ ������ ��� ��� ������ � ��������� �����#�>
&������� ���� ���� ����� ������>����>���� � ����
���� � �� �������������� �������.������� �����>������'
���� ��� ������ ����� ��� ���� ����������8 ���
��� 7!5%��;5�.�7!5H��<.��7��>5!� �/� �5���$
������� ���� � ��� ����� 7!5� ����" ����������
��������� ��'��' ������ ���"+�� �� � �� ���� ������
����� � ���� � ������ ����������� ������ ���� ��,���
���� &�'���� � &� �� �� '� ����� ����� ������������������
������# ������ ����������������������� ������ �� '
�������� �� �������������� ��� ����� � ��� �� �����
� �� ���������#������� ������� ���������5� �H �I!�
�%���������
� ��� 7!5� �� ����������� � ���� �� ��� �����
��� ������ ��� �������������������� ��+ �#�� ��������'
� ���� ��#�1,���� ������ � ��� ����������� ���/����
7!5� �� ����������� � ���� ����� �� ����� ��������
������� ��� �� �������� � �� � ��'��� ���� ����#�� ��
��#����������& ������������ ����� � ���� ������� ����
�� ������������� ���������# �� ��������������� �����
��� �������������� ������� ����� ���� ��
�� ����� ���� ���� �� �!���� ������� ��������
������������������ ������ ���"� � ��� ����� 7!5
���8 ���
�� ��������������
���������"�� ������ ����� ����� ����������#�����'
��������#�� ������ ������� 7!5���8 ������ ���"�
�� ������� � ��� �������� �� ����� ���� � + �#�� ��"��
�J9����29,�������� ���� �� ����%������� � ��� �'
���"��� %��� ���� ��������& ������������ ���� ����
���8 ������!�������� ��* ����������� �" �� ����
�� %���������� 7!5� �� �� ������#��� �������'
�����+� ��#�3,� ������ ��� �������� ������ �����"��#�
# ���� � ��#�������� ���� &�����������!����������"���
"����#( 7!5�������������� ����#�����#���������� ����� ����
���� �� ���� � �� ���� ���� ���� �� ��( �� ��5� �� ������ � ��
���� � @� �������� �� �� ����#� �� �� ��������� ���� ����� ����#�
���� �������������� ��* ������ ����� �� ����� #����'
��� �#�� �
�� ����� ���� ������ �� �� �����������������*��#
�� �������� ���"��� �������������� �������� ������'
�����#�� ��� � ��� � ��������� ��� ����� ���������
���� �� �� �� ���������������#�� ����� ����� 7!5
� �� ��������������������� ����� ����#�����������������'
�� ������"��
�� ������ ��� �� ���� �� � ��# �� � ����# �%'��� �
�� � ����������+� ,���5� �H ������� ������� ��'
��#��� �����������
"����$( 7!5���8 ������ ���"�������������#��������
.�#�� E� ������� ���� ��������#������� ���� ��/��
� � �� ���� ��� ������ ������� ����� ���� �� ��� ���
����#�� � ��������� ���� ��� �����������#���& ����'
������"��#�� ������������ ���� ��� ��#�� � �� ���� �
+������������ �������� �������,�� ������ ������� �
������� ��������������������� ���� ����� ������� ���
Proceedings of the 5th International Summer Workshop on Multimodal Interfaces - eNTERFACE'09
64

"����%(7���� ����� ����������#�����������������'����"��# ������'
� ���
�� � �������������#���� ���
���� /�H7��)�$)/5>5/.57���5
���� � ����� � ����� � �� ��� � � � ���� ��@�������� ���
��#�� � ���������������"������*��#!�������5� �H � �'
������ ����
�� ������������������������
�� ��� � ��� � � ��� ��� �� � ����� �� ������'��� �
����� ���� �� ���� �� ��"�� D4 � ��� �� �� ��� �����
�����#�KK7%������A���������� ��A� � ������ �� ���'
��#���� �� ��������� ���� ��� !�������� ���"���'
���� � � �����������"��& ����� �����#����� �� � �����
���� � �� � � �� � �� ���� � �� 7%��� �� ��& � �� ����
@���� ����������������������������� ������ ����'
���� ������� ���*�������� ���� ���������� � ������� �����'
8 ���������� ��������������������#�� ������������������'
����� ����"������� ��� ����� �� ���& ���������� ����
� ���������� @����� �� �� �� #�������� ���#������#
������#� ����� ���5� �H ��%�������� ������� ����
���� ���� !����������#������#���#��# ������#����
�����&� � ������� � ���
!����������� � ����"��& � ���� �������� ��� ����'
� �� ������� ����������������"��� ����� ��������� �
������������������� ����#�� ��� � ��� � ��������
� ���# � +7�� L � H��� � L ��%���,� ��� ����# ��
��� ��� �� 5� �H �+��L 5�H���# �� �����,� ���'
� ����#�� ��� ������� ����#�� �����������������
+��L! /��L� H��� �L��%���,����� � ����#���
# � �����#" ��� �� � ���+< �L� H��� �L��%���,�
�� 7������< ������%�������� ��������� �� �����'
��� ��������� 7%�� �� �� ������ �<��� � H��� �
���� # � ��� � � '������� � � ���# � ������ M���� M" �
���M������ ���� ���� 5�H���# �� ������������� ���
�� ������ ���� ������ ���� ��� �������D:&D:��& �
#������� ��������� ��� ��� ���������#������ 5� �H ��
.�������! /��������� ���� ������ ���� ������� �����'
���� ������� � ������ �� ��������# � ��� �� �� ����������
����# ����� ����*������� �������������� ���������������'
� �������
� ����������������!�������������������
�� ��� ���#��������� ������& ���� �������� �� ���
� ��'��� ����5� �H ������������+�� �����,����� ����� �
��������� �������#���� ����� ���� ��5�������� ����
��� ����������� � �� ������ � .�#�� :� 7�����'��� �
����"��#�������� �� ������ �� 3����������� �� ���� �
���� ������ ���� ��� ���� ����� ����"��#����� ��" �
���������������� ������ � �� ����� ���� ������ ����
��� ���� ����������� ��� ������� ��������� � �� ���
�� �� ��������� ������� �������� �������� ����� ���'
�� �7� �#�� �������� �� ����� �������� �����������
����"��������� ������ �
�� ����� ��� �� � ��� ��� � ��� �� �� �� 5� �H �
����� ���� � ������ �� ������� ���� ����������� �� ����
��� ����� ������������ ��� ������ ����� ������ �
���� �� ������� ��.�� �����& ����� ���� � ��������
��� � �� � ���� +�&���, ���� � �� � ��� ������� ��� ��
�������� ������� ��& ������� �� �� ��� ������� ��
�� �� ������ �� ���� � ����������������� I���N
�&��� ����� ������ ������ ������ ������ I���N���'
��� ����� �����& ���� � ��� �����
"���&�5� �H �����"��#�� ����� ���� ��
"� �!������������#�������
�� ��#������������ ��������� ������������������ �'
��� ����� � ����� � �� ����� 5� �H �������� ����'
����+���� � �� ����#,����#�� 5� �H �5&�� ���� $ �'
��� /�������.����� ���'� � �� ���� �� ����� ����� ��
������ ��� ��������#������� ���� �(
O ����������+������ ������ �������������,������� �
�� �� ��������� � ���� � ������� ��������������# �
�� � �#��H � ��� �������� # ���� ������� ������� ��* �
��������������������#���#����� �
Proceedings of the 5th International Summer Workshop on Multimodal Interfaces - eNTERFACE'09
65
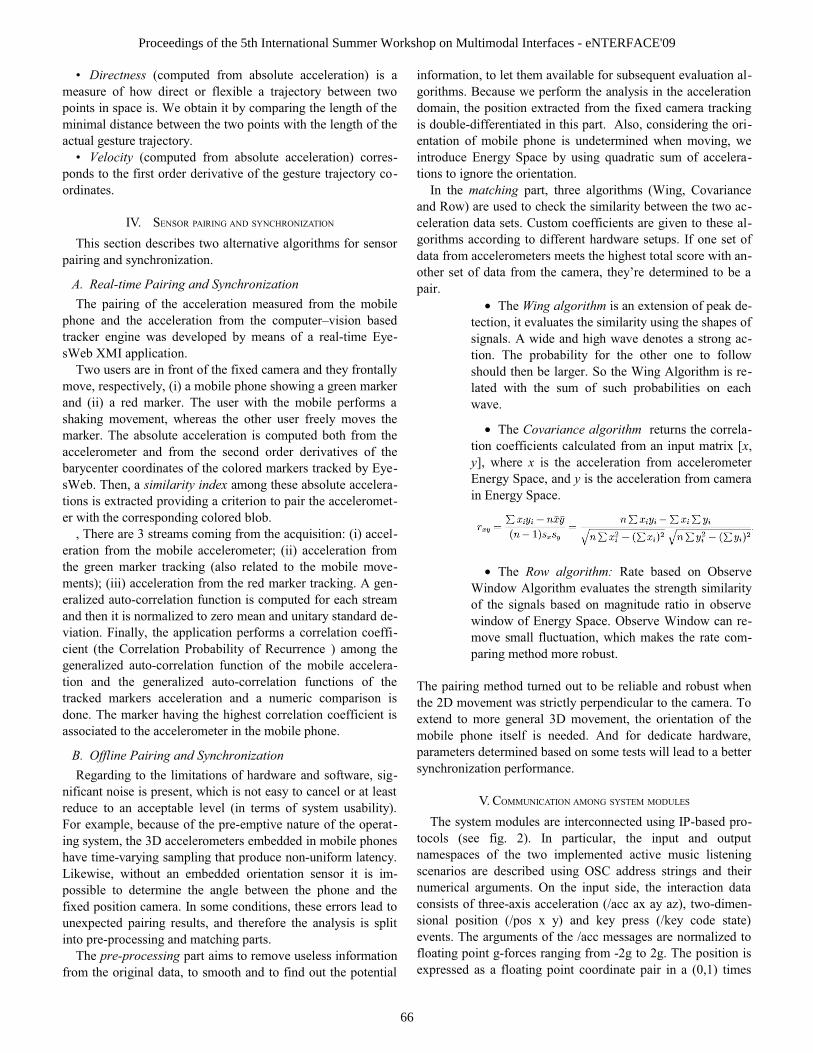
O $������� +������ � ���� ������� ��� � ������, �� �
� ���� �� ������ �� �� �� &��� � ���8 ������ �� � ���
������������ ���H ������������������#�� � �#������
�������������� � �� ��� ��������������� � �#������
������# ���� ���8 ������
O %������ +������ � ����������� ��� � ������, ���� �'
��������� �������� �� ������� ���� # ���� ���8 �������'
������� ��
�>� 5� ��%7����$7�� N�)����?7����
����� ������ ����� ������� ������ ��#����������� ����
������#������������*������
�� &���'����������������� �������(����
�� ������#���� ��� � ������� ���� ������� �����
���� ��� �� ��� � ������ ���� �� ������ �A��������� �
����" � �#�� ���� � ��� ���� ������ � ��'��� 5� '
�H �I!�������������
����� ���� ����������� ��& ���� ������� ����������
��� �� �� ���� ���+�,������ ���� ������#�#� ����" �
���+��, � � ����" �� �� �� ����� �� ����� � �������
���"��#��� � ����� � �� �� ��� ��� � �� ����� ���
���" ���� ������� ��� � �������������� �����������
��� � ��� � � ��� ���� �� � ������� � � ������� � �� ��
����� �� ���������� ����� ����� ����" ������" ���5� '
�H ���� �����������������!����#�� � ������� ��� � ��'
������� &����� ���������#����� ������������ ��� � ��� �'
������� ���� �������#����� ������
��� � �� E��� ��������#������ ��@��������(+�,��� �'
������������ ����� ��� � ��� � �B+��,��� � ����������
�� #� ����" �����"��#+����� ��� ����� ����� ��� '
� ���,B+���,��� � ������������ � ����" �����"��#�7# �'
����* �����'���� ���������������������� ���� ������ ��
����� ������������* ���* ��� ��������������������� '
��������.��������� ������������ ����������� �������� ���'
�� ��+�� ��� ������%������������� ���� �� ,����#��
# � ����* �����'���� ���������������� �� ����� ��� � ��'
���� ��� �� # � ����* � ����'���� ������ ��������� �� ��
����" � ���" �� ��� � ������ ��� � ��� ��� ���������� ��
��� ��� ���" ������#�� ��#� ������ �������� ����� ����
�������� ����� ��� � ��� � ����� ����� ���� �
� �������������������� �������(����
� #�����#���� �������������������� ���������� ���#'
������������ ���� � ������������� ��������� ������ ���
� ��� ������� ����� � � �+��� ��������� ����������,�
.�� &���� �� ���� ���� �� ' ����� ����� ���� �� ���'
��#���� ���� E���� � ��� � �� �� �� �������� ���� �
��� ��� '������#�������#���������� ���'���������� ����
/�" ��� � ������� �� �� �� � ��� ������� � ���� �� �� ��'
������� �� � � ���� �� ��#� � �� � �� ���� ��� ��
��& ������������ �������� ������������� � ������ ����
�� &� �� �������#� ����������� � ��� �� ���������������
������ '���� ����#����������#������
�� ���'������������������ ��� �� � �������������
������ ���#������������������������������� ��� �����
��������������� ��� ��������� ������� @� �� �����������'
#��������C ���� � � ������� ������������ ��� � ������
��������� �������� &����� ������� ��& ���� ������"��#
������� '���� � ����� ������������7���������� ���#�� ���'
�������������� ���� ����� � ���� ��� ������#��
�������� 5� �#� ��� ������#@���������������� � ��'
��������#��� �� ��� ��������
���� �������� ����� ��� ��#�������+H��#� ��������
������,�� �� ����� �"�� ����������� �� ��� �����'
� � ����������� ���������� ����� ����� #�� ����� � ��'
#���������������#������ � ��������� � ��������� � ���
����������� � ��� � ��� ���� ��#� ����������� ������'
��� �� ������������� ��� ����� �P� � � ���� ���� �
�����
• �� ����������������� &� �������� �"� '
� �������� ������ ��� ��������������#�� ���� ���
��#�����7��� �����#���� � ��� �������#��'
����� �� ����������� ��� �� ��� � �� �� ������
�������� �� ���# �� ��� H��#7�#��������� '
��� � ���� �� ����� ���� ����������� � �� ���
��� �
• �� "���������������� � ������� ���� ��'
������ ����� ����������� �����������������&Q!�
�R� �� � ! �� �� ��� � ������������� � ��� � �
5� �#� ��� ��������� ��� � ������������� ��
��5� �#� ��� �
• �� &) ���������* ��� ��� � �� ��� ��
H�����7�#������ ������ ��� ��� �#������������
���� ��#������� �����#����� ���������� ��
��������5� �#� ��� ���� �� H��������� '
��� ������������������������" ��� ��� ���'
�����#� ������� �������
�� ������#� �������� ������� � ����� ����������� �
�� 3���� � �������������� �� ������������ ��� �����
&� ������� # � ���E���� � ����� ��� �����������
����� ���� ��� �� �� � � �� 7�� ��� � ����� ������� �
����� � ��� � ���� ���� ������ � �������� ������ �� �
���������*������ �������� �
>� �!!���7���� 7!��$ N �5!!���/5
�� ���� ������ ��� ��� ����� �� �����#�%'��� ����'
������ +� ��#� 3,� �� ����������� �� ����� ��� ������
��� ���� � �� �� ��� ���� � �� � ����� ����� ���� ���#
�� �������� � ����� � ����#� ���� �������#������ ��
��� ����� ��#�� ���� ���� �������� � �� ��� �����������
������������� '�&����� � ������+M����&���*,����'��� �'
������ �������� +M��� & �, ��� " � �� �� +M" � ��� ���� ,
� ������ ��#�� ������� M���� ���# ��� �������* ���
�������#�����#'���� ����#��#����'3#��3#��� ����������
&�� �� �����������#�������������� �������+4�1,��� �
Proceedings of the 5th International Summer Workshop on Multimodal Interfaces - eNTERFACE'09
66

+4�1,���� ����#������ ���#�� � ������ �� ������������
�� ���� " ��� �� ������� ����� ���� " ������ ���'
� �� ���7 ��� �����C��� ������ ���������#��������
������������ " ��
�� ��� ������� ��� ��� ���� �� �������� ���� � ��
��������� � � ����� ��� ��� �� ��& � �� � �� ����� ���
��## ����� ����� �.�� &���� ��� ��� � ��� � ���� ��
���� ��������� ����������� ���-M��� M���&�*-����� ��
������������ � ���������� #�� ���-M#� �M���&�-���
��#���� ��� �� ��& ����� ���� ������� �� ��������'
������������#���� ������#���� ��� � ����� ��� ������>
7�
�� ����� ��� ���� ������������� �����5� �H ����'
��� ������� ����#����������� ����������� ��� ����������
��������� �� �#������� ���# ��
>�� 5�7���1(7����>� �7/7���� ���!5��
�������� �������� �� ���������������������������� ��
��# ������#���� ������ ������� ������������ � ��� ���
�������� � ����������# ���� �+����" �,������ � ��& ���'
��*������������+�� ��,������� ����������������#���'
������* ���������������� ����"�
���� ��������������� �� ��������������������# ���8 �'
���� ��� � ��� � ������ �" � � ���� ������# ��� �����
���� � �� ��� ������ �� ����� ���� � �� �� � �� �����
�������� ��������������������"�M���� ���# � �����#�����'
� ���������� ������ ���� ������* ��� �������� �������'
� ��� &������� ����"��#����� ���## ���� ������"���
������������� ���� ������ �� ���� ��� �����������#�����
���������� �� ���# �#�� ��
�� �������������# � ��� ����������� ���������� �'
�* �� ��������# ����� � ��� ���'����� � � ������� .!
����� � �� � ����� �� � ������ ����" �� ��� ���'����� �
����� ������ �������� � ��� ����� ���� �� ���## �'
��� �� �� ����� ����� ��* � �� ���������� +�� �� ������ ��
# � �����#������� ��� � �������� �����,� ��� �����'�������
+������ ������� ��*��#������� ����������� ,�
�� ������������ �#�� ������������ ��� �� ���#���'
���� ��8 ��� ��� ������ ����� � �������� ����� +� ��#� 9,�
�� ����" ��� �������* ��������� ������ ������� ����# �
������ ���������������������� � ������� ��������
����� ������ ���������� �����������* �����������������#
E�� �������� ����� �� ����� ���� ���� ��� ������ �����
���� � ��������� �������������#���� ���� ����� �����
��� �������# ���� �
�� �������
���� 1�������* � �� ������#���� ��� �� �� 7���'
������� 7�� ������� ��� �� ������ ������ � ��� � � +M���,�
��������+M���,���" ��� ��+M" �,�������� ����� ���� ���
����� ����#������ �������������� ��� ����� � ���������
���#��# �� �� � �� ���# �#�� �� �� ���� ����# ������ �
# ���� &�������������� M������M" ���� ����� ������'
�������� M������������ ����M��� � �#�������������� ��'
��#�� � � �� ��������� ���* �# ���� � ���+M����" &�5
"����'�$������������������ 7����������7��������� ����� ������
��M�� �&�5,���� � �� ���# �#�� ��������������#����
�� ����� � �� ���#�� �"+M��� ������ ������,�
������������� ���� ���� ����������� ����� ����� �
���������� ��� �#�� ����������� �� �������������� #����'
��� �#�� �����������13J����� �+M��� ���� �,�
�����#�!�������# ������#���� ��������������������� ����� ������
������� �� � ������ �����
M����&���* M����"
M�� �
� �#�5
M��� ������ �M" ���� � '
M���&� ' &�
M��� ���� �
� �������
7%������� � �� ����M����M" ����M������ ������ '
@� ������ ���" ���������#������#� ��%������� �����
����� � ����� � �� ��� ��� �� �� ��� ����� � +M��� ���
M#� �,������ ������������ ��������� & �������%��� ����#
������� ��� � ��� ���������#���� � &� ��" ����� �
���� �������#�
.��M������" ����� ������������������ ��� � �#�����
��� � ��+5S�@��+�&3K��3K+�*'1,3,,����# � ��� ��� �
����" � ���� ��� �������� ����� &� ������ �������
1�96��� ��#������ �� ���� �������������� ������ ����
# � ��� � � � ���������144�� ��� � ������ &��� ��
�� ���## � �����" � ���� &� �� ��������������������'
�������������#�� ���� ������ ���� M������ ����� &
����������������� ���� ����� �������� � � �#����� 5
�� ��������� ����� � �� ���# �#�� ���TM����" &�5T� �'
��# ��
�� ��� � ��� � ������������� ���������#����*�����
�� ���## ���� ������# ���� �����## � ����� ����#���
������# �� ����� ����#���� ������ �� �� ����� ���� �
H��� �� �� ���� ����������� ��������� �������������14
)*��� � �� ��� � ��� � � � �#����������� ��� �� ���
��� �� ������#���� �TM�� �&�5T� ���# ��������������'
� ����� ����� ������ ��� �#�� �� ����������#��������
"� &�����������������������������
�� TM����" &�5T� ���# ��� ���� �� �����TM��� �����
� ������T � ���# � +���� � ��& � �� � ���� ��������, ���
���� ���� ����������� �� %���� ��+ &� ���� ������#�
Proceedings of the 5th International Summer Workshop on Multimodal Interfaces - eNTERFACE'09
67

��!��� ���#�� �) &� ����� ����#�� �������#N�����T�
�I6.!����� ��* ���������������� ��� �� ���#���#����
�I6�������� ������ �����#�������'��������������������
������#��� ��5&� ��� ����� ���������� ����U���� &� �
����� �� � ���� ����� H��������������������������
���"����� �����������#���# ��� &�����5��#�� �����
�� � ���# �� ��������� � ��� ������� �������� ������
����� � ����� TM��� ������ ������T� ���# �.�� &���� �
��� � �������� �� � ��������� � ����� � ���� � �������
����� ���" �� ���� �&������� ����� ��������5��
�� � �������H &� ��� �� �������@�����*��#�� &'���#
��������*�� �� ������## ���#����� � ������������� ���'
�� ��* �+������ ����� ����� ��������5��� �#�����
�� � ������,�
�� ����" � ���# ��� ������������� ��������������
����� &������ �� & ��� � ��#�� ��� �� �� � ���# � ���
� �� �� � �������� ��� �������� �� �� � ����� ��������� '
��� ����� &����� ���#�� ������ ������#����� �����
����� � ���� � �� �� � �� � � �� ��� ������ � ����#��
7� ���� �
�� TM�� �&�5T� ���# ��� ���� ������ %�������'
������������U &� ����� � ��� ����������"��� &� ����
���� � ��� � ����� � ����� ��� ���������� ���� �� ��� ����
����������� ����������#��D:����'�����#'���� � � � ���
����� ��������������������������#��� ����� ��* ������
�������� ����������#�����������#��#��� ���� �������
��� ���� ��� ���� ����� ��� ������� ���* ������������'
����������34)*������#�� ����� ��� � �����������������
�� ���� � �� ����� � ���� �� �������� ���� � �� ��
��� ���� ���������� ����� ����"���������������� ���
������ ���� ���"#������������� ������ ��� � �����'
�� .!����� �# � ��� �������"��#��� &��#�� ������
� ���# � � �������#� ���������� �������������#��� ���'
#�� ������������� � ������������� � ������� � �����
���������� 5��#�� ������ �������� ���������� �����
��������� ���#��� �� ������ ������� ���������� ���
�� ����������� ���� � �� &�����#���������� ������
�� �� �� ���# ����� ��������� ����� #������� �'
#�� ����� ��� �������� ���� ��� ���� ����������� ����
� �������� ���� ���� ����������������������� ����
��� ����#�������� ��� ���������#��� �� ��� �����������
����� � ���������� �� V���� �����# � ���� � �������� E�
��� ����� �#��D:�5������ ���� ����� ���� ������ �
���� N'���������������� � ����� V��������� �����"
�� ��� � ��� ��#����� ������� � V���� �� ���� ����� �
�������'�&������#����� � ��� � �� ���� �������� ��
��������� ��������������'�&��������#�/.���� �
�� .!�������� ������ �������� ��� ��� ��# � ���
������������� �������� 3������ ������ E������#��� �
�� ������ &��� ������ #������� �#�� ������� � ������
�� ������ ��
>��� 5�7���3(!�C�/5�������
�� !���� ���������� ����� ���� ������ &� �� ��
�� �����( �� �� � ��� &�� ��� �� �� �����������#�������
���������������#��� � ����!����� � ���������� ��'
��� ���� ��� � �� ���� � �� �� ��� � ���� �� �� �
��������������� & ���������� �����������#�� �����
�� ������� ��������������
"����((������������������ !���� ��������������#��
�� �� �������� ���� ��� ������C�� �������#@���"
������# ���� ��� � � ���� ��� ������������"��� + �#��
@���"# ���� ���������@���"�������"������ � ���,�/�� ��
��������#������ ���8 ����� � ���� �� � �������� ����� �
�� � ����� ��������� ����8 ����� ���� ������ �� ����
����� ����� �������������� �� ��������� ��(��� &���� �
�� �� �� � ���" � �� ����� ���� ��� �������# ���� �
����" # ���� ���� ��� & �������������������� ����� ��'
������������ ���������� ������������� � ����������+ �#�
�� ������������� ��� ,�������� �� ����������������'
������� ��������#� � � #� � �� �� ��� �� ������� ����'
������� &� ��� ����#����� ��� ���� � ���� ����� ���
��� �
�� ������ �� ���#�� ��� ���� ��������� �" �������'
�������� ����� ���� ����#���� ������ ������ ���� �
��� ��� �������� ������ � ����"������ � �� �����
����� ���� �� � �� �� �������� �������� ������ ��
�� �������
�� !���� ���������� ������� ������� ��� '�&����� �'
������������ ������ � ���# ������� ���# ������ �
���� ����� ��� ��� �������#���%����������� ���'
���#����#���* �������� ��(+�,�����������#�� � ���'
���� &�� ���� � ���� �B+��,������#�� � �� ���� ���!���
� ���# ��
.������ �������������� ��������#(
• ������������������������������������,�����'
�����-(� ������ �� �@��� �������� ��� ��'
� � ������������ �������#�� I�N���?�&��B��
�������� ������� ������ #������������ ����
����������������#1���� � ������#��� � ���������'
�������������� � ����� ��� ���������� �� �
�� ��� � ����� � �������������� �� � �������'
������ ������>������ � ������
• ������������������������������������,���'
�����-( 3� ��� � �� ��������� � �� ������ �
������ ��������������� ���# ��� ��� ������
����� ��� ��� ������#����4�9��:� ��������� ��
Proceedings of the 5th International Summer Workshop on Multimodal Interfaces - eNTERFACE'09
68

����������� ����� I�N���� � �������� � ��
���8 ������ ����# � ������ � #� ������� ��#��������
�� �� ������ ����������8 ���������� ������
� �� ����������#����� ���� ����#�� ��������� ����
������������ ���8 ������
�� � ������ ������� ��� !���� ���# ���� � ������
���������������� (
• ,����������-�������������$��������������(�� �
�������� ��� � ����� � � �� �� �� ���� ����'
��� ��� @� �� �����������# !���� ���# ����
�� ���# ��KM'39������ �� � #���� ������� ��
����� �� � � �� � ���� �� ���� �� �� �� � ���" �
�����#���� ����� ���� �� ������������ ��� �
�������� �������� �������� ���������� ���� ��
�������� F���" G���� � ��� �
• ,��������-�������������$��������������*����
���8 ����� � ����� � �� �� �� � ���� � � �����
���� �����&���� �������#����� ���������� F���'
��� ��G� ���� ����#��� � ��!���� ���# �����
���� �� �� ����� �� �� ����� �� � ��� ��� '
� ����
• ,���� � � � �������- � ������� � � � ��$� � ���� �
������(�� �� ������ � ����� ������� � '
������������� � ����������� �B���������� ���
!���� ���# ������������� ������� � �������"
��� ��� ��#� ��� ������ � ����� ��#� �����'
���"��� ������� '� ����
� ����������������*����������
�� !���� ���������� ����������� ��!�����������
�������� � �!������������� ������������ �� �� ��
����� ����������������� & ��������� ��'��� �
.�� ���� ������ � � ���� � �� � ���5� �H � ����"�(
!���.�� � �� ����!���! ���# $ � �����+� ��#�6,�
"����)(5� �H ����������������������"����� ��� � ����#�����
����������F���������# G� ���# ������ # � ��� ����F7//G����'
� ����� � ���# P�� ������� ����� ��� ����� ���� ���������
����# ������'��� ������ ���� ����� ���� ������ ������
�� �����#����&���������� ��������#��������� �(
' !����'����� �������(����� � ���# ��������� ���
� ������#������������� �P�� ����� ���������� �
' !�& �'����� �������(��� �� ����� ���# �� ������
�� �������� �� � ������#������ ��������� ���������"��#
��� ���� � ���# P������ ��
' C��� � �������(�� ������������ � ����� �������� �
�� ���� � � ��� � ����� �� ��* �� �� ���� � ��� � � �
������������������� �������������������� &� ���������
����"��#����
!�� �� ���� � �� ��� ���������*�������� �(
' ��� ��������"(�� & ������� �������������� �������
���� �� �������� ������������ �������� F��� ����'
����G���� ����� ����� ��� � �� �����"����� �������
� ������� � ����� � �� �� F �� ���G� ��' � ��� �'
��# ��
' 5&� �������������"(�� ������������� �� ������
���� ���� �� ����� &� �������������"��#���+��������
��������� ���#���,� �� �����#���� ��� ����� ��������"
+������� ���������"� �#��,�� � �������� ���������
��� ��" ���� �� ��������������*�������� ���� ���� ���
�� ������ ��� �� ������������� ������ � �� FC��� � �
������G����� � �#������ �������� ����������� ��������
�� ���� ���@��� ������� &� �����������#��������������
������ ����������� ���# � ��� ������� �����E� �� �
����"� � �������� � ���� �� ��� � �#�� �� # � ��� � ����
������� ���� ��������������* �������� ������ &� ����
� �������� �
' �� ��� ���� �(�� -��� ��������-���- �� ���-� ��
� ����� �#��� ������� & ������� ������� ����������
�� �����������.������� �����������������# � ���
��� ����� ���# �� �� �� � ������ ���� �� ��� �� ��
� ���# �� �������� � �� �(��� ���� ��� ���%���'
������" ��� ���� ����������# �%��#������# ����'
� ��� ���� �%����C ������ ����� ! ���# ��� �� ���
�� ���� �� ���� � �� �� ������ � ���# P� �������� ��
����" �� �"� �� ���� ����� � ���� � ���� �� �� ���� ��
� �� �1���1D���� �� ��� � ���# ����� �� ���� �����'
� ����� ����������" ���� ���#����� ������B���� ����
����� ����� ����� ����� ���F7//G�� ����"�� �� ����
� ��� ����#� �� ������ ��� ��&� ����� � ���# �� �� ���
������������ ����������"���� �� ��� �����������
����� ���� F������ ��G�� � ����������� ����� ���
��� �
>������ � ���
���������"� � � ��� ������ ����� ����������#���
���������� �� �������� ����� ������ ����� �������������
H �� � �� �������� � ��������������� ��������� ���#�
��� ������ � ����� ������������� ����� �� ������ #'
�����#���������� � ��� � ����� &� ������� ���� ����H
��� ���#�� ����� � �������� ������������������* ��� � ��
�� ���������������#� �� � �� &�� ���� ������� ���� ����
# ���� ��H �� �� ��#� ��� ������#����� � ������'
�������������� ����������������
�� ���� � ��������� ����� ������ ���������� ����
�� �� ���� � ��� � �������� ��������������& �����'
������� ������"��#�� ����� �� �� ����� ���� ��� ���
�� ��& ���� ��������������"��#������ �3�����������'
������������ ����� ��� ������������������ ����@� ���
�� � �� ������ �� � ������� ���� ����� ��� � ��� � �
������ ��� ��� � �����������
���# ���#�����'�� � ������� ���� � � � ��� � �� � ��
������#��������� ����������#��� ������ �������������
� ����� ���������������" ���� ������#���� �����������'
���� � ��� � H ��������� ������������#�������������� &
� �� ������� � ��������� ���+�������� ������� �����
Proceedings of the 5th International Summer Workshop on Multimodal Interfaces - eNTERFACE'09
69

��� � ��� � ��������������� ���� � ����� ���������"��#
��� ��,������������ �������� ��� ������� �������"��#
� ������������� ��� ���������# ���#��� ������ �������'
������� � � ������� � �� �������#� ������������� �����'
������*��#�����������#�� ���� ���� ����������� � '
�������� ��� ���������� ���) � � ����������� � ����� �
�������������������� ���������� ������� � ��������
���������� ���� ������������� �������#������� ��������
�� ��� ����� ���������*�������� ����� ���� ��� � �����
�� ����������� � �������#�
H � � ������� � �� ���������#�� �� ������������ ��
&�������#�� � �������� ���� ������� ����� ���� ��'
� � ��� � ���� ��������� �� ������������ �����������
��������� ������� �� ����� ���� �H � � ��� ��� ���
����������������������� ��������������#��� �����������#
��� ���� ��� � ��� � ��+E6)*,'����� ������� ���� ���#
� ������� ������# ���� � ��#������'��� �� ���� �� �
��� ������� ���� � ����������������������������� ����#'
# ���#� ���� ���� ����������������� ����� ���� ���
� ����� �+19���,������ ��� � ��� � ���� ����� ���
19�������� ��������� ������ ���� �������� �������
����� ��� ���
�� ���� � �� � ����������� �� ������ � � �� � ���� ��
������#���� ����� @� ���������������� �� �� ��� ���� �
������ ����H ��������������������� �� �����������*
�� ����� � ����# ��� �������� � @� �� ��������� +���
&���� � �����������# �� ��� � ��� � � � ������ ���� W3#W
���# ����� �� ����� ���� ��� ��� ���� ���� �����������#
� ����'�� ��������� �,����������� ���� �� ���� &����
�������*��#�� !���������������� �������������� ���#
�� ������ ���# � �� ����� � ����� ��� ��#������� ��������
����� ��� ��� ���� ���� � ��������� ����� ���������'
�� ����� ���������� ���� �����
������������������������ �������� ��& ���� ��'��� �
���� ����"��# ��� ��� ���� �� ��� � ��� � �'��� � �����
����"��#������������������������"�)�� � ��������#���
�����������#��� ��� �� ����� ���� � �������� ���
���������� �������������� ��������#�� &���������������
�� &������ � �������������� ���� �� ����� � ����������
�� � ��� � ���� �� ����� � � ��� �� ���������� ��� & ��'
#�������
�����C�����7��7<��H/5�$!5��
�� ������������� �� �� ������� �� �� �������� ;���
<� �����+���8 ���������������!�������� ���"����������'
������������ ���,�!����*��!������+���8 ����'�������������
����� ���������,� $�������>���� + ���� ������# �� 5� '
�H ������� ���������,�7������������+���8 ��� ������,�
����7��� ����+5� �H �!�������"����� � �������,����
/��#� �?���+������ !���������������� ����������#,�
�� ��������������" ������"C������!�**����������'
��� ��������������������� ���� &����������������� ��
��� 5� �H � ����������� � ��#�� ��� $����� �� >��� ���
%������ ���������8 ��� �������
�5.5�5�5
Q1R 7!5���8 ��+ �������!����.��5� ���� 5� �����5� ���� �
5� �����,�Q����� R��� ��# ������(MM������� ���8 ��� �M
Q3R 7��������%��� ����$�>�������� �$������� � �����#����������
��� ������ ���� ������5� �H �I!����%��� ���#����� 6����� �'
����������� � �� ��� ���� ���� ����!������5&�� �����+��!5
3446,���# �E49'E4J�7!� �N��"��N�� 7�3446
QER 7����������� ���%��� ����C�!�**������$�>��� �-!��� � �
7�� ���5������(�!��������� ��� ���� �����7���� /��� ���#���
5&�� ���� % �������� -���%��� ���#����� J����� �����������'
� � �� ��� ���� ���� ����!������5&�� �����+��!5344J,�$ �'
����������;�� 9'6�344J�
Q:R 7��������C�!�**���������$�>��� �F7��������� &�� ���� # �'
��� (�� � �� � &�� ���� # ���� ���� ����#��������G/�"0�&��
1�0� ��1�"����0�&� "��1"5�344:�Q����� R�7������� (
����(MM���������# ����"����M��� &M�.�1/3;1�!6H3)JD����
Q9R !�%��" �� �0���0���������0�����2��������������������H����
�� ������%� ���3446�
QDR ����*����������������3���Q����� R����(MM�������#X1J�11�3442Y�
Q6R !���!��������� ��7�����������"���������$��4�5�$�������� ��'
������������� �� ��3441�
QJR ����� ����"�����Q����� R����(MM������ ����������������#
X1J�11�3442Y�
Q2R %� ��#��;�)����"� ���;�) �""��Z�F$����������� �������������#
����"�������#������� ���������������G��������46����������� ��'
������������"��������+5� �%�3446,�%�*����%������3446�
���1J3E'1J36�Q����� R���� � �������������� ������(MM� � �������"�'
�����M� � ����M���8 ���M��"����M�>�� ��� ������X1J�11�3442Y�
Q14R ;�������#�-�� ���� ��������� &7���� � ������! �����
.� @� ���!����������-7����������������������������� �����
31+6,�126E�
Q11RC�> �����"�!�!��� ������� ����- ���� � ���� ���-������� �
�����"���������"����+�!T44,�C �����$ ������3444�
Q13R ;�C�����"�$ ������/�$ ����������$�Q����� R7������� ������(MM��� ���������M! �� ��M8�M����UM�� �X1J�11�3442Y�
Q1ER �C��������!���*�8������$9:���������$ ���������Q����� R7����'��� ������(MM���������� ���# �� �M� &� ������X1J�11�3442Y�
Q1:R��!������!���������!���� �����;�<������F� ���� �� �����
����� ��������������� &���� ��G������&���:EJ(3E6'E32�3446�
Proceedings of the 5th International Summer Workshop on Multimodal Interfaces - eNTERFACE'09
70

Abstract
Our project goals consisted in the development of attention-based
analysis of human expressive behavior and the implementation of
real-time algorithm in EyesWeb XMI in order to improve
naturalness of human-computer interaction and context-based
monitoring of human behavior. To this aim, perceptual-model
that mimic human attentional processes was developed for
expressivity analysis and modeled by entropy. Museum scenarios
were selected as an ecological test-bed to elaborate three
experiments that focus on visitor profiling and visitors flow
regulation.
Index Terms—museum, computational attention, expressive
behavior, complexity.
I. HUMAN BEHAVIOR ANALYSIS IN MUSEUM SCENARIOS
The analysis of the behavior exhibited by museum visitors is
interesting from different perspectives. In museography, the
design of an exhibit or of a visit to an archeological site could
greatly benefit from concrete data from the automated tracking
and analysis of visitors’ behavior, to obtain a profiling of the
museographic project. From the perspective of the
enhancement of the quality and the intensity of the experience
in a museum visit, many directions can be envisaged: from the
analysis of the behavior of visitors used to adapt the lighting
environments, the communicated museum multimedia content,
to the increase of the immersivity and the understanding of
cultural content by means of interactive technologies, toward
an “active fruition” of cultural content [11]. Furthermore,
these issues can provide inspiration toward, for example,
possible solutions to the well-known problems of the “Non-
Places” which are defined by Marc Augé as places where no
social relationship can take place [2].
Multiple variables affect the museum experience: 1) the
artifacts that are exhibited, 2) the visitor’s personality,
knowledge, motivation or learning style, 3) the presence and
dynamics of others around them including friends, family and
strangers, and 4) the environmental conditions (e.g., signage,
light, temperature). In this sense, museum experience has been
described as a multivariate one [38]. Other aspects of our daily
lives spent in public spaces also show great complexity and
sensitivity to multiple social, cultural and psychological
influences (e.g., go shopping). However, Bell’s cultural
ecologies ascribe museum visit with three specific qualities:
liminality (museum are places that embody an experience
apart from everyday life, in a differently experienced
dimensions of time and space), engagement (museums are
places where people go to learn, often in an entertaining and
exploratory way) and sociality (museum should be designed to
guide supported activities that increase the interaction between
family members, friends and artifacts) [4].
Museums are receiving in the recent years an increasing
interest from the Information and Communication
Technologies ICT research communities. On one hand, non-
invasive systems for monitoring people and user modeling
(e.g., ubiquitous computing, ambient intelligence) can enable
visitor profiling with reliable quantitative data, which can give
new insights on visiting styles. On the other hand, the
development of interactive applications can provide visitors
with new solutions for active fruition of museum content.
II. SUPPORTIVE ICT FOR MUSEUMS FRUITION SCENARIOS
A. Profiling visitors
Starting from observations of the behavior of visitors in
several museums, the ethnologists Veron and Levasseur [34]
argued that visitor behavior can be classified as four “animal-
styles”: ant, fish, butterfly and grasshopper. The ant visitor
follows a linear path and spends a lot of time observing almost
all the exhibits. The fish visitor moves mainly in the centre of
the room without looking at exhibit’s details. The butterfly
visitor often changes visiting direction and stops frequently.
Finally, the grasshopper visitor carefully selects a number of
exhibits and spends a lot of time observing them while
ignoring the others (see Figure 1). This classification have
been widely used and supported by quantitative analysis [35,
31, 18, 15, 43]. An alternative simplified museum visitor
typology was proposed by Sparacino following Dean [17] that
distinguish between three types of visitors: the busy, selective,
and greedy visitor type [31]. The busy type wants to get an
overview of the principal items in the exhibit and see little of
everything, the selective type wants to see and know in depth
only about a few preferred items and the greedy type wants to
know and see as much as possible without time constraint.
Toward a model of computational attention
based on expressive behavior: applications to
cultural heritage scenarios D. Glowinski
1, M. Mancas
2, P. Brunet
3, F. Cavallero
1, C. Machy
4, P.J. Maes
5, S. Passchalidou
6, M.K.
Rajagopal7, S. Schibeci
1, L. Vincze
8, G. Volpe
1
1
University of Genoa, Italy, 2
University of Mons, Belgium, 3 Queen's University of Belfast, UK,
4 Multitel,
Belgium, 5 University of Ghent, Belgium,
6 University of Crete, Greece,
7 Telecom Paris, France,
8 University of
Pisa
Proceedings of the 5th International Summer Workshop on Multimodal Interfaces - eNTERFACE'09
71

Fig. 1: Overview of the four visiting styles developed by Veron and
Levasseur [34] and modeled with the VU-FLOW system developed by
Chittaro et al. [15]. The darker areas represent spaces where a
visitor spent a lot of time.
Both visit typologies are based on spatial-temporal patterns
that characterize visitor displacements in the museum (e.g.,
physical path, speed, direction changes, number, location and
length of stops). In addition, these patterns of displacement
can be employed to identify navigation problems within the
museum spaces [15, 30]. Unobtrusive monitoring systems
(e.g., ambient intelligence technologies) allows for the
automatic capture of physical data related to visitors’
behaviors [29]. However, in a number of real-world scenarios,
the identification of individuals for the purpose of tracking can
be problematic (e.g., occlusion, video coverage of the exhibit)
and can require additional manual annotation [30]. More
invasive devices (wearable museum [31], virtual environment
[15]) have been employed to provide more accurate and robust
information about position and orientation, however with the
possible drawback of restricting or influencing visitor
behavior.
B. Providing visitors with active fruition of museum content
The information automatically collected from movement
patterns enable curators to profile visitors and identify design
exhibits problems offline. Ambient intelligence and user
modeling technologies have also been largely used to extend
the possibility of interaction within the museum spaces. A
majority of projects have developed context-sensitive
handheld prototypes with embedded sensors which are
employed to capture visitor current location, in addition to
handle more explicit request from visitors.
The Hippie project is a first attempt to develop a context-
sensitive adaptive museum guide [28]. Their user model aims
to “predict the information needs of a user in a given episode
of a visit”. The model makes inferences regarding the next
exhibit to visit and the next piece of information to present. In
the HIPS [26] and the museum wearable project [31], visitor
styles, based on the patterns from [34] and [31], serve to
assemble appropriate length audio clips for each individual
(e.g..for the butterfly or greedy type, short clips will be
displayed).
Experimental mobile multimedia systems have also been
developed in the MUSE and PEACH projects to personalize
information [16, 32]. The PEACH guide provides the visitor
with a digital character on their PDA who delivers information
on various artifacts within the exhibits. Details about paintings
can be accessed through prerecorded video close-ups and a
printout can be produced to recapitulate the exhibits the visitor
encountered while at the museum. The MUSE project
provides virtual access to physically unavailable items
according to a visitor’s interest.
The e(ch)o project implements hybrid adaptive and adaptable
systems to correlate explicit and implicit reactions from users
to gain feedback and improve user model [18]. The CHIP
project allows a user to generate a personal profile via an
online rating system for artwork that is later used by the
system to suggest visit itineraries in the museum [1].
In recent years, research has continued on group-based
activities. In this perspective, the PDA is thought to provide
shared virtual space for coordination and collaboration to help
make new connections for museum visitors [4]. The PIL
Project, for example, extends results of the PEACH project
from the individual to the group level [19, 21]. The authors
developed intra-group context-aware communication services
that aim at stimulating conversation about the museum
contents within the group, during and after the visit. Wakkary
observed that the interest for group-based activities vary from
research focused on information delivery tours to research
focus on game interaction activities [40, 39]. A learning game
for school children has been created within the ARCHIE
project [33]. It allows visitors to trade museum-specific
information to gain points in order to win a game. However,
during group-based activities, handheld device like a PDA
may distract the visitors from their companion. In this
perspective, recent ambient intelligence techniques based on
group-centric concepts [36] can reveal fruitful for non-
invasive applications in museum environments (Shape project
[3], Kurio project [41]). InfoMus – Casa Paganini in particular
developed novel user- and group- centric interactive
multimedia system architecture enabling an active and social
experience of audiovisual content in a playful manner. The
first permanent interactive museum exhibitions focused on
music performance and full-body movements as first class
conveyors of expressive and emotional content. For the Music
Atelier of “Città dei Bambini” (Children’s City, Genova,
1997), a sensitive space was designed to let children exploring
music content through expressive body movements. In the
Genovese Maritime museum and the aquarium, systems were
implemented for the real-time control and generation of
sounds and musical comments related to the content of the
museum exhibit ("The Big Blue Boat",2000). Interactive
sonification depended on individual presence in specific
locations and group movements. Scientific museum served as
a testbed for active exploration of scientific experiments to
trigger interest and curiosity and to facilitate the commitment
of young visitors (“Museo del Balì”, Fano, 2004, “Museo
Vivo della Scienza - Fondazione IDIS”, Napoli). From the
perspective of valorization of cultural heritage, recent research
conducted in InfoMus Lab - Casa Paganini have provided
Proceedings of the 5th International Summer Workshop on Multimodal Interfaces - eNTERFACE'09
72

novel engaging paradigms of interaction with pre-recorded
music content, enabling a large number of non-expert users to
rediscover the musical heritage (e.g., classical and
contemporary music) they may not be familiar with (EU-ICT
Project SAME, Sound and Music for Everyone, Everyday,
Everywhere, Every Way, www.sameproject.eu). The field of
application has been extended to active experience of
audiovisual content, in particular in a novel permanent
interactive museum exhibition: Palazzi in Mostra, Palazzo
Ducale, Genova, Italy, enabling tourists and visitors to explore
virtually the UNESCO Treasure of “Palazzi dei Rolli” in
Genova (2010).
III. OUR PROPOSAL
A. Analysis of non-verbal expressive gesture
1) From explicit to implicit tagging
Regarding the user characteristics that need to be modeled,
most approaches focus on physical data (movement patterns)
to reconstruct visiting style. Higher-level of information
related to social or affective interactions can also be retrieved
from the analysis of visitors’ non-verbal behavior. Vinciarelli
labels this process “implicit tagging” [37] in contrast to
explicit tagging paradigm in which a data item gets tagged
only if a user actually decides to associate tags with it (e.g.,
adding keywords to the data that are used for indexing and
retrieval purposes). Discrete emotions of visitors (e.g. anger)
or attitudinal states (e.g. boredom) can be communicated
through full-body or body-part movements such as the hands
and head. As mentioned by Nass and Brave, emotions are
displayed in a similar way in human-human and in human-
computer interactions [8]. These categories of gesture that
convey an affective message are called expressive gestures [,
camurri2005cea].
According to Kurtenbach and Hulteen, a gesture can be
defined as “a movement of the body that contains
information” [22]. Thus, gestures can be named expressive
since the information they carry includes content related to the
emotional sphere. Expressive gesture, as a key aspect of
human behavior and in particular of expressive human
behavior, became particularly relevant in recent years (e.g.,
see the post-proceedings of Gesture Workshops 2003, 2005,
and 2007). Psychological studies have been a rich source for
research on automatic analysis of expressive gesture since
they identified which features are most significant [27, 42, 7].
A further relevant source has been research in the humanistic
tradition, in particular choreography. As a major example, in
his Theory of Effort, choreographer Rudolf Laban [23]
describes the most significant qualities of movement. Starting
from these sources, several systems for analysis of expressive
gesture were developed [10, 20, 5]. Our approach starts from
the multilayered framework for automatic expressive gesture
analysis proposed by Camurri et al. [12]. In this framework,
expressive gestures are described with a set of motion features
that specify how the expressive content is encoded. The
EyesWeb XMI platform for synchronized analysis of
multimodal datastreams (www.eyesweb.org) allows for the
extraction of a wide collection of motion features from video
and sensors data streams.
2) From static to dynamic modeling
Recently, we developed a novel technique to make analysis of
expressive gesture context-sensitive and adaptive. Our
approach draws upon information theory and computational
attention and has resulted in a salient index that detects salient
(i.e. unusual) behaviors. Behavior saliency accounts for the
distance, in a selected time window, between the expressive
features measured on an individual and the averaged values
measured on all the components of the group. Saliency can be
computed with respect to time or to space depending on the
behavioral features that are considered (e.g., dynamics for
time, trajectory for space).
Behavior saliency can be modeled starting from recent results
obtained in the field of computational attention. The aim of
computational attention is to automatically predict human
attention based on different kinds of data such as sounds,
images, video sequences, smell, or taste. In this framework,
salient behavior is understood as a behavior capturing the
attention of the observer. Whereas many models were
provided for attention on still images, time-evolving two-
dimensional signals such as videos have been much less
investigated. Nevertheless, some of the authors providing
static attention approaches generalized their models to the
time dimension (for a detailed review, see [24]). Motion has a
predominant role and the temporal contrast of its features is
mainly used to highlight important movements. Boiman and
Irani [6] provided an outstanding model which is able to
compare the current movements with others from the video
history or video database. Attention is related to motion
similarity. The major problem of this approach is in its high
computational cost. In order to get an efficient model of
motion attention and behavior salience, we developed a three-
level saliency-based model [24]. At the first level, motion
features are compared in the spatial context of the current
video frame; at the intermediate level, salient behavior is
analyzed on a short temporal context; at the third level,
computation of saliency is extended to longer time windows.
An attention/saliency index is computed at each of the three
levels based on an information theory approach. Analysis of
salient behavior was recently extended to measures of
complexity namely Multi-scale Entropy (MSE). This method
aims at evaluating the complexity of finite length time series.
It is based on the analysis of the entropy values assigned to the
original time series and to coarse-grained time series, each of
which represents the system’s dynamics on a different scale.
B. Pilot experiments
At the occasion of the Enterface09 summer school, three pilot
experiments were carried on to address issues related to visitor
profiling and visitor-flow regulation.
1) Visitor profiling
A first setup was created to implement and test a real-time
dynamic modeling of Veron and Levasseur visiting styles [34]
based on the long-term saliency index. Five Arcimboldo’s
painting reproductions were displayed in a gallery style on the
stage of the Casa Paganini auditorium. The typical spatial
configuration theorized by Levasseur and modeled in many
recent studies (see section II. A ) was followed: three paintings
Proceedings of the 5th International Summer Workshop on Multimodal Interfaces - eNTERFACE'09
73

on the length side and one on each of the width sides of the
stage (see Figure 2).
Figure 2. The gallery style setup : illustration of a visitor in the five
paintings museum room
Participants were instructed to view the images as they
typically would in a museum. Each participant was asked to
visit the gallery set up three time: (i) alone, (ii) in presence of
two confederates that view paintings from empty spaces
(empty condition) and (iii) in presence of two confederates that
view paintings by standing directly in front of them (full
condition). These single user and multi-user scenarios were
created respectively to (i) observe and model visiting styles
and (ii) to put in evidence how the presence of others
influence visiting style. Five paintings from the Arcimboldo
opera pre-rated to be similar in attractiveness were selected for
the gallery. We thus avoid that visual characteristics of a
particular painting could differentially capture the visitor’s
attention.
Participants’ movements were observed from a single infra-
red video cam positioned 12 meters above. Motion history
images (MHI) were used to compute the position, the direction
and the velocity of participants over long-time scales (e.g., 4
minutes). The saliency index computed from these features
allowed to build a model of the scene highlighting the regions
where salient behaviors, characterizing visiting styles, could
be observed [25]. The unusual direction changes that
characterize the butterfly style or the long periods of
observating select paintings typical of the grasshopper, for
example, could all bedetected. Four learnt models were
successfully built that respectively integrate the characteristics
of each Levasseur animal-styles. Tests on 10 male participants
revealed that the main styles of the visitor could be
dynamically modeled in single and multi-users scenarios.
Results revealed that most participants followed the ant-like
style when alone and a grasshopper-like style in presence of
others. Contrary to other static classifications [26, 31, 43], our
model could inform in real-time on how the current visit
deviate from a pre-determined pattern [see Figure 3]. Less
typical behaviors could actually be retrieved that combine
more animal-like styles. Further tests will be needed that
could lead to more detailed typologies of visiting styles.
Figure 3. snapshot of an individual visit and real-time visualization
of each visiting style value (ant-green, grasshopper-blue, butterfly-
red, fish-white)
Personality questionnaires were also administered to the
participants to investigate any possible correlations between
visiting styles and behaviors observed in the various scenarios
with personality traits. Participants completed the short form
version of the Big Five Inventory (BFI) and the 5-highest
loaded shyness items and the 5-highest loaded sociability
items [9] from the Cheek and Buss Shyness and Sociability
Scale [13, 14]. Results suggest that participant’s visiting style
can be differentially affected by the presence of others
according to his sociability score. Two classes of people were
highlighted: those who change their style when other visitors
are present (on the path they would normally take) and those
who do not. In the full condition, we found that the five
participants that deviated from the ant pattern scored
statistically significantly lower on the sociability scale than the
five participants that maintained their ant pattern [F(1,7) =
8.556, p = .022)]. In our sample, people who feel the least
comfortable with others tend to drastically change their
visiting style to avoid standing too close other people.
2) Regulating visitor-flow
The second and third experiments were setup to explore
interactive applications that could regulate visitors flow in a
museum. The experiments again took place on the Casa
Paganini stage with the same video setup for tracking
participants’ displacements.
The second experiment aimed, in particular, at finding visual
cues that would guide a visitor to a target position. In our test-
case, the size and the resolution of the visual display (an
image of an Italian historical Palace) were mapped with the
distance of the visitor’s current position from the target
position (see figure 4). When the participant approached the
target position, the image projected on the 8*4 meters screen
that stood back along the stage, appeared in its full resolution
and size. When the participants moved away, the image
decreased and blurred.
Proceedings of the 5th International Summer Workshop on Multimodal Interfaces - eNTERFACE'09
74

Figure 4. The visitor located in the target position is able to watch
the projection in full size and full resolution (no blur effect).
Various mapping combination were explored (e.g., trials
including only blur effect without size changes of the images,
trials including only participant displacement along horizontal
axis). As illustrated in Figure 5, tests on 14 participants
revealed that the target position was reached more directly and
rapidly (less than one minute) when the size and resolution of
the image were both mapped to the participant displacement
on the horizontal and depth axes of the stage. A set of
expressive features was developed to analyze participants’
space occupation during the experiment and evaluate the
interaction design thoroughly.
Figure 5. Expressive features related to space occupation.
Example of the max Density features, visualization of 14 users mean
positions over time.
Psychological profiles were also submitted to the participants.
People who performed low on the sociability scale (i.e.
introvert people) reported greater interest in the size/resolution
manipulations (r = -.606, p = .022).
The third experiment aimed at regulating visitor-flow in a
museum room by guiding each individual to available
artworks. The gallery style setup described in the first
experiment was reproduced. A long-term motion attention
model of the scene was developed to compute how the region
surrounding each painting was visited as compared to the
others. Salient regions were then sorted out according to their
density level. Visitor-flow was regulated by attracting a new
visitor’s attention by means of a projected arrow to the most
salient regions, i.e, the region surrounding artwork that was
currently not being viewed by anyone else (see Figure 6).
Figure 6. A view of the interaction: new visitors entering in the room
were encouraged to watch the less visited paintings
IV. CONCLUSION AND FUTURE WORK
The work presented was achieved during the one-month
enterface09 summer school, and it should be considered as a
starting point for future analysis work, currently in progress.
In particular, we investigated the potential applications of
computational attention models to museum scenarios. Three
pilot experiments were conducted to address issues related to
visitor profiling and visitors flow regulation. Preliminary
results revealed that the standard Veron and Levasseur four
visiting styles could be modeled dynamically using a real-time
long-term attention model. Visitors expressive behavior in the
museum-like exhibit was further considered by analyzing
space occupation during the experiments and exploring
possible correlations with personality traits. Basing on
previous results, an interactive application aimed at supporting
natural expressive behavior was designed and tested to
regulate visitor-flow. A last consideration is on the first
successful use of the Casa Paganini site as a test-bed for
developing active fruition paradigm for museum applications.
ACKNOWLEDGMENTS
This work has been achieved in the framework of the eNTERFACE
2009 Workshop at the Casa Paganini – InfoMus Lab of the
University of Genova (Italy). It was also included in the Numédiart
excellence center (www.numediart.org) project 3.1 funded by the
Walloon Region, Belgium. Finally, this work has been partially
supported by the Walloon Region with projects BIRADAR,
ECLIPSE, and DREAMS, and by EU-IST Project SAME (Sound
And Music for Everyone Everyday Everywhere Every way). We also
thank Prof. Bracco, Chiorri, Schenone for their precious advice.
References
[1] L. Aroyo, N. Stash, Y. Wang, P. Gorgels, and L. Rutledge. Chip
demonstrator: Semantics-driven recommendations and museum
tour generation. Lecture Notes in Computer Science, 4825:879,
2007.
[2] M. Augé and J. Howe. Non-places: Introduction to an
Anthropology of Supermodernity. Verso Books, 1995.
[3] Liam Bannon, Steve Benford, John Bowers, and Christian
Heath. Hybrid design creates innovative museum experiences.
Commun. ACM, 48(3):62–65, 2005.
[4] G. Bell. Making Sense of Museum: The Museum as' Cultural
Ecology': A study. Technical report, 2002.
Proceedings of the 5th International Summer Workshop on Multimodal Interfaces - eNTERFACE'09
75

[5] D. Bernhardt and P. Robinson. Detecting Affect from Non-
stylised Body Motions. Lecture Notes in Computer Science,
4738:59, 2007.
[6] O. Boiman and M. Irani. Detecting Irregularities in Images and
in Video. International Journal of Computer Vision, 74(1):17–
31, 2007.
[7] R.T. Boone and J.G. Cunningham. Children's Decoding of
Emotion in Expressive Body Movement: The Development of
Cue Attunement. Developmental Psychology, 34:1007–1016,
1998.
[8] S. Brave and C. Nass. Emotion in human-computer interaction.
The Human-Computer Interaction Handbook: Fundamentals,
Evolving Technologies and Emerging Applications, pages 81–
96, 2002.
[9] M.A. Bruch, J.M. Gorsky, T.M. Collins, and P.A. Berger.
Shyness and sociability reexamined: A multicomponent
analysis. Journal of Personality and Social Psychology,
57(5):904–915, 1989.
[10] A. Camurri, B. Mazzarino, and G. Volpe. Analysis of
Expressive Gesture: The Eyes Web Expressive Gesture
Processing Library. Lecture notes in computer science, pages
460–467, 2004.
[11] A. Camurri and G. Volpe. Active and personalized experience of
sound and music content. In Proc. IEEE International
Symposium on Consumer Electronics ISCE 2008, pages 1–4,
14–16 April 2008.
[12] A. Camurri, G. Volpe, G. De Poli, and M. Leman.
Communicating Expressiveness and Affect in Multimodal
Interactive Systems. IEEE Multimedia, pages 43–53, 2005.
[13] JM Cheek. The revised Cheek and Buss shyness scale.
Unpublished manuscript, Wellesley College, 1983.
[14] J.M. Cheek and A.H. Buss. Shyness and sociability. Journal of
Personality and Social Psychology, 41(2):330–339, 1981.
[15] L. Chittaro, R. Ranon, and L. Ieronutti. VU-Flow: a
visualization tool for analyzing navigation in virtual
environments. IEEE Transactions on Visualization and
Computer Graphics, pages 1475–1485, 2006.
[16] J. Davis. The MUSE Book (Museums Uniting with Schools in
Education: Building on our Knowledge). 1996.
[17] D. Dean. Museum exhibition: theory and practice. Routledge,
1996.
[18] M. Hatala and R. Wakkary. Ontology-based user modeling in an
augmented audio reality system for museums. User Modeling
and User-Adapted Interaction, 15(3):339–380, 2005.
[19] S. Jbara, T. Kuflik, P. Soffer, and O. Stock. Context Aware
Communication Services in" Active Museums. In IEEE
International Conference on Software-Science, Technology &
Engineering, 2007. SwSTE 2007, pages 127–135, 2007.
[20] A. Kapur, A. Kapur, N. Virji-Babul, G. Tzanetakis, and P.F.
Driessen. Gesture-Based Affective Computing on Motion
Capture Data. Lecture Notes in Computer Science, 3784:1, 2005.
[21] T. Kuflik, J. Sheidin, S. Jbara, D. Goren-Bar, P. Soffer,
O. Stock, and M. Zancanaro. Supporting small groups in the
museum by context-aware communication services. In
Proceedings of the 12th international conference on Intelligent
user interfaces, pages 305–308. ACM New York, NY, USA,
2007.
[22] G. Kurtenbach and E.A. Hulteen. Gestures in Human-Computer
Communication. The Art of Human-Computer Interface Design,
pages 309–317, 1992.
[23] R. Laban and FC Lawrence. Effort. Macdonald and Evans, 1947.
[24] M. Mancas. Relative influence of bottom-up and top-down
attention. Attention in Cognitive Systems, Lecture Notes in
Computer Science, Volume 5395/2009:pp. 212–226, February
2009.
[25] M. Mancas, D. Glowinski, P. Bretéché, J. Demeyer, T. Ravet,
G. Volpe, and A. Camurri. Gestures Saliency: a Context-based
Analysis. In Proceedings of the Gesture Workshop, 2009.
[26] P. Marti. Design for art and leisure. Proceedings of ICHIM
2001, pages 387–397, 2001.
[27] M. Meijer. The contribution of general features of body
movement to the attribution of emotions. Journal of Nonverbal
Behavior, 13(4):247–268, 1989.
[28] R. Oppermann and M. Specht. A context-sensitive nomadic
exhibition guide. Lecture notes in computer science, pages 127–
142, 2000.
[29] N. Shadbolt. Ambient Intelligence. IEEE Intelligent Systems,
18:2–3, 2003.
[30] D. Shell, S. Viswanathan, J. Huang, R. Ghosh, J. Huang,
M. Mataric, K. Lerman, and R. Sekuler. Spatial Behavior of
Individuals and Groups: Preliminary Findings from a Museum
Scenario.
[31] F. Sparacino. The Museum Wearable: real-time sensor-driven
understanding of visitors' interests for personalized visually-
augmented museum experiences. pages 17–20, 2002.
[32] O. Stock, M. Zancanaro, P. Busetta, C. Callaway, A. Kr\"uger,
M. Kruppa, T. Kuflik, E. Not, and C. Rocchi. Adaptive,
intelligent presentation of information for the museum visitor in
PEACH. User Modeling and User-Adapted Interaction,
17(3):257–304, 2007.
[33] H. Van Loon, K. Gabri\"els, K. Luyten, D. Teunkens, K. Robert,
K. Coninx, and E. Manshoven. Supporting social interaction: A
collaborative trading game on pda. Selected papers from
Museums and the Web, 2007:41–50, 2007.
[34] E. Veron and M. Levasseur. Ethnographie de l'exposition.
Centre Georges Pompidou, 1983.
[35] E. Veron, M. Levasseur, and J.F. Barbier-Bouvet. Ethnographie
de l'exposition: l'espace, le corps et le sens. 1989.
[36] A. Vinciarelli, M. Pantic, and H. Bourlard. Social signal
processing: state-of-the-art and future perspectives of an
emerging domain. 2008.
[37] A. Vinciarelli, N. Suditu, and M. Pantic. Implicit human-
centered tagging. In Proc. IEEE International Conference on
Multimedia and Expo ICME 2009, pages 1428–1431, June 28
2009–July 3 2009.
[38] D. Vom Lehn, C. Heath, and J. Hindmarsh. Exhibiting
interaction: Conduct and collaboration in museums and
galleries, volume 24. Univ California Press, 2001.
[39] R. Wakkary, M. Hatala, Y. Jiang, M. Droumeva, and
M. Hosseini. Making sense of group interaction in an ambient
intelligent environment for physical play. pages 179–186, 2008.
[40] R. Wakkary, K. Muise, K. Tanenbaum, M. Hatala, and
L. Kornfeld. Situating Approaches to Interactive Museum
Guides. Museum Management and Curatorship, 23(4):367–383,
2008.
[41] Ron Wakkary, Marek Hatala, Kevin Muise, Karen Tanenbaum,
Greg Corness, Bardia Mohabbati, and Jim Budd. Kurio: a
museum guide for families. In TEI '09: Proceedings of the 3rd
International Conference on Tangible and Embedded
Interaction, pages 215–222, New York, NY, USA, 2009. ACM.
[42] H.G. Wallbott. Bodily expression of emotion. Eur. J. Soc.
Psychol, 28:879–896, 1998.
[43] M. Zancanaro, T. Kuflik, Z. Boger, D. Goren-Bar, and
D. Goldwasser. Analyzing Museum Visitors' Behavior Patterns.
Lecture Notes in Computer Science, 4511:238, 2007.
Proceedings of the 5th International Summer Workshop on Multimodal Interfaces - eNTERFACE'09
76

Donald Glowinski.
Donald Glowinski, Paris, 27-02-1977. His background covers
scientific and humanistic academic studies as well as high-
level musical training.- EHESS (Ecole des Hautes Etudes en
Sciences Sociales) MSc, in Cognitive Science, CNSMDP
(Conservatoire National Supérieur de Musique et de Danse de
Paris) MSc in Music and Acoustics, Sorbonne-Paris IV MSc.
in Philosophy. He recently obtained a Phd in computing
engineering at InfoMus Lab – Casa Paganini, in Genoa, Italy.
(dir: Prof. Antonio Camurri).
He was chairman of the Club NIME 2008 (New Interfaces for Musical
Expression), Genoa, 2008. His research interests include multimodal and
affective human-machine interactions. He works in particular on the modeling
of automatic gesture-based recognition of emotions.
Matei Mancas.
Matei Mancas was born in Bucarest in 1978. He holds an
ESIGETEL (Ecole Supérieure d’Ingénieurs en informatique et
TELecommunications, France) Audiovisual Systems and
Networks engineering degree, and a Orsay University
(France) MSc. degree in Information Processing. He also
holds a PhD in applied sciences from the FPMs (Engineering
Faculty of Mons, Belgium) on computational attention since
2007.
His past research interest is in signal and, in particular, image processing.
After a study on nonstationary shock signals in industrial tests at MBDA
(EADS group), he worked on medical image segmentation. He is now a
Senior Researcher within the Information Processing research center of the
Engineering Faculty of Mons, Belgium. His major research field concerns
computational attention and its applications.
Paul M. Brunet
Paul M. Brunet was born on February 12, 1980 in Sudbury,
Canada. In September, 2009, he obtained a PhD in
Developmental Psychology from McMaster University in
Hamilton, Canada. Previously, he held a one-year fixed-term
Assistant Professor position at Mount Saint Vincent
University in Halifax, Canada. Currently, he is a Research
Fellow under the direction of Prof. Roddy Cowie at Queen’s
University Belfast in Belfast, Northern Ireland. Paul is also a
member of the Social Signal Processing Network.
His research interests include the effects of context and individual differences
on social communicative behavior, the social signals of politeness, the
influence of individual differences in personality (in particular shyness and
sociability) in typical development, and cyberpsychology.
Pieter-Jan Maes
Pieter-Jan Maes was born on May 16, 1983 in Kortrijk,
Belgium. He is currently working on a PhD project supervised
by Prof. Dr. Marc Leman, director of the Department of
Musicology (IPEM) at Ghent University.
His research interests are grounded in the embodied music cognition paradigm
and cover the relationship between movement, sound and musical meaning.
Based on results of experimental research, he develops music HCI-
applications for the music education, performance and gaming sector.
Francesca Cavallero.
Francesca Cavallero, Genova, 27-12-1982. Coming from
humanistic academic studies (she holds the Master’s degree in
Arts and Multimedia at University of Genova, DAMS -
Discipline delle Arti, della Musica e dello Spettacolo, with a
thesis on evaluation issues on new paradigm of embodied
active listening: a specific case study has been developed on
the evaluation of the behavior of subjects using an interactive
installation), she is PhD student in Arts and New
Technologies (DIRAS - Liberal-Arts Faculty, University of
Genova).
From 2006 she collaborates with Casa Paganini InfoMus Lab (dir: Proff.
Antonio Camurri). Her research interests concern the user behavior in
museographic contexts, to develop new models of active fruition for cultural
assets.
Stefania Schibeci
Stefania Schibeci, Sanremo, 02-04-1982. Her training is in
humanistic academic studies; she holds the Master’s degree in
Arts and Multimedia at University of Genova, DAMS -
Discipline delle Arti, della Musica e dello Spettacolo, with a
thesis about the importance of the body concept in the art of
XX s (in particular in the Pina Bausch Tanztheater, in Pippo
Delbono’s and Societas Raffaello Sanzio’s theatre and in the
body art).
Laura Vincze.
Laura Vincze was born on April 8th, 1982 in Cluj-Napoca,
Romania. She is a PhD student in Linguistics, University of
Pisa. Her research interests include multimodal
communication, persuasion (non verbal and verbal strategies)
in political discourse. She recently concluded a research
period at the Faculty of Humanities, University of Amsterdam
where she focused on the pragma-dialectical approach to
argumentation.
In 2008 Laura held a seminar at the University of RomaTre on analysis of non
verbal signals of agreement/disagreement and dominance/submission in
political debates.
Manoj .K. Rajagopal
Manoj kumar Rajagopal was born on February 9 , 1982 in
Mettur Dam , India. He is currently working on PhD project
supervised by Dr.Patrick Horain ,Telecom ,Sudparis ,France
and Dr.Catherine Pelachaud , Telecom Paristech , France.
His research interest are Machine Learning , Communicative gestures and
Human Computer interaction. Presently he is working on style parameters for
the human communicative gestures also to develop an avatar for the gestures
communication of different style using GRETA.
Proceedings of the 5th International Summer Workshop on Multimodal Interfaces - eNTERFACE'09
77

Stella Paschalidou
Stella Paschalidou was born in Thessaloniki in 1977. She
holds a BSc in Physics (Aristotle Univ. Thessaloniki) and an
MSc in Music Technology (Univ. of York). She has been
working since 2004 as a teaching assistant at the TEI of Crete,
dept. of Music Technology&Acoustics and has worked in the
Telecommunications private sector in the past.
Her main interests include multimodal interactive systems for musical
applications and real-time analysis of expressive content, especially in orally
transmitted music traditions
Gualtiero Volpe.
Gualtiero Volpe, Genova, 24-03-1974, PhD, computer
engineer. He is assistant professor at University of Genova.
His research interests include intelligent and affective human-
machine interaction, modeling and real-time analysis and
synthesis of expressive content in music and dance,
multimodal interactive systems.
He was Chairman of V Intl Gesture Workshop and Guest Editor of a special
issue of Journal of New Music Research on “Expressive Gesture in
Performing Arts and New Media” in 2005. He was co-chair of NIME 2008
(New Interfaces for Musical Expression), Genova, 2008. Dr. Volpe is member
of the Board of Directors of AIMI (Italian Association for Musical
Informatics).
Proceedings of the 5th International Summer Workshop on Multimodal Interfaces - eNTERFACE'09
78

AVLaughterCycle: An audiovisual laughing machine
Jerome Urbain1, Elisabetta Bevacqua2, Thierry Dutoit1, Alexis Moinet1, Radoslaw Niewiadomski2,
Catherine Pelachaud2, Benjamin Picart1, Joelle Tilmanne1, and Johannes Wagner3
1TCTS Lab, Faculte Polytechnique, Universite de Mons, Boulevard Dolez 31, 7000 Mons, Belgium2CNRS - LTCI UMR 5141, Institut TELECOM - TELECOM ParisTech, 46 rue Barrault, 75013 Paris, France
3Institut fur Informatik, Universitat Augsburg, Universitatsstr. 6a, 86159 Augsburg, Germany
Abstract—The AVLaughterCycle project aims at developing anaudiovisual laughing machine, capable of recording the laughterof a user and to respond to it with a machine-generated laughterlinked with the input laughter. During the project, an audiovisuallaughter database was recorded, including facial points tracking,thanks to the Smart Sensor Integration software developed bythe University of Augsburg. This tool is also used to extractaudio features, which are sent to a module called MediaCycle,evaluating similarities between a query input and the files in agiven database. MediaCycle outputs a link to the most similarlaughter, sent to Greta, an Embodied Conversational Agent,who displays the facial animation corresponding to the laughtersimultaneously with the audio laughter playing.
Index Terms—laughter, virtual agent, speech processing.
I. INTRODUCTION
LAUGHTER is an essential signal in human communi-
cations. It conveys information about our feelings and
helps to cheer up our mood. Moreover, it is communicative,
eases social contacts and has the potential to elicit emotions
to its listeners. Laughter is also known to have healthy effects,
and especially to be one of the best medicines against stress.
Laughter therapies, “yoga” sessions or groups are emerging
everywhere. Events connecting and entertaining people from
all over the world through the universal signal of laughter are
also successful, like the World Laughter Day or the Skype
Laughter Chain [1].
In addition, the recent technological progress made the
creation of a humanoid interface to computer systems possible.
An Embodied Conversational Agent (ECA) is a computer-
generated animated character that is able to carry on natural,
human-like communication with users. In the last twenty
years several ECA architectures were developed both by the
research community (e.g. [2], [3]) and the industry (e.g.
[4], [5]). Recent works focus on standardisation of the ECA
architecture. SAIBA [6] is an international research initiative
which main aim is to define a standard framework for the
generation of virtual agent behaviour. It defines a number of
levels of abstraction, from the computation of the agent’s com-
municative intention, to behaviour planning and realization.
There exist several implementations of the SAIBA standard,
among others SmartBody [7], [8], BMLRealizer [9], RealActor
[10] and EMBR [11].
Due to the growing interest for virtual machines modeling
human behaviors, a need to enable these machines to perceive
and express emotions emerged. Laughter is clearly an impor-
tant clue for understanding emotions and discourse events on
one hand, and, on the other hand, to manifest certain emotions
and provide feedback to the conversational partners. In conse-
quence, automatic laughter processing has gained in popularity
during the last decades. However, laughter is a highly variable
signal and it is hard to acoustically describe its structure.
Trouvain [12] summarizes the different terminologies used
in other laughter studies, as well as various categories to
designate laughter types. If a few systems able to distinguish
between laughter and speech have recently been built on the
recognition side (e.g. [13], [14], [15]), automatic laughter
synthesis is still inefficient. Interesting approaches have been
explored to generate human-like laughters (e.g. [16], [17]), but
perceptive tests have shown that the resulting laughters do not
sound natural. They miss an important characteristic of human
laughters: variability.
The AVLaughterCycle project aims at developing an au-
diovisual laughing machine, capable of recording the laughter
of a user and to respond to it with a virtual agent’s laughter
linked with the input laughter. The hope is that the initially
forced laughter of the user will progressively turn into spon-
taneous laughter. This system will help improving emotional
displays of virtual agents, and will, by itself, be an interactive
application to enjoy the benefits of laughter. The virtual agent,
Greta [18], will not display synthesized laughter: on the audio
side, she will play an appropriately selected laughter inside an
audiovisual database, and simultaneously on the visual side,
she will be animated using the facial data of the selected
laughter, obtained through motion capture.
The paper will be organized as follows. Chapter II will
present the softwares used during this project: Smart Sensor
Integration for recording/annotating/analyzing laughters, Me-
diaCycle to evaluate similarities between laughters, Greta for
playing the output laughter and the commercial softwares to
perform motion capture, ZignTrack and OptiTrack. Chapter III
will focus on the creation and annotation of the audiovisual
laughter database, inside which utterances are selected to
animate Greta. The AVLaughterCycle application process and
its methods for analyzing the input laughter, selecting an
answering laughter and driving Greta accordingly will be
described in Chapter IV. The upcoming evaluation of the
system will be discussed in Chapter V. Finally, conclusions
and future works will be presented in Chapter VI.
Proceedings of the 5th International Summer Workshop on Multimodal Interfaces - eNTERFACE'09
79

II. PRESENTATION OF THE TOOLS
Several important existing tools have been used in this
project, as such or modified to fit our needs. In this Chapter,
these tools will be presented separately. Their integration in
the whole project will be described in Chapters III and IV.
A. Smart Sensor Integration (SSI)
Smart Sensor Integration (SSI) [19] is a software designed
by the University of Augsburg to deal with multimodal sig-
nal recording and processing. It provides a Graphical User
Interface (GUI) to start and stop a recording. Afterwards
the recorded data can be visualized and annotated. Given
an annotation it is possible to automatically extract features
and train a model. The different modalities are automatically
synchronized.
The GUI includes a dedicated space to present stimuli,
which is useful for database recordings. The stimuli are
presented via HTML pages automatically managed by the
SSI application. Browsing through successive HTML pages
supports two different modes: clicks by users or automatic
page switch either after a predefined time or after a certain
number of events detected in the recorded data (e.g. a certain
number of laughs). As well as recording the data, SSI stores
the stimuli sequence.
SSI integrates signal processing libraries. Recorded signals
can be analyzed in real-time or offline. Features are defined
in a Dynamic Link Library used by the SSI GUI. Every kind
of signal processing algorithm can be implemented there. One
can also define “triggers”: functions that decide whether or
not a signal segment should be further processed; for example,
employing a Voice Activity Detection on an audio input to only
process parts of the signal(s) where there is vocal activity.
Using the triggers, SSI pre-segments the data. Pre-labels
can be assigned to the segments via the HTML stimuli
manager: when, for example, a funny stimuli is presented and
laughters are expected, we can specify to assign a “laughter”
label to every segment that respects the trigger conditions.
The SSI GUI enables to further annotate the recordings by
adding/removing segments, refining their boundaries or change
their labels.
Once data is annotated, classifiers may be trained to model
the feature distributions of the different classes. SSI pro-
vides classifiers implemented in the Torch3D library: Hidden-
Markov Models (HMMs), Gaussian Mixture Models (GMMs),
k-Nearest Neighbours (kNNs), etc. The trained classifiers can
be used to label new data (in real-time or not) and can also
serve as triggers in the SSI processing chain.
To summarize, SSI provides convenient methods for mul-
timodal database recordings, annotation, classification and
processing. The different aspects are used in AVLaughterCycle
and SSI is integrated in the system architecture. This first inte-
gration already provides satisfying results, but will also enable
us to improve the AVLaughterCycle application by exploiting
more of the SSI processing and classification capabilities in
the future.
B. MediaCycle
MediaCycle is a software developed at the University of
Mons and the Universite Catholique de Louvain for browsing
through multimedia libraries, in the Framework of NUMEDI-
ART Belgian R&D program (www.numediart.org). It started
by considering acoustic similarities only, in a project called
AudioCycle [20], designed to ease the navigation inside a
large audio loops libraries. The software computes acoustic
features - characterizing musical properties of rhythm, melody
and timbre - for each file in an audio loop database and then
evaluates the similarities between loops through the distances
between their feature vectors. A Graphical User Interface has
also been designed to visualize the database: loops are grouped
into clusters through a K-means algorithm; a reference loop
is randomly selected and other loops are positioned around it
according to their cluster belonging and similarities with the
reference loop. This is illustrated in Figure 1. Tools to easily
browse through the library are available such as playing any
combination of loops, which are synchronized, reorganizing
the database by selecting a new reference loop or changing
the features weights, splitting again one cluster, etc.
AudioCycle has been extended to deal with visual content
in a project called MediaCycle where image features where
added. Methods for computing similarities between videos are
also progressively implemented, as well as dedicated methods
to process laughter, which received a particular attention in
another subproject called LaughterCycle. The system can also
be queried by laughing: it then places the incoming laughter in
the database space and outputs the N most similar utterances.
In this project, the visual database organization provided by
MediaCycle will not be used since the visual output is per-
formed by Greta. Only the MediaCycle engines for organizing
a database and computing similarities between objects will be
integrated in AVLaughterCycle.
Fig. 1. AudioCycle Database visualization
C. Motion Capture
Motion capture (often referred to as “mocap”) consists in
recording a real motion by transcribing it under a mathematical
form usable by a computer. This is achieved by tracking a
number of key points through space across time, and com-
bining them to obtain a tridimensional unified representation
Proceedings of the 5th International Summer Workshop on Multimodal Interfaces - eNTERFACE'09
80

Fig. 2. ZignTrack - 22 markers on the subject’s face
of the performance [21]. Several techniques can be used for
motion capture, but when it comes to facial motion capture,
only techniques that do not need intrusive equipment nor large
markers can be considered.
Facial motion capture can be divided into two main types:
marker and markerless techniques. While markerless tech-
niques have the huge advantage that they can usually be per-
formed on facial videos recorded without any specific setup,
they are nowadays not robust enough to ensure automatic and
reliable capture of the small variations of facial expression
during laughter for instance. Using markers placed on the face
eases the tracking and increases its robustness. However, the
recording must then be performed in an unnatural setting, and
very often with dedicated equipment and quite heavy setups.
In this project it was chosen to record our database using
marker based tracking, in order to obtain data with as much
precision and information as possible. Two different commer-
cial motion capture tools, ZignTrack and OptiTrack, have been
tested and used. They are presented below.
• ZignTrack [22] is the first software we used. It captures
3D facial motion with one single camera. It requires 22
facial features, marked with simple stickers or make-up
(no special markers or infrared equipment required), as
illustrated in Figure 2. They must be not too small, to be
obvious on the video, nor too big, to track accurately the
face features. ZignTrack handles head rotation, jaw/lip-
syncing, eyebrows, eyelids sneer and cheek movements.
As the subject is recorded with one single camera placed
in front of him, the markers are actually tracked in
a two dimensional space only, and the 3D points are
extrapolated by the software using a fixed face template.
The transformations linked to the head displacements and
rotations are not all perfectly handled by the software, as
we noticed for instance that the face was “shrinking” or
“inflating” when there were up and down rotations of the
head.
Once the recording is over, the video is imported into
ZignTrack, the face markers are manually linked to a
template on the first video frame, and the tracking of
those markers is then automatically performed. In case
of tracking errors, manual tuning of each marker position
can be performed to adjust/correct the automatic tracking.
Once the tracking is done, ZignTrack extrapolates the
3D positions of the tracked face points. The resulting
motion capture data can then be exported to several
motion capture formats: BVH, TRC, Poser pz2 and
Animation:Master action files. The ZignTrack software
costs around 130 euros.
• OptiTrack [23] is an Optical Motion Capture solution
developed by Natural Point. Our seven-cameras face
motion tracking desktop setup is shown in Figure 3 (the
positions of the 7 cameras are marked by a red circle).
Fig. 3. Desktop setup for facial motion tracking using OptiTrack
The seven synchronized infrared cameras are placed in
a semi-circular way: six for face motion capture and a
middle additional one for scene A/V recording (recording
synchronized audio and video tracks for each take). For
each of them, a grayscale CMOS imager captures up to
100 frames per second.
OptiTrack requires at least 23 face markers and 4 head
markers on the actor (Figure 4). These markers are
infrared reflectors sticked on the skin, smaller than the
white make-up dots of the ZignTrack device. Therefore
they provide a very accurate and robust (versus head
movements) face tracking using OptiTrack Arena Facial
Expression software. The results can be exported to
various formats such as BVH and C3D.
The whole OptiTrack desktop setup is much more ex-
pensive than ZignTrack, and costs around 5000 euros.
OptiTrack is not limited to face motion tracking but can
be upgraded to cover full body motion tracking, by adding
more cameras and sensors.
D. The 3D humanoid agent: Greta
Greta [18] (Figure 5) is a 3D humanoid agent developed
by Telecom-ParisTech. She is able to communicate with the
user using verbal and nonverbal channels like gaze, facial
expressions and gestures. It follows the SAIBA framework
[6] that defines a modular structure, functionalities and com-
munication protocols for Embodied Conversational Agents
(ECAs). Moreover, Greta follows the MPEG4 [24] standard of
animation. Greta uses the FML-APML XML-language [25] to
specify the agent’s communicative intentions (e.g., its beliefs,
Proceedings of the 5th International Summer Workshop on Multimodal Interfaces - eNTERFACE'09
81

Fig. 4. OptiTrack - 23 face markers and 4 head markers on the subject
emotions) that go along with what the agent wants to say.
The communicative intentions of the listener are generated
by the Listener Intent Planner while the intentions of the
speaker are defined at the moment manually in an FML-
APML input file. The Behavior Planner module receives as
input the agent’s communicative intentions written in FML-
APML and generates as output a list of signals in BML
language. BML specifies the verbal and nonverbal behaviors
of the agent [6]. Each BML tag corresponds to a behavior the
agent has to produce on a given modality: head, torso, face,
gaze, gesture, speech. These signals are sent to the Behavior
Realizer that generates the MPEG4 FAP-BAP files. Finally, the
animation is played in the FAP-BAP Player. All modules in
the Greta architecture are synchronized using a central clock
and communicate with each other through a whiteboard. For
this purpose we use Psyclone messaging system [26] which
allows modules and applications to interact through TCP/IP.
The system has a very low latency time that makes it suitable
for interactive applications.
Fig. 5. Greta, the 3D humanoid agent used in AVLaughterCycle
III. CREATION OF AN AV LAUGHTER CORPUS
The first step of the AVLaughterCycle project is the record-
ing of an audiovisual (AV) database consisting of humans
laughing. Participants of the eNTERFACE09 workshop who
wanted to contribute to this experiment were invited to laugh in
front of the set of cameras. This Chapter is intended to describe
the laughter database. It is divided in 7 sections presenting: the
selection of stimuli and instructions given to the participants
(Section III-A), the settings for audiovisual recording (Section
III-B) and facial motion capture (Sections III-C and III-D),
the corpus annotation protocol (Section III-E), the participants
(Section III-F) and, finally, the database contents (Section
III-G).
A. Elicitation method: selection of stimuli, protocol of DB
recording
It is known that there is a difference between the expressions
of real and acted emotions (e.g. [27]). To collect a corpus
representative of humans’ natural behaviours, one should try
to capture the data in a natural environment, the subjects
being unaware of the database collection until the end of
the recording. Laughter being an emotional signal, it is af-
fected by the same phonomenon: one cannot expect natural
laughter utterances by simply asking subjects to laugh. To
find spontaneous laughter utterances, it is popular to take the
laughters recorded while collecting data for another purpose.
For example, [13], [14] and [28] use the ICSI Meeting Corpus
[29], recorded for studying speech in general by placing
microphones in meeting rooms. Apart from speech, this corpus
contains a significant number of laughters, which are assumed
spontaneous since they occurr in regular conversations (even
though the participants knew there were microphones). When
for some reason natural data cannot be used, it is common to
try to induce laughter - and not tell laughter is the object of
the study - rather than asking to laugh. One way to achieve it
is to display a funny movie.
In our case, both audio recording and accurate facial motion
tracking were needed. To our knowledge, there existed no
laughter database providing these 2 signals. Due to the markers
required for facial motion tracking and the fact that subjects
should stay in the camera(s) space, a natural laughter recording
was impossible. To push the participants towards spontaneous
laughter, even though they knew that they were being recorded,
a 13-minutes funny movie was created by the concatenation
of short videos found on the internet. The participants were
asked to relax, watch the video and enjoy it. They could close
their eyes, move a bit their head but should keep it towards the
camera during the whole recording. Moreover, they could not
put anything between their head and the webcam (e.g. hands),
else the face tracking is lost. Except these two limitations,
they could act freely, talk, laugh, cry, shake their head,
etc. as they would do if they were at home. At the end
of the experiment, subjects were instructed to perform one
acted laughter, prentending thay had just heard/seen something
hilarious.
B. Audiovisual (AV) laughter database recording
The AV laughter database was recorded on site (Casa
Paganini, Genova, Italy), using one webcam (ZignTrack) plus
seven infrared cameras (OptiTrack) for video recording, a
Proceedings of the 5th International Summer Workshop on Multimodal Interfaces - eNTERFACE'09
82

headset for audio recording (16 kHz, 16 bits/sample) and
stimuli listening, and University of Augsburg’s Smart Sensor
Integration tool (SSI) for stimuli playing and audio/video
recording synchronization (and later for recordings annota-
tion). All these components have already been described in
Chapter II.
C. Facial motion capture using ZignTrack
The webcam used has a 640x480 resolution, stores in RGB
24 bits and captures 25 frames per second (FPS). The 22
marker dots were simply made of white make-up (Figure 2).
Another attempt was performed using red markers but the face
tracking failed because of the poor contrast between them and
the skin colour.
ZignTrack is a cheap facial motion capture software, work-
ing quite well with markers that stay visible during the whole
recording and with slow head movements (fuzzy effect due
to the 25 FPS limitation in case of fast head movements).
If at least one of these constraints is not respected, the
tracking fails, requiring heavy manual corrections. This is the
reason why we turned towards a more sophisticated (and more
expensive) system, OptiTrack.
D. Facial Motion Capture using OptiTrack
During this work, the seven-cameras Face Motion Tracking
desktop setup shown in Figure 3 was used. Compared to the
basic OptiTrack system, our setup also includes the webcam
in parallel in order to be able to use the SSI software and keep
all its previously explained advantages. A post-processing is
carried out to synchronize the webcam with the OptiTrack
cameras.
The OptiTrack Arena Facial Expression software performed
very well and provided a more robust tracking than ZignTrack.
Indeed, even if some markers are lost during the tracking (e.g.
too large head rotations), they are nearly always recovered
after a short period of time, thanks to the number of cameras
and points of view (six) as well as to infrared (versus visible
spectrum) acquisition performance. In addition, each individ-
ual marker can also be manually tuned to adjust/correct the
automatic tracking if it does not recover by itself.
However, it seems that recordings longer than 5 minutes are
not always completely saved (the end is sometimes missing).
We thus decided to reduce the 13-minutes funny movie to 10
minutes, and to split it into 3 parts of around 3 minutes each.
E. Database Annotation
The recorded data have been annotated using SSI. A hier-
archical annotation protocol was designed: segments receive
the label of one main class (laughter, breath, verbal, clap,
silence or trash) and “sublabels” can be concatenated to give
further details about the segment. The main objective of the
sublabels is to distinguish between different kinds of laughters,
but still being able to rapidly group subclasses when needed,
for example when only the main classes are relevant. Laughter
sublabels characterize both:
• the laughter temporal structure: following the three seg-
mentation levels presented by Trouvain [12]. These sub-
labels indicate whether the episode (i.e., the full laughter
utterance) contains several bouts (i.e. parts separated by
inhalations), only one, or only one syllable.
• the laughter acoustic contents: through labels referring
to the type of sound: voiced, breathy, nasal, grunt-like,
hum-like, “hiccup-like”, speech-laughs or laughters that
are mostly visual (quasi-silencious).
While only one main class can be assigned to a segment,
sublabels can be combined, for example to indicate that the
laughter episode contains several bouts and that we can find
hiccup-like and voiced ‘a’ parts in it. To cope with exceptional
classes conflicts that might influence the classes models when
training a classifier - for example when we can hear a phone
ringing in the middle of a laughter episode - a ‘discard’ main
class has been added.
The annotation primarily relies on the audio, but the video
is also looked at, to find possible neutral facial expressions
at the episode boundaries or annotate visual-only laughters.
In addition, laughters are often concluded by an audible
inspiration, sometimes several seconds after the laughter main
part. When such an inhalation, obviously due to the preceding
laughter, can be found after the laughter main audible part, it
is included in the laughter segment.
The annotated laughters form our laughter database, inside
which an answering laughter is selected when AVLaughterCy-
cle is queried (see Chapter IV).
F. Participants
24 subjects participated in the database recordings: 8 (3
females, 5 males) with the ZignTrack setting and 16 (6
females, 10 males) with the OptiTrack setting. They came from
various countries: Belgium, France, Italy, UK, Greece, Turkey,
Kazakhstan, India, Canada, USA and South Corea. The male
average age was 28 (standard deviation: 7.1) and the female
average age was 30 (sd: 7.8), which correspond to a global
average age of 29 (sd: 7.3). All the participants gave written
consent to use their data for research purposes.
G. Database contents
Annotation (Section III-E) is still under way, but from
the 20 files that are already fully annotated, preliminary
analyses of the corpus contents can be performed: subjects
spend, in average, 23.5% of the recording laughing, which
is a huge amount of time. The number of laughter episodes
per participant stands around 43.6, with extreme values of
17 and 82, for a total of 871 episodes in these 20 files.
The average duration of a laughter episode is 3.6s (standard
deviation: 5.5s). A histogram of the laughters durations and
their cumulative distribution function is presented in Figure 6.
The large majority (82%) of the laughter episodes lasts less
than 5s, but longer episodes should not be neglected as they
represent 53.5% of the total laughters duration and, above all,
are the most striking ones. The longest giggle in the analyzed
database lasts 82s.
Proceedings of the 5th International Summer Workshop on Multimodal Interfaces - eNTERFACE'09
83

Fig. 6. Histogram and cumulative distribution function of the laughtersdurations
IV. CORPUS BASED AUDIOVISUAL LAUGHTER SYNTHESIS
The communications between the different modules are
illustrated in Figure 7. The dashed arrows refer to the database
building process. In this Chapter, the AVLaughterCycle ap-
plication process will be described (solid arrows). Users can
query the AVLaughterCycle systems in two ways: by sending
a full audio laughter file (offline mode) or in real-time (online
mode), using SSI for recording and real-time processing (with
a trigger to delimit laughter segment boundaries). In both
cases, when the audio laughter segment is available, SSI com-
putes the segment features (see Section IV-A) and sends them
to MediaCycle. MediaCycle compares these features with the
database samples and outputs the most similar example, as
reported in Section IV-B. This output is sent to Greta who
plays the audio sound synchronously with the corresponding
facial animation. To do so, Greta had to be slightly modified.
This will be explained in Sections IV-C and IV-D.
Fig. 7. Flow chart of the AVLaughterCycle application
A. Laughter audio similarity analysis
The labeled laughter segments are all processed by the
MediaCycle tool to compute their similarities and cluster them.
MediaCycle evaluates the similarities by measuring distances
between feature vectors. Features have been based on Peeters’
set [30] and implemented in a C++ library. The features can
be extracted directly in SSI, where the MediaCycle audio
feature extraction library has been integrated, and then sent
to MediaCycle. In the current demo version, we used the
following spectral features:
• 13 Mel-Frequency Cepstral Coefficients (MFCCs), their
deltas and delta-deltas
• The spectral flatness and spectral crest values, each
divided in 4 analysis frequency bands (250Hz to 500Hz,
500Hz to 1000Hz, 100Hz to 2000Hz and 2000Hz to
4000Hz).
• The spectral centroid, spread, skewness and kurtosis
• The loudness, sharpness and spread, computed on the
Bark frequency scale
• The spectral slope, decrease, roll-off and the spectral
variation
In addition, 2 temporal features were used: the energy and the
zero-crossing rate. In total, 60 features were extracted for each
frame of 213ms, with 160ms overlap. The similarity estimation
requires comparing audio segments of different lengths, hence
different numbers of frames. To obtain a constant features
vector size, we decided to store only the mean and standard
deviation of each feature over the whole segment. More com-
plex models could be investigated but this simple transform
already provides promising results. It had been successfully
used in other similarity computation contexts [20] and was
assumed applicable to laughter timbre characterization.
Euclidian distance between feature vectors is used to com-
pute the dissimilarity between laughter episodes. For the
moment, the similarity analysis involves only audio timbre
features. It is planned to include audio rhythmic features, for
which most of the algorithms are available in MediaCycle
but processing of some exceptional cases should be improved
to avoid unexpected behaviours in uncontrolled conditions
(real-time use). Furthermore, visual features could be added
to the similarity measures in the future, to take an audio-
visual similarity decision. MediaCycle provides image/video
feature extraction methods that could be used. Furthermore,
the weighting of the different feature sets can be defined and
modified in real-time by the user, to put the focus more on
audio rhythm or video features, for instance.
B. Answering laughter selection
When AVLaughterCycle is queried, the input laughter is
analyzed and his feature vector is computed. This vector is
used to select a corresponding answering laughter inside the
laughter database organized by MediaCycle. In this project, it
was decided to output the closest (i.e. most similar according
to our feature set) laughter from the input laughter. Doing
this way, the system can be employed to search inside the
database for a specific kind of laughter. However, other
selection processes can be imagined to enhance a laughter
interaction: the natural way of joining somebody laughing
is probably not to mimic him. Further research could be
made on humans’ laughter interactions to determine how
Proceedings of the 5th International Summer Workshop on Multimodal Interfaces - eNTERFACE'09
84

we join laughing partners, model it and integrate that into
MediaCycle’s best answering laughter selection.
C. Visual Replay
The data from the motion capture softwares contain, for
each frame, the position of each marker in the 3D space. Thus
values for face are influenced by head rotations and body
movements. First of all, these movements, used to animate
Greta’s general posture (with BAPs), were separated from
the facial movements. Noise caused by the technical flaw of
the capturing hardware was also removed. Such a data was
used to animate Greta agent that uses MPEG-4 standard of
animation. In this standard, the face model is animated by
using 66 points called FAPs. Each of them deforms one region
of the face in one direction (i.e. horizontal or vertical). Two
different mappings were created to map the motion capture
data, coming from ZignTrack or OptiTrack, to FAPs standard.
Unfortunately many FAP points do not correspond to any
marker. Thus it was not possible to use simple one-to-one
mapping. For several FAPs, linear combinations of several
markers values and weights were defined. Last but not least the
motion capture data stored in the laughter database correspond
to different face geometries of different subjects while our
virtual agent uses only one face geometry model. Thus the
captured movements of different persons (e.g. widely open
mouth) had to be adapted to Greta’s model. For this propose
the mappings can be parameterized to cover the inter-personal
variability.
D. GRETA is playing the analyzed facial signals from trig-
gered AV laughter selected from the database
For the AVLaughterCycle application, Greta underwent
certain modifications. Greta’s behaviour is usually defined
in BML language. It specifies the verbal and nonverbal
behaviours of the agent. Each BML tag corresponds to a
behaviour the agent produces on one modality: head, torso,
face, gaze, gesture, speech. Single nonverbal behaviours are
defined using high level symbolic representation. On the other
side our laughter database contains the precise, frame-by-
frame descriptions of partial animations (i.e. only the face)
in FAP format.
In this project, the default BML syntax was extended to
allow mixing (high level) BML commands with (low level)
FAPs description and we modified Greta’s animation engine
to be able to generate a smooth animation for such a mixed
content. Consequently Greta may display a laughter animation
using the data from the laughter corpus which is accompanied
by an audio file and other nonverbal signals that might be
specified in BML language (like gestures, or other facial
expressions). Greta was integrated in the AVLaughterCycle
architecture using Psyclone and BML commands. It allows
for immediate visualization of audiovisual response to user’s
detected laughter.
V. EVALUATION OF LAUGHTER SYNTHESIS BASED ON
LAUGHTER SIMILARITY
In order to assess the validity and efficiency of the developed
laughter analysis and synthesis chain, an evaluation study will
be carried out. The objective is to measure the similarity of
the audio answer as well as the improvement brought by the
visual display. The protocol will be the following.
To assess the similarity algorithm, subjects will be presented
laughters by pairs and will be asked to rate their similarities
on a Likert scale (1 to 7). The laughter pairs will be formed
the following way: an input laughter will be selected to
query the MediaCycle device, which will output 3 laughters:
the most similar one, the least similar one and an average
distance laughter; three pairs will then be constituted, each
one gathering the input laughter (unmodified) and one of the
MediaCycle outputted laughters. The same process will be
repeated with a number (at least 10) of input laughters and
the pairs will be randomly ordered for each subject.
To measure the improvement brought by the visual display,
three different conditions will be tested: using audio only,
using video only and combining both modalities. When video
is used, it consists in a Greta animation driven by the cor-
responding laughter facial animation. Due to the number of
pairs to compare, it is planned to have 3 sets of subjects and
assigning each group to only one modality. At least 10 subjects
will be needed in each group.
Mixed Anova tests will be performed to evaluate whether
the most similar output of MediaCycle is indeed perceived
as closer from the input laughter than the 2 other inputs
(least similar and average distance) as well as looking to the
differences across conditions.
VI. CONCLUSION
AVLaughterCycle, a software for real-time recording of
laughter and playing of an acoustically similar laughter by
an Embodied Conversational Agent, has been presented. The
main deliverables of the project are the large audiovisual
laughter database, that will be released fully annotated, and
the integration of several different modules into one single
processing chain to implement all the steps from laughter
recording to similar output playing. Several issues were en-
countered during the project. We can cite communication bugs
between SSI and MediaCycle, difficulties of automatic Facial
Tracking during laughter or mapping from Motion Capture
Data to Greta animation. Solutions were proposed for these
issues during the project. Demos shown encouraging results
but also revealed some lack of robustness in the similarity
computation, which is the main focus for future developments.
An evaluation of the device will be carried out in order to
numerically characterize its efficiency. Means to automatize or
ease the mapping between the motion capture data and Greta’s
animation will also be investigated. Other suggested future
works include voice/character conversion (to avoid having
one single agent laughing with different voices), integration
of visual features in the similarity computation and building
models to not only reproduce but synthesize laughter, as well
as to imitate how humans respond to conversational partners’
laughters.
ACKNOWLEDGMENTS
The authors would like to thank all the eNTERFACE’09
attendants who participated in the creation of the database.
Proceedings of the 5th International Summer Workshop on Multimodal Interfaces - eNTERFACE'09
85

This project was partly funded by the Ministry of Region
Wallonne under the Numediart research program (grant
N0716631) and by the European IP 6 project Callas.
J.Tilmanne receives a PhD grant from the Fonds de la
Recherche pour l’Industrie et l’Agriculture (F.R.I.A.), Bel-
gium.
REFERENCES
[1] Skype Communications S. a r. l., “The skype laughter chain,”http://www.skypelaughterchain.com/, Consulted on January 22,2009.
[2] J. Cassell, T. Bickmore, M. Billinghurst, L. Campbell, K. Chang,H. Vilhjlmsson, and H. Yan., “Embodiment in conversational interfaces:Rea,” In CHI, April 15-20 1999.
[3] S. Kopp, B. Jung, N. Leßmann, and I. Wachsmuth, “Max - a multimodalassistant in virtual reality construction,” KI, vol. 17, no. 4, pp. 11–18,2003.
[4] Cantoche, http://www.cantoche.com/.
[5] Haptek, http://www.haptek.com/.
[6] H. Vilhjalmsson, N. Cantelmo, J. Cassell, N. E. Chafai, M. Kipp,S. Kopp, M. Mancini, S. Marsella, A. N. Marshall, C. Pelachaud,Z. Ruttkay, K. R. Thrisson, H. van Welbergen, and R. van der Werf, “Thebehavior markup language: Recent developments and challenges,” in 7th
International Conference on Intelligent Virtual Agents, Paris, France,September 2007.
[7] J. Lee and S. Marsella, “Nonverbal behavior generator for embodiedconversational agents,” in Proceedings of 6th International Conference
on Intelligent Virtual Agents, ser. LNCS, vol. 4133. Marina Del Rey,CA, USA: Springer, 2006, pp. 243–255.
[8] M. Thiebaux, S. Marsella, A. Marshall, and M. Kallmann, “SmartBody:behavior realization for embodied conversational agents.” in Proceedings
of 7th Conference on Autonomous Agents and Multi-Agent Systems,2008, pp. 151–158.
[9] B. Arnason and A. Porsteinsson, “The CADIA BML realizer,”http://cadia.ru.is/projects/bmlr/.
[10] A. Cerekovic, T. Pejsa, and I. S. Pandzic, “Realactor: Character anima-tion and multimodal behavior realization system,” ser. Lecture Notesin Computer Science, Z. Ruttkay, M. Kipp, A. Nijholt, and H. H.Vilhjalmsson, Eds., vol. 5773. Springer, 2009, pp. 486–487.
[11] A. Heloir and M. Kipp, “EMBR - a realtime animation engine forinteractive embodied agents,” ser. Lecture Notes in Computer Science,Z. Ruttkay, M. Kipp, A. Nijholt, and H. H. Vilhjalmsson, Eds., vol.5773. Springer, 2009, pp. 393–404.
[12] J. Trouvain, “Segmenting phonetic units in laughter,” in Proceedings of
the 15th International Congress of Phonetic Sciences, Barcelona, Spain,August 2003, pp. 2793–2796.
[13] K. P. Truong and D. A. van Leeuwen, “Automatic discriminationbetween laughter and speech,” Speech Communication, vol. 49, pp. 144–158, 2007.
[14] M. T. Knox and N. Mirghafori, “Automatic laughter detection using neu-ral networks,” in Proceedings of Interspeech 2007, Antwerp, Belgium,August 2007, pp. 2973–2976.
[15] S. Petridis and M. Pantic, “Is this joke really funny? judging the mirth byaudiovisual laughter analysis,” in Proceedings of the IEEE International
Conference on Multimedia and Expo, New York, USA, June 2009, pp.1444–1447.
[16] E. Lasarcyk and J. Trouvain, “Imitating conversational laughter with anarticulatory speech synthesis,” in Proceedings of the Interdisciplinary
Workshop on The Phonetics of Laughter, August 2007, pp. 43–48.
[17] S. Sundaram and S. Narayanan, “Automatic acoustic synthesis of human-like laughter,” in Journal of the Acoustical Society of America, vol. 121,no. 1, January 2007, pp. 527–535.
[18] R. Niewiadomski, E. Bevacqua, M. Mancini, and C. Pelachaud, “Greta:an interactive expressive eca system,” C. Sierra, C. Castelfranchi, K. S.Decker, and J. S. Sichman, Eds. IFAAMAS, 2009, pp. 1399–1400.
[19] J. Wagner, E. Andre, and F. Jung, “Smart sensor integration: A frame-work for multimodal emotion recognition in real-time,” in Affective
Computing and Intelligent Interaction (ACII 2009), 2009.
[20] S. Dupont, T. Dubuisson, J. Urbain, C. Frisson, R. Sebbe, andN. D’Alessandro, “Audiocycle : Browsing musical loop libraries,”in Proc. of IEEE Content Based Multimedia Indexing Conference
(CBMI09), June 2009.
[21] A. Menache, Understanding motion Capture for Computer Animation
and Video Games. San Francisco, CA, USA: Morgan KauffmanPublishers Inc., 1999.
[22] Zign Creations, “Zign track - the affordable facial motion capturesolution,” http://www.zigncreations.com/zigntrack.html, Consulted onOctober 20, 2009.
[23] Natural Point, Inc., “Optitrack - optical motion tracking solutions,”http://www.naturalpoint.com/optitrack/, Consulted on October 20, 2009.
[24] J. Ostermann, MPEG-4 Facial Animation - The Standard Implementation
and Applications, Wiley, England, 2002, ch. Face Animation in MPEG-4, pp. 17–55.
[25] D. Heylen, S. Kopp, S. Marsella, C. Pelachaud, and H. Vilhjalmsson,“Why conversational agents do what they do? Functional representationsfor generating conversational agent behavior,” in The First Functional
Markup Language Workshop, Estoril, Portugal, 2008.[26] K. R. Thrisson, T. List, C. Pennock, and J. DiPirro, “Whiteboards:
Scheduling blackboards for interactive robots,” in Twentieth National
Conference on Artificial Intelligence, 2005.[27] J. Wilting, E. Krahmer, and M. Swerts, “Real vs. acted emotional
speech,” in Proceedings of the Ninth International Conference on Spoken
Language Processing (Interspeech 2006 ICSLP), Pittsburgh, USA,September 2009, pp. 805–808.
[28] L. Kennedy and D. Ellis, “Laughter detection in meetings,” in NIST
ICASSP 2004 Meeting Recognition Workshop, Montreal, May 2004.[29] A. Janin, D. Baron, J. Edwards, D. Ellis, D. Gelbart, N. Morgan,
B. Peskin, T. Pfau, E. Shriberg, A. Stolcke, and C. Wooters, “TheICSI Meeting Corpus,” in 2003 IEEE International Conference on
Acoustics, Speech, and Signal Processing (ICASSP), Hong-Kong, April2003.
[30] G. Peeters, “A large set of audio features for sound description (similarityand classification) in the cuidado project,” Tech. Rep.
Elisabetta Bevacqua is a post-doc at the Telecom ParisTech. She obtainedher PhD at the University Paris 8 in 2009 and her Master in Computer Scienceat the University of Rome “La Sapienza” in 2002. Her main research interestis on the creation of embodied conversational agents, computer animation,co-articulation model for ECA, listener model.
Thierry Dutoit graduated as an electrical engineer and Ph.D. in 1988 and1993 from the Faculte Polytechnique de Mons, Belgium, where he is now afull professor. He spent 16 months as a consultant for AT&T Labs Researchin Murray Hill and Florham Park, NJ, from July, 1996 to September, 1998.He is the author of three books on speech processing, text-to-speech synthesisand signal processing, and the coordinator of the MBROLA project for freemultilingual speech synthesis. T. Dutoit was an Associate Editor of the IEEETransactions on Speech and Audio Processing (2004-2006) and a memberof the INTERSPEECH’07 organization committee. He was the initiator ofeNTERFACE workshops and the organizer of eNTERFACE’05. He also isthe scientific coordinator of the Belgian NUMEDIART research program(www.numediart.org) for media art technologies.
Alexis Moinet holds an Electrical Engineering degree from the FPMs (2005).He did his master thesis at the T.J. Watson research Center of IBM (2005).He is currently working as a PhD student in the Signal Processing Lab of theFPMs. He is particularly interested in audio, speech and music processing.
Radoslaw Niewiadomski received the PhD degree in Computer Science in2006 from the Universita degli Studi di Perugia, Italy. Currently he is apost-doc at the Telecom ParisTech. His research interests include nonverbalcommunication and expressions of emotions by an ECA.
Proceedings of the 5th International Summer Workshop on Multimodal Interfaces - eNTERFACE'09
86

Catherine Pelachaud is a Director of Research at CNRS in the laboratoryLTCI, TELECOM ParisTech. She received her PhD in Computer Graphicsat the University of Pennsylvania, Philadelphia, USA in 1991. Her researchinterest includes representation language for agent, embodied conversationalagent, nonverbal communication (face, gaze, and gesture), expressive behav-iors and multimodal interfaces. She has been involved in several Europeanprojects related to multimodal communication (EAGLES, IST-ISLE) and tobelievable embodied conversational agents (IST-MagiCster). She participatedto the Network of Excellence HUMAINE and coordinates the workpackageentitled emotion in interaction. She is currently participating to the STREPSAMAINE, IP CALLAS and NoE SSPNet projects.
Benjamin Picart graduated as an electrical engineer (Telecoms & Multime-dia) from the Faculte Polytechnique de Mons (FPMs), Belgium, in 2009. Heperformed his Master Thesis within Idiap Research Institute (Switzerland) inthe field of Automatic Speech Recognition. His research interests focus onsignal processing theory and its applications to speech processing.
Joelle Tilmanne holds an Electrical Engineering degree from the FacultePolytechnique de Mons (Belgium) since June 2006. She did her master thesisin the field of sleep signals analysis, at Lehigh University (USA). She ispursuing a PhD thesis in the TCTS (Circuit Theory and Signal Processing) Labof FPMs since september 2006, in the field of HMM based motion synthesis.
Jerome Urbain graduated as an electrical engineer from the Faculte Polytech-nique de Mons (FPMs), Belgium, in 2006. He is currently PhD student at theSignal Processing and Circuit Theory (TCTS) Lab of the same University,working on speech processing in the framework of FP6 IP CALLAS. Heis focusing on the acoustic aspects of laughter modeling, synthesis andrecognition.
Johannes Wagner graduated as a Master of Science in Informatics andMultimedia from the University of Augsburg, Germany, in 2007. He iscurrently PhD student at chair for Multimedia Concepts and ApplicationsLab of the same University, working on multimodal signal processing inthe framework of FP6 IP CALLAS. He is currently developing a generalframework for the integration of multiple sensors into multimedia applicationscalled Smart Sensor Integration (SSI).
Proceedings of the 5th International Summer Workshop on Multimodal Interfaces - eNTERFACE'09
87
