procedure for selecting key performance indicators for
TRANSCRIPT
ASME Journal of Manufacturing Science and Engineering
1
Procedure for Selecting Key Performance Indicators for Sustainable Manufacturing Deogratias Kibira Morgan State University Baltimore, MD, USA [email protected] Michael P. Brundage National Institute of Standards and Technology Gaithersburg, MD, USA [email protected] ASME Member Shaw Feng1 National Institute of Standards and Technology Gaithersburg, MD, USA [email protected] KC Morris National Institute of Standards and Technology Gaithersburg, MD, USA [email protected] ABSTRACT
The need for an open, inclusive, and neutral procedure in selecting key performance indicators (KPIs) for
sustainable manufacturing has been increasing. The reason is that manufacturers seek to determine what
to measure to improve environmental sustainability of their products and manufacturing processes. A
difficulty arises in understanding and selecting specific indicators from many stand-alone indicator sets
available. This paper presents a procedure for individual manufacturers to select KPIs for measuring,
monitoring and improving environmental aspects of manufacturing processes. The procedure is the basis
for a guideline, being proposed for standardization within ASTM International. That guide can be used for
(1) identifying candidate KPIs from existing sources, (2) defining new candidate KPIs, (3) selecting
1 Corresponding author: [email protected]

ASME Journal of Manufacturing Science and Engineering
2
appropriate KPIs based on KPI criteria, and (4) composing the selected KPIs with assigned weights into a
set. The paper explains how the developed procedure complements existing indicator sets and
sustainability-measurement approaches at the manufacturing process level.
Key Words: KPI Criteria, Value Function, KPI Selection, Sustainable Manufacturing
INTRODUCTION Manufacturing companies face increasing pressure to improve the sustainability
of their operations [1, 2, 3]; however, beyond reduce, reuse, recycle programs, little
guidance is available to help manufacturers minimize their environmental impacts [4]. In
response to the increasing pressures and as a forum for establishing responsible
practices, ASTM initiated a subcommittee on Sustainable Manufacturing (ASTM E60.13).
A literature review shows that major sustainability indicators are defined for
specific, individual businesses [5]. Indicators that are uniformly defined and harmonized,
therefore, are largely missing. A few major indicator sets have been developed for
analyzing sustainability and scoring manufacturing organizations. For example, the
Organization for Economic Cooperation and Development (OECD) [6] Core
Environmental Indicators (CEI) includes 46 indicators to measure the impact of industrial
activities on the environment in industrialized countries. The United Nations (UN)
Commission on Sustainable Development [7] identifies 96 indicators to address
environmental deterioration due to human activities. The indicators are created for
businesses, companies, and factories; however, few publicly-available indicator sets
exist at the operational level for individual processes. Standard procedures for
identifying, defining, selecting, and composing a required set of Key Performance
Indicators (KPIs) for manufacturing are lacking.
ASME Journal of Manufacturing Science and Engineering
3
This paper addresses the question of what to measure to assess environmental
sustainability at the manufacturing process level. The scope includes identification,
definition, selection, and composition of environmental KPIs for individual processes. It
complements guidelines specified in standards such as ASTM 2986-15 [8], ASTM 3012-
16 [9], ISO 22400 [10], and ISO 20140 [11]. The purpose is to provide a guide for
industry to identify candidate KPIs from existing sources, define new candidate KPIs,
select the most effective KPIs based on KPI criteria, and compose a final KPI set. The
approach relies on both human judgment and quantitative methods. The humans are
stakeholders and subject matter experts, who are aware of the activities that are
important to the success of the organization.
In section 2, we review the state of the art as well as challenges for sustainable
manufacturing KPI ranking. This is followed by a description of value-focused concepts
and the value function approach for KPI selection. Section 3 describes the proposed
procedure for defining. Section 4 shows a demonstration of the procedure with a case
study. Section 5 presents a discussion and conclusion of the paper.
2 BACKGROUND AND RELATED WORK
In the past decade, there has been considerable research in sustainable
manufacturing and related measurement methodologies. Haapala et al. thoroughly
review concepts, tools, and methods for sustainable manufacturing [12]. Duflou et al.
provide a systematic overview of energy and resource efficiency methods and
techniques for discrete part manufacturing [13]. These and similar publications review
and analyze methodologies for developing sustainable manufacturing practices from the

ASME Journal of Manufacturing Science and Engineering
4
enterprise level to the process level. However, assessing sustainability performance
requires the availability of appropriate key performance indicators (KPIs).
2.1 Sources for sustainable manufacturing indicators
Efforts to select indicators for sustainable manufacturing have led to the
establishment of best practices at the organizational level as well as lifecycle-impact-
assessment methods. A best practice example is the Global Reporting Initiative, which
consists of indicators to assess sustainability along three dimensions: economy,
environment, and society [14]. A lifecycle assessment method example is IMPACT
2002+, which contains 14 midpoint categories mapped to four damage categories [15].
Recently, however, efforts have been made to develop other sources of
indicators, indices, and frameworks for the lower control levels in manufacturing. The
Lowell Center for Sustainable Production, proposed an indicator framework for shifting
towards more sustainable manufacturing practice [16]. The research proposed twenty-
two indicators and a guide to their application. In 2009, the National Institute of
Standards and Technology (NIST) created a public repository of sustainability indicators
to consolidate work of several organizations in the sustainable manufacturing area [17].
Joung et al. [2] categorized indicators for sustainable manufacturing and Park and
Kremer [18] further categorized fifty-five environmental sustainability indicators using
text mining-based objective information. However, Sikdar [19] claimed that no
consensus exists on a reasonable taxonomy of sustainability-related metrics. Thus,
indicators are defined inconsistently since every company, and indeed every
opportunity for measured performance, has its own set of indicators.

ASME Journal of Manufacturing Science and Engineering
5
2.2 Key performance indicator selection for sustainable manufacturing
Carlucci [20] noted that the selection of KPIs is necessary to assess the
performance of a production management system. However, selecting a small set of
KPIs from the large number of those available for a manufacturing process is often not
straightforward. Secondly, selecting appropriate indicators to monitor the sustainability
of processes and products is challenging due to the variety and complexity of those
processes.
Efforts towards indicator selection include a methodology for establishing and
improving performance measures that focus on overall equipment effectiveness [21].
Two related patents in the field exist. The first describes a method of selecting
performance indicators so that they are relevant to an organization’s business strategies
[22]. The second describes KPI scorecard editor to rate different indicators against each
other [23]. These patents, however, are proprietary and do not provide an open
framework for KPI selection.
Garetti and Taisch noted the need for a structured framework to support
selection of a suitable set of indictors [24]. To this end, a general KPI scheme for on-line
process monitoring was developed in [25]. But, it does not provide a methodology to
define new KPIs.
In summary, major problems for developing KPIs are (1) inconsistent definitions
of KPIs, (2) a lack of an effective selection method for environmental KPIs for the
manufacturing process, (3) a lack of KPI effectiveness evaluation methods, and (4) a lack
of a KPI set composition method. This paper represents an initial step to addressing
ASME Journal of Manufacturing Science and Engineering
6
these problems. It proposes an approach that uses a common set of selection criteria
rather than evaluating KPIs against each other.
2.3 Decision making under multiple criteria
Decision-making is the process of selecting a course of action from among
alternative choices. The KPI selection methodology presented in this paper uses
concepts of decision theory and multi criteria decision-making (MCDM), and is based on
value-focused and value-function approaches. It includes both human judgment and
quantitative methods.
Dieter and Schmidt [26] describe several steps for making choices to obtain the
best outcome of a situation. The steps include establishing objectives, developing
alternatives, evaluating alternatives against objectives, and choosing what holds the
best promise for achieving the objectives. Evaluating alternatives is one of the most
difficult steps because it requires overcoming, among others, making decisions under
conflicting requirements, setting priorities, and establishing objectives
Each objective is a statement of what the decision maker wants to achieve in the
decision context. The criteria represent objectives that KPIs should satisfy as they are
evaluated. MCDM methods include the weighted sum method, weighted product
method, and analytic hierarchy process, elimination and choice translating reality, and
technique for order preference by similarity [27].
Another common approach is for stakeholders to rank alternatives from the best
to the worst depending on their preference. Collins et al. proposed a selection and
improvement methodology for KPIs based on the weighted sum of values determined
ASME Journal of Manufacturing Science and Engineering
7
by value functions [28, 29]. This paper further explores the use of value functions for
selection criteria and use it for ranking candidate KPIs for selection of a final KPI set.
2.4 Value Functions for decision-making Value-focused thinking is a way of using values to evaluate, rank, and choose the
best among a set of alternatives [30]. Concepts of utility and value-focused thinking are
more often used in economic analysis to understand preferences for products or
investments. Value is a perceived benefit from acquiring and using a product or service,
and upon which the motivation for making one choice over others is based. Values are
obtained from value functions that are constructed by subject matter experts. But
logical and systematic concepts are needed to qualitatively identify and structure the
values that are appropriate to a situation while simultaneously constructing a value
function [31]. Values are used to rank KPIs against the criteria.
Ezell [32] views the importance level assigned as a form of ‘investment’ on part
of the stakeholder, and value as the benefit of doing so. Ranking candidate KPIs using
value functions begins with identifying selection criteria followed by developing value
functions for each criterion. Finally, a multiple objective decision making process using a
value function for each criterion as proposed by Keeney [31] can be adopted to make
criteria quantifiable. The process is described in the next section.
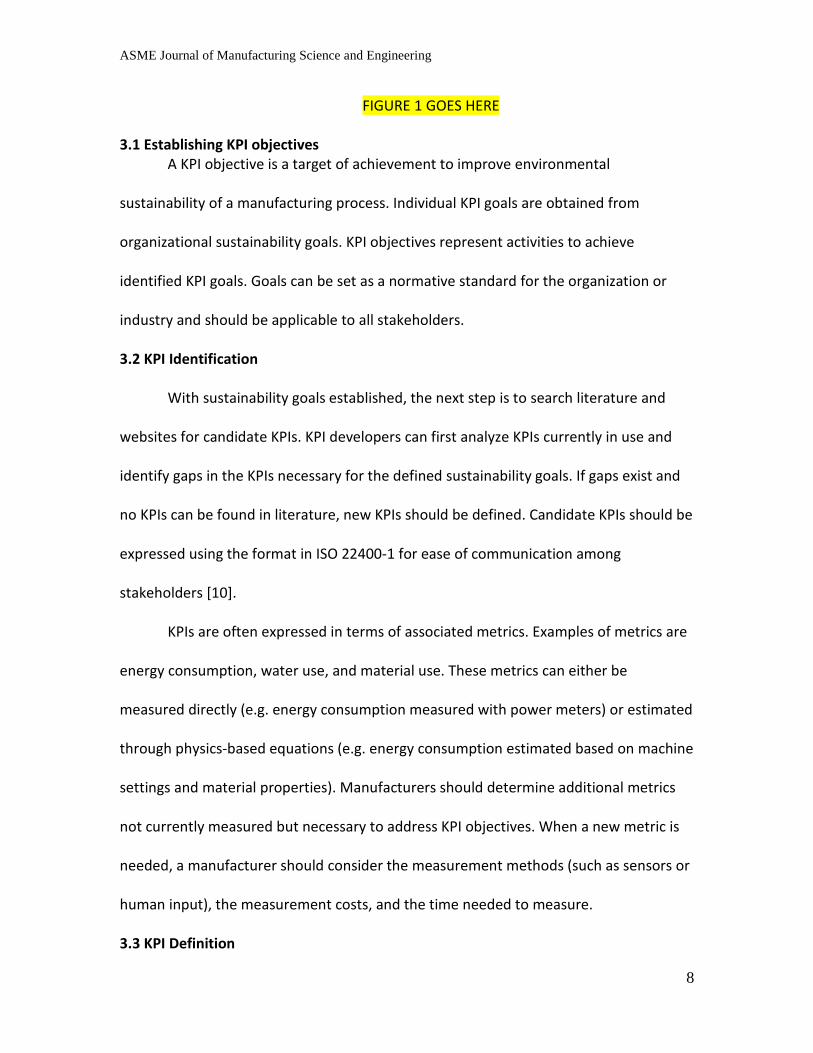
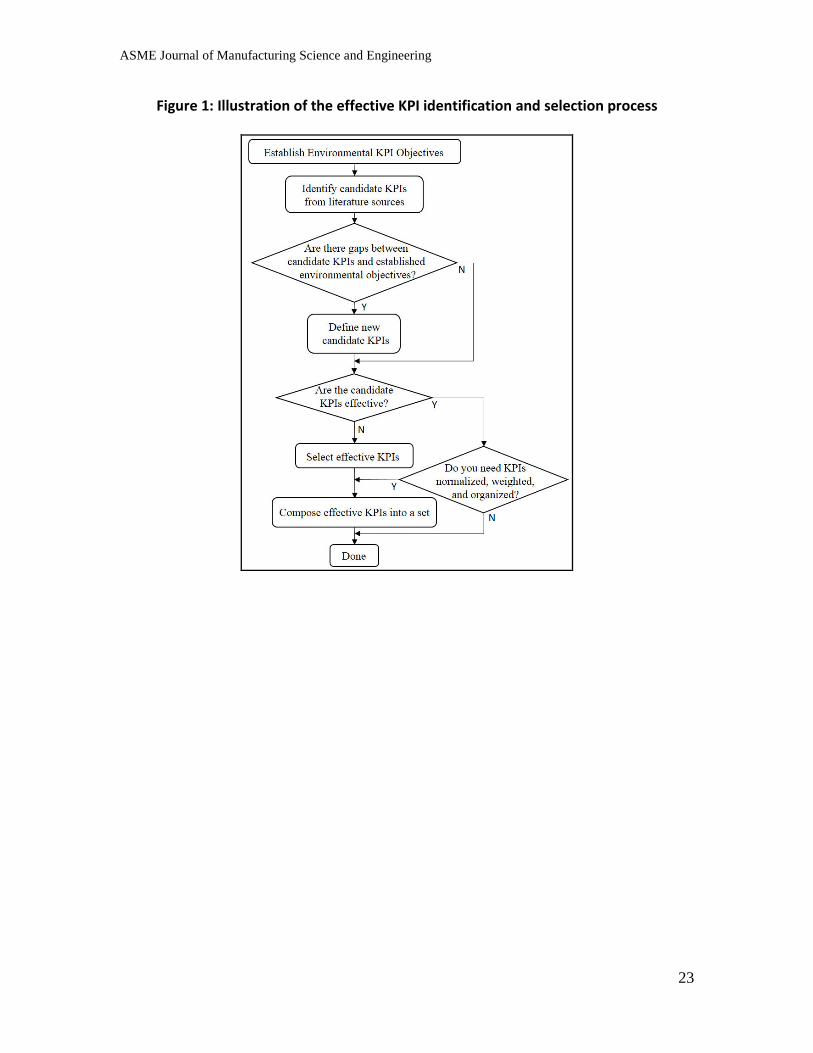
3 PROPOSED APPROACH FOR DEVELOPING KPI SETS This section describes an approach to systematically rank candidate KPIs in order
of effectiveness for sustainability assessment of a manufacturing process. It involves
identifying candidate KPIs, selecting, ranking, and composing a final KPI set. These
activities are illustrated in Figure 1. The first step is to establish organizational goals.
ASME Journal of Manufacturing Science and Engineering
8
FIGURE 1 GOES HERE
3.1 Establishing KPI objectives A KPI objective is a target of achievement to improve environmental
sustainability of a manufacturing process. Individual KPI goals are obtained from
organizational sustainability goals. KPI objectives represent activities to achieve
identified KPI goals. Goals can be set as a normative standard for the organization or
industry and should be applicable to all stakeholders.
3.2 KPI Identification
With sustainability goals established, the next step is to search literature and
websites for candidate KPIs. KPI developers can first analyze KPIs currently in use and
identify gaps in the KPIs necessary for the defined sustainability goals. If gaps exist and
no KPIs can be found in literature, new KPIs should be defined. Candidate KPIs should be
expressed using the format in ISO 22400-1 for ease of communication among
stakeholders [10].
KPIs are often expressed in terms of associated metrics. Examples of metrics are
energy consumption, water use, and material use. These metrics can either be
measured directly (e.g. energy consumption measured with power meters) or estimated
through physics-based equations (e.g. energy consumption estimated based on machine
settings and material properties). Manufacturers should determine additional metrics
not currently measured but necessary to address KPI objectives. When a new metric is
needed, a manufacturer should consider the measurement methods (such as sensors or
human input), the measurement costs, and the time needed to measure.
3.3 KPI Definition

ASME Journal of Manufacturing Science and Engineering
9
There are two approaches to defining a new KPI: bottom-up and top-down. The
bottom-up approach starts with identifying current and necessary metrics and then
assembling them into a new KPI. For example, if the objective is to reduce energy waste
at a process, then measuring both total energy and energy needed for a task (necessary
energy) will be required. Example KPIs could be “total energy waste = total energy –
necessary energy” or “energy waste efficiency = necessary energy/total energy.” The
bottom-up approach is more useful when addressing the improvement of a single
process.
The top-down approach focuses on defining a new KPI from the goals and
identifying the necessary metrics to calculate that KPI. The method chosen is based on
the manufacturer’s situation. The top-down approach is driven by organizational goals
and may include several manufacturing processes relevant to the goal. Table 1 is an
example of a KPI formatted using the ISO 22400-1 template [10].
TABLE 1 GOES HERE
3.4 KPI Selection
Once candidate KPIs are identified, experts and stakeholders are enlisted to rank
the KPIs based on their effectiveness of sustainability assessment. The criteria for this
ranking are determined independently from the KPIs themselves. The list of potential
criteria can be extensive [33, 34, 35]. Therefore, a systematic approach involving
multiple stakeholders is used to identify a set of selection criteria. Stakeholders include
line managers, supervisors, and shop floor workers who make their proposals for
selection criteria. This information is then aggregated. A final set of criteria is obtained
ASME Journal of Manufacturing Science and Engineering
10
after additional review by the stakeholders. Further, previous experience in similar
situations can also be used to determine the number and type of criteria needed.
FIGURE 2 GOES HERE
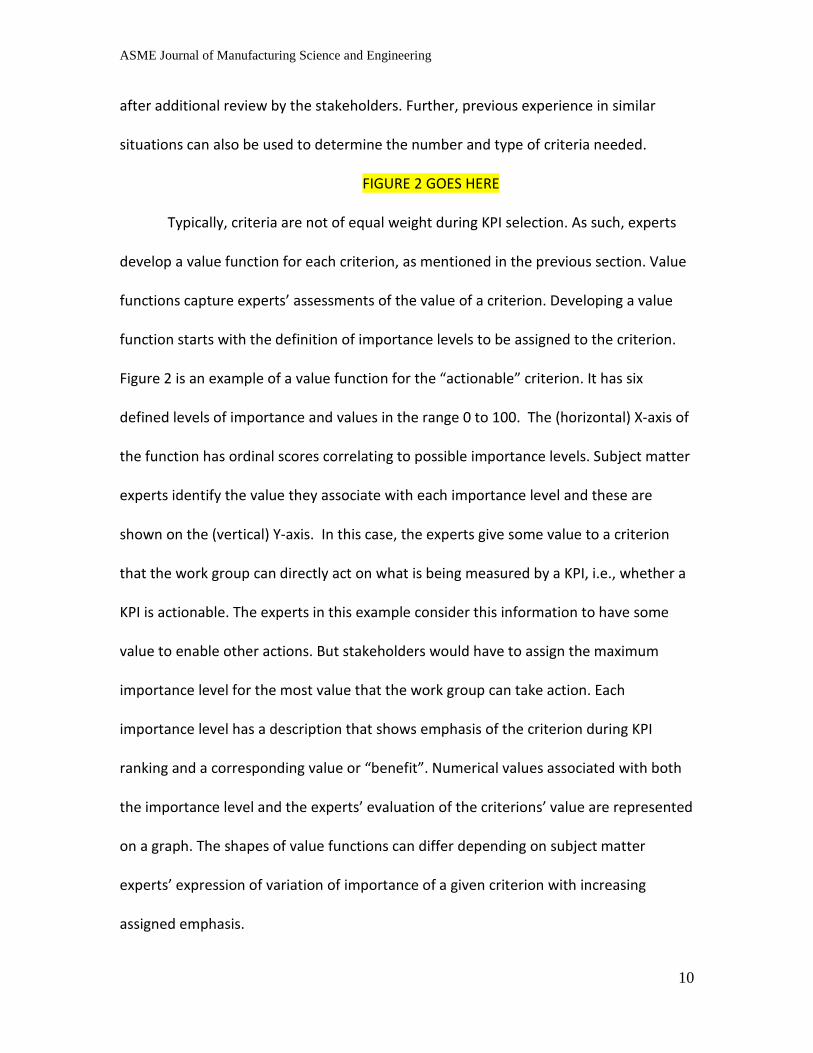
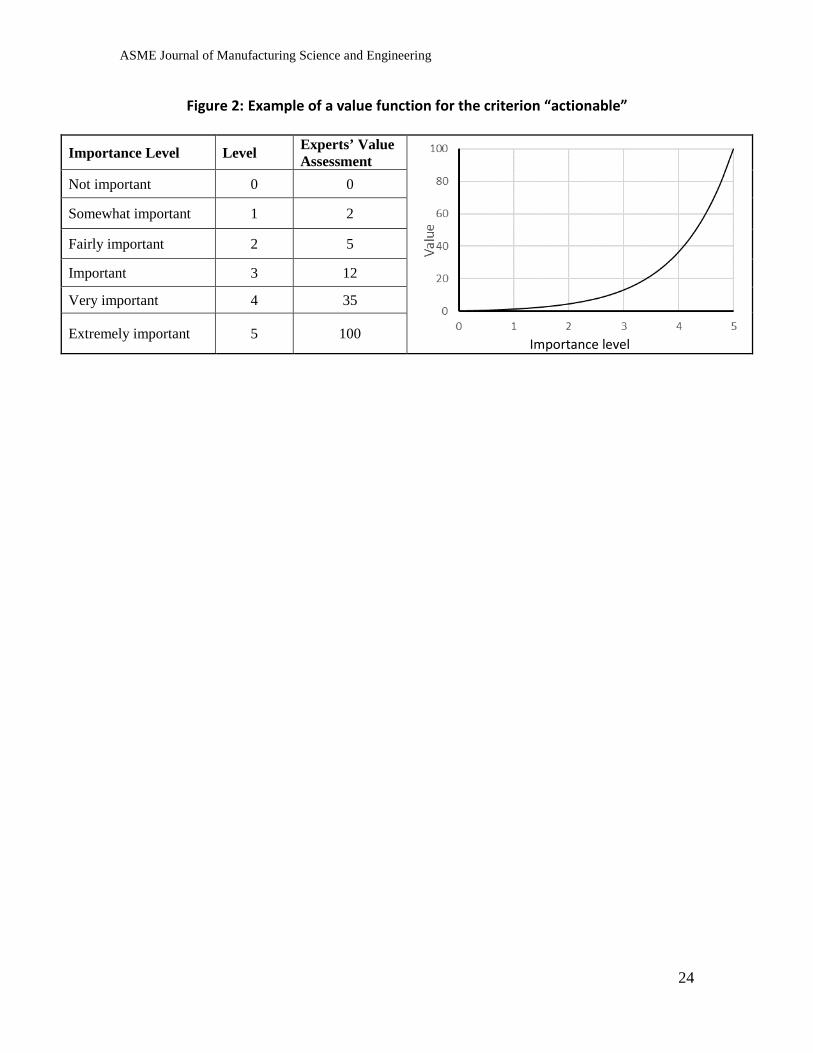
Typically, criteria are not of equal weight during KPI selection. As such, experts
develop a value function for each criterion, as mentioned in the previous section. Value
functions capture experts’ assessments of the value of a criterion. Developing a value
function starts with the definition of importance levels to be assigned to the criterion.
Figure 2 is an example of a value function for the “actionable” criterion. It has six
defined levels of importance and values in the range 0 to 100. The (horizontal) X-axis of
the function has ordinal scores correlating to possible importance levels. Subject matter
experts identify the value they associate with each importance level and these are
shown on the (vertical) Y-axis. In this case, the experts give some value to a criterion
that the work group can directly act on what is being measured by a KPI, i.e., whether a
KPI is actionable. The experts in this example consider this information to have some
value to enable other actions. But stakeholders would have to assign the maximum
importance level for the most value that the work group can take action. Each
importance level has a description that shows emphasis of the criterion during KPI
ranking and a corresponding value or “benefit”. Numerical values associated with both
the importance level and the experts’ evaluation of the criterions’ value are represented
on a graph. The shapes of value functions can differ depending on subject matter
experts’ expression of variation of importance of a given criterion with increasing
assigned emphasis.
ASME Journal of Manufacturing Science and Engineering
11
In the next step, stakeholders independently assign the levels of importance for
all the criteria for each candidate KPI. A value is obtained from the value function for
each importance level assigned. An average is calculated for the values obtained from all
stakeholders for each criterion for each KPI. The final value of the importance of a KPI
depends on values obtained for all the criteria. Many algorithms exist for calculating this
final value. One simplified method is to calculate the total sum of values obtained from
all the criteria. Ranking of KPIs is based on the final aggregated value of a KPI relative to
that of other candidate KPIs.
The average value function for criteria i from all stakeholders can be represented
as . If n is the number of criteria, m is the number of stakeholders, then the final value
(or aggregated value) of a KPI’s importance is:
Aggregated value ∑=
=n
iii xv
1)(
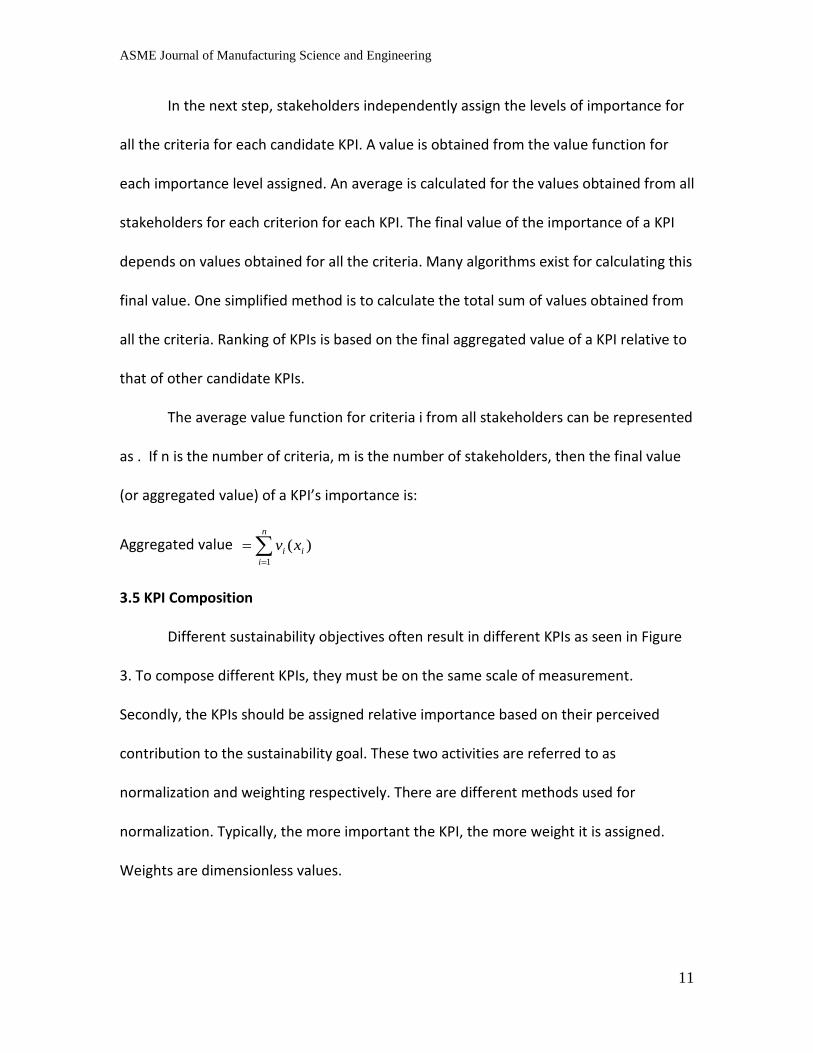
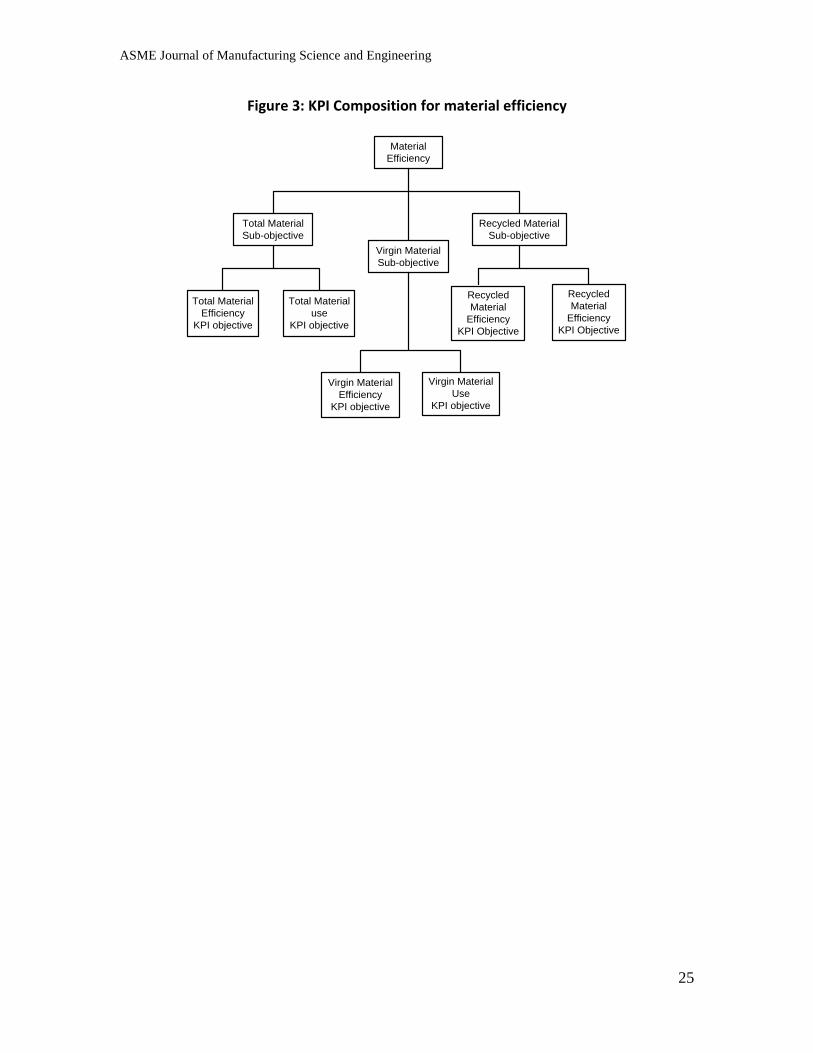
3.5 KPI Composition
Different sustainability objectives often result in different KPIs as seen in Figure
3. To compose different KPIs, they must be on the same scale of measurement.
Secondly, the KPIs should be assigned relative importance based on their perceived
contribution to the sustainability goal. These two activities are referred to as
normalization and weighting respectively. There are different methods used for
normalization. Typically, the more important the KPI, the more weight it is assigned.
Weights are dimensionless values.
ASME Journal of Manufacturing Science and Engineering
12
KPI organization is a layered structure of KPI objectives, sub-goals, and
sustainability goals. KPI objectives are at the bottom while sustainability goals are at the
top. Sub-goals lie in between the sustainability goals and KPI objectives. The relationship
between KPI objectives, sustainability sub-goals, and sustainability goals are expressed
in the goal-objective structure. Using this structure, measurements based on KPIs can be
properly aggregated to evaluate whether manufacturing processes meet the
sustainability objective.
FIGURE 3 GOES HERE
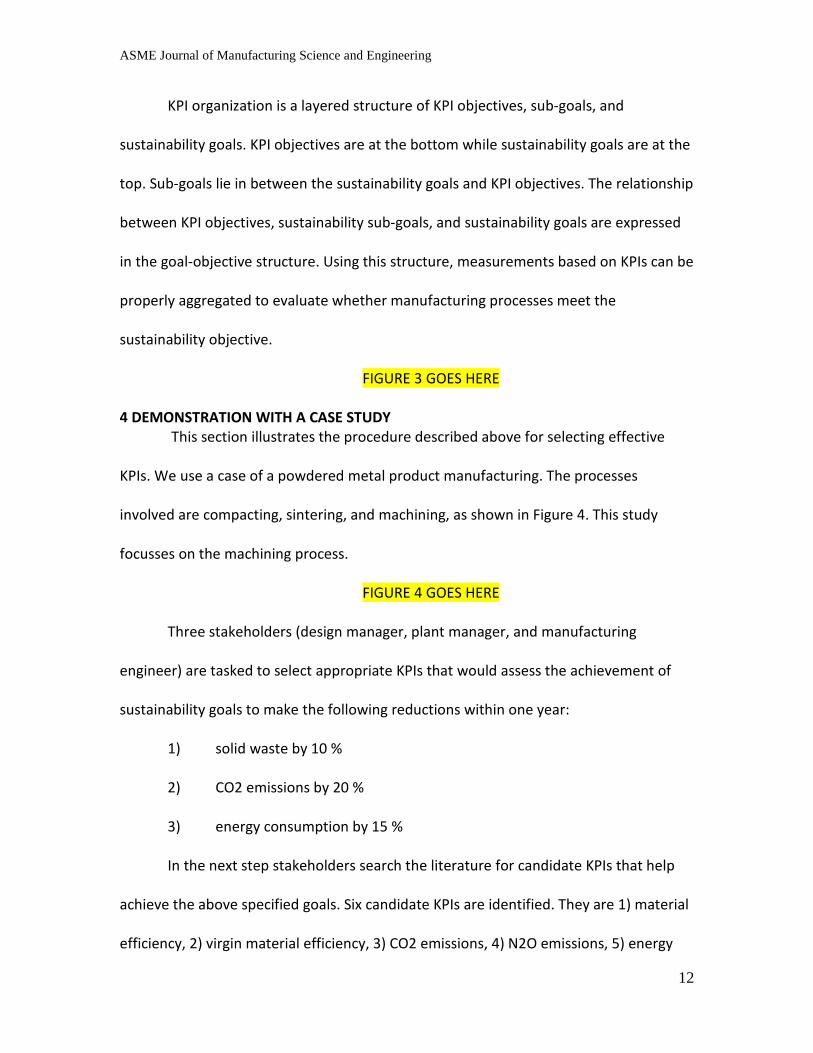
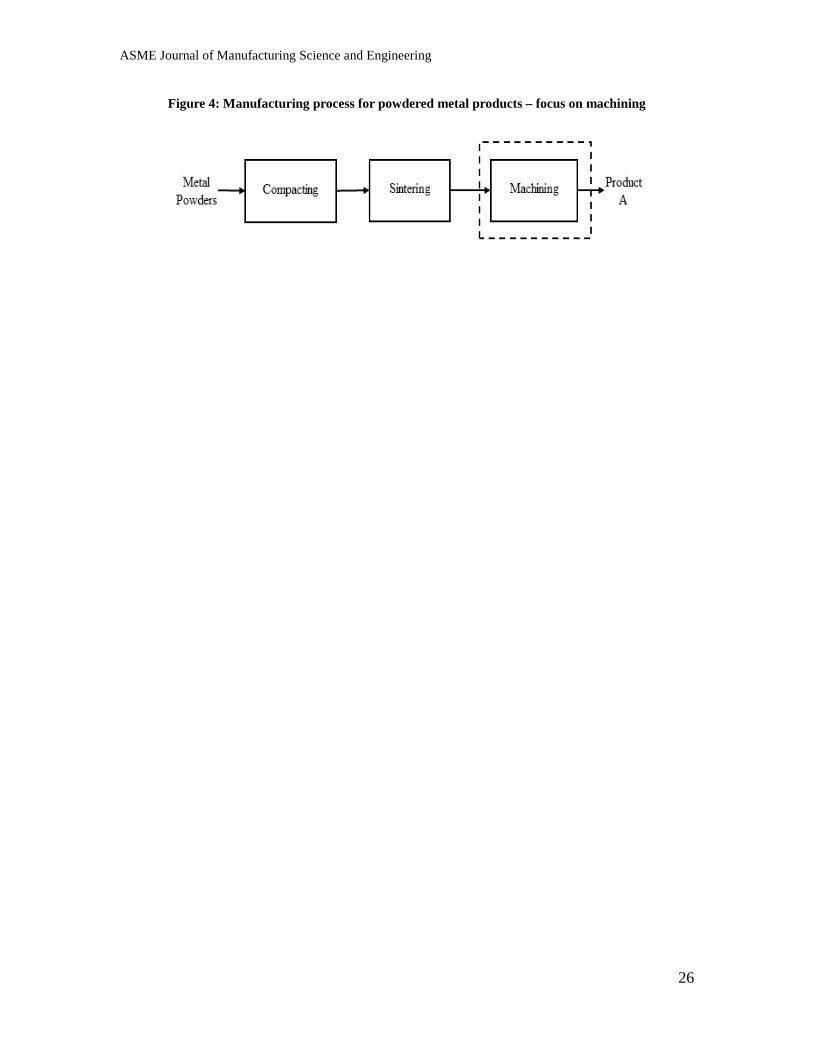
4 DEMONSTRATION WITH A CASE STUDY This section illustrates the procedure described above for selecting effective
KPIs. We use a case of a powdered metal product manufacturing. The processes
involved are compacting, sintering, and machining, as shown in Figure 4. This study
focusses on the machining process.
FIGURE 4 GOES HERE
Three stakeholders (design manager, plant manager, and manufacturing
engineer) are tasked to select appropriate KPIs that would assess the achievement of
sustainability goals to make the following reductions within one year:
1) solid waste by 10 %
2) CO2 emissions by 20 %
3) energy consumption by 15 %
In the next step stakeholders search the literature for candidate KPIs that help
achieve the above specified goals. Six candidate KPIs are identified. They are 1) material
efficiency, 2) virgin material efficiency, 3) CO2 emissions, 4) N2O emissions, 5) energy
ASME Journal of Manufacturing Science and Engineering
13
per part, and 6) energy efficiency. These KPIs are deemed sufficient for the KPI goals
and, therefore, no new KPIs are defined. The stakeholders next select the following
criteria for ranking the KPIs:
1) Cost effectiveness: The degree of perceived cost benefit of implementing
the KPI.
2) Quantifiable: The degree to which a KPI can be stated numerically and
precisely.
3) Calculable: The degree of correctness and completeness of the
calculation required to compute the value of the KPI.
4) Management support: The willingness of plant management to support
the choice of appropriate KPIs, achievement of KPI targets, and performance of the
tasks necessary to improve target KPI values.
5) Comparable: The degree to which historic data is maintained and
available for comparison to current values.
6) Understandable: The degree to which the meaning of the KPI is
comprehensible by team members, particularly with respect to corporate goals.
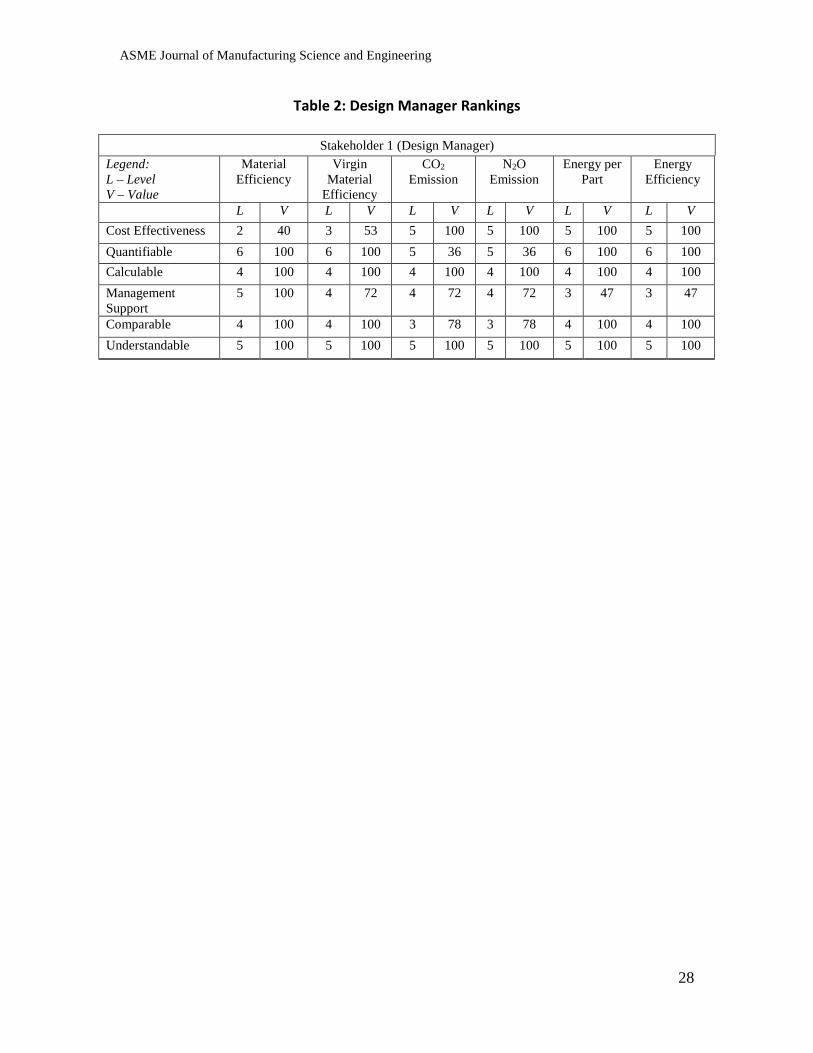
The value functions are then created by subject matter experts for each
criterion. The stakeholders assign an importance level to the criterion for each KPI. For
each importance level assigned, a value is obtained using the value functions. Table 2
shows the importance level on a scale 0-6 for each KPI assigned by one stakeholder. The
values (obtained from the value function) vary in range 0-100. All three stakeholders
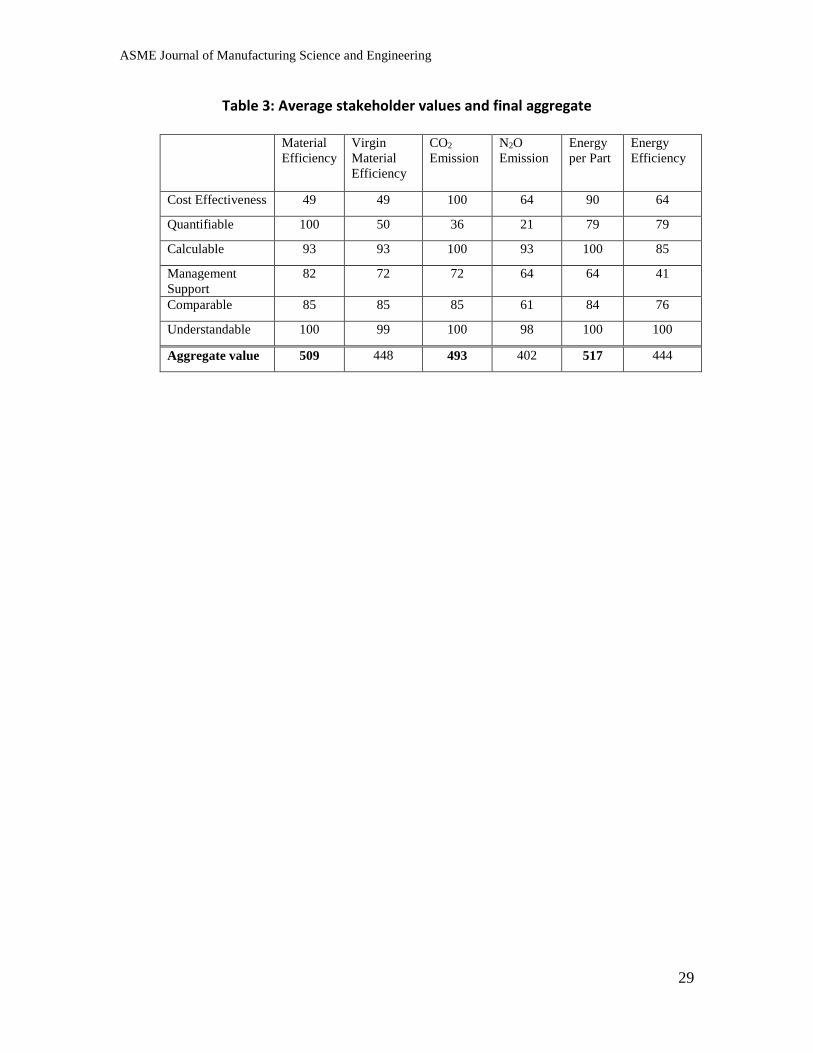
perform the same process and their results averaged. The averages for all stakeholders

ASME Journal of Manufacturing Science and Engineering
14
per criterion, as well as the aggregated averages for all criteria (rating), are shown in
Table 3.
TABLE 2 GOES HERE
TABLE 3 GOES HERE
The stakeholders scores show that the KPIs rank as follows: 1) Energy per Part, 2)
Material Efficiency, 3) CO2 Emissions, 4) Virgin Material Efficiency, 5) Energy Efficiency,
and 6) N2O Emissions. The stakeholders decide on a cutoff point of 475 and select
Material Efficiency, Energy Intensity, and CO2 emissions to measure the sustainability
objectives.
5 DISCUSSION AND CONCLUSION Currently, standard procedures to select effective KPIs for manufacturing
process sustainability do not exist. The paper has developed a method using selection
criteria and value functions to rank candidate KPIs so that a final set is selected. The
method combines both human input and quantitative analysis. The procedure will
enable manufacturers to consistently select effective environmental KPIs across facilities
to be shared among different manufacturers.
The approach is a step towards a standard guide for developing KPI sets for
assessing environmental aspects of manufacturing processes. It complements existing
standards for (1) KPI identification at operational level (ISO 22400-1), (2) for unit
manufacturing process characterization (ASTM E3012-16), and (3) gate-to-gate
environmental sustainability evaluation of manufacturing processes (ASTM E2986-15).
This paper is a basis for a guide that has been proposed to the ASTM standard for
members, consisting primarily of industrial practitioners, to review and comment.

ASME Journal of Manufacturing Science and Engineering
15
However, membership is open to any interested party. A standard is expected to be
completed soon.
The KPI selection process will better support researchers and practitioners in
making informed use of KPIs if it is encoded into software. Procedures for selecting the
stakeholders and subject matter experts can also be formalized and documented.
Choices for criteria definition, value function development, final value aggregation
methods as well as normalization and weighting methods can be made available.
This paper contributes to a wider field of using KPIs for performance measurement of
manufacturing systems. Work on describing relationships between manufacturing KPIs
has been initiated to enable understanding of which KPIs have the greatest impact on
others as well as the type and form of impact. We anticipate that the results will include
formal methods for developing and representing such relationships. The methods
developed will be applied to environmental KPIs, which will further enhance the process
of developing a final KPI set.
One of the major issues in KPI selection and application is that emphasizing one
KPI may result in deterioration of another. By analyzing the interrelationships of various
KPIs and their underlying metrics, it may be possible to calculate a similarity score,
which could aid in the selection of the effective KPIs. For example, if multiple KPIs are
based on the same metrics for computation, it might be possible to only use one KPI to
measure towards the sustainability goal. On top of this, if one KPI that is already
measured directly influences another KPI that is not measured, then it may be possible

ASME Journal of Manufacturing Science and Engineering
16
to calculate both KPIs without the need for additional data collection devices or
measurements.
Repositories of KPIs for manufacturing processes will be helpful to provide pre-
defined KPIs for selection of those suitable to the different specific processes being
studied. Repositories should be easily accessible and extensible to organize KPIs as more
are included. Advanced search capabilities should support accuracy and speed in finding
appropriate KPIs and will be a topic of future research.
ACKNOWLEDGMENT
This effort has been sponsored in part under the cooperative agreement No.
70NANB13H153 between NIST and Morgan State University. This material is declared a
work of the U.S. Government and is not subject to copyright protection in the United
States of America.
DISCLAIMER
Certain commercial software products or services may be identified in this
paper. These products or services were used only for demonstration purposes. This use
does not imply approval or endorsement by NIST, nor does it imply that these products
are necessarily the best for the purpose. This material is declared a work of the U.S.
Government and is not subject to copyright protection in the United States of America.
ASME Journal of Manufacturing Science and Engineering
17
NOMENCLATURE V variables should appear in first column with the description in second
column, m
I all variables should appear in italics
tl two-letter abbreviations should appear in italics
tla three-letter abbreviations should not appear in italics
Re Reynolds number and similar abbreviations do not use italics
T use the “Tab” key to add more rows to this table

ASME Journal of Manufacturing Science and Engineering
18
REFERENCES [1] MIT Sloan Management Review and Boston Consulting Group (2011).
“Sustainability: The ‘Embracers’ Seize Advantage,” MIT Sloan Management Review Research Report, Winter 2011.
[2] Joung, C., Carrell, J., Sarkara, P., Feng, S. (2013). “Categorization of Indicators for sustainable manufacturing,” Ecological Indicators, 24, pp. 148–157.
[3] Moldan, B., Janouskova, S., and Hak, T. (2012) “How to understand and measure environmental sustainability: Indicators and targets,” Journal of Ecological Indicators, 17, pp. 4 – 13.
[4] Kang, N., Zhao, C., Li, J., and Horst, J. (2016). “A hierarchical structure of key performance indicators for operation management and continuous improvement in production systems,” International Journal of Production Research, 54(21), pp. 6333 - 6350.
[5] Gaurav, A., Rachuri, S., Fiorentini, X., Mani, M., Fenves, S., Lyons, K., and Sriram, R. (2008). “Extending the Notion of Quality from Physical Metrology to Information and Sustainability,” Journal of Intelligent Manufacturing, 22, 737-750. doi:10.1007/s10845-009-0333-3.
[6] OECD Toolkit (2011). OECD Sustainable Manufacturing Toolkit, http:// www.oecd.org/innovation/green/toolkit, OECD Publishing, Paris, France.
[7] UN-CSD (the United Nations Committee on Sustainable Development). (2007) “Indicators of Sustainable Development: Guidelines and Methodologies,” (3rd Eds.), the United Nations, New York, New York, 2007, http://www.un.org/esa/sustdev/natlinfo/indicators/guidelines.pdf.
[8] ASTM E2986-15 (2015). “Standard Guide for Evaluation of Environmental Aspects of Sustainability of Manufacturing Processes,” ASTM International.
[9] ASTM E3012-16 (2016). “Standard Guide for Characterizing Environmental Aspects of Manufacturing Processes,” ASTM International.
[10] ISO 22400-1:2014, (2014). “Automation systems and integration— Key Performance Indicators (KPIs) for manufacturing operations management; Part 1: Overview, concepts, and terminology,” International Organization for Standardization.
[11] ISO 20140-1:2013 (2013). “Automation systems and integration -- Evaluating energy efficiency and other factors of manufacturing systems that influence the environment -- Part 1: Overview and general principles.”, International Organization for Standardization.
[12] Haapala, K.R., Zhao, F., Camelio, J., Sutherland, J.W., Skerlos, S.J., Dornfeld, D., Jawahir, I.S., Clarens, A.F., Rickli, J.L. (2013). “A Review of Engineering Research in Sustainable Manufacturing,” Journal of Manufacturing Science and Engineering, 135 (4), 041013-011013-16.
[13] Duflou, J. R., Sutherland, J.W., Dornfeld, D., Herrmann, C., Jeswiet, J., Kara, S., Hauschild, M., Kellens, K. (2012). “Towards energy and resource efficiency manufacturing: A processes and systems approach” CIRP Annals – Manufacturing Technology, 61 (2), pp. 587-609.

ASME Journal of Manufacturing Science and Engineering
19
[14] GRI (Global Reporting Initiative) (2006). “Sustainability reporting Guidelines,” Version 3.0, 200-2006 GRI, http://www.globalreporting.org.
[15] EPFL (Swiss Federal Institute of Technology), “IMPACT 2002+,” http://www.quantis-intl.com/en/impact-2002, visited June 15, 2016.
[16] Veleva, V., and Ellenbecker, M. (2001). “Indicators of sustainable production: Framework and methodology”, Journal of Cleaner Production, (9), pp. 529-549.
[17] NIST Engineering Laboratory 2009, “Sustainable Manufacturing Indicator Depository,” Available online at: http://www.mel.nist.gov/msid/SMIR/index.html, 2009 accessed on 10/5/2016).
[18] Park, K., Kremer, G.E.O, (2017). “Text mining-based categorization and user perspective analysis of environmental sustainability indicators for manufacturing and service systems,” Journal of Ecological Indicators, 72, pp. 803-820
[19] Sikdar, S., (2003) “Sustainable development and sustainability metrics,” AIChE Journal, 49, (8), pp. 1928–1932.
[20] Carlucci, D. (2010). “Evaluating and selecting key performance indicators: an ANP-based model.” Measuring Business Excellence, 14, (2), pp. 66–76.
[21] Ahmad, M.M. and Dhafr, N. (2002). “Establishing and improving manufacturing performance measures,” Robotics and Computer Integrated Manufacturing,18, 171-176
[22] Patent 2005. (2005). Razvi, N., Deppe, M., Oswald, W., Guenther, M., Performance Indicator Selection https://www.google.com/patents/US20060235778
[23] Patent 2007, (2007). Van de Walker Handy, S., Birkedal Peterson, P., Wilson, B., Hulen, C.J. Key Performance Indicator Scorecard Editor https://www.google.com/patents/US8095417
[24] Garetti, M. and Taisch, M., (2012). “Sustainable manufacturing: trends and research challenges,” Production Planning & Control, 23 (2-3), pp. 83-104.
[25] Rakar, A., Zorzut, S., Jovan, V., (2004). “Assessment of Production Performance by Means of KPI” Proceedings of the Control, pp. 6-9.
[26] Dieter, G. E., and Schmidt L. C., (2013). “Engineering Design,” Fifth Edition, McGraw-Hill.
[27] Triantaphyllou, E., (2013). “Multi-Criteria Decision Making Methods: A Comparative Study,” Kluwer Academic Publishers.
[28] Collins, A., Hester, P. T., Ezell, B., and Horst, J., (2016). “An improvement selection methodology for Key Performance Indicators.” Environment, Systems and Decisions, 36 (2), pp. 196-208.
[29] Clemen, R. and Reilly, T., (2001). “Making Hard Decisions,” South-Wester Cengage Learning, Mason, OH.
[30] Keeney, R. (1992). “Value focused thinking: A Path to Creative Decision-making,” Harvard University Press.
[31] Keeney, R. L. and Raiffa, H. (1993). “Decisions with Multiple Objectives: Preferences and Value Tradeoffs.” Cambridge University Press.
[32] Ezell, B. C. (2004). “Quantifying vulnerability to critical infrastructure systems.” PhD Dissertation, Department of Engineering Management, Old Dominion University, Norfolk, VA.
ASME Journal of Manufacturing Science and Engineering
20
[33] Martins, A.A., Mata, T.M., Costa, C.A.V. and Sikdar, S.K., (2007). “Framework for Sustainability Metrics,” Industrial & Engineering Chemistry Research, 46, pp. 2962-2973.
[34] Tanzil, D., and Beloff, B.R. (2006). “Assessing Impacts: Overview on Sustainability Indicators and Metrics,” Wiley Periodicals, Inc.
[35] ISO 22400-2: 2011, (2011). “Automation systems and integration – Key performance indicators (KPIs) for manufacturing operations management – Part 2: Definitions and descriptions of KPIs,” International Organization for Standardization.
ASME Journal of Manufacturing Science and Engineering
21
Figure Captions List
Fig. 1 Illustration of the effective KPI identification and selection process
Fig. 2 Example of a value function for the criterion “actionable”
Fig. 3 KPI Composition for material efficiency
Fig. 4 Manufacturing process for powdered metal products – focus on
machining
ASME Journal of Manufacturing Science and Engineering
22
Table Caption List Table 1 Example KPI – Total Energy Waste
Table 2 Design Manager Rankings
Table 3 Average stakeholder values and final aggregate
ASME Journal of Manufacturing Science and Engineering
23
Figure 1: Illustration of the effective KPI identification and selection process
ASME Journal of Manufacturing Science and Engineering
24
Figure 2: Example of a value function for the criterion “actionable”
Importance Level Level Experts’ Value Assessment
Importance level
Not important 0 0
Somewhat important 1 2
Fairly important 2 5
Important 3 12
Very important 4 35
Extremely important 5 100
ASME Journal of Manufacturing Science and Engineering
25
Figure 3: KPI Composition for material efficiency
Material Efficiency
Total Material Sub-objective
Virgin Material Sub-objective
Recycled Material Sub-objective
Total Material Efficiency
KPI objective
Total Material use
KPI objective
Virgin Material Use
KPI objective
Virgin Material Efficiency
KPI objective
Recycled Material
Efficiency KPI Objective
Recycled Material
Efficiency KPI Objective
ASME Journal of Manufacturing Science and Engineering
26
Figure 4: Manufacturing process for powdered metal products – focus on machining

ASME Journal of Manufacturing Science and Engineering
27
Table 1: Example KPI – Total Energy Waste
KPI description
Content: Name Total Energy Waste ID Description The total energy waste measures the difference between theoretical energy
and the actual energy consumed by the process. Scope Process Level Formula Total Energy Waste = EC – NE,
where EC = energy consumed by the process in kWh where NE = necessary energy in kWh
Unit of Measure kWh Range Min: 0
Max: process dependent Trend The lower, the better Context: Timing Periodically Audience Operator, supervisor, management Production methodology Discrete, Batch Notes The total energy waste provides insight into energy waste at a process by
comparing the energy needed at a process to the actual energy consumed.
ASME Journal of Manufacturing Science and Engineering
28
Table 2: Design Manager Rankings
Stakeholder 1 (Design Manager) Legend: L – Level V – Value
Material Efficiency
Virgin Material
Efficiency
CO2 Emission
N2O Emission
Energy per Part
Energy Efficiency
L V L V L V L V L V L V Cost Effectiveness 2 40 3 53 5 100 5 100 5 100 5 100 Quantifiable 6 100 6 100 5 36 5 36 6 100 6 100 Calculable 4 100 4 100 4 100 4 100 4 100 4 100 Management Support
5 100 4 72 4 72 4 72 3 47 3 47
Comparable 4 100 4 100 3 78 3 78 4 100 4 100 Understandable 5 100 5 100 5 100 5 100 5 100 5 100
ASME Journal of Manufacturing Science and Engineering
29
Table 3: Average stakeholder values and final aggregate
Material Efficiency
Virgin Material Efficiency
CO2 Emission
N2O Emission
Energy per Part
Energy Efficiency
Cost Effectiveness 49 49 100 64 90 64
Quantifiable 100 50 36 21 79 79
Calculable 93 93 100 93 100 85
Management Support
82 72 72 64 64 41
Comparable 85 85 85 61 84 76
Understandable 100 99 100 98 100 100
Aggregate value 509 448 493 402 517 444