problem soils__west australian perspective - davenport, 2007
TRANSCRIPT

Australian Geomechanics Vol 42 No 3 September 2007 1
PROBLEM SOILS – A WEST AUSTRALIAN PERSPECTIVE
Fred Davenport AIT (CEng) MIE (Aust) CP Eng
ABSTRACT Problems soils, defined in this paper as those soils reactive to moisture, are widespread across Western Australia. These soils have caused structural distress to numerous buildings and other structures and distortion and deterioration of many pavements.
This paper provides information on the distribution of these soils across Western Australia and the order of costs associated with remediation works required to correct distress and distortion caused by movements of the problem soils. Some methods used and local relationships developed to predict the movement of the soil associated with changes in moisture content are also discussed. Field indications of the presence of moisture sensitive soils are also mentioned.
The paper also includes some background on studies undertaken on sites containing problem soils in the south-eastern Wheatbelt and Pilbara regions of Western Australia.
1 DISTRIBUTION OF PROBLEM SOILS The map of Western Australia (Figure 1) shows the distribution of moisture reactive soils. The soils shown on the map and considered moisture reactive are expansive clays and collapsing soils.
Figure 1: Moisture Reactive Soils of Western Australia.

PROBLEM SOILS – A WEST AUSTRALIAN PERSPECTIVE F DAVENPORT
Australian Geomechanics Vol 42 No 3 September 2007 2
The map shown in Figure 1 is part of an Australian map thought to have been produced by the CSIRO and appears to relate to a soils distribution contained in a 1972 CSIRO publication entitled “Handbook of Australian Soils” (CSIRO, 1972).
In line with the distribution shown on this map, moisture reactive soils have been encountered at numerous sites across Western Australia including
1.1 EXPANSIVE CLAY SOILS: Soils that have a significant potential to swell and shrink with changes in moisture content. These soils commonly contain clay minerals of the smectite group, which includes montmorillonite and bentonite. They also include gilgai soils, which are common in Western Australia.
Expansive clays have been identified at:
• Dalwallinu. • •Ongerup. • •Ravensthorpe. • •Newman. • •Kalgoorlie. • •Boulder. • •Perth metropolitan area (Kalamunda, Midland, Guilford, Gooseberry Hill, Swanview, Maylands, Kenwick,
Armadale, Maddington, Viveash). • •Moora. • •Geraldton. • •Lake King. • •Coolgardie. • •Katanning. • •Mundijong. • •Jerramungup. • •Kununurra. • •Collie. • •Bunbury.
1.2 COLLAPSING SOILS: Soils that decrease in bulk volume at constant stress when inundated by water. These soils are characterised by having a partially saturated open-voided soil structure typically comprised of silt to fine sand sizes.
Collapsing soils have been identified at:
• •Port Hedland. • •Karratha. • •Broome. • •Derby. • •Balladonia. • •Newman. • •Perth coastal area. • •Geraldton. • •Cranbrook.
2 COSTS To the author’s knowledge, costs of remedial works associated with repairing damage caused by movement of moisture reaction soils have never been collated on a state-wide basis. The author is only aware of costs of remedial works being assessed for particular projects or areas. This is more than likely due to the fact that most structures or residences are constructed on Perth sands or coastal sands, which are not perceived to be moisture reactive.
In South Australia, where heavy clays underlie a significant part of the city and suburbs of Adelaide, costs related to damage due to shrink swell movements of the clay soils have been estimated. A recent paper, dated April 2007, was prepared by the Government of South Australia’s Building Advisory Committee and included estimates of the cost of damage to housing, constructed prior to 1981, caused by the recent drought. The Building Advisory Committee

PROBLEM SOILS – A WEST AUSTRALIAN PERSPECTIVE F DAVENPORT
Australian Geomechanics Vol 42 No 3 September 2007 3
estimates that 339,559 houses constructed in Adelaide prior to 1981 (prior to the use of AS 2870) had a potential damages bill to residences of $3,000 per dwelling. This equates to about $1 billion not including the houses built in Adelaide after 1981. State-wide the estimate of damage was $1.46 billion for 476,246 houses built prior to 1981.
In the Proceedings of the Fourth International Conference on Expansive Clay, it was estimated that the annual cost of damages caused by movements of clay soils in the United States of America is in the order of $11 billion.
3 PREDICTION OF GROUND MOVEMENT
3.1 CLAY SOILS Numerous methods have been used to estimate the potential severity or degree of movement of the ground surface due to moisture changes of clay soils. Two methods that have been, or are currently in common usage, are those developed by Van der Merwe (1964) and Holland (1981).
Van der Merwe relates plasticity index to clay fraction and activity and categorises the relationship as low, medium, high and very high potential expansiveness. The graph developed by Van der Merwe is presented in Figure 2.
Figure 2: Classification of expansive soils (Van der Merwe, 1964)
Holland relates ranges of linear shrinkage and plasticity index for both arid to semi-arid and humid climatic areas to a low moderate or high potential for volume change as shown in Table1.
Table 1: Classification of expansive soils (Holland, 1981).
Potential Volume Change
Arid to Semi-Arid Climatic Areas Humid Climatic Are as Linear Shrinkage (%)
Plasticity Index (%)
Linear Shrinkage (%)
Plasticity Index (%)
Low 0 to 5 0 to 15 0 to 12 0 to 30 Medium 5 to 12 15 to 30 12 to 18 30 to 50 High >12 >30 >18 >50
The method presented in AS 2870 enables the potential surface movement to be estimated. This calculation requires the use of the shrink swell index, estimation of a depth of seasonal movement and use of a winter to summer suction variation. The code also suggests that the depth of cracking in a clay profile be estimated and the strain behaviour modified accordingly. A typical calculation for a site in the south-west region is presented in Figure 3.

PROBLEM SOILS – A WEST AUSTRALIAN PERSPECTIVE F DAVENPORT
Australian Geomechanics Vol 42 No 3 September 2007 4
Assume: depth of cracked zone = 0.5 m 0.1=α in cracked zone In uncracked zone:
At 0.5 m depth 9.15
5.00.2 =−=α
At 2.0 m depth 6.15
0.20.2 =−=α
Average 75.1=α
i) Cracked zone
HIuy sssc∆= α
mm9.8500100
7.1
0.2
9.02.10.1 =××+×=
ii) Uncracked zone
mmyus 1.201500
100
7.1
0.2
9.075.1 =×××=
Hence mmyc 299.81.20 =+=Σ
''MClass∴
Figure 3: Typical Calculation of Shrink-Swell Movement.
The code provides a depth of seasonal movement of 3.0 m for Perth and a winter to summer suction range of 1.2 pF.
3.2 COLLAPSIBLE SOILS Several methods have been developed over the years to predict the likely movement associated with collapse of a soil structure due to inundation. One method developed by Jennings and Knight (1975) and commonly in use determines a collapse potential and relates this to a severity of problem associated with the movement. The severity ranges from no problem to a very severe trouble category as shown in Table 2.
Table 2: Classification of collapsible soils (Jennings and Knight, 1975).
Collapse Potential (%) Severity of Collapse Problem 0 – 1 No problem 1 – 5 Moderate trouble 5 – 10 Trouble 10 – 20 Severe trouble
>20 Very severe trouble
4 LOCAL RELATIONSHIPS FOR CLAY SOILS It is not common practice in Western Australia to undertake shrink swell tests to determine the shrink swell index. This is due to the cost involved, the need for an undisturbed sample to be obtained and the limited number of soils laboratories set up to do this type of test.
In light of this, Golder Associates Perth office have developed relationships between shrink swell index and plasticity index for Guildford Formation clays based on field and laboratory investigation results. They have been developed for the full suite of data collected. Relationships have also been developed for “Darling Range” clays, “Wheatbelt” clays, “Goldfields” clays and “South-West” clays. These relationships are presented in Figures 4 to 9
∆þF = 0.9

PROBLEM SOILS – A WEST AUSTRALIAN PERSPECTIVE F DAVENPORT
Australian Geomechanics Vol 42 No 3 September 2007 5
Instability Index vs Plasticity Index
y = 0.0727x + 0.0453
R2 = 0.3376
0
2
4
6
8
10
0 20 40 60 80 100
Plasticity Index (%)
Inst
abilit
y In
dex
, Iss
Figure 4: Instability vs Plasticity Index – All Data.
Instability Index Versus Plasticity IndexGuildford Formation Area
y = 0.131x - 1.7545
0
2
4
6
8
10
0 20 40 60 80 100
Plasticity Index (%)
Inst
abili
ty In
dex,
Iss
Figure 5: Instability vs Plasticity Index – Guildford Formation.
Instability Index Versus Plasticity IndexDarling Range Region
y = 0.0551x
0
2
4
6
8
10
0 20 40 60 80 100
Plasticity Index (%)
Inst
abili
ty In
dex
, Is
s
Figure 6: Instability vs Plasticity Index – Darling Range Region.

PROBLEM SOILS – A WEST AUSTRALIAN PERSPECTIVE F DAVENPORT
Australian Geomechanics Vol 42 No 3 September 2007 6
Instability Index Versus Plasticity IndexGoldfields Region
y = 0.105x - 1.6887
0
2
4
6
8
10
0 20 40 60 80 100
Plasticity Index (%)
Inst
abili
ty In
dex,
Iss
Figure 7: Instability vs Plasticity Index – Goldfields Region
Instability Index Versus Plasticity IndexWheatbelt Region
y = 0.1359x - 2.0785
0
2
4
6
8
10
0 20 40 60 80 100
Plasticity Index (%)
Inst
abili
ty In
dex,
Iss
Figure 8: Instability vs Plasticity Index – Wheatbelt Region
Instability Index Versus Plasticity IndexSouth West Region
y = 0.0416x + 0.9591
0
2
4
6
8
10
0 20 40 60 80 100
Plasticity Index (%)
Inst
abili
ty In
dex,
Iss
Figure 9: Instability vs Plasticity Index – South West Region.
PROBLEM SOILS – A WEST AUSTRALIAN PERSPECTIVE F DAVENPORT
Australian Geomechanics Vol 42 No 3 September 2007 7
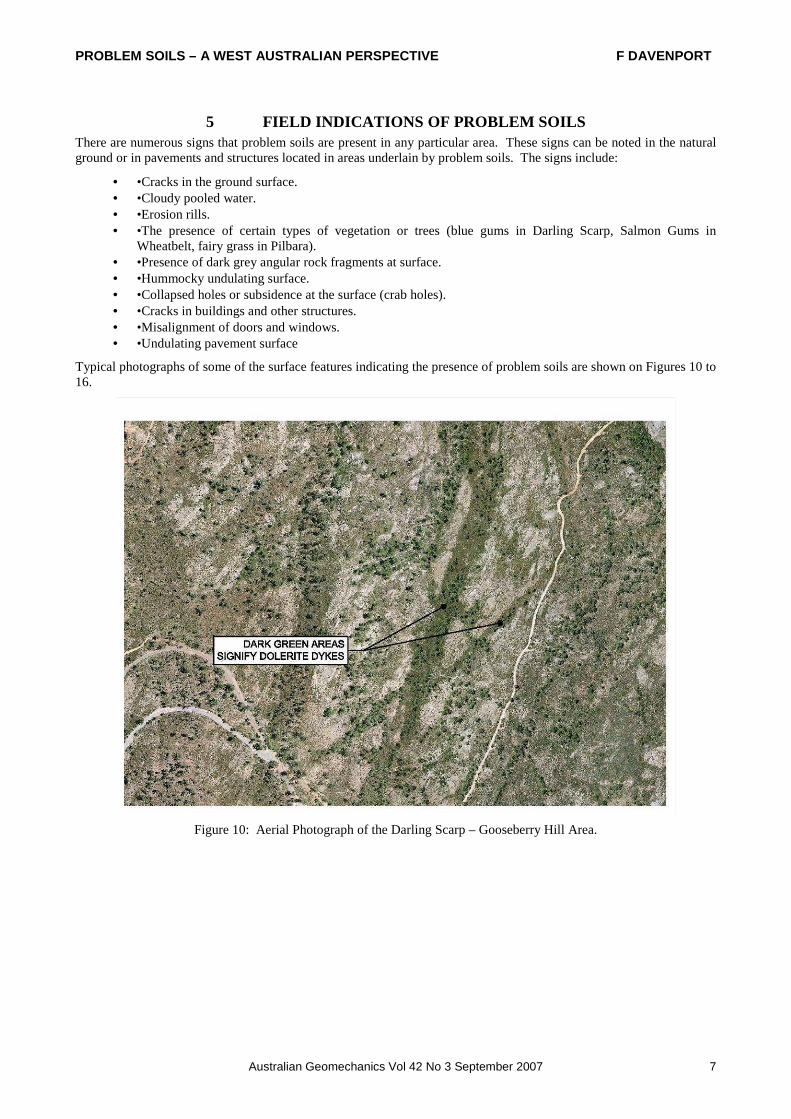
5 FIELD INDICATIONS OF PROBLEM SOILS There are numerous signs that problem soils are present in any particular area. These signs can be noted in the natural ground or in pavements and structures located in areas underlain by problem soils. The signs include:
• •Cracks in the ground surface. • •Cloudy pooled water. • •Erosion rills. • •The presence of certain types of vegetation or trees (blue gums in Darling Scarp, Salmon Gums in
Wheatbelt, fairy grass in Pilbara). • •Presence of dark grey angular rock fragments at surface. • •Hummocky undulating surface. • •Collapsed holes or subsidence at the surface (crab holes). • •Cracks in buildings and other structures. • •Misalignment of doors and windows. • •Undulating pavement surface
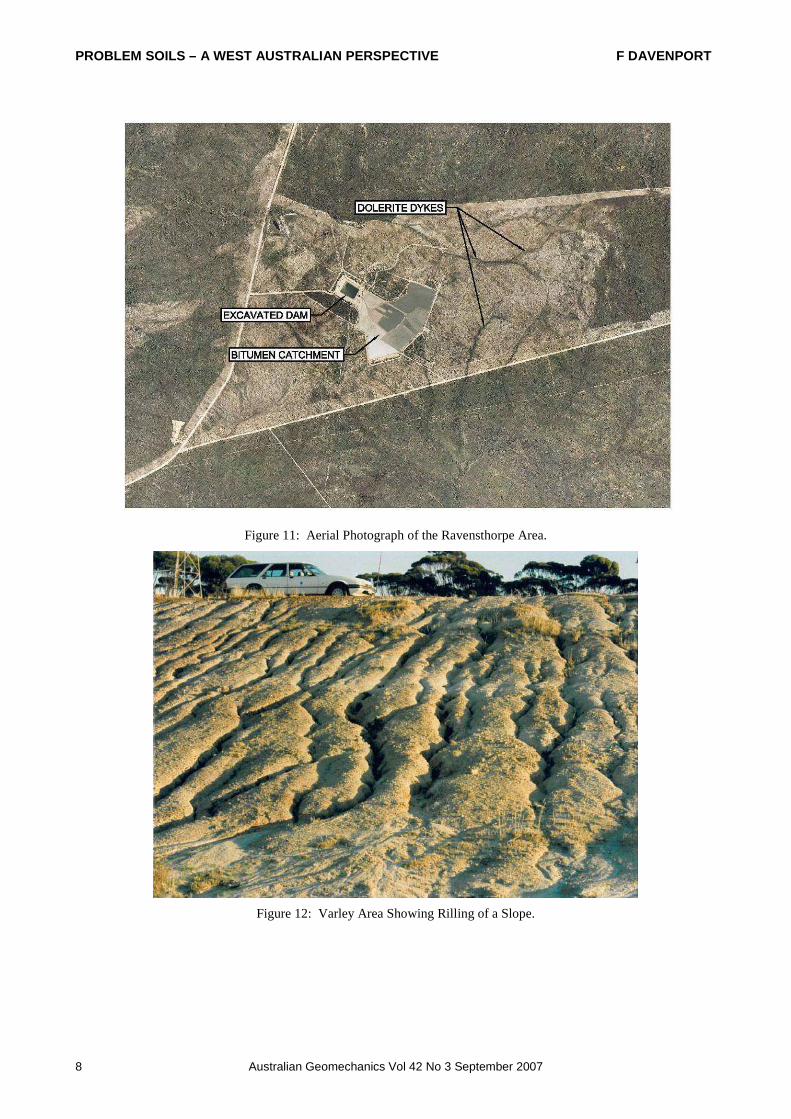
Typical photographs of some of the surface features indicating the presence of problem soils are shown on Figures 10 to 16.
Figure 10: Aerial Photograph of the Darling Scarp – Gooseberry Hill Area.
PROBLEM SOILS – A WEST AUSTRALIAN PERSPECTIVE F DAVENPORT
Australian Geomechanics Vol 42 No 3 September 2007 8
Figure 11: Aerial Photograph of the Ravensthorpe Area.
Figure 12: Varley Area Showing Rilling of a Slope.

PROBLEM SOILS – A WEST AUSTRALIAN PERSPECTIVE F DAVENPORT
Australian Geomechanics Vol 42 No 3 September 2007 9
Figure 13: Varley Area Showing Dispersive Failure.
Figure 14: Newman Area showing the Typical Vegetation Associated with Gilgai.

PROBLEM SOILS – A WEST AUSTRALIAN PERSPECTIVE F DAVENPORT
Australian Geomechanics Vol 42 No 3 September 2007 10
Figure 15: Gilgai Soil Collapse in Newman.
Figure 16: Gilgai Soil Collapse in Newman.
6 EXPANSIVE CLAY RESEARCH The potential ground surface movement calculated is highly dependent on the depth of seasonal movement used. This depth is best assessed by establishing the soil suction profile. Unfortunately there has been little research undertaken on clay soils in Western Australia to determine soil suction profiles and depths of seasonal movements for the various climatic regions of the state.
A paper by Walsh et al. in Australian Geomechanics December 1998, publication (Walsh et al., 1998), proposed that up to six climatic zones be recognised in the southwest region of Western Australia and that the depth of seasonal movement may vary accordingly. The zones are indicated on a map of WA, which is presented in Figure 17. A depth of seasonal movement is provided for each of the six climatic zones. Caution must be exercised in using this data.

PROBLEM SOILS – A WEST AUSTRALIAN PERSPECTIVE F DAVENPORT
Australian Geomechanics Vol 42 No 3 September 2007 11
Figure 17: Climatic Zones in Western Australia from Walsh et al. (1998).

PROBLEM SOILS – A WEST AUSTRALIAN PERSPECTIVE F DAVENPORT
Australian Geomechanics Vol 42 No 3 September 2007 12
Figure 18: Idealised Distribution of Suction Below a Pavement.
The Water Corporation (and formerly the Public Works Department) had been experiencing severe cracking and distortion of bitumen paved catchment areas constructed on clay type soils in Wheatbelt areas. This problem had occurred primarily on bitumen catchments constructed in Ongerup, Jerramungup, Borden, Lake King, Salmon Gums and Ravensthorpe. The distortion at the surface had led to at least two catchment areas in Ravensthorpe being abandoned. A 5 year research study was undertaken by the Water Corporation over the period 1982 to 1987. The study aimed to establish soil suction profiles below the bitumen surface and the summer to winter variation to a depth of 5 m below selected bitumen paved catchments located on clay soils. Idealised soil suction profiles expected are shown on Figure 18. Also shown on the figure are the soil suction profiles expected following construction of the bitumen surface as the subgrade would be expected to reach an equilibrium condition. Each of the catchments was drilled at the end of summer and winter and samples collected for soil suction and classification testing. The locations selected were at Ravensthorpe, Lake King and Jerramungup, which had all experienced rapid deterioration and failure of the pavements due to shrink swell movements associated with expansive clays.
These studies showed that the soil suction profiles were in reasonable agreement with the idealised profiles. The study also showed that the depth of seasonal movement was in the order of 4 m. The location of Ravensthorpe, Lake King and Jerramungup and the other catchments mentioned above are shown on Figure 19. The results of plasticity testing carried out on selected samples from some of the areas mentioned above are presented in a plasticity chart presented as Figure 20.
The depth of seasonal movement for Ravensthorpe, Lake King and Jerramungup predicted from Walsh’s map and that measured in the field are presented in Table 3.
Table 3: Depth of seasonal movement.
Location Depth of Seasonal Movement (m) From Field Soil Suction Measurements According to Walsh
Lake King 4.0 3.0 Jerramungup 4.0 1.8 Ravensthorpe 4.0 2.3

PROBLEM SOILS – A WEST AUSTRALIAN PERSPECTIVE F DAVENPORT
Australian Geomechanics Vol 42 No 3 September 2007 13
Figure 19: Bitumen Catchment Locations in South West and South East Western Australia
Figure 20: Plasticity chart for Soils from Bitumen Catchments in South West and South East Western Australia.

PROBLEM SOILS – A WEST AUSTRALIAN PERSPECTIVE F DAVENPORT
Australian Geomechanics Vol 42 No 3 September 2007 14
7 COLLAPSING SOIL STUDY Golder Associates Perth office carried out a two stage investigation for the proposed Pilbara Energy Project near South Hedland. The site is approximately 5 km south-west of South Hedland and covers an area of 16 hectares. The location of the site in relation to the surrounding area is shown on Figure 21. The ultimate plan was to construct 4 gas turbines, which would cover an area of about 5,000 m2. A view of the proposed set up of the gas turbines is shown on Figure 22.
Figure 21: Location of Site.

PROBLEM SOILS – A WEST AUSTRALIAN PERSPECTIVE F DAVENPORT
Australian Geomechanics Vol 42 No 3 September 2007 15
Figure 22: Proposed Gas Turbine Setup.
Collapsing soils were known to be present in the area. Of note were large settlements experienced at Western Power’s nearby Hedland Terminal Substation. The first stage field investigation comprised boreholes, test pits, trenches at various levels below ground surface, in situ density testing and plate load testing.
The plate load tests provided the most dramatic evidence of the presence of collapsing soils. The tests undertaken comprised loading the ground with a stack of steel plates, setting up four gauges to record settlement of the plates then inundating the foundation soil. Typical photographs of the test set up and the plates at the conclusion of a typical test are presented in Figures 23 and 24.
Large settlements occurred which in some cases could not be recorded due to total failure of the foundation. A typical time settlement plot for a plate load test applying 50 kPa to the ground at 0.5 m after wetting of the foundation is presented on Figure 25.
The study identified the following potential for collapse settlements in the soil profile:
• •0 to 1 m High potential for collapse. • •1 to 2 m Low potential for collapse. • •2 to 3 m Generally do not display collapse.

PROBLEM SOILS – A WEST AUSTRALIAN PERSPECTIVE F DAVENPORT
Australian Geomechanics Vol 42 No 3 September 2007 16
Figure 23: Plate Load Testing – Various Depths.

PROBLEM SOILS – A WEST AUSTRALIAN PERSPECTIVE F DAVENPORT
Australian Geomechanics Vol 42 No 3 September 2007 17
Figure 24: Plate Load Testing – Near Surface.
Figure 25: Typical Plate Load Test Results.
-5
0
5
10
15
20
25
30
35
40
45
0 10 20 30 40 50 60 70 80
Time (minutes)
Set
tlem
ent (
mm
)
Gauge 1
Gauge 2
Gauge 3
Average

PROBLEM SOILS – A WEST AUSTRALIAN PERSPECTIVE F DAVENPORT
Australian Geomechanics Vol 42 No 3 September 2007 18
The second stage of the study was carried out to establish the appropriate remedial works required to deal with the potential problem. Removal and replacement in an engineered manner of the potentially collapsing soils was carried out to a depth of about 2 m. Selected locations of the surface of the site was then saturated for 4 days then loaded. The field set up of the testing during saturation of the surface is presented in Figure 26. A conventional plate load test applying load to a circular steel plate by jacking against a kentledge was carried out on the saturated ground. The tests included an intermediate unload reload loop and a final unloading stage. A typical load settlement plot is presented in Figure 27.
Figure 26: Trial Foundation Testing.

PROBLEM SOILS – A WEST AUSTRALIAN PERSPECTIVE F DAVENPORT
Australian Geomechanics Vol 42 No 3 September 2007 19
Figure 27: Stage 2 – Typical Plate Load Test Results (Foundation saturated for 4 days).
The Stage 2 study showed that settlements were less than 1 mm and 2 mm for loads up to 100 kPa and 250 kPa respectively.
Based on the Stage 2 studies the methodology adopted for the earthworks was:
7.1 GAS TURBINES:
• excavate to 2 m depth. • compact exposed surface. • place and compact in layers – excavated soil with 2% cement to 95% Modified.
7.2 ROADS AND PAVEMENTS
• excavate to 1 m depth. • compact exposed surface. • place and compact in layers – excavated soil to 95% Modified.
8 CONCLUDING COMMENTS Some experience regarding problem soils in Western Australia has been recorded in the above. These soils cover a large area of Western Australia and their presence can lead to expensive maintenance. Engineers who work in this area should be encouraged to report case histories and to generate reliable field and laboratory data.
9 REFERENCES CSIRO, 1972, “A Handbook of Australian Soils”, Relim Technical Publications, Glenside, South Australia. Holland, J., 1981 “The Design, Performance and Repair of Housing Foundations”, Swinbourne Institute of Technology,
November. Jennings, J.E. & Knight, K.A., 1975, “A Guide to Construction on or with Materials Exhibiting Additional Settlement
due to ‘Collapse’ of Grain Structure”, Sixth Regional Conference for Africa on Soil and Foundation Engineering, Durban, South Africa.
Van der Merwe, D.H., 1964, “The Prediction of Heave from the Plasticity Index and Percentage Clay Fraction of Soils”, The Civil Engineer in South Africa, South Africa Institute Civil Engineers., 6, 103-16.
Walsh, P. et al., 1998 “A Note on the Depth of Design Suction Change for Clays in South Western Australia and South Eastern Queensland”, Australian Geomechanics, Vol 33 No. 3, December 1998.
0.0
0.5
1.0
1.5
2.0
2.5
0 50 100 150 200 250 300 350
Applied Load (kPa)
Set
tlem
ent (
mm
)

PROBLEM SOILS – A WEST AUSTRALIAN PERSPECTIVE F DAVENPORT
Australian Geomechanics Vol 42 No 3 September 2007 20