problem 1. (10pts) and h3k9ac. which histone mark would...
TRANSCRIPT

Problem 1. (10pts) A. (5pts) Your colleague professor Eugene Mathew Lateed generated a genome-wide DNA methylation map for normal colon cells using MRE-seq and MeDIP-seq. In an intergenic region, he found an interesting locus. This locus is about 20kb. On one end of the locus, there is a 2kb CpG rich stretch that has both intermediate MRE-seq and MeDIP-seq signals. The rest 18kb has high level of MeDIP-seq signals. Based on what you learnt in class, you suspect that this region encodes for a novel gene. Why do you suspect so? You decide to look at histone modification patterns across this region for more evidence. There are several genome-wide datasets available for this cell type: H3K4me1, H3K4me3, H3K27me3, H3K9me3, H3K36me3, and H3K9Ac. Which histone mark would you investigate for this locus and why? Can you suggest least one other types of data that may help you? Why you think it can help?

B (5pts). You decide to use bisulfate sequencing to validate the methylation status of the 2kb region that has both intermediate MRE-seq and MeDIP-seq signal. Bisulfate treatment will convert unmethylated C to U, and sequenced as T. You did this experiment in both normal colon cells and a colon cancer cell line. Here is some data after aligning bisulfate reads to the region. For simplicity, we only consider data on one strand. Template: GATCGTGCACGATCTCGGCAATTCGGGATGCCGGCTCGTCACCGGTCGCT Reads(normal) GATTGTGTATGATTTTGGTAATTTGGG GATTGTGTATGATTTTGGTAATTTGGG GATTGTGTATGATTTTGGTAATTTGGG
GATCGTGTACGATTTCGGTAATTCGGG GATCGTGTACGATTTCGGTAATTCGGG GATCGTGTACGATTTCGGTAATTCGGG GATTGTGTATGATTTCGGTAATTCGGG GATCGTGTACGATTTCGGTAATTCGGG GATTGTGTATGATTTCGGTAATTCGGG GATCGTGTACGATTTCGGTAATTCGGG GTATGATTTTGGTAATTTGGGATGTTGGTTTG GTACGATTTCGGTAATTCGGGATGTCGGTTCG GTACGATTTCGGTAATTCGGGATGTCGGTTCG GTACGATTTCGGTAATTCGGGATGTCGGTTCG GTACGATTTCGGTAATTCGGGATGTCGGTTCG GTATGATTTTGGTAATTTGGGATGTTGGTTTG GTATGATTTTGGTAATTTGGGATGTTGGTTTG GTATGATTTTGGTAATTTGGGATGTTGGTTTG GTATGATTTTGGTAATTTGGGATGTTGGTTTG GTATGATTTTGGTAATTTGGGATGTTGGTTTG CGGGATGTCGGTTCGTTATCGGTCGTT CGGGATGTCGGTTCGTTATCGGTCGTT CGGGATGTCGGTTCGTTATCGGTCGTT CGGGATGTCGGTTCGTTATCGGTCGTT TGGGATGTTGGTTTGTTATTGGTTGTT TGGGATGTTGGTTTGTTATTGGTTGTT CGGGATGTCGGTTCGTTATCGGTCGTT TGGGATGTTGGTTTGTTATTGGTTGTT TGGGATGTTGGTTTGTTATTGGTTGTT TGGGATGTTGGTTTGTTATTGGTTGTT
Template: GATCGTGCACGATCTCGGCAATTCGGGATGCCGGCTCGTCACCGGTCGCT Reads(cancer) GATCGTGTACGATTTCGGTAATTCGGG
GATCGTGTACGATTTCGGTAATTCGGG GATCGTGTACGATTTCGGTAATTCGGG GATCGTGTACGATTTCGGTAATTCGGG GATCGTGTACGATTTCGGTAATTCGGG GATCGTGTACGATTTCGGTAATTCGGG GATCGTGTACGATTTCGGTAATTCGGG GATCGTGTACGATTTCGGTAATTCGGG GATCGTGTACGATTTCGGTAATTCGGG GATCGTGTACGATTTCGGTAATTCGGG GTACGATTTCGGTAATTCGGGATGTCGGTTCG GTACGATTTCGGTAATTCGGGATGTCGGTTCG GTACGATTTCGGTAATTCGGGATGTCGGTTCG GTACGATTTCGGTAATTCGGGATGTCGGTTCG GTACGATTTCGGTAATTCGGGATGTCGGTTCG GTACGATTTCGGTAATTCGGGATGTCGGTTCG GTACGATTTCGGTAATTCGGGATGTCGGTTCG GTACGATTTCGGTAATTCGGGATGTCGGTTCG GTACGATTTCGGTAATTCGGGATGTCGGTTCG

GTACGATTTCGGTAATTCGGGATGTCGGTTCG CGGGATGTCGGTTCGTTATCGGTCGTT CGGGATGTCGGTTCGTTATCGGTCGTT CGGGATGTCGGTTCGTTATCGGTCGTT CGGGATGTCGGTTCGTTATCGGTCGTT CGGGATGTCGGTTCGTTATCGGTCGTT CGGGATGTCGGTTCGTTATCGGTCGTT CGGGATGTCGGTTCGTTATCGGTCGTT CGGGATGTCGGTTCGTTATCGGTCGTT CGGGATGTCGGTTCGTTATCGGTCGTT CGGGATGTCGGTTCGTTATCGGTCGTT
Please calculate level of methylation, defined as percentage methylated, of the 8 CpG sites in both normal cells and in cancer cells. Based on this data, you suggest to professor Lateed that this promoter is potentially imprinted. Why? Describe how you might obtain additional support for the imprinted status of this promoter. What is the observed change in cancer cells? If this novel gene plays a role in tumorigenesis, do you think it is a tumor suppressor gene or an oncogene? Why? Propose at least two mechanisms leading to the observed change.

Problem 2 (10 pts) Two recent papers addressed conservation and divergence of methylation patterning in plants and animals. Whole genome bisulfite sequencing was performed on 8 organisms. In the question, you will study figures from one of the papers, and describe your conclusion. Figure 1: phylogenetic relationship of 8 species used in study. Figure 2: DNA methylation pattern on genes. Figure 3: DNA methylation pattern on repeats. Figure 4: DNA methylation pattern of exons and introns. Questions:
(1) Describe general DNA methylation pattern in and around genes, repeats. (2) What kind of DNA methylation pattern around genes and repeats would you
expect to observe in (a) the last common ancestor of animals; (b) the last common ancestor of plants (c) the last common ancestor of animal and plants?
(3) Exon/intron boundaries are recognized in splicing, which happens post-transcription on RNA; DNA methylation happens on the genome. Give a hypothesis that explains why there is difference in methylation between exons and introns.
Fig. 1. Eight eukaryotic organisms used in this study. Tree topology is from NCBI Taxonomy. All tissues are wild type.
!"#$%&'(
)&%"*'(
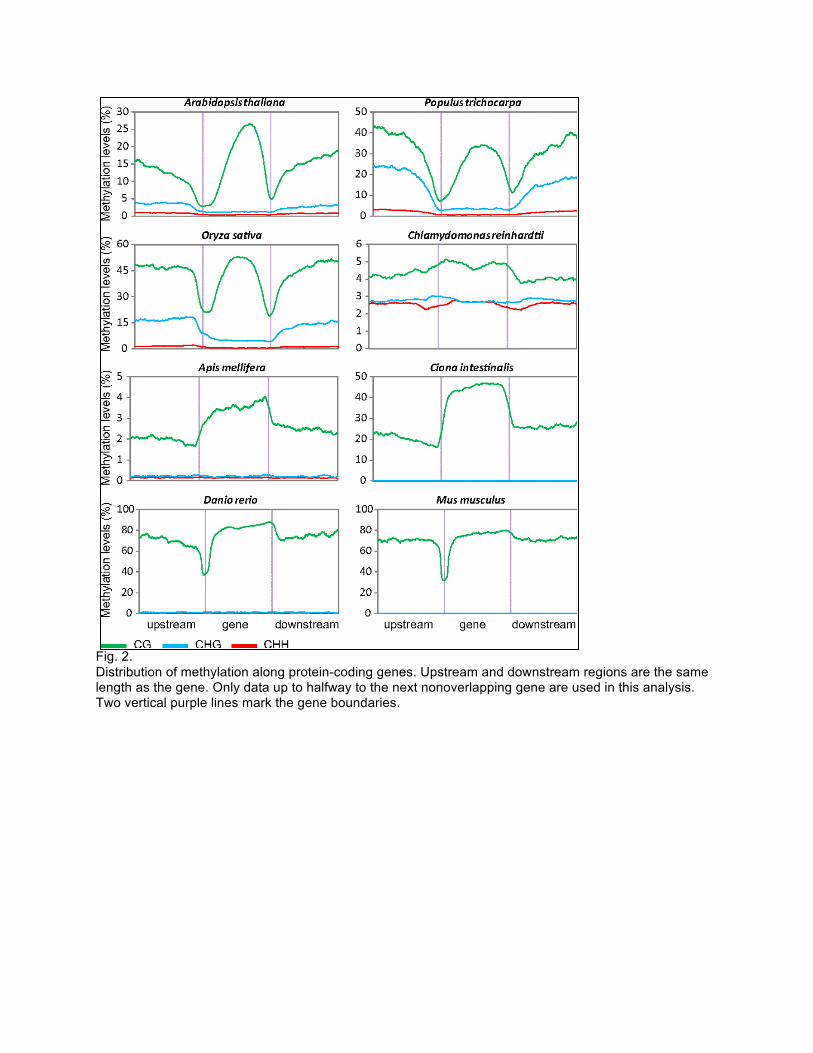
Fig. 2. Distribution of methylation along protein-coding genes. Upstream and downstream regions are the same length as the gene. Only data up to halfway to the next nonoverlapping gene are used in this analysis. Two vertical purple lines mark the gene boundaries.

Fig. 3. Distribution of methylation along repetitive DNA. Upstream and downstream regions are the same length as the repeat. Only data up to halfway to the next nonoverlapping repeat are used in this analysis. Two vertical purple lines mark the repeat boundaries.
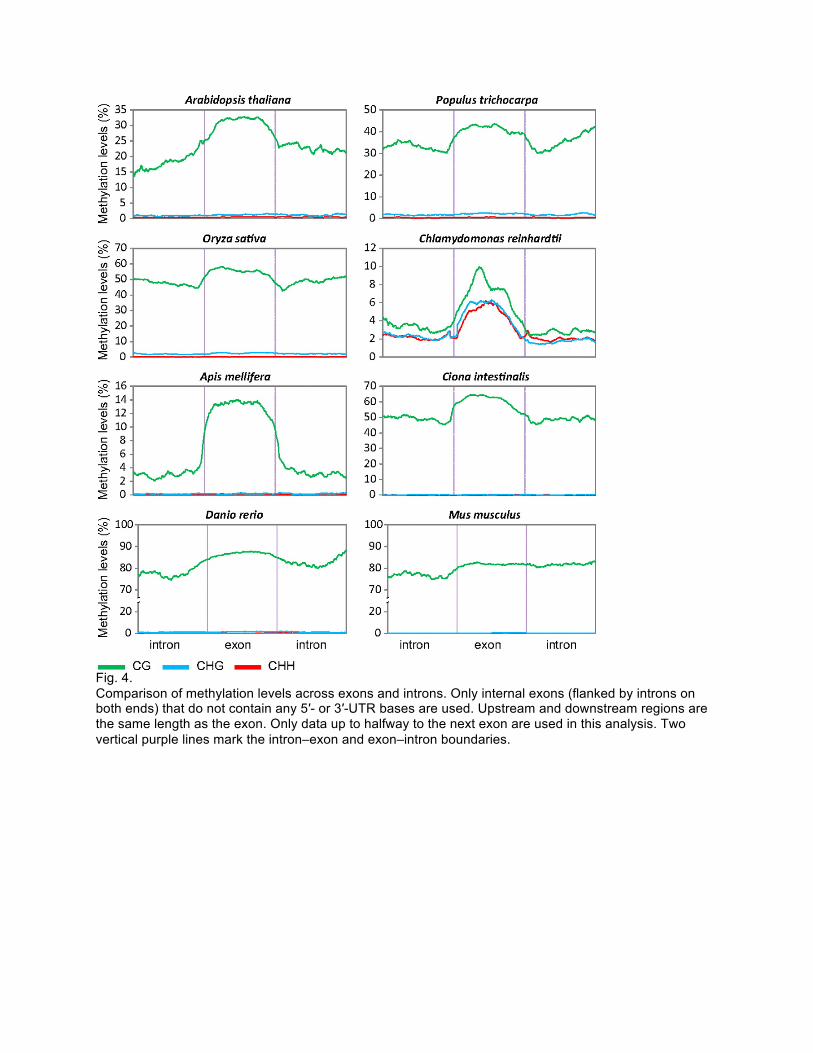
Fig. 4. Comparison of methylation levels across exons and introns. Only internal exons (flanked by introns on both ends) that do not contain any 5′- or 3′-UTR bases are used. Upstream and downstream regions are the same length as the exon. Only data up to halfway to the next exon are used in this analysis. Two vertical purple lines mark the intron–exon and exon–intron boundaries.
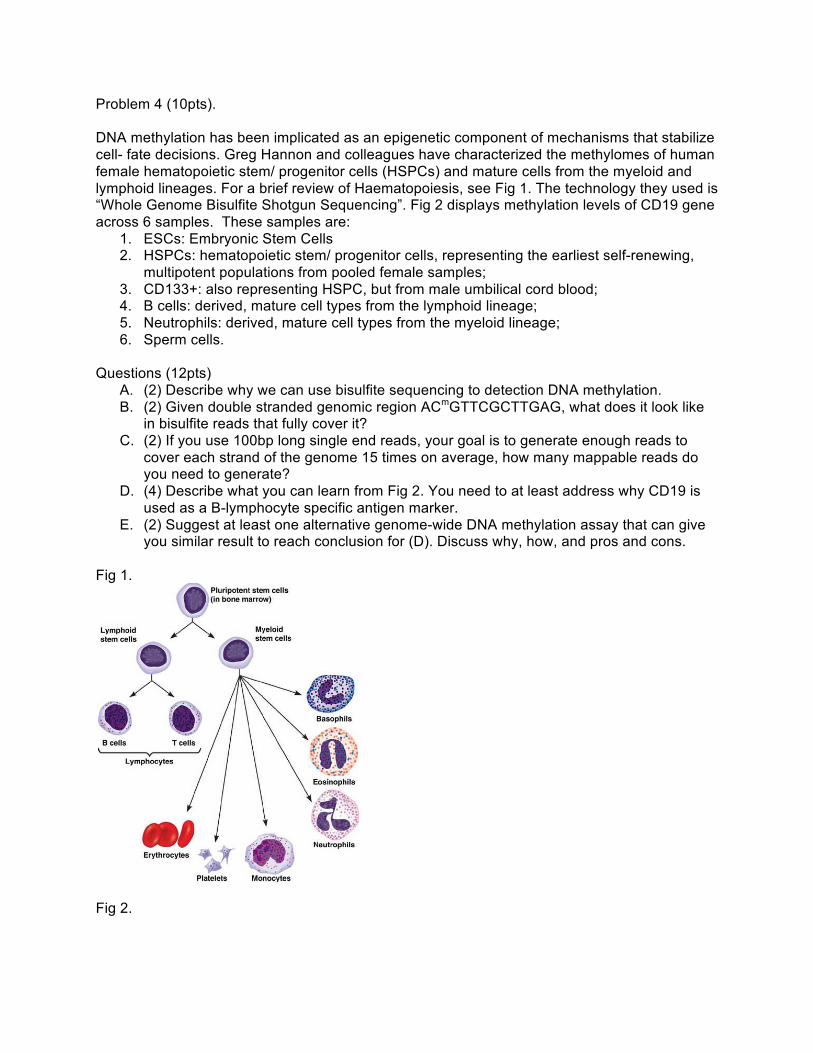
Problem 4 (10pts). DNA methylation has been implicated as an epigenetic component of mechanisms that stabilize cell- fate decisions. Greg Hannon and colleagues have characterized the methylomes of human female hematopoietic stem/ progenitor cells (HSPCs) and mature cells from the myeloid and lymphoid lineages. For a brief review of Haematopoiesis, see Fig 1. The technology they used is “Whole Genome Bisulfite Shotgun Sequencing”. Fig 2 displays methylation levels of CD19 gene across 6 samples. These samples are:
1. ESCs: Embryonic Stem Cells 2. HSPCs: hematopoietic stem/ progenitor cells, representing the earliest self-renewing,
multipotent populations from pooled female samples; 3. CD133+: also representing HSPC, but from male umbilical cord blood; 4. B cells: derived, mature cell types from the lymphoid lineage; 5. Neutrophils: derived, mature cell types from the myeloid lineage; 6. Sperm cells.
Questions (12pts)
A. (2) Describe why we can use bisulfite sequencing to detection DNA methylation. B. (2) Given double stranded genomic region ACmGTTCGCTTGAG, what does it look like
in bisulfite reads that fully cover it? C. (2) If you use 100bp long single end reads, your goal is to generate enough reads to
cover each strand of the genome 15 times on average, how many mappable reads do you need to generate?
D. (4) Describe what you can learn from Fig 2. You need to at least address why CD19 is used as a B-lymphocyte specific antigen marker.
E. (2) Suggest at least one alternative genome-wide DNA methylation assay that can give you similar result to reach conclusion for (D). Discuss why, how, and pros and cons.
Fig 1.
Fig 2.

Scalechr16:
10 kb28850000 28855000 28860000
RefSeq GenesUCSC CpG Islands
CGIs (HMM-based)ESC HMRs
HSPC HMRs
CD133 HMRs
BCell HMRs
Neut HMRs
Sperm HMRs
CD19
ESCs1
0
HSPCs
CD133+
B Cells
Neutrophils
Sperm
1
0
1
0
1
0
1
0
1
0
Met
hyla
tion
Leve
l
Individual CpG Sites
Scalechr19:
10 kb38475000 38480000 38485000
RefSeq Genes
UCSC CpG Islands
CGIs (HMM-based)
ESC HMRs
HSPC HMRs
CD133 HMRs
BCell HMRs
Neut HMRs
Sperm HMRs
CEBPALOC80054
ESCs1
0
HSPCs
CD133+
B Cells
Neutrophils
Sperm
1
0
1
0
1
0
1
0
1
0
Met
hyla
tion
Leve
l
Individual CpG Sites
A
B
UCSC CGI
SpermNeutrophil
3244454137
9330
7800405 1606
18415
HSPC
NeutrophilB cell
92447345
1384
2633
1486 10145
41720
C
Spe
rm
ES
C
BC
ell
CD
133
HS
PC
Neu
t0.0
0.4
0.8
1.2
Hei
ght
D
Figure 1. Features of Methylomes in Hematopoietic Cells(A and B) Genome browser tracks depict methylation profiles across a lymphoid (A) and myeloid (B) specific locus in blood cells, ESCs, and sperm. Methylation
frequencies, ranging between 0 and 1, of unique reads covering individual CpG sites are shown in gray with identified hypomethylated regions (HMRs) indicated
Molecular Cell
Human Hematopoietic Methylomes
18 Molecular Cell 44, 17–28, October 7, 2011 ª2011 Elsevier Inc.