probing understanding in physical geology using concept ... · production skills required for...
TRANSCRIPT

ABSTRACT
Using concept maps and clinical interviews, we assessedthe extent to which undergraduate students restructuretheir conceptual knowledge at progressively moresophisticated levels over the course of a two-semesterlecture-based physical geology sequence. Studentscompleted concept mapping exercises and clinicalinterviews at regular intervals throughout the twosemesters and data indicated that the course did notaddress integration of concepts into student knowledgedomains. Concept maps and clinical interviews bothillustrated acquisition of geologic conceptslongitudinally with a disproportionately small increasein integration of those concepts into frameworks ofunderstanding. However, concept maps and clinicalinterviews appear to be viable and complementaryapproaches in determining the degree to which studentaccomplishment objectives are being met.
INTRODUCTION
A vast number of assessment techniques have beenproposed for evaluating the effects of science courses atthe high school and university levels (e.g. Slater et al.,1997; Kahn, 2000; Ma, 2000; Thelwall, 2001). But to ourknowledge no previous study has addressed a formativeassessment of a university-level geology course. LakeSuperior State University received a National ScienceFoundation grant in 1999 to support a restructuring of itsentire undergraduate geology curriculum, with the goalsof constructing a curriculum that integrates geosciencedisciplines, emphasizing problem solving, criticalthinking, and active learning strategies, and developinga viable assessment strategy for undergraduate geologycurricula (see Kelso et al., 2000; 2001; Englebrecht et al.,2001). In this paper we illustrate the use of conceptmapping and Piagetian-type clinical interviews andperformance tasks (Novak and Gowin, 1984) as anassessment strategy for documenting change inconceptual knowledge and geological understandings.In addition, this work establishes a set of comparativedata drawn from our traditional, lecture-based physicalgeology course that will be used to expand on our modelof formative assessment and document the effects of thecurricular changes.
Goldsmith and Johnson (1990) described an idealassessment task as one that is objective, reliable,minimizes influence of context on responses, andcaptures some of the structural nature of the subjects'knowledge. Many techniques exist for assessingknowledge structure (Goldsmith et al., 1991; Jonassen et
al., 1993). Although traditional objective formats such asmultiple-choice or short answer questions may bereliable and relatively consistent assessment measures,student responses are strongly constrained, and thislimitation may mask differences in the organization ofknowledge. Traditional subjective measures such asessays, reports, presentations, or projects reduce theconstraint on student responses, thereby allowing thestructure of their knowledge to be expressed, but thequality of the responses may be influenced by factorsunrelated to their knowledge of the subject matter(McClure et al., 1999), and scoring procedures may beproblematic. Concept mapping and clinical interviewscan balance these two constraints.
Student understanding in science is associated witha knowledge structure that reflects an abundant set ofrelations among important concepts (Baxter et al., 1997;Mintzes et al., 1997), and concept maps have been used toassess the complexity of student knowledge structures inmany sciences (Heinze-Fry et al., 1984; Novak, 1984;Moreira, 1985; White & Gunstone, 1992; Ruiz-Primo &Shavelson, 1996; Schau and Mattern, 1997; Rice et al.,1998). Concept maps are two-dimensionalrepresentations of a set of concepts and theirrelationships, in which concepts are depicted as labelednodes and relationships between concepts as labeledlinks. Concepts and links in sequence form simplepropositions through the words in the nodes and links(Novak, 1998) and can be used to represent theknowledge of an individual (Novak and Gowin, 1984).For example, a concept node labeled "rock" connected toa concept node labeled "mineral" via the linking words"composed of" form the simple proposition, "rock iscomposed of minerals."
Concept maps are useful for diagnosing studentmisunderstanding because they are sensitive to thestructural nature of student knowledge, intrusions ordistortions in student understanding, and errors ofomission and commission (Surber, 1984). In addition,production skills required for concept map constructionare relatively simple compared to those required fortraditional subjective assessment tasks (McClure et al.,1999). By incorporating concept map construction intothe classroom experience and making the maps a "workin progress" to construct in stages over some period oftime, the diagrams can be reviewed by studentsperiodically, thus promoting externalization andrestructuring of knowledge (Gobert and Clement, 1999;Gobert, 2000). Further, the facilitator can review thediagrams as a method of formative assessment and adaptteaching methods and content to meet student needs.
Interview formats range from highly flexible tohighly standardized, as a result of the variance in both
Englebrecht et al. - Concept Maps in Physical Geology 263
Probing Understanding in Physical Geology Using Concept Mapsand Clinical Interviews
Amy C. Englebrecht Department of Geology and Physics, Lake Superior State University, Sault Ste.Marie, MI 49783, [email protected]
Joel J. Mintzes Department of Biology, University of North Carolina - Wilmington, Wilmington,NC 28403, [email protected]
Lewis M. Brown Department of Geology and Physics, Lake Superior State University, Sault Ste.Marie, MI 49783, [email protected]
Paul R. Kelso Department of Geology and Physics, Lake Superior State University, Sault Ste.Marie, MI 49783, [email protected]
questions and tasks asked of each student. The degree offlexibility in interview structure results in records usefulfor different purposes (Novak and Gowin, 1984) and theuse of follow-up questions and critical discussion allowsa more complete understanding of the respondent'sknowledge (Coleman, 1998). Incorporating conceptmaps as prompts during interview sessions facilitates theexternalization of understandings (White and Gunstone,1992; Rye and Rubba, 1998) and although individuals
may differ in their ability to recall information, a conceptmap, by providing an external representation ofstructural knowledge, potentially extends workingmemory and encourages critical thinking. This maytrigger recognition and increase the recall of knowledgeheld in long-term memory (Ausubel et al., 1978).
Evidence suggests (e.g. Eiser, 1980, Aron et al., 1994)that every student begins introductory geology with anestablished system of beliefs, derived from years of
264 Journal of Geoscience Education, v. 53, n. 3, May, 2005, p. 263-270
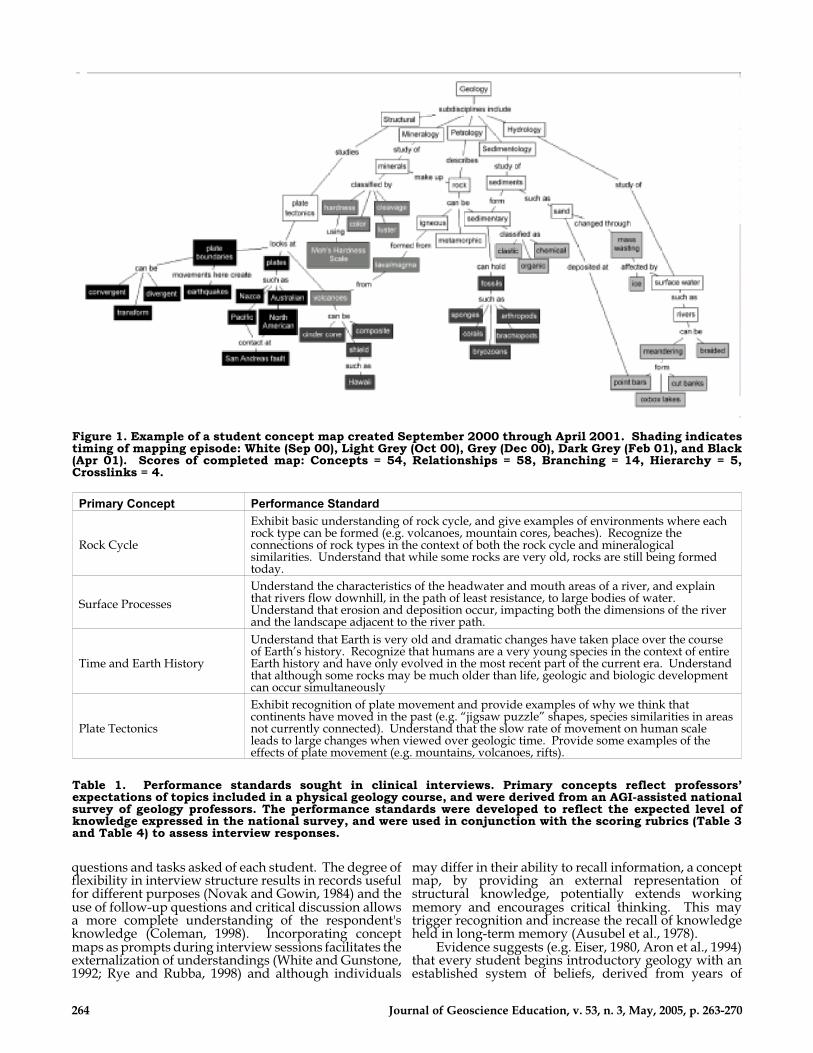
Figure 1. Example of a student concept map created September 2000 through April 2001. Shading indicatestiming of mapping episode: White (Sep 00), Light Grey (Oct 00), Grey (Dec 00), Dark Grey (Feb 01), and Black(Apr 01). Scores of completed map: Concepts = 54, Relationships = 58, Branching = 14, Hierarchy = 5,Crosslinks = 4.
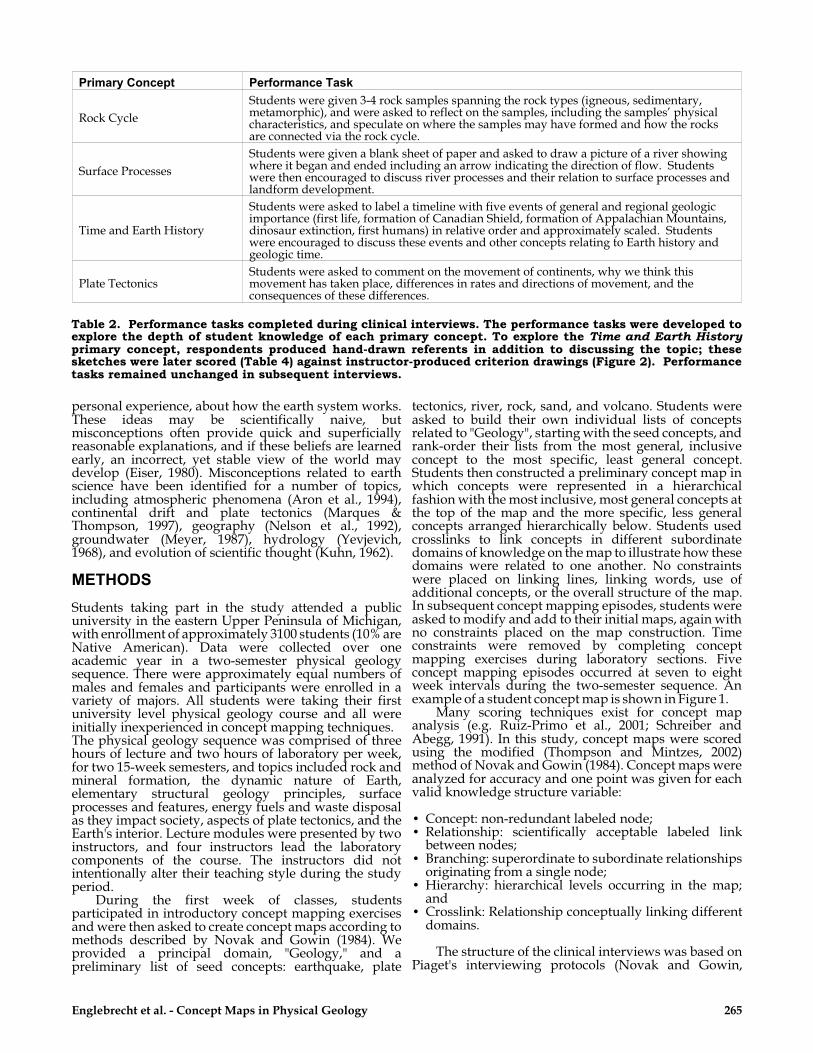
Primary Concept Performance Standard
Rock Cycle
Exhibit basic understanding of rock cycle, and give examples of environments where eachrock type can be formed (e.g. volcanoes, mountain cores, beaches). Recognize theconnections of rock types in the context of both the rock cycle and mineralogicalsimilarities. Understand that while some rocks are very old, rocks are still being formedtoday.
Surface Processes
Understand the characteristics of the headwater and mouth areas of a river, and explainthat rivers flow downhill, in the path of least resistance, to large bodies of water. Understand that erosion and deposition occur, impacting both the dimensions of the riverand the landscape adjacent to the river path.
Time and Earth History
Understand that Earth is very old and dramatic changes have taken place over the courseof Earth’s history. Recognize that humans are a very young species in the context of entireEarth history and have only evolved in the most recent part of the current era. Understand that although some rocks may be much older than life, geologic and biologic developmentcan occur simultaneously
Plate Tectonics
Exhibit recognition of plate movement and provide examples of why we think thatcontinents have moved in the past (e.g. “jigsaw puzzle” shapes, species similarities in areas not currently connected). Understand that the slow rate of movement on human scaleleads to large changes when viewed over geologic time. Provide some examples of theeffects of plate movement (e.g. mountains, volcanoes, rifts).
Table 1. Performance standards sought in clinical interviews. Primary concepts reflect professors’expectations of topics included in a physical geology course, and were derived from an AGI-assisted nationalsurvey of geology professors. The performance standards were developed to reflect the expected level ofknowledge expressed in the national survey, and were used in conjunction with the scoring rubrics (Table 3and Table 4) to assess interview responses.
personal experience, about how the earth system works.These ideas may be scientifically naive, butmisconceptions often provide quick and superficiallyreasonable explanations, and if these beliefs are learnedearly, an incorrect, yet stable view of the world maydevelop (Eiser, 1980). Misconceptions related to earthscience have been identified for a number of topics,including atmospheric phenomena (Aron et al., 1994),continental drift and plate tectonics (Marques &Thompson, 1997), geography (Nelson et al., 1992),groundwater (Meyer, 1987), hydrology (Yevjevich,1968), and evolution of scientific thought (Kuhn, 1962).
METHODS
Students taking part in the study attended a publicuniversity in the eastern Upper Peninsula of Michigan,with enrollment of approximately 3100 students (10% areNative American). Data were collected over oneacademic year in a two-semester physical geologysequence. There were approximately equal numbers ofmales and females and participants were enrolled in avariety of majors. All students were taking their firstuniversity level physical geology course and all wereinitially inexperienced in concept mapping techniques. The physical geology sequence was comprised of threehours of lecture and two hours of laboratory per week,for two 15-week semesters, and topics included rock andmineral formation, the dynamic nature of Earth,elementary structural geology principles, surfaceprocesses and features, energy fuels and waste disposalas they impact society, aspects of plate tectonics, and theEarth's interior. Lecture modules were presented by twoinstructors, and four instructors lead the laboratorycomponents of the course. The instructors did notintentionally alter their teaching style during the studyperiod.
During the first week of classes, studentsparticipated in introductory concept mapping exercisesand were then asked to create concept maps according tomethods described by Novak and Gowin (1984). Weprovided a principal domain, "Geology," and apreliminary list of seed concepts: earthquake, plate
tectonics, river, rock, sand, and volcano. Students wereasked to build their own individual lists of conceptsrelated to "Geology", starting with the seed concepts, andrank-order their lists from the most general, inclusiveconcept to the most specific, least general concept.Students then constructed a preliminary concept map inwhich concepts were represented in a hierarchicalfashion with the most inclusive, most general concepts atthe top of the map and the more specific, less generalconcepts arranged hierarchically below. Students usedcrosslinks to link concepts in different subordinatedomains of knowledge on the map to illustrate how thesedomains were related to one another. No constraintswere placed on linking lines, linking words, use ofadditional concepts, or the overall structure of the map.In subsequent concept mapping episodes, students wereasked to modify and add to their initial maps, again withno constraints placed on the map construction. Timeconstraints were removed by completing conceptmapping exercises during laboratory sections. Fiveconcept mapping episodes occurred at seven to eightweek intervals during the two-semester sequence. Anexample of a student concept map is shown in Figure 1.
Many scoring techniques exist for concept mapanalysis (e.g. Ruiz-Primo et al., 2001; Schreiber andAbegg, 1991). In this study, concept maps were scoredusing the modified (Thompson and Mintzes, 2002)method of Novak and Gowin (1984). Concept maps wereanalyzed for accuracy and one point was given for eachvalid knowledge structure variable:
• Concept: non-redundant labeled node;• Relationship: scientifically acceptable labeled link
between nodes;• Branching: superordinate to subordinate relationships
originating from a single node;• Hierarchy: hierarchical levels occurring in the map;
and• Crosslink: Relationship conceptually linking different
domains.
The structure of the clinical interviews was based onPiaget's interviewing protocols (Novak and Gowin,
Englebrecht et al. - Concept Maps in Physical Geology 265
Primary Concept Performance Task
Rock Cycle
Students were given 3-4 rock samples spanning the rock types (igneous, sedimentary,metamorphic), and were asked to reflect on the samples, including the samples’ physicalcharacteristics, and speculate on where the samples may have formed and how the rocksare connected via the rock cycle.
Surface Processes
Students were given a blank sheet of paper and asked to draw a picture of a river showingwhere it began and ended including an arrow indicating the direction of flow. Studentswere then encouraged to discuss river processes and their relation to surface processes andlandform development.
Time and Earth History
Students were asked to label a timeline with five events of general and regional geologicimportance (first life, formation of Canadian Shield, formation of Appalachian Mountains,dinosaur extinction, first humans) in relative order and approximately scaled. Studentswere encouraged to discuss these events and other concepts relating to Earth history andgeologic time.
Plate TectonicsStudents were asked to comment on the movement of continents, why we think thismovement has taken place, differences in rates and directions of movement, and theconsequences of these differences.
Table 2. Performance tasks completed during clinical interviews. The performance tasks were developed toexplore the depth of student knowledge of each primary concept. To explore the Time and Earth Historyprimary concept, respondents produced hand-drawn referents in addition to discussing the topic; thesesketches were later scored (Table 4) against instructor-produced criterion drawings (Figure 2). Performancetasks remained unchanged in subsequent interviews.

1984). From the responses of an American GeologicalInstitute (AGI)- assisted national survey of geologyprofessors (Kelso et al., 2000; 2001), we determined thefour concepts most frequently incorporated into anundergraduate course in physical geology (hereinreferred to as "primary concepts"):
• Rock Cycle• Surface Processes• Time and Earth History• Plate Tectonics
Based on results of our national survey, the interviewperformance standards (Table 1) detail the level ofunderstanding of these four primary concepts that isexpected of undergraduate students upon completion ofa physical geology course. We designed interviewperformance tasks (Table 2) that incorporated bothdiscussion topics and drawing exercises to explorestudents' knowledge and the depth of students'understandings of the primary concepts. As anicebreaker to begin each interview, students werepresented with their own concept map and asked toelaborate on what they diagrammed, their reasoning forthe entries, and knowledge they perceived as havinggained since the last mapping episode. Students werethen guided through the performance tasks andinterviews were generally completed in approximately30 minutes. Throughout the interviews, students were
encouraged to reference their concept maps and wereprompted to compare their personal knowledge toscientific knowledge. Clinical interviews wereconducted during the first three weeks of the firstsemester (n = 24), and last three weeks of both semesters(n = 19).
During transcript analyses, interviews were scoredagainst the performance standards using a rubric (B.Tewksbury, pers. comm., August 2000; Tewksbury,1996) to delineate response quality (Table 3). We alsodeveloped a rubric for scoring the referents createdduring the interview drawing exercises (Table 4) using acriterion drawing produced by the course instructors(Figure 2) as a performance standard. Our rubrics werebased on examples by Ebert-May (2000), and scorescould range from a minimum of zero, indicating noreply, to a maximum of five. Our rubrics were designedsuch that low-range scores indicate either insufficientunderstanding or misunderstanding; mid-range scoresindicate a fairly simple, yet accurate understanding; andhigh-range scores indicate a complex and accurateunderstanding with the ability to explain, support, andprovide examples of how the concepts fit into the overallframework of understanding. With this design, rubricscoring could address both the correctness andcompleteness of responses. In addition, the presence andfrequency of misconceptions in exiting students wasnoted.
266 Journal of Geoscience Education, v. 53, n. 3, May, 2005, p. 263-270
Figure 2. Criterion drawing produced by course instructor for use as performance standard in scoringreferents created during interview performance task exploring Time and Earth History.
Score Performance
5
Includes all performance standard goals set forthAddresses questionRelevant, justifiable answerAccurate and complete understanding of questionSupports answer with several examples, ideas
4
Omits up to one performance standard goalAddresses question tangentiallyRelevant, justifiable answerAccurate, but only adequate understanding of question (little support for answers)Combination of above, but less consistently represented (less thorough)
3
Omits more than one performance standard goalAddresses question tangentiallySomewhat relevant answer, still accurateMinimal understanding of questionLittle support for answers
2
Omits more than one performance standard goalDoes not address questionStates no relevant answersIndicates misconceptionsDoes not demonstrate understanding of question, inaccurateDoes not provide evidence to support response to question
0 No Answer
Table 3. Scoring rubric used to assess clinical interview discussions. Interview transcripts were reviewed andrespondent performance was scored against the performance standards listed in Table 1.

RESULTS
Concept Maps - The knowledge structure complexityprofiles (Figure 3) and the ranges and medians of scoresobserved during each concept mapping episode (Table 5)illustrate the incremental acquisition of studentknowledge. The profiles of the class means [Concepts(CON), Relationships (REL), Branching (BRA),Hierarchy (HIE), Crosslinks (CXL)] indicate a pattern ofgrowth as a function of time and the changes weresignificantly incremental (f < 0.05) . The accretion ofconcepts and relationships occurred at similar rates,maintaining a nearly constant ratio of 1.3 (range = 1.2 -1.3). The ratio of concepts to knowledge restructuringindicators (branching, hierarchy, and crosslinks) variedas a function of time (Figure 4). The concepts: branchingratio increased slightly through time, from 4.2 to 5.1. Theconcepts:hierarchy ratio increased through time from 9.3to 27.1 and exhibited a marked change in slope betweenthe first and second semesters. The concepts:crosslinksratio decreased from an initial 13.7 to a minimum of 11.9at the second episode, then increased throughout theremainder of the sequence with a maximum of 15.4during the last episode.
Clinical Interviews - Data from the clinical interviewperformance tasks (Figure 5) and the ranges and medianscores observed during each interview (Table 6) likewiseillustrate incremental knowledge acquisition. Theprofiles of class means of the primary concept interviewdiscussions (Figure 5A: Rock Cycle (R), SurfaceProcesses (S), Time and Earth History (T), Plate Tectonics (P)) indicate a pattern of growth as a function of time,and R and P profiles were significantly incremental (f < 0.01).
The profiles of the mean scores of referents createdduring the interview drawing exercises (Figure 5B:Relative Time (TR), Absolute Time (TA)) indicate thatgrowth as a function of time in TR occurred betweenDecember and April but a clear trend as a function oftime in TA was not evident. The increases in mean scoresfrom entry to exit interviews were approximately equalfor R (1.0), S (1.0), and T (1.0), while P showed an increaseof 1.2, and referents TR and TA increased 0.5 and 0.3,respectively.
Misconceptions - In our analyses of concept maps andclinical interviews, we identified the followingmisconceptions among exiting students:
Rock Cycle
• All rocks and minerals are layered. (frequency = 1 of35)
Surface Processes
• Rivers flow from the oceans onto land. (frequency = 4of 35)
Time and Earth History
• All rocks were formed before life was formed.(frequency = 1 of 35)
• Humans coexisted with dinosaurs. (frequency = 2 of35)
• Dinosaurs, bacteria, and/or plants are not life.(frequency = 2 of 35)
Englebrecht et al. - Concept Maps in Physical Geology 267
Figure 3. Summary of knowledge structurecomplexity profiles from September 2000 throughApril 2001. Individual concept maps were scored,with one point given for each scientifically validknowledge structure variable; class means (standarddeviations) are presented here. (a) Concepts (CON)and relationships (REL), (b) branching (BRA),hierarchy (HIE), and crosslinks (CXL).
Score Performance
Part A: Relative time
5 Correct order
3 Two items transposed or one item out of place
1 Greater than two items out of place
Part B: Absolute time
5 Scaled correctly
3 Scaled incorrectly
1 Not scaled
Table 4. Scoring rubric used to assess Time andEarth History referents. Respondents sketched atimeline with five events in relative order andapproximately scaled. The hand-drawn referentswere scored against an instructor-produced criteriondrawing, included as Figure 2. 5-3-1 scoring was usedto simplify the comparison of referent and interviewdiscussion scores.

Plate Tectonics
• Continental movement is all in the same direction.(frequency = 1 of 35)
• Earthquakes alter plate movement. (frequency = 1 of35)
DISCUSSION
Concept Maps - The profiles of the knowledge structurevariables reveal overall superficial, poorly integratedknowledge. There was a modest decline in therestructuring variables (branching, hierarchy, crosslinks)relative to concepts and relationships, and given therapid increase of concepts and relationships, students arelikely acquiring a repertoire of concepts with littleconsolidation and integration. Branching, an indicationof knowledge linearity, reveals weak restructuringthroughout both semesters. The hierarchy profileindicates a certain level of stasis over the two semesters,and the ratio of concepts to hierarchy indicates littlerestructuring, with a drop in hierarchical restructuringduring the second semester. The concepts:crosslinksratio indicates some level of integration between the firstand second episodes, but crosslinks then decline relativeto concepts throughout the remainder of the sequence,indicating little integration is taking place.
Clinical Interviews - While differences in the rates ofgrowth of concept map components can indicate both thetiming of knowledge acquisition and structure of theknowledge acquired, the clinical interviews allow aninvestigation of student understandings in specific topicareas. The rates of change are attributable, in many cases,to the timing and order of classroom material. Similar tothe concept maps, interviews revealed rapid acquisitionof concepts followed by relative stasis. For example, thegreatest increase in understanding of the Rock Cycle (R)was observed between September and December. In thisparticular course, an introduction to rock and mineralclassification was presented in a three-week section frommid-September through early October. Lecture wascentered on the rock cycle and depositionalenvironments, while laboratory exercises were largelydevoted to identification and classification of physicalspecimens. Therefore, students were much moreknowledgeable and better able to address theperformance standards in December compared toSeptember. However, a marked plateau in knowledge
acquisition was observed during the spring semesterwhen no further mineralogy/ petrography/ petrologymodules were presented, and score increases that wouldindicate knowledge integration did not occur. Similarpatterns were observed in the profiles of SurfaceProcesses, Time and Earth History, and Plate Tectonics,with the greatest change in class mean bracketing thepresentation of lecture material on the primary concept.Discussion topic scores increased approximately onerubric category between the entry and exit interviews,but scores from referents created during the RelativeTime (TR) and Absolute Time (TA) drawing exercisesexhibited an entry versus exit interview difference wellbelow that of the discussion topics. Referent TRincreased between December and April, likely as a resultof an Earth history laboratory exercise presented inMarch, but referent TA did not show any clear trend as afunction of time. These results corroborate thosereported by Trend (2000; 2001), who found thatrespondents were generally more secure in their grasp ofrelative time than absolute time and that instrumentsaddressing absolute time generate less conclusiveevidence than those requiring simple sequencing.Because discussion topic T showed an incrementalincrease through time and an entry versus exit interviewscore difference comparable to other discussion topics,this type of referent may be of limited utility whenaddressing primary concepts involving Time and EarthHistory.
268 Journal of Geoscience Education, v. 53, n. 3, May, 2005, p. 263-270
Figure 4. Summary of changes from September 2000through April 2001 in ratios of concepts to knowledgerestructuring indicators: branching, hierarchy, andcrosslinks. Abbreviations are as in Figure 3.
Figure 5. Summary of clinical interview scores fromSeptember 2000 through April 2001. Individualinterview transcripts and referents were scored usingrubrics (Table 3 and Table 4); class means (standarddeviations) are presented here. (a) Discussion topics:Rock Cycle (R), Surface Processes (S), Time and EarthHistory (T), and Plate Tectonics (P); (b) Referents:Relative Time (TR) and Absolute Time (TA).
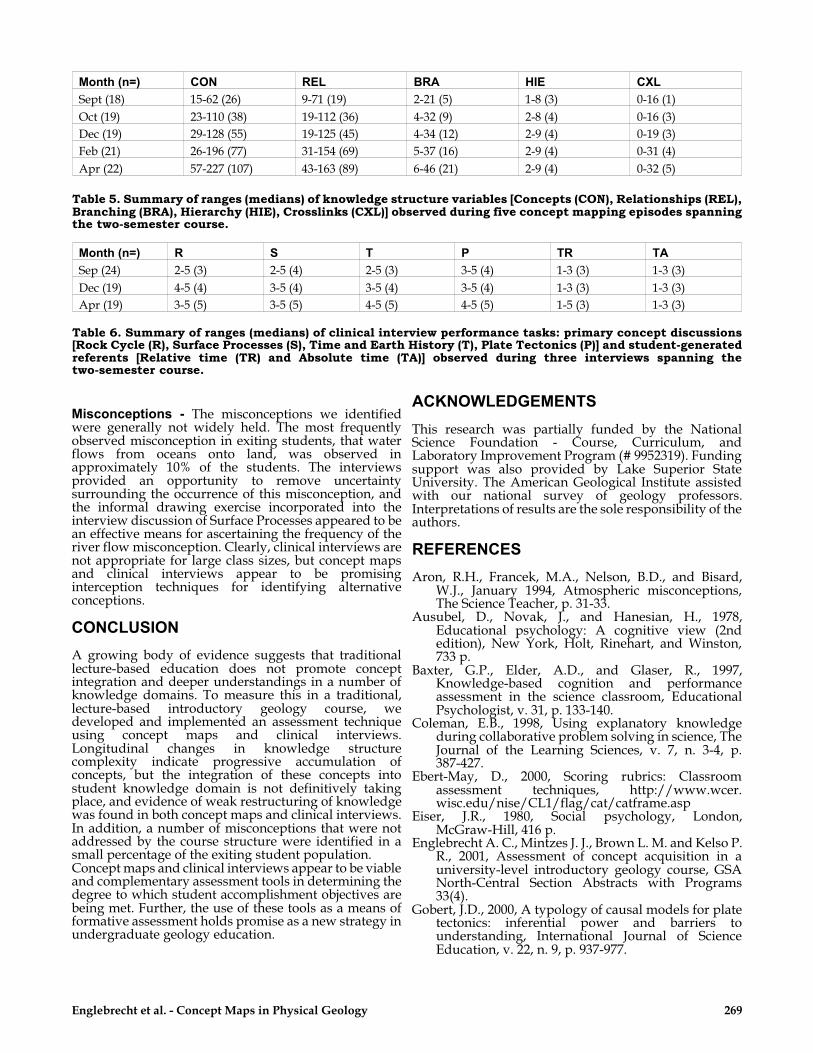
Misconceptions - The misconceptions we identifiedwere generally not widely held. The most frequentlyobserved misconception in exiting students, that waterflows from oceans onto land, was observed inapproximately 10% of the students. The interviewsprovided an opportunity to remove uncertaintysurrounding the occurrence of this misconception, andthe informal drawing exercise incorporated into theinterview discussion of Surface Processes appeared to bean effective means for ascertaining the frequency of theriver flow misconception. Clearly, clinical interviews arenot appropriate for large class sizes, but concept mapsand clinical interviews appear to be promisinginterception techniques for identifying alternativeconceptions.
CONCLUSION
A growing body of evidence suggests that traditionallecture-based education does not promote conceptintegration and deeper understandings in a number ofknowledge domains. To measure this in a traditional,lecture-based introductory geology course, wedeveloped and implemented an assessment techniqueusing concept maps and clinical interviews.Longitudinal changes in knowledge structurecomplexity indicate progressive accumulation ofconcepts, but the integration of these concepts intostudent knowledge domain is not definitively takingplace, and evidence of weak restructuring of knowledgewas found in both concept maps and clinical interviews.In addition, a number of misconceptions that were notaddressed by the course structure were identified in asmall percentage of the exiting student population. Concept maps and clinical interviews appear to be viableand complementary assessment tools in determining thedegree to which student accomplishment objectives arebeing met. Further, the use of these tools as a means offormative assessment holds promise as a new strategy inundergraduate geology education.
ACKNOWLEDGEMENTS
This research was partially funded by the NationalScience Foundation - Course, Curriculum, andLaboratory Improvement Program (# 9952319). Fundingsupport was also provided by Lake Superior StateUniversity. The American Geological Institute assistedwith our national survey of geology professors.Interpretations of results are the sole responsibility of theauthors.
REFERENCES
Aron, R.H., Francek, M.A., Nelson, B.D., and Bisard,W.J., January 1994, Atmospheric misconceptions,The Science Teacher, p. 31-33.
Ausubel, D., Novak, J., and Hanesian, H., 1978,Educational psychology: A cognitive view (2ndedition), New York, Holt, Rinehart, and Winston,733 p.
Baxter, G.P., Elder, A.D., and Glaser, R., 1997,Knowledge-based cognition and performanceassessment in the science classroom, EducationalPsychologist, v. 31, p. 133-140.
Coleman, E.B., 1998, Using explanatory knowledgeduring collaborative problem solving in science, TheJournal of the Learning Sciences, v. 7, n. 3-4, p.387-427.
Ebert-May, D., 2000, Scoring rubrics: Classroomassessment techniques, http://www.wcer.wisc.edu/nise/CL1/flag/cat/catframe.asp
Eiser, J.R., 1980, Social psychology, London,McGraw-Hill, 416 p.
Englebrecht A. C., Mintzes J. J., Brown L. M. and Kelso P.R., 2001, Assessment of concept acquisition in auniversity-level introductory geology course, GSANorth-Central Section Abstracts with Programs33(4).
Gobert, J.D., 2000, A typology of causal models for platetectonics: inferential power and barriers tounderstanding, International Journal of ScienceEducation, v. 22, n. 9, p. 937-977.
Englebrecht et al. - Concept Maps in Physical Geology 269
Month (n=) CON REL BRA HIE CXL
Sept (18) 15-62 (26) 9-71 (19) 2-21 (5) 1-8 (3) 0-16 (1)
Oct (19) 23-110 (38) 19-112 (36) 4-32 (9) 2-8 (4) 0-16 (3)
Dec (19) 29-128 (55) 19-125 (45) 4-34 (12) 2-9 (4) 0-19 (3)
Feb (21) 26-196 (77) 31-154 (69) 5-37 (16) 2-9 (4) 0-31 (4)
Apr (22) 57-227 (107) 43-163 (89) 6-46 (21) 2-9 (4) 0-32 (5)
Table 5. Summary of ranges (medians) of knowledge structure variables [Concepts (CON), Relationships (REL),Branching (BRA), Hierarchy (HIE), Crosslinks (CXL)] observed during five concept mapping episodes spanningthe two-semester course.
Month (n=) R S T P TR TA
Sep (24) 2-5 (3) 2-5 (4) 2-5 (3) 3-5 (4) 1-3 (3) 1-3 (3)
Dec (19) 4-5 (4) 3-5 (4) 3-5 (4) 3-5 (4) 1-3 (3) 1-3 (3)
Apr (19) 3-5 (5) 3-5 (5) 4-5 (5) 4-5 (5) 1-5 (3) 1-3 (3)
Table 6. Summary of ranges (medians) of clinical interview performance tasks: primary concept discussions[Rock Cycle (R), Surface Processes (S), Time and Earth History (T), Plate Tectonics (P)] and student-generatedreferents [Relative time (TR) and Absolute time (TA)] observed during three interviews spanning thetwo-semester course.

Gobert, J.D. and Clement, J.J., 1999, Effects ofstudent-generated diagrams versusstudent-generated summaries on conceptualunderstanding of causal and dynamic knowledge inplate tectonics, Journal of Research in ScienceTeaching, v. 36, n. 1, p. 39-53.
Goldsmith, T.E., and Johnson, P.J., 1990, A structuralassessment of classroom learning, In: Schvaneveldt,R.W. (editor), Pathfinder associative networks:Studies in knowledge organization, Norwood, NJ,Ablex.
Goldsmith, T.E., Johnson, P.J., and Acton, W.H., 1991,Assessing structural knowledge, Journal ofEducational Psychology, v. 83, n. 1, p. 88-96.
Heinze-Fry, J., Crovello, T., and Novak, J., 1984,Integration of Ausubelian leaning theory andeducational computing, American Biology Teacher,v. 46, p. 152-156.
Jonassen, D.H., Beissner, K., and Yacci, M., 1993,Structural knowledge: Techniques for representing,conveying, and acquiring structural knowledge,Hillsdale, NJ, Lawrence Erlbaum Associates, 280 p.
Kahn, E., 2000, A case study of assessment in a grade 10english course, The Journal of Educational Research,v. 93, n. 5, p. 276-286.
Kelso, P.R., Brown, L.M., Englebrecht, A.C., and Mintzes,J.J., 2001, A geology program revised, Geotimes, v.46, n. 11, p. 19-23.
Kelso, P.R., Brown, L.M., Mintzes, J.J., and Englebrecht,A.C., 2000, Key concepts in geosciencesubdisciplines, teaching strategies, and core courserequirements: results of a national survey ofgeoscience faculty [abstract], Eos Transactions AGU,v. 81, n. 48, Abstract ED12B-09.
Kuhn, T.S., 1962, The structure of scientific revolutions,Chicago, University of Chicago Press, 226 p.
Ma, X., 2000, A longitudinal assessment of antecedentcourse work in mathematics and subsequentmathematical attainment, The Journal ofEducational Research, v. 94, n. 1, p. 16-28.
Marques, L. and Thompson, D., 1997, Portuguesestudents' understanding at ages 10-11 and 14-15 ofthe origin and nature of the earth and thedevelopment of life, Research in Science andTechnological Education, v. 15, n. 1, p. 29-51.
McClure, J.R., Sonak, B., and Suen, H.K., 1999, Conceptmap assessment of classroom learning: Reliability,validity, and logistical practicality, Journal ofResearch in Science Teaching, v. 36, n. 4, p. 475-492.
Meyer, W.B., 1987, Venacular American theories of earthscience, Journal of Geologic Education, v. 35, p.193-196.
Mintzes, J.J., Wandersee, J.H., and Novak, J.D., 1997,Teaching science for understanding, San Diego,Academic Press, 360 p.
Moreira, M., 1985, Concept mapping: An alternative foreducation, Assessment and Evaluation in HigherEducation, v. 10, p. 159-168.
Nelson, B.D., Aron, R.H., and Francek, M.A., 1992,Clarification of selected misconceptions in physicalgeography, Journal of Geography, v. 91, p. 76-80.
Novak, J.D., 1984, Application of advances in learningtheory and philosophy to the improvement ofchemistry teaching, Journal of Clinical Education, v.67, p. 606-612.
Novak, J.D., 1998, Learning, creating, and usingknowledge: the use of concept maps as facilitative
tools in school and corporations, Mahwah, NJ,Lawrence Erlbaum.
Novak, J.D. and Gowin, D.B., 1984, Learning how tolearn, New York, Cambridge University Press, 150 p.
Rice, D.C., Ryan, J.M., and Samson, S.M., 1998, Usingconcept maps to assess student learning in thescience classroom: Must different methodscompete?, Journal of Research in Science Teaching,v. 35, p. 1103-1127.
Ruiz-Primo, M.A., Schultz, S.E., Li, M., and Shavelson,R.J., 2001, Comparison of the reliability and validityof scores from two concept-mapping techniques,Journal of Research in Science Teaching, v. 38, n. 2, p.260-278.
Ruiz-Primo, M.A., and Shavelson, R.J., 1996, Problemsand issues in the use of concept maps in scienceassessment, Journal of Research in Science Teaching,v. 33, p. 569-600.
Rye, J.A., and Rubba, P.A., 1998, An exploration of theconcept map as an interview tool to facilitate theexternalization of students' understandings aboutglobal atmospheric change, Journal of Research inScience Teaching, v. 35, n. 5, p. 521-546.
Schau, C., and Mattern, N., 1997, Use of map techniquesin teaching applied statistics courses, The AmericanStatistician, v. 51, p. 171-175.
Schreiber, D.A., and Abegg, G.L., 1991, Scoringstudent-generated concept maps in introductorycollege chemistry [abstract], NARST AnnualMeeting, Lake Geneva, WI (EDS347055).
Slater, T.F., Ryan, J.M., and Samson, S.L., 1997, Impactand dynamics of portfolio assessment andtraditional assessment in a college physics course,Journal of Research in Science Teaching, v. 34, n. 3, p.255-272.
Surber, J.R., 1984, Mapping as a testing and diagnosisdevice, In: Holly, C.D., and Dansereau, D.F.(editors), Spatial learning strategy: Techniques,applications and related issues, New York,Academic Press, 328 p.
Tewksbury, B.J., 1996, Teaching without exams-thechallenges and the benefits, Journal of GeoscienceEducation, v.44, p. 366-372.
Thelwall, M., 2001, Understanding and assessmentmethodology in an introductory statistics course,The Journal of Computers in Mathematics andScience Teaching, v. 20, n. 3, p. 251-264.
Thompson, T., and Mintzes, J., 2002, Cognitive structureand the affective domain: on knowing and feeling inbiology, International Journal of Science Education,v. 24, n. 6, p. 645-660.
Trend, R., 2000, Conceptions of geological time amongprimary teacher trainees, with reference to theirengagement with geoscience, history, and science,International Journal of Science Education, v. 22, n. 5,p. 539-555.
Trend, R., 2001, Deep time framework: a preliminarystudy of U.K. primary teachers' conceptions ofgeological time and perceptions of geoscience,Journal of Research in Science Teaching, v. 38, n. 2, p.191-221.
White, R., and Gunstone, R, 1992, Probingunderstanding, London, The Falmer Press, 196 p.
Yevjevich, V., 1968, Misconceptions in hydrology andtheir consequences, Water Resources Research, v. 4,n. 2, p. 225-232.
270 Journal of Geoscience Education, v. 53, n. 3, May, 2005, p. 263-270

Practical, creative, and innovative ideas for teaching geoscience
Name (print or type) Phone
Mailing Address Fax
City State Country Postal Code
College/University Professor at
Pre-College Teacher at
Other at
Checks (US funds only) are payable to National Association of GeoscienceTeachers.Mail to: NAGT, 31 Crestview Dr., Napa, CA 94558 USA
Please charge my credit card for my membership fees Visa MC
Credit Card # Exp. Date Signature
The membership year runs from January through December, and members receive 5 issues of JGE per year. Subscrip-tions received after June 1 will begin receiving the Journal in January of the following year. Back issues are available for$15 each ($18 foreign).
*To qualify for student rate, indicate status below, and obtain verification from an NAGT member.
Undergraduate Graduate
Signature of NAGT member School
National Association of Geoscience Teachers
Individual Subscription &Membership Rates (US Funds)
Regular USA $35 ___Outside USA $47 ___Student* USA $20 ___Student* outside USA $32 ___Retired NAGT member $30 ___
Library SubscriptionsRegular USA $75 ___Outside USA $87 _______New ____Renewal