probability and simulation - education.ti.com
TRANSCRIPT
Building Concepts: Probability and Simulation TEACHER NOTES
©2016 Texas Instruments Incorporated 1 education.ti.com
Lesson Overview
In this TI-Nspire lesson students will use simulation to collect data and estimate probabilities for a real situation that is complex. They will investigate scenarios where the number of outcomes is fixed and the probability of a certain number of desired outcomes is computed. Students will also investigate “go until…” scenarios where the number of outcomes it takes to get the desired outcome is counted.
Learning Goals
1. Choose an appropriate model and corresponding device to simulate a chance outcome;
2. recognize the difference between the underlying structures of chance events that have a specified number in a repetition versus chance events in which the number of repetitions varies depending on the criteria for success;
3. compare estimated probabilities from simulations to theoretical probabilities.
Simulation can be used to estimate answers to complicated probability questions.
Prerequisite Knowledge Vocabulary
Probability and Simulation is the fifteenth lesson in a series of lessons that explore statistics and probability. This lesson builds on the concepts of the previous lessons. Prior to working on this lesson students should have completed Probability, Diagrams, and Tables and Unequally Likely Outcomes. Students should understand:
• how to find the probability of an outcome involving compound events;
• how to find the probabilities of outcomes from a chance event where the outcomes are not equally likely.
• outcome: the result of a chance experiment
• probability: the chance that something will happen; how likely it is that an event will happen
• simulation: a way to model random events using a device so the simulated outcomes closely match the outcomes of a real world situation
Lesson Pacing
This lesson should take 50–90 minutes to complete with students, though you may choose to extend, as needed.
Building Concepts: Probability and Simulation TEACHER NOTES
©2016 Texas Instruments Incorporated 2 education.ti.com
Lesson Materials
• Compatible TI Technologies:
TI-Nspire CX Handhelds, TI-Nspire Apps for iPad®, TI-Nspire Software
• Probability and Simulation_Student.pdf
• Probability and Simulation_Student.doc
• Probability and Simulation.tns
• Probability and Simulation_Teacher Notes
• To download the TI-Nspire activity (TNS file) and Student Activity sheet, go to http://education.ti.com/go/buildingconcepts.
Class Instruction Key
The following question types are included throughout the lesson to assist you in guiding students in their exploration of the concept:
Class Discussion: Use these questions to help students communicate their understanding of the lesson. Encourage students to refer to the TNS activity as they explain their reasoning. Have students listen to your instructions. Look for student answers to reflect an understanding of the concept. Listen for opportunities to address understanding or misconceptions in student answers.
Student Activity: Have students break into small groups and work together to find answers to the student activity questions. Observe students as they work and guide them in addressing the learning goals of each lesson. Have students record their answers on their student activity sheet. Once students have finished, have groups discuss and/or present their findings. The student activity sheet can also be completed as a larger group activity, depending on the technology available in the classroom.
Deeper Dive: These questions are provided for additional student practice, and to facilitate a deeper understanding and exploration of the content. Encourage students to explain what they are doing and to share their reasoning.

Building Concepts: Probability and Simulation TEACHER NOTES
©2016 Texas Instruments Incorporated 3 education.ti.com
Mathematical Background
In earlier lessons, students estimated probabilities by collecting data from experiments and found theoretical probabilities by identifying the outcomes and the ways in which they could occur. Sometimes theoretical probability models are difficult to develop. In these cases, you can set up a model, use a simulation to collect data and estimate probabilities for a real situation that is complex and where the theoretical probabilities are not obvious. Simulation is a way to model random events using a device (like tossing a coin or rolling a number cube) so the simulated outcomes closely match the outcomes of a real world situation. If the structure of the generating mechanism (e.g., a number cube or a coin or a bag with a given number of red and white chips) is known, one can anticipate the relative frequencies of a series of random tosses or selections.
Students should understand basic concepts of probability such as sample space, equally likely outcomes, estimating probabilities from relative frequencies, and the product rule for finding the probability of compound events.
Probability situations often deal with one of two different structures. In both structures the probability of a single outcome is known from some prior source (i.e., the probability of the birth of a girl, a randomly chosen card is red, or making a free throw). In one structure, the situation involves examining a finite number of outcomes in what we call a repetition (also referred to as a trial). For example, in finding the probability of two girls in a family of five children, a repetition would be a family of five children. In the other structure, however, the goal is to reach a certain number of favorable outcomes; e.g., what is the expected size of a family if they have children until they have exactly two girls? This lesson addresses both of these probability structures.

Building Concepts: Probability and Simulation TEACHER NOTES
©2016 Texas Instruments Incorporated 4 education.ti.com
Part 1, Page 1.3
Focus: These questions involve situations where the number of observations is fixed, e.g., 10 questions in a test or six people in the store.
On page 1.3, students simulate tossing a coin, with H(heads) considered a success.
n sets the number of tosses in a repetition. Select the arrows or left/right arrow keys to adjust when Show Line is not active.
TI-Nspire Technology Tips
b accesses page options.
e toggles between the tables, n, and show/hide line.
Up/Down arrow keys scroll through the tables.
Left/Right arrows change n, or when line is shown, move the line left and right.
/. resets the page.
Animation allows the animation to be turned on and off.
10 reps appears after 3 repetitions have been performed and will run 10 repetitions without animation.
50 reps works like the 10 reps button but runs 50 reps at a time.
Show Line shows a vertical segment at the left end of the graph that can be moved with arrows on the keypad or grabbed and dragged.
Toss tosses the coin n times.
Clear keeps the current setting for n and animation but clears simulation data.
Reset resets the page.
Teacher Tip: This lesson involves several important ideas and will take more than one lesson to complete. The questions are organized by different contextual problems. After a whole class discussion of the True False test problem, students might work in pairs where different pairs do one of the problems related to the blood donor, the basketball player making baskets, and the basketball player in a 1-and-1 situation. Each group should share their results and describe what happens when the simulations are repeated. Students should observe that chance will account for some variability, but overall the estimates of the probability of success from simulated distributions should be fairly close, provided the number of repetitions is fairly large. Having the class discuss their individual results from simulating a particular problem will help students recognize that simulations generally produce similar results.

Building Concepts: Probability and Simulation TEACHER NOTES
©2016 Texas Instruments Incorporated 5 education.ti.com
Class Discussion
Have students… Look for/Listen for…
Suppose you took a ten-question true/false test and guessed all of the answers.
• What do you think your chances of getting at least 60% (6 of the 10 questions) right will be?
Answers will vary. Students may say pretty good or give a number like 50% because you have a 50% chance of getting one question correct.
• Kylie decided to toss a coin to figure out her chances of getting 60% correct on the test. She let heads represent correct and tails represent wrong. She tossed the coin 10 times and recorded how many times a head showed up. These are her results: TTTHTHHTTH. Did she get 60% correct on the test?
Answer: No. she had only 4 heads in ten tosses, which would be 4 correct answers. She needed to get 6 heads to get 60% correct.
• Petre said this indicates the chance of getting 60% correct a ten-question true/false test by guessing is 0. Do you agree with Petre? Why or why not?
Answer: One example is not enough to say it will never happen. You would need to do more tosses.
On page 1.3 of the TNS activity you can simulate tossing a coin. The file shows n =10, the number of questions on the test.
• Select Toss. Describe what happens and what the numbers you see in the table and graph mean.
Answers will vary. For example, the coin was tossed 10 times, and the results H or T were recorded in the table. The number of repetitions was 1, and the total number of Heads (Hs) in the ten tosses was 5. The total number of heads is the number of questions answered correctly and is plotted on the number line.
• Select Toss twice more. Describe what the dots on the number line represent.
Answers will vary. In one example of the first 3 simulated tests, two fives and one seven were plotted on the number line, which indicates that in one simulated test, 7 of the responses were correct (7 heads), and in two of the simulated tests, 5 of the responses were correct (5 heads).

Building Concepts: Probability and Simulation TEACHER NOTES
©2016 Texas Instruments Incorporated 6 education.ti.com
Class Discussion (continued)
• Select 10 Reps. What do the numbers in the table and the graph represent?
Answers will vary. The first column in the table shows the result of simulating the last test; the rows in the second column indicate the number of simulated tests, with the last number in the column representing the total number of tests that have been simulated. The number of successes tells how many heads (or correct answers) in each of those simulated tests. The 10 dots on the number line show the number of correct answers in each of the 10 simulated tests corresponding to the values in the last column of the table for each test. For example, three 5s, two 6s, four 7s and one 9 indicates that in three of the simulated tests, there were 5 correct answers; in two of them, 6 correct answers; in four of them 7 correct answers; and one simulated test had 9 correct answers.
• Based on the simulation, estimate the chance of getting at least 60% correct on the test by guessing. (The vertical segment on the left can be moved to the right to help you count.)
Answers will vary. In the case above, 7 out of the 10 simulations resulted in 60% or more correct
for a probability of 0.7 or 710
.
Select 10 Reps again. Then several more times.
• How does the distribution change? Answers will vary. The distribution gets more mound shaped and symmetric, centered around 5 correct answers. The probability estimated from
50 simulations is 2050
or 0.4 chance of getting at
least 60% correct by guessing.
• Select 10 Reps until the last Rep in the table is 100. Select Show Line. Move the vertical segment at the left of the graph to 1. Explain what the numbers on either side and at the top of the segment represent.
Answer: The number to the left of the segment is the number of simulated tests in which there were 0 correct answers; the number on top is the number of simulated tests in which there was 1 correct answer, and the number to the right indicates the number of simulated tests that had more than 1 correct answer.
• How many times in the 100 simulated tests was the percent correct 60% or greater?
Answers will vary. One answer might be 39100
or
0.39

Building Concepts: Probability and Simulation TEACHER NOTES
©2016 Texas Instruments Incorporated 7 education.ti.com
Class Discussion (continued)
• Select 50 Reps until you have 200 repetitions all together. How does your answer to the question above change?
Answers will vary. One possible answer: 91 0.455
200= . It would be good to have students
compare their answers.
Part 1, Page 1.5
Focus: These questions involve situations where the number of observations is fixed, e.g., 10 questions in a test or six people in the store.
Page 1.5 is similar to page 1.3 but the simulation device is a number cube. The default success is the number 1 displayed on the face of the number cube.
TI-Nspire Technology Tips
b accesses page options.
Numbers keys 1-6 select and deselect a number as a success.
/. resets the page.
Success adjusts the numbers that are counted as success.
Include numbers allows counting only certain faces (e.g., skip 5 and 6, counting only the numbers 1 to 4).
Toss throws the number cube 10 times.
Class Discussion
Have students… Look for/Listen for…
A basketball player typically makes two of every three free throws she takes. What is the probability she will make eight of her next ten free throws?
• Tina wants to use a coin to represent making or missing a basket because you either make or miss, so heads could be making the shot. Do you agree with Tina? Why or why not?
Answer: Tina is not right because the player has
a 23
chance of making a free throw, not a 12
chance, which is what it would have to be if you used a coin to model taking the shot.
• Tomas claims you can use a number cube to represent her shots, with 1, 2, 3, and 4 representing a shot she made, and 5 and 6 a shot she missed. Do you agree with Tomas? Why or why not?
Answer: Tomas is correct. This model would give 4 26 3= chance of making a shot and 2 1
6 3=
chance of missing.

Building Concepts: Probability and Simulation TEACHER NOTES
©2016 Texas Instruments Incorporated 8 education.ti.com
Class Discussion (continued)
• On page 1.5, select menu> Success> Two, then menu> Success> Three, and menu> Success> Four. You should see Success defined on the screen as 1, 2, 3, 4. The number of free throws the player is attempting is n 10= . Select Toss and describe what happens.
Answer: The number cube is being tossed ten times, and each time the face that shows is recorded.
• Scroll down the column labeled 10. Write out the results of the first repetition of ten free throws and explain how those results show in the table to the right and in the graph.
Answers will vary. One example: 1, 2, 2, 1, 6, 3, 2, 6, 5, 4 would be 7 successes- that is 1s, 2s, 3s, 4s. This meant that the player made 7 of her 10 free throws, and 7 is plotted on the number line.
Select Toss twice more.
• Explain what happened each time. Did you observe anything interesting?
Answers will vary. For each set of ten tosses of the coin, the number of successes is recorded in the table – that is, getting a 1, 2, 3, 4, which represented making a free throw. Students might not observe anything interesting or they may note that five 1s showed up.
• Select 10 Reps until you have 50 repetitions. Describe how the distribution of successes changes.
Answers will vary. The distribution may grow more and more mound shaped, with hardly any outcomes below 4.
• Select Show Line and move the line to 8 successes. What is the estimated probability the player will make 8 of her next 10 free throws?
Answers will vary. One possibility is 1050
or 0.2 or
20%.
Select 50 Reps until you have 200 repetitions.
• Use the simulation to estimate the probability that the player will make 8 of her next 10 free throws.
Answers will vary. One possibility for 200 reps is 39 0.195200
= .
• Continue to select 50 Reps until you have 500 repetitions. How does the probability change? What is the probability the player will make at least 8 of her next 10 free throws?
Answers will vary. One estimate for making 8 is 90 0.18
500= . An estimate of the probability she
makes at least 8 is 134 0.268500
= .
• How would you expect the mean and median of the number of free throws the player made to compare? Explain your thinking.
Answers will vary. The distribution is fairly mound shaped and symmetric, so the mean and median are probably close together.
Building Concepts: Probability and Simulation TEACHER NOTES
©2016 Texas Instruments Incorporated 9 education.ti.com
Class Discussion (continued)
• Move the line segment to find the mean and median of the distribution of the number of free throws the player made. Explain what these values represent.
Answers will vary. In one example, the median was 7, which indicates that in half of the 500 repetitions, the player made 7 or more free throws and in half she made 7 or less free throws. The mean was 6.6, which indicates that on average she makes 6.6 points for every 10 free throws.
Part 1, Page 1.7
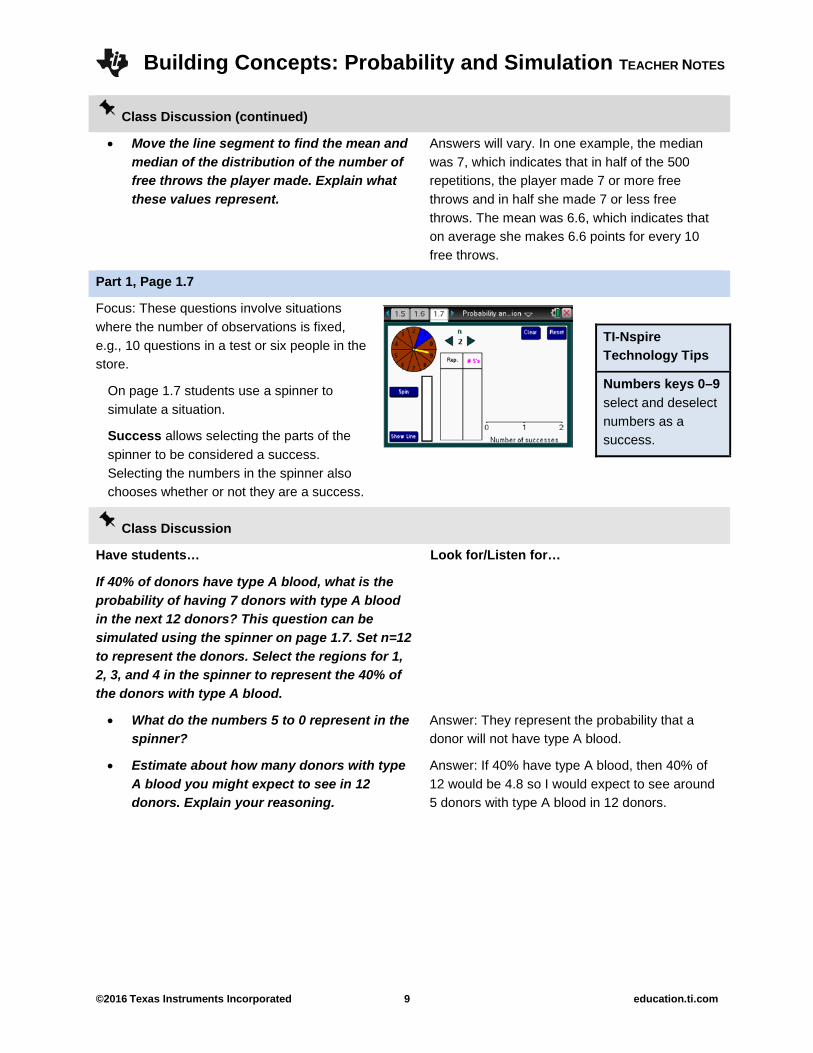
Focus: These questions involve situations where the number of observations is fixed, e.g., 10 questions in a test or six people in the store.
On page 1.7 students use a spinner to simulate a situation.
Success allows selecting the parts of the spinner to be considered a success. Selecting the numbers in the spinner also chooses whether or not they are a success.
TI-Nspire Technology Tips
Numbers keys 0–9 select and deselect numbers as a success.
Class Discussion
Have students… Look for/Listen for…
If 40% of donors have type A blood, what is the probability of having 7 donors with type A blood in the next 12 donors? This question can be simulated using the spinner on page 1.7. Set n=12 to represent the donors. Select the regions for 1, 2, 3, and 4 in the spinner to represent the 40% of the donors with type A blood.
• What do the numbers 5 to 0 represent in the spinner?
Answer: They represent the probability that a donor will not have type A blood.
• Estimate about how many donors with type A blood you might expect to see in 12 donors. Explain your reasoning.
Answer: If 40% have type A blood, then 40% of 12 would be 4.8 so I would expect to see around 5 donors with type A blood in 12 donors.

Building Concepts: Probability and Simulation TEACHER NOTES
©2016 Texas Instruments Incorporated 10 education.ti.com
Class Discussion (continued)
• Select Spin. Describe what happens. Answer: The spinner lands on a number, and if it is 1 to 4, the number is recorded in blue in the column. After 12 spins, the total number of times the spinner landed on a 1 to 4 is recorded in the table as the number of type A blood donors for that repetition.
• Spin twice more. Explain what the dot plot represents.
Answer: The dots represent the number of successes (type A blood donors) in each repetition of 12 donors who came in. In one example, once there were 4 type A donors in the 12 donors, once there were 6 and once there were 7.
Select 10 Reps until you get to 50.
• How does the distribution of the number of type A blood donors change as the number of repetitions increases?
Answers will vary. The distribution may become more mound shaped and symmetric, centering around 5.
• Select 10 Reps until you have 100 repetitions. Select Show Line and use it to answer the question: What is the estimated probability that 7 of the next 12 donors will have type A blood if 40% of the donors have type A blood? (Assume the donors are independent and come in to donate randomly.)
Answers will vary. One simulation produced 13100
or 0.13 chance of having 7 donors with type A blood.
• What are the mean and median of your simulated distribution of the number of type A blood donors in 12 donors?
Answers will vary. In one simulation the mean was 5.1 and the median was 5.
• Increase the number of Reps until you have at least 500. Answer question above: What is the estimated probability that at least 7 type A blood show up in a set of 12 donors? Compare your answer to your classmates’ answers.
Answers will vary. One example might show a probability of 0.192 compared to 0.142, both after 500 repetitions.
Building Concepts: Probability and Simulation TEACHER NOTES
©2016 Texas Instruments Incorporated 11 education.ti.com
Class Discussion (continued)
The basketball player from the earlier set of questions who makes two of every three free throws is in a 1-and-1 situation after a foul. That is, if she misses the first shot, she is done. If she makes the first shot, she has another shot.
• Set up a simulation to model the player’s success at making the first shot. Toss the number cube for one repetition. How many free throws did the player make in that repetition?
Answers may vary. Use a number cube, and let the probability of a success be the faces 1, 2, 3, or 4, and faces 5 and 6 the probability of missing the shot. Let n = 2 for the two shots. The outcome 1,5 would mean she made the first shot and missed the second; 5,1 or 6, 6 would mean she missed the first so really would not have a second shot. A 1,1 indicates she made both shots.
• What do you need to pay attention to in this simulation? Do several more repetitions of shooting free throws and record the faces of the two number cubes each time. Could you use all of the results? Why or why not.
Answers may vary. Students should recognize that if they get a 5 or a 6 on the first toss, they count that as no points even if they get a 2 on the second toss and the table says the repetition has one success.
• This simulation cannot be run using the10 or 50 reps option. Explain why not.
Answer: The two tosses in each repetition have to be looked at because if a 5 or 6 happens on the first toss, the shooter did not make any points.

Building Concepts: Probability and Simulation TEACHER NOTES
©2016 Texas Instruments Incorporated 12 education.ti.com
Class Discussion (continued)
• To keep track of the results of the simulation use a table like the one below. Run the simulation at least 50 times and record your results in the table. Use the results to estimate the probability the player would make both of the free throws.
Missed 1st Made 1st only Made both
Frequency
Probability
Answers will vary. Sample table.
Missed 1st Made 1st only Made both
Frequency 11111 11111 11111 11111 11111 11111 1111 35
11111 11111 11111 11111
1
22
11111 11111 11111 11111 11111 11111 11111 11111 43
Probability 35 0.35100
= 22 0.22100
= 43 0.43100
=
5 6 2 3 2 1 6 3 1 1 5 1 2 4 1 3 5 4 5 2 1 1 6 2 6 4
1 2 3 5 1 1 1 1 3 1 2 4 1 1 4 1 1 4 3 2 3 6 2 3 3 5
4 2 6 2 6 2 5 5 2 4 2 6 1 6 6 5 4 6 6 3 6 5 3 2 3 5
2 5 1 6 3 5 5 4 1 6 3 2 2 1 2 6 5 2 4 6 2 2 1 6 4 6
3 1 5 6 6 4 1 4 4 6 2 4 3 5 6 2 4 3 6 6 2 4 5 2 1 1
6 2 5 1 5 5 3 5 5 5 1 3 3 5 3 1 5 4 3 1 4 2 4 1 1 5
3 1 3 1 2 1 1 1 5 4 6 4 6 6 5 3 1 4 6 2 6 1 4 2 6 6
6 6 4 6 6 4 2 5 2 3 1 1 1 3 4 4 4 5

Building Concepts: Probability and Simulation TEACHER NOTES
©2016 Texas Instruments Incorporated 13 education.ti.com
Class Discussion (continued)
• Remember how to find the probability of compound events. Set up a tree diagram with the theoretical probability to model the 1-to-1 situation.
Answer:
• Use the tree diagram to find the theoretical probability she makes two free throws.
Answer: 2 2 4 0.443 3 9
= =
• How does the simulated (estimated) probability in the question above compare to the theoretical probability?
Answers will vary. Using the simulation above, the two were very close: 0.44 and 0.43.
• Find the theoretical and the estimated probability the player scores at least 1 point. How do these compare?
Answers will vary. Using the simulation above, the estimated probability is 0.65. The theoretical
probability is 4 2 6 2 0.669 9 9 3+ = = =
Set up a simulation. Describe the device for simulating the probability and the size of the repetitions you are using. Then use the results to estimate the probability.
• If the probability of having a boy is 12
, set
up a simulation to estimate the probability that a family with three children will have exactly 2 boys.
Answers will vary.
• Use a tree diagram or table to determine the theoretical probability that a family with three children has exactly 3 boys and compare the theoretical probability with your estimate in the question above.
Answers will vary. The probability that a family with three children has exactly 2 boys is 3 0.3758= . In one simulation; 77 out of 200
repetitions had exactly 2 boys which is a
probability of 77 0.385200
= which is very close to
the theoretical probability.
Makes first shot Misses first shot
Makes second shot Misses second shot
Building Concepts: Probability and Simulation TEACHER NOTES
©2016 Texas Instruments Incorporated 14 education.ti.com
Student Activity Questions—Activity 1
1. It is important that the device used to model the probability of a success in a given situation can actually be adapted to match the probability of the success. Which of the methods do you think will work for simulating the probability of guessing at the answers to multiple choice questions with four options? Explain your thinking in each case.
a. toss a coin where heads represents the chance of guessing the right option.
b. toss a number cube where 1 represents the correct choice, 2, 3, and 4 incorrect. When a 5 and 6 happen, do not count them.
c. spin a spinner where 1 and 2 represent a correct answer, 3 to 8 represent wrong answers and 9 and 0 should be skipped.
d. toss a coin twice where two heads represents the correct choice, a head and tails and two tails represent the incorrect choice.
Answers: Tossing one coin will not work because the probability of a head is 12
not 14
. All of the
other strategies will work to simulate a probability of 14
.
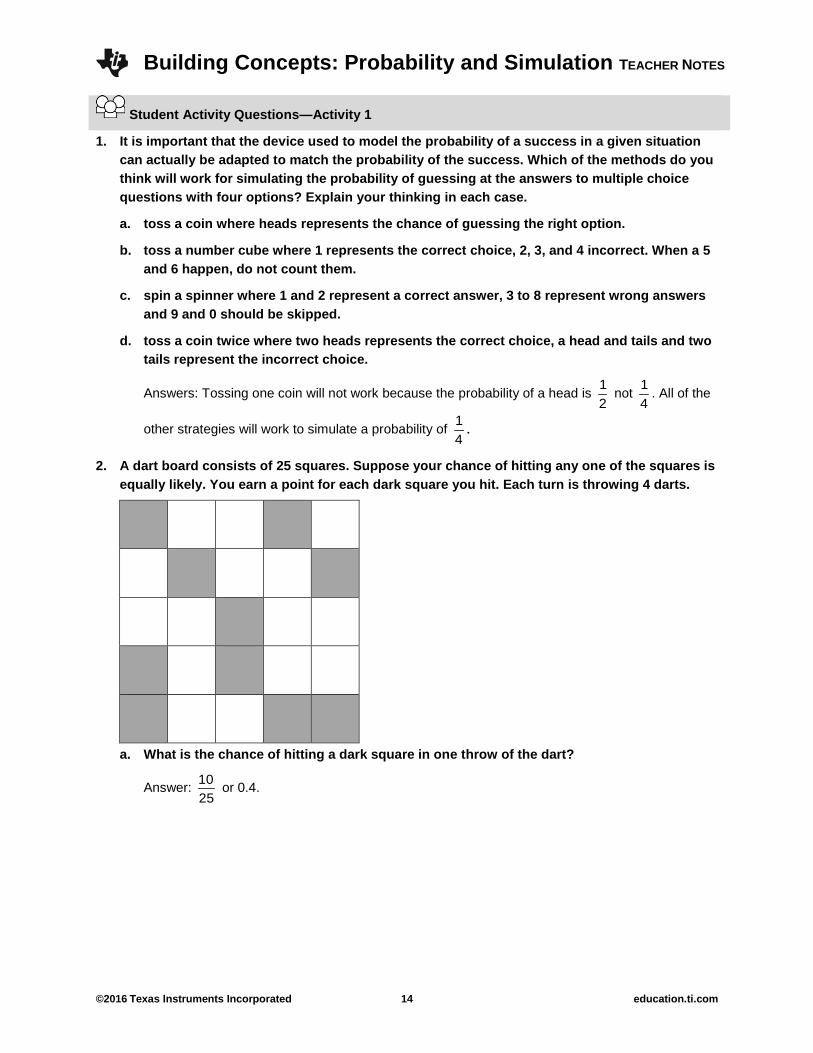
2. A dart board consists of 25 squares. Suppose your chance of hitting any one of the squares is equally likely. You earn a point for each dark square you hit. Each turn is throwing 4 darts.
a. What is the chance of hitting a dark square in one throw of the dart?
Answer: 1025
or 0.4.

Building Concepts: Probability and Simulation TEACHER NOTES
©2016 Texas Instruments Incorporated 15 education.ti.com
Student Activity Questions—Activity 1 (continued)
b. Describe a simulation you could use to estimate the probability of getting four points for one turn. Note that menu for both pages 1.5 and 1.7 have Include Numbers as an option. This allows you to not count some of the faces of the number cube or some of the numbers of the spinner when they occur.
Answers will vary. Students might use a number cube with 1 and 2 representing hitting a dark square that would earn 1 point; 3, 4, and 5 hitting a white square and earning no points; do not count 6. They might use a spinner in two ways with a repetition being 4 spins. One way would be to let 1, 2, 3, 4 represent hitting a dark space earning a point, and 5, 6, 7, 8, 9, 0 represent hitting a white square earning no points. A second way would be to use the spinner and let 1 and 2 represent hitting a dark square earning a point and 3, 4, and 5 represent hitting a white square not earning a point and skip 6, 7, 8, 9, and 0.
c. Choose a model, then run the simulation and use it to estimate the probability you will earn three points when it is your turn to shoot darts.
Answers will vary. In one simulation, the estimated probability of earning three points was 0.15.
d. Use your simulated results to estimate the probability of getting at least 3 points.
Answers will vary. One possibility might be 0.17.
Part 2, Pages 2.2 and 2.4
Focus: The situations in this context involve an open-ended number of repetitions, that is, how many tries will it take until a certain number of successes have been reached. These might be called “go until…” questions, where the number n in any repetition varies depending on the desired number of successful outcomes.
Pages 2.2 and 2.4 can be used with situations described as “go until” a certain number of designated outcomes has been observed. A repetition is how many times you have to use the modeling device to achieve the designated outcome.
Page 2.2 simulates the number of tosses until a specified number of heads or “successes” are observed.
Page 2.4 simulates the number of rolls of the number cube until a specified number of outcomes designated a success are observed.
n sets the number of times the desired outcomes are to be observed in a repetition.
Page 2.4 functions the same as 1.3, 1.5, and 1.7 respectively, except students count the number of trials until n successes, and the line is always active.
Building Concepts: Probability and Simulation TEACHER NOTES
©2016 Texas Instruments Incorporated 16 education.ti.com
Class Discussion
Suppose a family decides to keep having children until they have two girls.
• Make a guess as to what you think is the probability that a family with exactly two girls will have at least six children.
Answers will vary.
• On page 2.2, set n to 2. Select Toss. How many tosses did it take to get two heads (two girls). How many children were in the family?
Answers will vary. Once it took 4 tosses to get 2 heads (girls) so there were 4 children in the family, 2 girls and 2 boys.
• Repeat Toss, until you have three dots on the number line. What is the smallest number of children in the families represented by the dots? The largest? How many boys and girls were in each family?
Answers will vary. For example, one family had only four children, two boys and two girls, and one had ten children, eight boys and two girls.
• Choose 10 Reps. Describe the distribution on the number line and explain what it represents.
Answers will vary. In 10 repetitions of tossing the coin until you have 2 girls, two families had exactly 2 girls, two had 2 girls and 1 boy, two had 5 children, 2 girls and 3 boys; two families had six children, 2 girls and 4 boys; one had seven children, 2 girls and 5 boys; and one family had ten children, 2 girls and 8 boys.
• Choose 50 Reps. Move the vertical segment at the left to determine how many families had exactly 2 girls and no boys? What is the simulated probability of having exactly 2 girls and no boys?
Answers will vary. In one simulation, 10 families had exactly two children, so the estimated
probability was 1050
or 15
.
Run the simulation for at least 200 repetitions.
• Use the simulated distribution of the number of children in a family to answer the question: What is the estimated probability that a family with exactly 2 girls will have 6 children?
Answers will vary. One simulation produced 12200
or 0.06 of the families with 2 girls have exactly six children.
• What is the largest family in your simulation?
Answers will vary. One simulation had 13 children before they had exactly 2 girls.
• Describe the simulated distribution of the number of children in a family that has exactly 2 girls. Compare the median and mean numbers of children.
Answers will vary. The simulated distribution is skewed right. For one example, the mean number of children in the family was 4.2, and the median was 4 children. The mean was slightly larger than the median, which could be expected when the distribution is skewed right.

Building Concepts: Probability and Simulation TEACHER NOTES
©2016 Texas Instruments Incorporated 17 education.ti.com
Class Discussion (continued)
Run the simulation until you have at least 500 repetitions.
• How does your answer to the question where you ran the simulation for 200 repetitions change?
Answers will vary. For one simulation the
estimated probability was 31 0.062500
= of getting
2 girls in 6 children.
• Compare your answers with a classmate. Then run the simulation again to see whether your answer to the previous question will change by much.
Answers will vary. A new simulation gave an
estimate of 40 0.08500
= of the families with 2 girls
had exactly 6 children.
Part 2, Page 2.6
Focus: The situations in this context involve an open-ended number of repetitions, that is, how many tries will it take until a certain number of successes have been reached. These might be called “go until…” questions, where the number n in any repetition varies depending on the desired number of successful outcomes.
As with pages 2.2 and 2.4, students use page 2.6 with situations described as “go until” a certain number of designated outcomes has been observed.
Page 2.6 simulates the number of spins required until a specified number of outcomes designated as a success are observed.
n sets the number of times the desired outcomes are to be observed in a repetition.
The other commands function in the same way as those for page 1.6.
Student Activity Questions—Activity 2
1. If 40% of donors have type A blood, what is the probability that it will take at least 4 donors to find one with type A blood?
a. Estimate an answer to the question.
Answers will vary. Students may think it will be 40% or just guess.
b. Use the spinner on page 2.6 to model the probability that 40% of donors have type A blood. Describe how you can set up a simulation to model the situation.
Answers will vary. Selecting 1, 2, 3, and 4 on the spinner will be 40% of the possible numbers on the spinner. Set the goal at 1, for one donor with type A blood.

Building Concepts: Probability and Simulation TEACHER NOTES
©2016 Texas Instruments Incorporated 18 education.ti.com
Student Activity Questions—Activity 2 (continued)
c. Use the simulation to estimate the probability that it will take at least 4 donors to find one with type A blood.
Answers will vary. One possible answer is 37200
or 0.185.
d. What are the mean and median of your simulated distribution of the number of donors? Explain what each means in the context of the problem.
Answers will vary. In one example, the median was 2, which meant that half of the time it took up to 2 donors before there was one with type A blood, and the mean was 2.4, which indicates that on average you would see 2.4 donors to find one with type A blood.
2. How is the problem above different from the problems in Part 1? Use examples from the problems above to support your thinking.
Answer: The number in a repetition was fixed in the problems for Part 1. In Part 2, the number of repetitions varied depending on how long it took to reach a specified number of successes. In the Blood Donor problem in Part 1, the object was to find the probability of having seven type A donors in a set of 12 donors. The number of donors was fixed. In the Blood Donors Revisited problem in Part 2, the object was to find how many donors typically were needed in order to find at least one with blood type A. The number of donors was not fixed.
Deeper Dive – Page 1.3
Set up a simulation. Describe the device for simulating the probability and the size of the repetitions you are using for each. Then use the results to estimate the probability.
Suppose over many years the records show that a large snowstorm occurs in a region of the country in April about 50% of the time. The headlines announced: “Rare Event: In three of the past five years we have had snowstorms in April.”
• Estimate how likely you think it will be to have three Aprils with snowstorms in the next five years.
Answers will vary. Some may think it might
happen 35
of the time; others say not very likely.
• Choose a model and simulate the situation to answer the question: How many Aprils with snowstorms happened in the five years represented by your five tosses? Describe the simulation you used.
Answers will vary: Some may use a coin with a fixed 5n = with the number of successes as 3 heads in 5 tosses, that is 3 April snowstorms in 5
years. A possible answer might be 162500
or 0.324
chances of having an April snowstorm in three of five years.
Building Concepts: Probability and Simulation TEACHER NOTES
©2016 Texas Instruments Incorporated 19 education.ti.com
Deeper Dive – Page 1.3 (continued)
• What is the probability of passing a ten-question multiple choice test with three options by guessing if getting at least 6 correct was passing?
Answers will vary. A number cube with the faces
1 and 2 representing the 13
chance of getting a
correct answer by guessing would model the probability. One possible answer might be 38 0.076
500= .
• Will the probability of passing a ten-question multiple choice test with four options by guessing be more than, less than, or the same as your answer to the question above?
Answer: The probability will be less than the probability of passing by guessing when there are three choices because there are more ways to get wrong answers.
Deeper Dive — Page 1.7
Think about the blood donors problem: If 40% of donors have Type A blood, what is the probability that it will take at least 4 donors to find one with Type A blood?
• Sally wanted to set the problem up “going backwards”. She let 1 to 6 be a success and set n 3= . Will this work to answer the question? Explain your reasoning. Check your thinking out by carrying out the simulation.
Answer: Yes, it will work because if you have three donors who do not have Type A blood, it will take at least four donors and maybe more before you find one with Type A blood.
Deeper Dive
Suppose, over many years of records, a river generates a spring flood about 40% of the time. Based on these records, what is the chance that it will flood for at least three years in a row sometime during the next five years? Note that you may have to think about how to adapt the TNS activity to simulate this problem.
Answers will vary. One possible response is to use the spinner page on 1.7 with 4 numbers considered a success. Instead of solely looking at the graph of outcomes, use the table to count the number of times 3 successes were observed in a row. You will have to do only one rep at a time. One example observed 1 rep when there were 3 successes in a row in 20 reps for a probability of
.
1 0.0520
=

Building Concepts: Probability and Simulation TEACHER NOTES
©2016 Texas Instruments Incorporated 20 education.ti.com
Sample Assessment Items
After completing the lesson, students should be able to answer the following types of questions. If students understand the concepts involved in the lesson, they should be able to answer the following questions without using the TNS activity.
1. Which of the following could be used to model a 50% chance in a setting up a simulation?
a. a number cube where the faces 1, 2, and 3 represented a success and faces 4, 5, and 6 a failure.
b. tossing two coins and getting two heads.
c. a spinner with 10 regions, where 1 to 6 represented a success and 7 to 10 a failure.
d. a deck of cards where hearts represented a success.
Answer: a) a number cube where the faces 1, 2, and 3 represented a success and faces 4, 5, and 6 a failure.
2. The following outcomes are from 50 repetitions of tossing a fair coin three times. Let H represent a boy. Estimate the probability that a family with three children will have exactly one boy.
HTT
HTH
HHH
TTH
THT
THT
TTT
HHH
TTH
HHH
HHT
TTT
HHT
TTH
HHH
HTH
THH
TTT
THT
THT
THT
HHH
THH
HTT
HTH
TTT
HTT
HHH
TTH
THT
THH
HHT
TTT
TTH
HTT
THH
HTT
HTH
HTT
HHH
HTH
HTH
HHT
TTH
TTT
HHT
HHT
THT
TTT
HHT
Answer: 1950
or 0.38

Building Concepts: Probability and Simulation TEACHER NOTES
©2016 Texas Instruments Incorporated 21 education.ti.com
3. A softball player had a 0.3 batting average; that is on average, she made a hit 3 out of 10 times at bat. Rachel used a spinner with 10 equal spaces to simulate the probability that the softball player made at least 2 hits in 5 at bats. Let 1, 2, and 3 represent a hit.
a. Interpret what the set of numbers 13735 represents in terms of the context.
Answer: The player got 3 hits (the 1 and two 3s) in 5 at bats.
b. Use the results of the simulation below to estimate the probability that the player got at least 2 hits out of 5 at bats.
04735 89247 74505 59725 89636 42515 59768 27923 56238 32952
27392 17443 88617 92351 26512 01506 37651 93159 31963 10527
12434 85552 35739 95557 92949 16921 62825 16204 27988 59700
61023 02048 73808 66969 39186 44899 49142 85663 96957 21565
03688 19123 35178 31703 65098 04132 52747 75713 74240 72769
Answer: 25/50 = 0.5
4. Which of the following statements can be made about a simulation designed to answer the question: If the ratio of boys to girls in the class is 1:1, what is the probability that of the 10 class members who tried out for the play, 8 of them are girls?
a. Using the simulation to answer the question will produce the same answer as calculating the theoretical probability.
b. The simulation will show that not many boys tried out for the play.
c. A simulated distribution of the number of girls in the class who tried out for the play will have a mean and median close to 5.
d. The probability that 8 of the 10 class members who tried out for the play were girls based on the simulation will be too low compared to the theoretical probability.
Answer: c) A simulated distribution of the number of girls in the class who tried out for the play will have a mean and median close to 5.
5. Which is more likely to happen?
a. You toss a coin 6 times, and get exactly 3 heads.
b. You toss a coin 100 times and get 99 heads.
c. You toss a coin 200 times and get between 98 and 103 heads.
Response: c) You toss a coin 200 times and get between 98 and 103 heads.
25 0.550
=
Building Concepts: Probability and Simulation TEACHER NOTES
©2016 Texas Instruments Incorporated 22 education.ti.com
Student Activity Solutions
In these activities you will compare estimated probabilities from simulations to theoretical probabilities. After completing the activities, discuss and/or present your findings to the rest of the class.
Activity 1 [Page 1.7]
1. It is important that the device used to model the probability of a success in a given situation can actually be adapted to match the probability of the success. Which of the methods do you think will work for simulating the probability of guessing at the answers to multiple choice questions with four options? Explain your thinking in each case.
a. toss a coin where heads represents the chance of guessing the right option.
b. toss a number cube where 1 represents the correct choice, 2, 3, and 4 incorrect. When a 5 and 6 happen, do not count them.
c. spin a spinner where 1 and 2 represent a correct answer, 3 to 8 represent wrong answers and 9 and 0 should be skipped.
d. toss a coin twice where two heads represents the correct choice, a head and tails and two tails represent the incorrect choice.
Answers: Tossing one coin will not work because the probability of a head is not 14
. All of the other
strategies will work to simulate a probability of 14
.
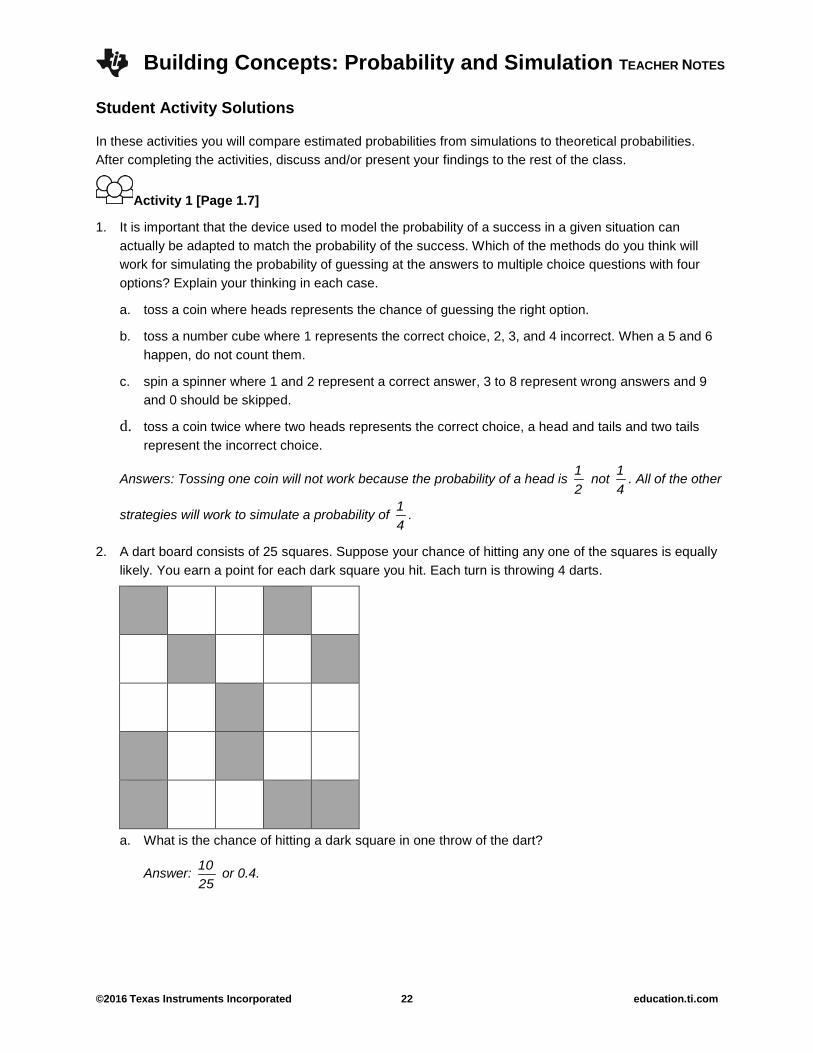
2. A dart board consists of 25 squares. Suppose your chance of hitting any one of the squares is equally likely. You earn a point for each dark square you hit. Each turn is throwing 4 darts.
a. What is the chance of hitting a dark square in one throw of the dart?
Answer: 1025
or 0.4.
12

Building Concepts: Probability and Simulation TEACHER NOTES
©2016 Texas Instruments Incorporated 23 education.ti.com
b. Describe a simulation you could use to estimate the probability of getting four points for one turn. Note that menu for both pages 1.5 and 1.7 have Include Numbers as an option. This allows you to not count some of the faces of the number cube or some of the numbers of the spinner when they occur.
Answers will vary. Students might use a number cube with 1 and 2 representing hitting a dark square that would earn 1 point; 3, 4, and 5 hitting a white square and earning no points; do not count 6. They might use a spinner in two ways with a repetition being 4 spins. One way would be to let 1, 2, 3, 4 represent hitting a dark space earning a point, and 5, 6, 7, 8, 9, 0 represent hitting a white square earning no points. A second way would be to use the spinner and let 1 and 2 represent hitting a dark square earning a point and 3, 4, and 5 represent hitting a white square not earning a point and skip 6, 7, 8, 9, and 0.
c. Choose a model, then run the simulation and use it to estimate the probability you will earn three points when it is your turn to shoot darts.
Answers will vary. In one simulation, the estimated probability of earning three points was 0.15.
d. Use your simulated results to estimate the probability of getting at least 3 points.
Answers will vary. One possibility might be 0.17.
Activity 2 [Page 2.6]
1. If 40% of donors have type A blood, what is the probability that it will take at least 4 donors to find one with type A blood?
a. Estimate an answer to the question.
Answers will vary. Students may think it will be 40% or just guess.
b. Use the spinner on page 2.6 to model the probability that 40% of donors have type A blood. Describe how you can set up a simulation to model the situation.
Answers will vary. Selecting 1, 2, 3, and 4 on the spinner will be 40% of the possible numbers on the spinner. Set the goal at 1, for one donor with type A blood.
c. Use the simulation to estimate the probability that it will take at least 4 donors to find one with type A blood.
Answers will vary. One possible answer is 37200
or 0.185.
d. What are the mean and median of your simulated distribution of the number of donors? Explain what each means in the context of the problem.
Answers will vary. In one example, the median was 2, which meant that half of the time it took up to 2 donors before there was one with type A blood, and the mean was 2.4, which indicates that on average you would see 2.4 donors to find one with type A blood.
Building Concepts: Probability and Simulation TEACHER NOTES
©2016 Texas Instruments Incorporated 24 education.ti.com
2. How is the problem above different from the problems in Part 1? Use examples from the problems above to support your thinking.
Answer: The number in a repetition was fixed in the problems for Part 1. In Part 2, the number of repetitions varied depending on how long it took to reach a specified number of successes. In the Blood Donor problem in Part 1, the object was to find the probability of having seven type A donors in a set of 12 donors. The number of donors was fixed. In the Blood Donors Revisited problem in Part 2, the object was to find how many donors typically were needed in order to find at least one with blood type A. The number of donors was not fixed.