probability and risk: foundations and economic … and risk: foundations and economic implications...
TRANSCRIPT

Probability and Risk:Foundations and EconomicImplications of Probability-Dependent Risk Preferences
Helga Fehr-Duda1 and Thomas Epper1,2
1Institute for Environmental Decisions, ETH Zurich, 8092 Zurich, Switzerland;email: [email protected] of Economics, University of Zurich, 8006 Zurich, Switzerland;email: [email protected]
Annu. Rev. Econ. 2012. 4:567–93
First published online as a Review in Advance onMay 29, 2012
The Annual Review of Economics is online ateconomics.annualreviews.org
This article’s doi:10.1146/annurev-economics-080511-110950
Copyright © 2012 by Annual Reviews.All rights reserved
JEL codes: D01, D81, C81, C90
1941-1383/12/0904-0567$20.00
Keywords
risk preferences, rank-dependent utility, cumulative prospect theory,
disappointment aversion, probability weighting
Abstract
A large body of evidence has documented that risk preferences
depend nonlinearly on outcome probabilities. We discuss the foun-
dations and economic consequences of probability-dependent risk
preferences and offer a practitioner’s guide to understanding and
modeling probability dependence. We argue that probability depen-
dence provides a unifying framework for explaining many real-world
phenomena, such as the equity premium puzzle, the long-shot bias
in betting markets, and households’ underdiversification and their
willingness to buy small-scale insurance at exorbitant prices. Recent
findings indicate that probability dependence is not just a feature of
laboratory data, but is indeed manifest in financial, insurance, and
betting markets. The neglect of probability dependence may prevent
researchers from understanding and predicting important phenomena.
567
Ann
u. R
ev. E
con.
201
2.4:
567-
593.
Dow
nloa
ded
from
ww
w.a
nnua
lrevi
ews.o
rgby
178
.193
.5.1
41 o
n 01
/05/
13. F
or p
erso
nal u
se o
nly.

“I believe, indeed, that probability nonlinearity will eventually be recognized
as a more important determinant of risk attitudes than money nonlinearity.”
(Prelec 2000, p. 89)
1. INTRODUCTION
Every day people make decisions with uncertain consequences. These decisions are often
quite trivial, such as when to leave for work. Sometimes they have long-term effects on
people’s well-being, such as whom to marry or which investment strategy to pursue. In
economics, a decision maker’s choices among different options are conventionally modeled
in the following way: The utilities of the potential consequences of each option are assessed
and weighted by the probabilities with which the respective consequences materialize.
The sum of the weighted utilities, an option’s expected utility, determines the value of
the option. Hence probabilities affect valuation linearly. Ultimately, the decision maker
chooses the option with the highest expected utility. There is abundant evidence, however,
that expected utility theory (EUT) is at odds with the facts: People’s risk-taking behavior
appears to depend nonlinearly on the probabilities.
To illustrate why the assumption of linearity in probabilities is counterfactual, we take a
closer look at a famous example, introduced by Allais (1953): Imagine an individual were
to choose between 1 million dollars for certain and 5 million dollars materializing with a
probability of 98%. Most people choose the certain option of 1 million dollars. In the
language of EUT, 1 u(1) is greater than 0.98 u(5), where u(!) denotes the utility of money.
Mathematically, this inequality also holds when both sides are multiplied by a positive
constant. For example, scaling down the probabilities by a common factor should not
affect the inequality and hence should leave the ranking of the alternatives intact. Now
consider the choice between a 1% chance of receiving 1 million dollars and a 0.98%
chance of receiving 5 million dollars. In this case, the majority of decision makers opt
for the 5-million-dollar alternative. Scaling down the probabilities of 100% and 98% by
0.01 induces many people to reverse their choices; i.e., in terms of EUT, 0.01 u(1) is nowless than 0.0098 u(5). This behavior is obviously inconsistent with EUT. Instead, people
behave as if the probabilities themselves affect the values of 1 million and 5 million dollars.
Some authors have argued that EUT is often violated because it does not capture all the
necessary ingredients of the utility function—for example, it ignores hopes and fears
associated with risky situations. An intuitive explanation for Allais’ common ratio paradox
is the fear of disappointment: Losing a gamble over an almost-certain 5 million dollars is
anticipated to be much more disappointing than losing a gamble over 5 million dollars that
has only a tiny chance of materializing in the first place. Therefore, people stick with the
certain smaller amount in the first situation and favor the option promising the larger
amount in the second situation. Thus, if people fear disappointment, their preferences are
effectively probability dependent. A large body of experimental research has accumulated
since Allais challenged the descriptive validity of EUT more than half a century ago (for
reviews, see Starmer 2000 and Sugden 2004), and the Allais paradox has been replicated
numerous times with various rewards: hypothetical and real, as well as small and large
(Hagen 1979; Kahneman & Tversky 1979; MacCrimmon & Larsson 1979; Battalio et al.
1985, 1990; Conlisk 1989; Kagel et al. 1990).
The probability dependence of risk preferences not only is evident in specifically struc-
tured choice problems, but also appears to be a general characteristic of behavior. That risk
568 Fehr-Duda " Epper
Ann
u. R
ev. E
con.
201
2.4:
567-
593.
Dow
nloa
ded
from
ww
w.a
nnua
lrevi
ews.o
rgby
178
.193
.5.1
41 o
n 01
/05/
13. F
or p
erso
nal u
se o
nly.

preferences are actually probability dependent can be established in a completely model-
free way, as we show in Section 2. We discuss models of probability-dependent risk pref-
erences that are tractable and useful for applied economics in Section 3. Section 4 is
dedicated to important issues encountered in empirical work. In Section 5, we demonstrate
that probability dependence is not just a robust feature of subjects’ behavior in the labora-
tory but appears to be present in financial, insurance, and betting markets. We argue that
probability dependence provides a unifying account of many real-world facts that are
difficult to reconcile within the framework of EUT, such as the equity premium puzzle,
the long-shot bias in betting markets, and households’ underdiversification and their will-
ingness to buy small-scale insurance at exorbitant prices. Our goal is to provide a practi-
tioners’ guide to understanding probability-dependent risk preferences.
2. THE FAMOUS INVERSE S
For simplicity, here we consider decisions under risk, i.e., situations in which probabilities
are known to the decision maker. We show that the raw data on observed risk-taking
behavior indicate that risk preferences are probability dependent in these situations, which
contradicts EUT.
A decision maker’s risk preferences can be assessed by eliciting her certainty equivalents
for risky prospects. A prospect P ¼ (x1, p1; . . .; xn, pn) is a contract that yields outcome
xi with probability pi, where probabilities sum to 1. A prospect’s certainty equivalent
is defined as the certain amount of money that is as valuable as the prospect. If the
certainty equivalent is lower (equal, higher) than the expected value of the prospect, the
decision maker is risk averse (risk neutral, risk seeking). The sign of the risk premium,
the difference between the expected value and the certainty equivalent, therefore reflects
risk preference. If the decision maker’s preferences conform to EUT, the sign of the risk
premium depends solely on the curvature of the utility function and thus is independent
of probabilities.
In the following, we present two different sets of data on risk-taking behavior. The first
is a subset of the data elicited from students of two major Swiss universities in 2006
(Bruhin et al. 2010). The second comes from a recent online experiment with a representa-
tive sample of the Swiss German-speaking, adult population (Epper et al. 2011b). Both
experiments were based on similar experimental procedures designed to elicit certainty equiv-
alents for a large number of two-outcome gain prospects P¼ (x1, p; x2) with x1> x2$ 0. The
prospects were not selected to specifically test for common ratio violations but constituted
a balanced mix of different levels of probabilities combined with different levels of payoffs.
Figure 1a,b (see color insert) represents the observed median relative risk premiums,
i.e., risk premiums normalized by the prospects’ expected values, plotted against the proba-
bility of the prospects’ best outcomes, p. Contrary to the predictions of EUT and consistent
with a vast number of previous findings (e.g., reviewed in Starmer 2000), observed relative
risk premiums exhibit a systematic pattern in both data sets: People are on average risk
seeking for small probabilities and risk averse for medium and large probabilities of the
best payoff x1. The probability dependence of risk preferences can thus be established in a
completely model-free way, without any prior theoretical assumptions. Any descriptively
valid theory of risk-taking behavior must therefore be able to capture this phenomenon.
Given this regularity, what are the requirements for such a descriptively valid model?
Obviously, a utility function with convex and concave segments, such as that proposed by
www.annualreviews.org " Probability and Risk 569
Ann
u. R
ev. E
con.
201
2.4:
567-
593.
Dow
nloa
ded
from
ww
w.a
nnua
lrevi
ews.o
rgby
178
.193
.5.1
41 o
n 01
/05/
13. F
or p
erso
nal u
se o
nly.

Friedman & Savage (1948), will not do the job because the probability dependence of risk
preferences is observed at many payoff levels. One straightforward way to capture proba-
bility dependence (discussed in detail in Section 3.1) is to model it directly by a probability
weighting function w(p). If the utility of money is concave, risk seeking can emerge only
if small probabilities are sufficiently overweighted. Overall, the experimental evidence is
consistent with a probability weighting function that exhibits an inverse S-shaped form,
first concave, cutting the diagonal from above, and then convex. And indeed, this is the
shape estimated from our student and representative data (Figure 1c,d).
An inverse S-shaped weighting function generally fits aggregate experimental data well
(see the summary in Stott 2006). At the level of individual behavior, however, we find
considerable heterogeneity, the most common shapes being inverse S and convex curves
(Tversky & Kahneman 1992, Gonzalez & Wu 1999, van de Kuilen & Wakker 2011).
Two distinct characteristics usually describe the shape of the probability weighting func-
tion, namely curvature and elevation. Curvature essentially captures the departure from
the diagonal (i.e., from linear weighting), whereas elevation expresses the relative degree
of optimism. The more elevated the curve, the comparatively more optimistic the decision
maker is with respect to gains.
3. THEORIES OF PROBABILITY-DEPENDENT RISK PREFERENCES
The literature on alternatives to EUToffers a wide range of modeling options—numbering
well into double figures—and the debate remains ongoing. So how can one choose among
them? We sift through the options on the basis of some general and more specific criteria.
We presume that, in general, economists are reluctant to dispense with the basic proper-
ties of completeness, continuity, transitivity, and monotonicity (with respect to first-order
stochastic dominance). We sympathize with this view, not because we think that individual
behavior always conforms to all these principles, but because we are convinced that
applied work needs mathematically tractable models. This choice comes at a cost: The
models presented below may not be able to describe individuals’ behaviors in every con-
ceivable decision situation. However, a useful model should be able to capture the essential
characteristics of risk preferences, our second requirement.
As the discussion in Section 5 demonstrates, many real-world phenomena regarding
insurance decisions and asset returns (Epstein & Zin 2001) are not compatible with
risk neutrality over small risks. Segal & Spivak (1990) call this sensitivity to small risks
“first-order risk aversion,” whereas approximate risk neutrality over small risks is termed
“second-order risk aversion.” As first-order risk aversion has turned out to be a crucial
characteristic of people’s behavior, it is an indispensable model desideratum. Second-order
risk aversion, however, applies to many alternatives of EUT, and this criterion therefore
reduces the set of eligible models considerably.
Finally, we require that the model accommodate the most frequently observed viola-
tions of EUT that triggered the search for alternatives in the first place. Three types of
regularities in human behavior drove the development of new models: the actuarially
unfair terms on which many people simultaneously gamble and insure (Sugden 2004),
common ratio effects, and common consequence effects (the latter two pointed out in
Allais 1953). The example discussed in Section 1 belongs to the category of common ratio
effects. Common consequence effects are observed when the ranking of two prospects
reverses after a common consequence has been added to both prospects.
First-order riskaversion: risk aversionover small risks,generated byindifference curves inthe outcome spacethat are kinked(nondifferentiable)at the certainty line
Second-order riskaversion: risk aversionover small risksconverging torisk neutrality
Common ratio effect:when scaling downprobabilities, theoriginal preferencefor a low-outcomeoption over ahigh-outcome optionchanges in favorof the high-outcomeoption; a violationof independence
Common consequenceeffect: when adding acommon consequenceto each of a pair ofprospects, the originalpreference for oneof the options reversesin favor of the otheroption; a violationof independence
570 Fehr-Duda " Epper
Ann
u. R
ev. E
con.
201
2.4:
567-
593.
Dow
nloa
ded
from
ww
w.a
nnua
lrevi
ews.o
rgby
178
.193
.5.1
41 o
n 01
/05/
13. F
or p
erso
nal u
se o
nly.

These desiderata, listed in Table 1, rule out a large number of nonexpected utility
models and reduce the list to two types of tractable models: rank-dependent models
(Quiggin 1982, Tversky & Kahneman 1992) on the one hand and models of disappoint-
ment aversion (Gul 1991) on the other.1
The most notable difference between these two model types is the way probability
dependence is accounted for. Rank-dependent models are silent on the sources of proba-
bility dependence and capture it directly with a probability weighting function, whereas a
specific type of reference dependence drives probability dependence in the disappointment-
aversion model.
3.1. Rank Dependence
There are two variants of rank-dependent models: rank-dependent utility and cumulative
prospect theory. Generally, outcomes are ranked according to desirability, and their proba-
bilities are replaced by decision weights. Decision weights are derived from the entire
probability distribution instead of from transforming each probability separately, in
contrast to the original version of prospect theory (Kahneman & Tversky 1979), which
violates first-order stochastic dominance. The intuition for the rank-dependent approach
is that two outcomes with the same probability need not have the same decision weight.
Typically, extreme outcomes are likely to be overweighted because of their salience,
whereas intermediate outcomes receive much less weight (Quiggin 1982, Diecidue &
Wakker 2001).2
Let P ¼ (x1, p1; . . .; xn, pn) denote a risky prospect yielding outcome xi with probability
pi where x1 $ . . . $ xn andP
pi ¼ 1. u(x) is an increasing utility function over monetary
outcomes with u(0) ¼ 0. Let w(p) be an increasing probability weighting function with
w(0) ¼ 0 and w(1) ¼ 1. Decision weights pi are defined as
pi ¼w(p1) for i ¼ 1,
wPi
k¼1pk! "
%wPi%1
k¼1pk! "
for 2 & i & n.
(
ð1Þ
Table 1 Model desiderata
Type Characteristic Justification
General Completeness, transitivity, continuity, monotonicity Tractability
Risk preference First-order risk aversion Empirical validity
Probability weighting Subproportionality, inverse S-shape Empirical validity
1Gul’s model belongs to the Chew-Dekel class of betweenness-respecting models (Dekel 1986, Chew 1989), not allof which obey first-order risk aversion. Chew’s (1989) theory of semiweighted utility displays first-order risk aver-sion. It encompasses Gul’s model as a special case but is, in our view, less tractable than that of Gul’s. Other modelsthat rely on an intuition similar to disappointment aversion (e.g., Loomes & Sugden 1986) do not entirely fulfillour criteria.2It is our impression that this feature of rank-dependent utility has often not been properly understood. For exam-ple, an inverse S-shaped probability weighting function does not imply that all small probabilities are overweighted.Whether a small probability is overweighted or underweighted depends on the rank of the outcome to which itis attached.
www.annualreviews.org " Probability and Risk 571
Ann
u. R
ev. E
con.
201
2.4:
567-
593.
Dow
nloa
ded
from
ww
w.a
nnua
lrevi
ews.o
rgby
178
.193
.5.1
41 o
n 01
/05/
13. F
or p
erso
nal u
se o
nly.

Clearly,Pn
i pi ¼ 1. Then the prospect is evaluated according to
V Pð Þ ¼Xn
i
piu xið Þ. ð2Þ
In this formulation of rank-dependent utility theory, the decision weight of the best
outcome x1 equals its weighted probability w(p1). In this sense, w(p) is a good-news
probability weighting function. The next best outcome’s decision weight amounts to
w(p1 þ p2) % w(p1), the first term being the weight attached to the probability of getting
x2 or better, the second term reflecting the weight of the probability of getting an outcome
better than x2, and so forth. Hence w is a transformation on cumulative probabilities.
An inverse S-shaped w(p) overweights the best outcomes if they have sufficiently
low probabilities and thereby may generate gambling behavior. If w(p) is convex,
more preferred outcomes are underweighted relative to less preferred ones, which
can be interpreted as a form of risk aversion (Yaari 1987). The way in which rank-
dependent prospect valuation transforms objectively given probabilities is discussed in
Section 3.6 where we introduce parameterized specifications for each of these catego-
ries of weighting functions.
Cumulative prospect theory constitutes a rank- and sign-dependent model in which
outcomes are classified as gains or losses with respect to an (exogenous) reference point.
Gains and losses are ranked according to absolute size and evaluated separately in a
rank-dependent way, in which both utility and decision weights may differ between
gains and losses.3 The loss probability weighting function is a bad-news probability trans-
formation; i.e., it maps the decision weight of the worst outcome. The total prospect
value equals the sum of the gain and loss components. We illustrate this procedure with a
simple example: Consider a prospect P ¼ (x1, p1; . . .; x4, p4), with x1 > x2 > 0 > x3 > x4and the reference outcome zero. Thus x1 is the best positive outcome, and x4 is the
worst negative outcome. Decomposing the prospect into its gain and loss parts renders
Pþ ¼ (x1, p1; x2, p2; 0,1 % p1 % p2) and P% ¼ (x4, p4; x3, p3; 0,1 % p3 % p4). Denoting
the domain-specific utility and probability weighting functions as uþ, u%, wþ, w%, and
setting uþ(0) ¼ u%(0) ¼ 0, renders a total prospect value of
V(P) ¼ wþ(p1)½uþ(x1)% uþ(x2)+ þwþ(p1 þ p2)uþ(x2)
þw%(p4)½u%(x4)% u%(x3)+ þw%(p3 þ p4)u%(x3).
Our final requirement is the model’s ability to capture commonly observed regularities of
human risk-taking behavior, which imposes more structure on the probability weighting
function. As Prelec (1998) notes in his seminal paper, the empirical evidence overdeter-
mines the shape of the probability weighting function. Generally, an inverse S-shaped
function that cuts the diagonal from above does a very good job of accommodating the
simultaneous occurrence of gambling and insurance as well as common consequence vio-
lations. A characteristic independent of an inverse S-shape captures common ratio effects,
however. In this case, probability weights have to display subproportionality, defined
3Tversky & Kahneman (1992) argue that the utility function is concave for gains and convex for losses. Theempirical evidence by and large supports a (weak) concavity of the gain utility function. For losses, the evidence isnot so clear-cut (see, however, Abdellaoui 2000).
572 Fehr-Duda " Epper
Ann
u. R
ev. E
con.
201
2.4:
567-
593.
Dow
nloa
ded
from
ww
w.a
nnua
lrevi
ews.o
rgby
178
.193
.5.1
41 o
n 01
/05/
13. F
or p
erso
nal u
se o
nly.

as follows (Prelec 1998): The subproportionality of the probability weighting function
w(p) holds if 1 $ p > q > 0 and 0 < r < 1 imply the inequality
w(p)
w(q)>
w(rp)
w(rq), ð3Þ
where p and q are probabilities and r is a scaling factor (or a probability). In par-
ticular, subproportionality implies w(rq) > w(r)w(q) for all r,q 2 (0,1). The inequality in
Equation 3 can be interpreted in the following way: Reconsider the typical Allais common
ratio situation in which the prospect with the smaller outcome is originally preferred
to the prospect with the larger outcome. The larger outcome tends to become more salient
in the scaled-down situation if the probability weights of scaled-down probabilities are
less distinguishable from each other than the weights of the original probabilities are.
Hence preference reversals may result. The certainty effect, a special case of the common
ratio effect for p ¼ 1, implies that a certain outcome is devalued disproportionately when
it becomes risky. Subproportionality can be displayed by inverse S-shaped and convex
probability weighting functions. Empirical tests of common ratio violations have usually
been confined to choice problems in which one of the options is a certain outcome.
Therefore, there is much stronger evidence to date of the certainty effect than of general
common ratio effects. For this reason, it is an open question whether subproportionality
is indeed exhibited over the entire probability interval. In any case, a subproportional
convex segment on [p,, 1] for some p, seems a desirable requirement. Overall, the
empirical evidence is consistent with an inverse S-shaped probability weighting function
that displays, at least partially, subproportionality.
3.2. Disappointment Aversion
Gul’s (1991) theory of disappointment aversion is perhaps the most elegant and intuitively
compelling solution of the Allais common ratio paradox. Gul proposes a functional form
for V(P) that includes EUT as a special case and is only one parameter richer. The basic
idea is that when uncertainty resolves, only one of the potential outcomes materializes,
which is perceived as disappointing or elating, depending on its magnitude. Gul proposes a
natural disappointment threshold, the prospect’s certainty equivalent. Its certainty equiva-
lent, by definition, is equally valuable as the prospect and corresponds to the price the
decision maker is willing to pay for the prospect. Formally, the valuation functional is
implicitly defined by decomposing the prospect P into an elation and a disappointment
component, whereby outcomes preferred to the certainty equivalent of P are assigned to
the elation component, and outcomes not preferred to the certainty equivalent are assigned
to the disappointment component. Denote the sum of all elation probabilities by q. Allelation probabilities are then normalized by q, all disappointment probabilities are nor-
malized by 1 % q, and each normalized component is evaluated with its expected utility.
Finally, the total prospect value is a weighted average of the values of the elation and
disappointment components, with the elation weight derived as
w qð Þ ¼ q
1þ 1% qð Þ!. ð4Þ
The parameter ! > %1 captures the decision maker’s sensitivity toward disappointment.
! ¼ 0 implies expected utility, and ! > 0 is disappointment aversion. The greater ! is,
Subproportionality: acritical property that aprobability weightingfunction must satisfyto accommodategeneral common ratioeffects; equivalent toincreasing elasticity
Certainty effect: aspecial case of thecommon ratioeffect in which theoriginal low-outcomeoption materializeswith certainty
www.annualreviews.org " Probability and Risk 573
Ann
u. R
ev. E
con.
201
2.4:
567-
593.
Dow
nloa
ded
from
ww
w.a
nnua
lrevi
ews.o
rgby
178
.193
.5.1
41 o
n 01
/05/
13. F
or p
erso
nal u
se o
nly.

the greater is effective risk aversion. ! > 0 is also a measure of proneness to common
ratio violations. This model has a flavor similar to that of cumulative prospect theory,
but the reference point here, the certainty equivalent, is determined endogenously and
varies with the prospect under consideration.
Suppose that xi is an elating outcome and xj is a disappointing outcome for some i, j.Their contributions to total prospect value are calculated as follows:
q
1þ 1% qð Þ!piqu xið Þ ¼ pi
1þ 1% qð Þ! u xið Þ
¼ ~w pið Þu xið Þ,
1% q
1þ 1% qð Þ!
0
@
1
A pj1% q
u xj# $
¼ 1þ !ð Þpj
1þ 1% qð Þ! u xj# $
¼ 1þ !ð Þ~w pj# $
u xj# $
,
ð5Þ
where ~w(p) ¼ p
1þ (1% q)!< p, for 0 & p < 1 and ! > 0, defines a prospect-specific
probability weighting function with the sum of elating probabilities q determined endoge-
nously.4 This function is linear in p and underweights each probability of a given prospect
by the constant factor1
1þ (1% q)!. Moreover, disappointing outcomes enter prospect
valuation with an additional factor 1 þ !, which overweights disappointing outcomes
relative to elating ones. Hence disappointment-aversion theory can be interpreted as a
variant of rank-dependent utility with only two ranks, comprising the respective elating
and disappointing outcomes, and prospect-specific decision weights.
Routledge & Zin (2010) recently proposed a generalized version of Gul’s model. They
introduce a second parameter that governs the location of the disappointment threshold.
Depending on the magnitude of this parameter, the set of disappointing outcomes is larger
or smaller than in the original model, thereby allowing the model to generate great aver-
sion to large risks.
3.3. Model Comparison
How closely rank-dependent utility and disappointment-aversion models are related can
be seen by studying two-outcome prospects P ¼ (x1, p; x2). In this case, the certainty
equivalent must lie strictly between the two outcomes, and hence the better outcome is
elating and the worse outcome is disappointing. In the weighting formula of Equation 4,
q reduces to the probability of the better outcome p. The resulting weighting function
w(p) ¼ p
1þ (1% p)!is convex and subproportional for ! > 0, and
V(P) ¼ ~w(p)u(x1)þ (1þ !)~w(1% p)u(x2)
¼ w(p)u(x1)þ (1%w(p))u(x2).
Therefore, the predictions generated by a rank-dependent model with the probability
weighting function w are observationally equivalent to the predictions by Gul’s model
(Gul 1991, Wakker 2010), even though the underlying mechanisms producing probability
dependence are quite different. The models also share the characteristic that indifference
4Because a certainty can never be disappointing, ~w 1ð Þ ¼ 1.
574 Fehr-Duda " Epper
Ann
u. R
ev. E
con.
201
2.4:
567-
593.
Dow
nloa
ded
from
ww
w.a
nnua
lrevi
ews.o
rgby
178
.193
.5.1
41 o
n 01
/05/
13. F
or p
erso
nal u
se o
nly.

curves in the (x1, x2) space exhibit a kink at the diagonal, the certainty line, which is the
cause of first-order risk aversion.
The best way of seeing the difference between the models is to inspect their indifference
curves in the unit probability triangle. This tool is constructed for a given set of three
outcomes x1 > x2 > x3. The probability of the worst outcome, p3, is assigned to the
horizontal axis of the triangle; the probability of the best outcome, p1, is assigned to
the vertical axis. Figure 2 (see color insert) shows typical indifference curves for rank-
dependent utility and disappointment aversion. As one can see, they differ substantially.
Rank-dependent models are characterized by nonlinear indifference curves, whereas dis-
appointment aversion is characterized by linear indifference curves with a specific pattern:
Indifference curves fan out in the bottom half and fan in in the top half. Because of the
linearity of indifference curves, disappointment-aversion preferences respect betweenness,
a weaker axiom than the independence axiom of EUT (EUT is characterized by linear
parallel indifference curves).
The most important difference between the models concerns the types of behaviors
they can map. Because rank-dependent utility allows many different forms of probability
weights, it can capture both global risk aversion (by a convex probability weighing
function) and a combination of risk seeking and risk aversion (by an inverse S) even when
the utility function is concave. Disappointment aversion with ! > 0 can accommodate
only global risk aversion in this case. Therefore, the utility function would have to be
convex in certain regions to be able to accommodate both risk-seeking and risk-averse
behavior. The differences between the models are summarized in Table 2.
3.4. Which Model Is Better?
This question can be approached from two different directions, empirical validity or trac-
tability. There is a huge literature testing underlying axioms, investigating indifference
curves in the unit probability triangle, and estimating all kinds of parameterized models.
Summarizing the experimental findings, most of which are based on student samples,
Starmer (2000) cites considerable evidence against linear indifference curves and sees
decision-weight models in the lead (see also Camerer & Ho 1994 and Loomes & Segal
1994). Indeed, inverse S-shaped probability functions fit generally well at the aggregate
level, at least for laboratory data.
Table 2 Differences in model characteristics
Characteristic Rank dependencea Disappointment aversionb
Accommodated risk behavior Risk seeking/aversion or
risk aversion
Risk aversion
Source of probability weighting Preference Endogenous reference point
Effect of probability weighting Overweighting both tails or
lower tail
Overweighting lower tail
Indifference curves in triangle Nonlinear Linear, mixed fanning
aAssuming concave utility and inverse S-shaped or convex probability weighting.bAssuming concave utility and disappointment aversion ! > 0.
Fanning out: riskaversion increasesor remains constantwhen shiftingprobability fromthe lower to thehigher outcomes(stochastic dominance)
Betweenness: aweakened form ofindependencerequiring that theprobability mixtureof two prospectslies between themin preference
Independence: ifprospect A is preferredto prospect B, then aprobability mixtureof Awith a thirdprospect C is alsopreferred to aprobability mixture ofB with C. This impliesthat the preferencefunctional is linearin probabilities
www.annualreviews.org " Probability and Risk 575
Ann
u. R
ev. E
con.
201
2.4:
567-
593.
Dow
nloa
ded
from
ww
w.a
nnua
lrevi
ews.o
rgby
178
.193
.5.1
41 o
n 01
/05/
13. F
or p
erso
nal u
se o
nly.

From a pragmatic point of view, the question should be, what type of behavior is the
model supposed to map? Relative risk premiums such as in Figure 1 are better described
by a rank-dependent model with inverse S-shaped probability weighting. Disappointment
aversion may be a good candidate for modeling situations of global risk aversion, such as
investor behavior in financial markets or insurance choices. In any case, we are not aware
of systematic tests of one model against the other in real-world circumstances that call for
modeling of global risk aversion.
From the viewpoint of tractability, however, there is much to be said in favor of
disappointment aversion. As Backus et al. (2005) explicate in their article “Exotic Pref-
erences for Macroeconomists,” the disappointment-aversion model can be easily used
in econometric work by applying method-of-moments estimators directly to first-order
conditions. First-order conditions for rank-dependent utility are no longer linear in prob-
abilities and make estimation much more complex. Moreover, replacing the indepen-
dence axiom with its weaker cousin, betweenness, has some theoretical appeal because
betweenness amounts to preferences being both (weakly) quasi-convex and quasi-
concave, properties economists know how to work with. Many results in game theory,
auction theory, macroeconomics, and dynamic choice do not require full-fledged inde-
pendence but only betweenness or quasi-concavity (Crawford 1990, Camerer & Ho
1994, Starmer 2000). But of course, all these nice results are of no use if preferences are
effectively nonlinear.
3.5. A Note on Loss Aversion
Probably the most prominent feature of prospect theory is loss aversion, the presumption
that “losses loom larger than gains” (Kahneman & Tversky 1979, p. 279). The concept of
loss aversion only makes sense when there is a reference point that distinguishes losses
from gains. The reference point with respect to which gains and losses are defined has
traditionally been assumed to be an exogenously fixed certain outcome (e.g., the status
quo), but recent developments consider endogenously determined and stochastic specifica-
tions (Sugden 2003, Gul & Pesendorfer 2006, Koszegi & Rabin 2007, De Giorgi &
Post 2011). In their cumulative prospect theory, Tversky & Kahneman (1992) propose a
parametric specification of loss aversion with respect to a fixed outcome that has since
become the gold standard of many estimates of prospect theory parameters and calibra-
tions.5 In our experience, however, there seems to be a lot of confusion about loss aversion. It
is important to understand that, in the context of risky choice, loss aversion kicks in only
when prospects are mixed, containing both gains and losses, i.e., when the reference point lies
strictly between the prospect’s best and worst outcome. Loss aversion does not affect pure
gain and loss prospects, for which there is no “internal” reference point (Kobberling &
Wakker 2005).
5Since the publication of Tversky & Kahneman (1992), any estimates of loss aversion that deviate significantlyfrom the value of two have been eyed with great suspicion, notwithstanding the fact that the original estimatewas based on 25 subjects’ hypothetical decisions over relatively large stakes and that no standard errors werereported (see also Wakker 2010, p. 265). Moreover, their original definition of loss aversion, u(%x2) % u(%x1) >u(x1) % u(x2) for x1 > x2 $ 0 (Kahneman & Tversky 1979, p. 279), is consistent with a utility kink at zerobut does not imply one. The parameterization of loss aversion in their 1992 paper, however, assumes a kinkedutility function.
576 Fehr-Duda " Epper
Ann
u. R
ev. E
con.
201
2.4:
567-
593.
Dow
nloa
ded
from
ww
w.a
nnua
lrevi
ews.o
rgby
178
.193
.5.1
41 o
n 01
/05/
13. F
or p
erso
nal u
se o
nly.

Assume that xj is a loss within a mixed prospect. Its weighted utility in cumula-
tive prospect theory is conventionally modeled as (suppressing the superscripts for
the loss domain)
lpju(xj), ð6Þ
where l > 1 is the index of loss aversion, which is applied to all loss outcomes within a
mixed prospect.
A prospect’s certainty equivalent determines the reference point endogenously in Gul’s
theory. As the certainty equivalent always lies between the best and the worst outcome,
all prospects are mixed by definition. Recall from Equation 5 that all disappointing out-
comes are weighted by the factor 1 þ !, with ! > 0:
(1þ !)~w(pj)u(xj). ð7Þ
Disappointment aversion thus seems to fulfill a function similar to that of loss aversion
in prospect theory. Loss aversion produces a kink in the utility function and hence gen-
erates first-order risk aversion about the reference point. Loosely speaking, loss aversion
predicts large risk aversion in the vicinity of the (fixed) reference point (for mixed pros-
pects) and much less elsewhere (for nonmixed prospects), whereas disappointment aver-
sion predicts the same risk aversion everywhere (because all prospects are mixed).6
Pronounced differences in risk aversion over distinct sets of prospects therefore suggest
the existence of a fixed reference point. We are not aware of any systematic investigations
of this issue, however.
3.6. Parametric Forms for the Probability Weighting Function
Probability weighting functions have to be specified in addition to the utility function for
parameterized estimation of rank-dependent models. In the literature, a host of different
functional forms have been proposed for modeling probability weights (see, e.g., Stott
2006). When deciding on functional forms, the researcher should first thoroughly analyze
the raw data or estimate probability weights nonparametrically to get a feel for the data.
We also performed this exercise for the illustrative examples presented in Section 2. The
nonparametric estimates for our student and representative samples are shown in Figure 1.
As expected, their confidence bars by and large lie within the confidence bands of the
fitted probability weighting curves. In the following, we focus on the most commonly used
specifications of one- and two-parameter versions with their usual parameter restrictions.
3.6.1. One-parameter specifications. One-parameter specifications may be favored for
aggregate data for reasons of parsimony. In our view, however, one-parameter functions
are often not flexible enough to catch the essential features of the data.
Power. This functional form has attracted much attention:
w(p) ¼ pg, ð8Þ
6In prospect theory specifications, mixed prospects are necessary but not sufficient to identify the parameter of lossaversion. It takes both mixed and nonmixed prospects unless one imposes restrictions on other model parameters.
www.annualreviews.org " Probability and Risk 577
Ann
u. R
ev. E
con.
201
2.4:
567-
593.
Dow
nloa
ded
from
ww
w.a
nnua
lrevi
ews.o
rgby
178
.193
.5.1
41 o
n 01
/05/
13. F
or p
erso
nal u
se o
nly.

with g > 1. However, its popularity is a mystery to us, as it is neither subproportional
anywhere, which would be necessary to capture general common ratio violations, nor can
it accommodate the special case of the certainty effect, which in our view is a minimum
requirement. To see this, note thatw(1)
w(p)¼ 1g
pg¼ rg
(rp)g¼ w(r)
w(rp).
Gul. If one needs a convex function that can accommodate common ratio violations, the
specification implied by Gul’s (1991) model is an appropriate choice as it is subpropor-
tional everywhere:
w pð Þ ¼ p
1þ 1% pð Þ! , ð9Þ
with ! > 0. Another example of a convex subproportional specification can be found in
Rachlin et al. (1991).
Tversky-Kahneman. This function is inverse S-shaped and has become extremely popular:
w pð Þ ¼ pg
pg þ 1% pð Þgð Þ1=g, ð10Þ
with 0.279 < g < 1 (Tversky & Kahneman 1992). In fact, many authors identify cumula-
tive prospect theory with this functional specification (and Tversky & Kahneman’s point
estimates). There are several potential drawbacks with it, however. First, it is not mono-
tonic for g < 0.279 (Ingersoll 2008), and the parameter value should therefore always
be restricted to be at least 0.279. Second, the elevation and intersection of the curve
with the diagonal are not independent from one another: Stronger probability distor-
tions (smaller g) are associated with lower points of intersection with the diagonal,
where w(p) ¼ p. This feature produces an artificial negative correlation of the measure
of nonlinearity g with the curvature parameter of the utility function because a lower
elevation of the probability weighting curve captures a characteristic of risk preferences
similar to a more strongly concave utility function. Third, it is not subproportional for
small p, which may not hurt much because it accommodates common ratio violations in
the relevant range.
Karmarkar. This inverse S-shaped function intersects the diagonal at p ¼ 0.5 and therefore
does not produce a correlation with utility curvature:
w(p) ¼ pg
pg þ (1% p)g, ð11Þ
with 0 < g < 1 (Karmarkar 1979). It is not subproportional for small values of p.
Prelec-I. This function has axiomatic foundations and was designed to map common
ratio effects:
w(p) ¼ exp(%ð%ln(p))a), ð12Þ
with 0 < a < 1 (Prelec 1998). Its parameter a is an index of subproportionality. a ¼ 1
captures the limiting case of linearity. The curve features a fixed intersection point at
p ¼ 1=e, which seemed to characterize most experimental findings at the time of its
578 Fehr-Duda " Epper
Ann
u. R
ev. E
con.
201
2.4:
567-
593.
Dow
nloa
ded
from
ww
w.a
nnua
lrevi
ews.o
rgby
178
.193
.5.1
41 o
n 01
/05/
13. F
or p
erso
nal u
se o
nly.

inception. In our data, this intersection is sometimes closer to 0.5 than to 0.37, however
(see Figure 1d).
3.6.2. Two-parameter specifications. Because of the great heterogeneity in individual
behavior, two-parameter functions are generally recommended when modeling individuals’
risk preferences.
Goldstein-Einhorn. This is Karmarkar’s big brother, also known as the linear-in-log-odds
weighting function:7
w(p) ¼ dpg
dpg þ (1% p)g, ð13Þ
with 0 < g < 1 and d> 0 (Goldstein & Einhorn 1987). The additional parameter d governsthe point of intersection with the diagonal and is therefore largely responsible for the
elevation of the curve, whereas g governs departure from linearity. The function is not
subproportional for small p.
Prelec-II. This specification is the multitalented extension of Prelec-I:
w(p) ¼ exp(%b(%ln(p))a), ð14Þ
with 0 < a < 1 and b > 0. The parameter a captures subproportionality, and b is a net
index of convexity. Increasing b increases the convexity of the function without affecting
subproportionality and shifts the point of intersection with the diagonal downward. It
collapses to the simple power function with parameter b in the limiting case of a ¼ 1. In
our experience, Prelec-II and Goldstein-Einhorn fit about equally well (see also Gonzalez &
Wu 1999).
Coming back to our two illustrative data sets, we present parameter estimates for
Prelec-II and the usual isoelastic utility specification u(x) ¼ xm. Maximum likelihood
parameter estimates are displayed in Table 3. Note that we show estimates for 1 % m,1 % a, and 1 % b because departures from linearity can be directly tested. Evidently,
there are significant differences between the estimates for the student sample and the
representative sample. First, the students’ utility function does not depart significantly
from linearity, whereas that of the representative study does. Second, the representative
probability weighting curve is more strongly S-shaped (representative a ¼ 0.423 versus
student a ¼ 0.513) and cuts the diagonal at a higher level of probability (representative
b ¼ 0.868 versus student b ¼ 0.958). The corresponding graphs are presented in
Figure 1. What do these differences predict with regard to risk-taking behavior over more
complex gambles? This is the issue we address next.
Rank dependence becomes particularly interesting when there are more than two out-
comes. The characteristics of the probability weighting function, inverse S or convex,
determine the effects of rank dependence on the decision weights of the outcome utilities.
Figure 3 (see color insert) shows how Prelec-II and Goldstein-Einhorn affect decision
weights for a uniform discrete probability distribution of 21 outcomes ranked by mag-
nitude. When there are more than two outcomes, a general feature of inverse S-shaped
7Gonzalez & Wu (1999) derive a necessary and sufficient preference condition for two-outcome prospects in arank-dependent representation.
www.annualreviews.org " Probability and Risk 579
Ann
u. R
ev. E
con.
201
2.4:
567-
593.
Dow
nloa
ded
from
ww
w.a
nnua
lrevi
ews.o
rgby
178
.193
.5.1
41 o
n 01
/05/
13. F
or p
erso
nal u
se o
nly.

probability weighting curves in rank-dependent models is that both tails of the distribu-
tion are overweighted while the intermediate outcomes are underweighted, which cap-
tures the intuition that extreme outcomes are more salient to the decision maker. The
one-parameter versions (b ¼ d ¼ 1) with an index of nonlinearity of a ¼ g ¼ 0.9 show
the slight skewness preference of Prelec-I due to its asymmetrical intersection with
the diagonal, while Karmarkar is perfectly symmetrical. When nonlinearity is increased,
decision weights diverge more dramatically from uniform probabilities. Finally, moving
elevation d or convexity b away from unity affects skewness.
The estimates for our student and representative samples indicate that the departure
from linearity is stronger and convexity is weaker in the representative sample. These
differences suggest that the general population exhibits a comparatively greater over-
weighting of a prospect’s best outcome and is therefore likely to be more susceptible to
buying lottery tickets than students are.
Figure 3c shows the effect of a convex subproportional function in rank-dependent
specifications, which overweights the lower tail of the distribution at the expense of its
upper tail, which is also a principal characteristic of Gul’s disappointment model. Gul’s
model generates a somewhat different picture, however. Because there are only two ranks,
Table 3 Estimation results for rank-dependent utility
PE SE z p value
Student sample
1 % m 0.036 0.024 1.475 0.140
1 % a 0.487 0.041 11.793 0.000
1 % b 0.042 0.019 2.226 0.026
Subjects 118
Observations 2,106
Representative sample
1 % m 0.142 0.019 7.564 0.000
1 % a 0.577 0.017 33.537 0.000
1 % b 0.132 0.018 7.315 0.000
Subjects 308
Observations 5,976
The table lists rank-dependent utility parameter estimates for the student and representative data. Details of data and
estimation are explained in the Supplemental Appendix. PE denotes point estimates and SE their corresponding boot-
strap standard errors (based on 4,000 replications). Bootstrapping accounts for the panel structure of the data. The
parameters are specified to allow for direct tests of linearity. The parameter 1 % m is the relative Arrow-Pratt index of
the concavity of the utility function. 1 % a is an index of subproportionality, and 1 % b is an index of the concavity of
the probability weighting function (Prelec-II). The weighting function takes an inverse S-shaped form for 1 % a > 0,
whereas it becomes more concave for larger values of 1 % b. Point estimates reveal that the utility function is
approximately linear for students and concave for the representative sample. Both probability weighting functions have
an inverse S-shaped form. The p values indicate that linearity of probability weights is clearly rejected and that the
Prelec-I function (b ¼ 1) would be an inadequate choice here. The probability weighting functions, together with their
95% confidence bands, are plotted in Figure 1.
580 Fehr-Duda " Epper
Supplemental Material
Ann
u. R
ev. E
con.
201
2.4:
567-
593.
Dow
nloa
ded
from
ww
w.a
nnua
lrevi
ews.o
rgby
178
.193
.5.1
41 o
n 01
/05/
13. F
or p
erso
nal u
se o
nly.

equiprobable outcomes are assigned a constant weight depending on the outcomes being
disappointing or elating. Figure 4 (see color insert) shows decision weights for two different
levels of disappointment aversion, ! ¼ 1 and ! ¼ 2. The greater the disappointment param-
eter !, the more pronounced is the overweighting of the lower tail. The disappointment
threshold is determined endogenously by the certainty equivalent of the prospect under
consideration. In its generalized form, introduced by Routledge & Zin (2010), an additional
parameter moves the disappointment threshold away from the certainty equivalent.
4. EMPIRICAL ISSUES
4.1. Heterogeneity
There is overwhelming evidence of heterogeneity in individuals’ proneness to probability
distortions in the laboratory (Hey & Orme 1994, Gonzalez & Wu 1999), and it is also
evident in real-world behavior. Andrikogiannopoulou (2010) makes use of unique panel
data on individuals’ betting activities in an online sportsbook, comprising a wide range of
different sports, such as soccer, tennis, basketball, and darts. Pooled estimates of proba-
bility weighting parameters show a significant, but rather moderate departure from line-
arity of the inverse S-shaped variety. However, there is pronounced heterogeneity in
preference parameters at the individual level.
A parsimonious way of capturing heterogeneity is to estimate finite-mixture models,
which classify individuals according to risk-taking type. Bruhin et al. (2010) analyze three
different student data sets and find that a group of approximately 20% of their Swiss
and Chinese students barely depart from linear probability weighting. Moreover, their
average utility functions are close to linear as well, so by and large these people can be
characterized as expected value maximizers. For 80%, however, estimates show the typical
inverse S-shaped probability weighting. So at least in the student population there is a
nonnegligible percentage of people who seem not to be prone to probability weighting.
Let us consider Figure 5a (see color insert), which shows the estimated probability weight-
ing curves for the two different behavioral types found in our student data, presented in
Section 1. The curve of the minority group (type II) almost coincides with the diagonal,
whereas the majority (type I) exhibits the usual inverse S-shape.
Applying the mixture approach to our representative data set reveals a different pic-
ture: Figure 5b shows strongly inverse S curves that differ predominantly in elevation,
i.e., the degree of optimism. We do not find a well-defined group of expected utility maxi-
mizers even when searching for more than two types. It therefore appears that a continuity
of different degrees of probability distortions characterizes the general population.
Gamblers may constitute a specific subgroup of the population, however. Kumar (2009)
finds that people who purchase state lottery tickets belong to the same socioeconomic
group as those who buy predominantly lottery-type stocks, characterized by low prices,
high positive skewness, and high idiosyncratic volatility. In the United States, the most
frequent lottery players are poor, young, and relatively poorly educated young men who
live in urban areas and belong to specific ethnic minorities. We conjecture that this group
of people also exhibits strongly inverse S-shaped probability weighting curves. Pronounced
probability distortions would explain their preference for positively skewed stocks and
state lottery tickets because outlying large prizes are strongly overweighted in this case.
Andrikogiannopoulou’s (2010) analysis does not control for socioeconomic characteristics,
www.annualreviews.org " Probability and Risk 581
Ann
u. R
ev. E
con.
201
2.4:
567-
593.
Dow
nloa
ded
from
ww
w.a
nnua
lrevi
ews.o
rgby
178
.193
.5.1
41 o
n 01
/05/
13. F
or p
erso
nal u
se o
nly.

but she confirms that sportsbook bettors who depart more pronouncedly from linearity
indeed engage in more strongly positively skewed bets. On average, online sportsbook
bettors display only a moderately curved probability weighting function, which suggests
that they are distinct from state lottery gamblers. Interestingly, her estimates of a mixture
model classify approximately 15%–20% of her sample as expected utility agents, which
lies close to the student percentage.
Although the favorite-long-shot bias in betting markets is one of the best documented
anomalies in the literature, some betting markets (such as those for football, basketball,
baseball, and hockey) are characterized by a reverse bias, with favorites being overbet
and long shots underbet. Sobel & Ryan (2008) conjecture that the mix of different betting
types (casual bettors, serious bettors, and arbitrageurs) is decisive for the direction of the
bias. Their main hypothesis is that the more complex the bet or the more uninformed the
bettors, the more likely the regular bias is to emerge.
One might ask whether professionals who are trained to deal with risk are less prone to
probability distortions. A recent experiment by List & Haigh (2005) finds that traders
from the Chicago Board of Trade exhibit Allais-type violations in simple choices, but to a
lesser degree than students do. Fox et al. (1996) analyze professional options traders’
valuations of risky prospects based on future values of various stocks, their area of exper-
tise, and report that valuations coincide with their expected values. This highly selective
group thus seems less vulnerable to probability distortions, which may result from training
and experience (or personal characteristics they have in the first place).
Finally, the vast majority of studies find women to be relatively more risk averse than
men are (Croson & Gneezy 2009). Fehr-Duda et al. (2006) and Booij et al. (2010) present
experimental evidence that women tend to weight probabilities more pessimistically than
do men, which explains their greater observed risk aversion.
The upshot of these findings is that there is substantial heterogeneity in proneness to
probability distortions. Estimated market weighting functions are not always inverse S-shaped
but sometimes exhibit the opposite pattern, which may result from changing compositions
of behavioral types in the market, among other factors. Therefore, clarifying the relation-
ship among market-specific heterogeneity, participation decisions, and market outcomes is
a challenging direction of future research (Chapman & Polkovnichenko 2009).
Heterogeneity has also an important implication for a much more mundane problem:
When calibration exercises are performed on the basis of parameters estimated from some
laboratory data, these estimates depend crucially on the types of people participating in
the experiment. These estimates may therefore be totally unfit for predicting behavior of
some other group of people, which is quite obvious when comparing our student results
with the representative ones.
4.2. Artifacts of the Measurement Procedure
There is no doubt that, at least to some extent, elicitation procedure has an effect on
measured risk preferences. The crucial question, however, is whether the effect leads to
wrong inferences on actual risk preferences. Recently, Harbaugh et al. (2010) present an
example of an apparent violation of procedure invariance: In their pricing task, they elicit
subjects’ willingness to pay for a small set of prospects and ask them to choose between the
same prospects and their expected values in a choice-based procedure. The authors find
probability-dependent risk preferences in the pricing task but close to risk-neutral behavior
582 Fehr-Duda " Epper
Ann
u. R
ev. E
con.
201
2.4:
567-
593.
Dow
nloa
ded
from
ww
w.a
nnua
lrevi
ews.o
rgby
178
.193
.5.1
41 o
n 01
/05/
13. F
or p
erso
nal u
se o
nly.

in the choice task. This result seems to run counter to conventional wisdom. Stott (2006)
reviews a large number of different studies that report parametric estimates of probability
weighting functions. By and large, the estimated aggregate curves deviate pronouncedly
from linearity, even though elicitation methods differed greatly. Analyzing 80 individuals’
choices over 100 pairs of three-outcome prospects, Hey & Orme (1994) identify rank-
dependent utility as the overall winner among a large number of contenders on the crite-
rion of average rankings.8 It thus seems that the choice-based method per se is not the
culprit for the failure of Harbaugh et al. to find probability-dependent risk preferences
in choices. In all likelihood, the set of prospects rather than the measurement procedure
is responsible for their result. Harbaugh et al. use prospects with one nonzero outcome
P ¼ (x, p).9 In our view, that people appear to be almost risk neutral when confronted
with the choice between a prospect of this type and its expected value is not surprising.
Because it is so obvious that expected value equals outcome times probability, people may
interpret the experiment as a test of their intelligence or numeracy rather than as a prefer-
ence elicitation task.10
Prospects with only one nonzero outcome have another serious disadvantage. Probability
weighting parameters cannot be disentangled from the utility curvature unless specific func-
tional forms are imposed. Such an approach is potentially misleading because the functional
form alone determines the estimates and not the characteristics of risk preferences. There-
fore, we strongly recommend using multi-outcome prospects, with more than one nonzero
outcome, over a wide range of probabilities to be able to generate a sufficiently rich data-
base. This may not always be feasible with field data, however, and the researcher therefore
must take data quality into account when deciding which model to use.
Another reason why violations of independence or probability weighting may not be
evident in people’s behavior is because of the selection of specific prospects for the experi-
mental task as well. Let us consider the probability triangle for rank-dependent utility in
Figure 6 (see color insert), which is obtained from the respective triangle in Figure 2 by
suppressing the border regions. Incidentally, these indifference curves are predicted for our
representative sample by the model estimates in Table 3. The indifference curves in this
truncated triangle look fairly linear, as if conforming with betweenness. Moreover, it will
be quite hard to distinguish them statistically from parallel ones, characterizing indiffer-
ence curves of the expected utility model. It has been known for more than two decades
that violations of EUT are much less frequent inside the probability triangle (e.g., Camerer
1992, Harless & Camerer 1994), but whenever prospects have different support (some lie
on the boundary, some in the interior), expected utility violations are pronounced. So if
subjects are confronted with choices between two off-border prospects, it is not sur-
prising when their behavior does not depart strongly from linearity. The strength of the
decision-weight models is that they predict exactly this pattern. Oversensitivity to extreme
probabilities is the reason why these models were devised in the first place, and cutting off
the domain over which they can prove their usefulness is counterproductive. So for prac-
tical purposes of estimation, we recommend including not only multi-outcome prospects,
8Their data set comprises two subsets of choices over identical 100 pairs at two different dates, but they stillconsider these subsamples as “small” and the nature of their data “weak” (Hey & Orme 1994, p. 1311).9The gain prospects are (20, 0.1), (20, 0.4), and (20, 0.8), and outcomes of otherwise identical loss prospectsare %20.10For a similar argument in the context of money-splitting tasks, readers are referred to Camerer (2004).
www.annualreviews.org " Probability and Risk 583
Ann
u. R
ev. E
con.
201
2.4:
567-
593.
Dow
nloa
ded
from
ww
w.a
nnua
lrevi
ews.o
rgby
178
.193
.5.1
41 o
n 01
/05/
13. F
or p
erso
nal u
se o
nly.

but also prospects with differing supports in the set of the experimental tasks. In sum-
mary, failure to find probability-dependent risk preferences may be a result of limitations
in the experimental design and should not be taken as evidence of nonexistence.
4.3. Stake and Delay Dependence of Probability Weights
A good model of risk preferences should be able to predict people’s behavior when circum-
stances change. This is the reason why it is so important that the model captures the essen-
tial characteristics of preferences. Is probability weighting a stable feature of behavior, or do
the proposed models overlook important driving forces? We offer two pieces of evidence
that may cause some concern.
The first finding is related to the well-known fact that relative risk aversion increases
with stake size (Holt & Laury 2005). This regularity is not in conflict with EUT, which is
silent on the existence and direction of stake effects. For instance, one could accommodate
increasing relative risk aversion with a flexible functional form, such as the expo-power
function proposed by Saha (1993). However, Fehr-Duda et al. (2010) show in the context
of a rank-dependent model that the probability weighting function, and not the utility
function, reacts to rising stakes. In an experiment with real rewards conducted in China,
they find a significant and substantial change in the elevation of the probability weighting
curve when stakes are increased from typical laboratory earnings to about a student’s
monthly income. Chinese subjects are characterized by a high degree of optimism over
small gains, which is greatly reduced when stakes are increased. This effect is consistent
with earlier findings by Kachelmeier & Shehata (1992). So far, we are not aware of any
other study with real high stakes that controls for probability weighting, and it is not
clear whether these results carry over to other populations. If significant stake dependence
were to emerge as a robust characteristic of probability weighting, we would have to recon-
sider the assumption of stable decision weights. Such a finding would imply a more compli-
cated interaction between utility and probabilities than that captured by the rank-dependent
model. Without more knowledge about stake dependence, a pragmatic solution would be
to avoid out-of-sample predictions when stakes differ significantly. Our finding of stake
dependence also touches on the issue of the sources of probability dependence. If probability
dependence is generated by reference-dependent preferences, the instability of the probability
weighting function may be an indication of shifting reference points.
The second finding concerns an even more fundamental issue. The traditional models
of decision under risk are atemporal by construction. The resolution of uncertainty, how-
ever, typically involves the passage of time. Citing Machina (1984, p. 199), “Indeed, it is
hard to think of any type of risk which does not involve the delayed resolution of
uncertainty, other than the somewhat artificial (and in any event, completely avoidable)
risks generated by some forms of gambling.” Recently, Abdellaoui et al. (2011) demon-
strate that probability weights for gains are delay sensitive, with longer delays resulting
in more elevated curves. In their experiment, only probability weights, and not the utility
of money, react to the delayed resolution of uncertainty. An increase in elevation thus
translates directly into increased risk tolerance, which is in line with a rising number of
experimental findings on delay-dependent risk tolerance.
Of course, there is no room for such an effect in atemporal preference models. How-
ever, Fehr-Duda & Epper (2011) explain the delay dependence of probability weights with
people’s perception of the future as intrinsically uncertain. They show that people with
584 Fehr-Duda " Epper
Ann
u. R
ev. E
con.
201
2.4:
567-
593.
Dow
nloa
ded
from
ww
w.a
nnua
lrevi
ews.o
rgby
178
.193
.5.1
41 o
n 01
/05/
13. F
or p
erso
nal u
se o
nly.

subproportional probability weights will effectively exhibit greater risk tolerance in this
case.11 So why do we find such pronounced risk aversion in real-world financial markets
in which people’s investments are presumably long term? The key to this puzzle is the
frequency with which prospects are evaluated until their uncertainty resolves fully at the
payment date.
To provide support for this claim, we ignore the passage of time for now and analyze
the valuation of prospects presented as compound gambles. Consider a two-outcome
prospect P ¼ (x1, p; x2), where uncertainty p resolves in two stages, p ¼ rq, as shown
on the left side of Figure 7. Single-stage resolution of uncertainty corresponds to the tree
on the right side. If a decision maker evaluates the compound prospect recursively, he
will come up with
V Pð Þ ¼ w qð Þ w rð Þu x1ð Þ þ 1%w rð Þð Þu x2ð Þ½ + þ 1%w qð Þð Þu x2ð Þ¼ w qð Þw rð Þu x1ð Þ þ 1%w qð Þw rð Þð Þu x2ð Þ.
Subproportionality of the probability weighting function implies w(qr) > w(q)w(r) (seeEquation 3); therefore, the single-stage value is strictly greater than that obtained recur-
sively. Hence, when the decision maker evaluates a compound prospect recursively, he
will exhibit comparatively lower risk tolerance than in the one-shot case (for a discussion
of dynamic consistency in this context, see Fehr-Duda & Epper 2011).
This effect of recursive valuation becomes more pronounced with the number of stages.
To see this, let us consider Figure 8a (see color insert). m denotes the number of evaluation
stages, and here the curve for m ¼ 1 represents a typical subproportional probability
weighting function (Prelec-I, a ¼ 0.5) when outcomes are evaluated in a single stage. If
uncertainty resolves in two (equiprobable) stages rather than in one shot, the prospect is
effectively evaluated with the probability weighting curve m ¼ 2, which shows more
pronounced underweighting. At m ¼ 12, the curve looks extremely convex, implying
strong risk aversion. This results from w(p) ¼ w((p1=m)m) >> w((p1=m))m for any subpro-
portional weighting function w and m > 1.
So far we have abstracted from the passage of real time. Reintroducing time, and with
it inherent future uncertainty, renders the curves in Figure 8b. When uncertainty resolu-
tion is delayed by 12 months, the curve for m ¼ 1 is more elevated than the atemporal
curve in Figure 8a, which explains the greater risk tolerance for delayed prospects found
by Abdellaoui et al. (2011). Compounding weights semiannually or monthly looks less
dramatic than in the atemporal situation, but shows the same tendency toward convex
probability weighting, i.e., increasing risk aversion. Extreme risk aversion can thus result
from several different underlying mechanisms: loss aversion, disappointment aversion, and
Figure 7
Compound versus single-stage prospects.
11Another prediction is that people with subproportional preferences will exhibit hyperbolic discounting if theyview the future as uncertain (Halevy 2008). Evidence of a significant correlation between subproportionality andthe degree of hyperbolic discounting at the individual level can be found in Epper et al. (2011a).
www.annualreviews.org " Probability and Risk 585
Ann
u. R
ev. E
con.
201
2.4:
567-
593.
Dow
nloa
ded
from
ww
w.a
nnua
lrevi
ews.o
rgby
178
.193
.5.1
41 o
n 01
/05/
13. F
or p
erso
nal u
se o
nly.

rank dependence with convex probability weighting or frequent compounding of originally
inverse S-shaped probability weights.
This insight has important implications for market behavior. Betting and gambling
markets are characterized by short time horizons and rapid resolution of uncertainty
(e.g., a horse race). We can therefore expect probability weighting functions to resemble
those estimated from laboratory data, for which uncertainty resolves almost immediately.
The situation is completely different in financial markets in which investments, with the
exception of assets with short maturities, are perceived to have long or indeterminate time
horizons. However, information on portfolio performance is easily accessible. If investors
take the fact that they will check stock market news frequently into account, they are
likely to display excessive risk aversion even when an inverse S-shaped probability weight-
ing function describes their atemporal preferences.12 Experimental evidence clearly con-
firms that high feedback frequency decreases risk tolerance (Gneezy & Potters 1997,
Bellemare et al. 2005) and that the effect is even greater for professional traders than for
students (Haigh & List 2005). This discussion uncovers another source of heterogeneity:
Investors may be differentially prone to frequent portfolio evaluation.
This section demonstrates that probability weights are stake and delay dependent. Stake
dependence potentially constitutes a serious challenge to rank-dependent models if it were
to emerge as a robust feature of behavior. Clearly, more data are needed here. Delay
dependence is particularly important because the majority of real-world decisions are both
risky and delayed. However, the framework presented in Fehr-Duda & Epper (2011) pro-
vides a link between the seemingly contradictory findings of inverse S-shaped probability
weighting for atemporal decisions and predominantly risk-averse behavior in the important
domains of finance and insurance. Moreover, their model generates clear and testable pre-
dictions for observed risk preferences, opening a new avenue for experimental research.
5. FIELD EVIDENCE
We now argue that probability dependence is able to explain real-world phenomena that
are hard to reconcile with EUT. We draw our examples from financial, insurance, and
betting markets that clearly meet this condition.
In finance, the characteristics of an asset’s return distribution are considered to be the
drivers of asset value. When people’s preferences are characterized by an inverse S-shaped
probability weighting function, they overweight both tails of the return distribution;
i.e., they put a comparatively large weight on the best and on the worst outcomes. If the
return distribution is positively skewed (i.e., if extreme positive returns are possible),
overweighting of the upper tail leads to a particularly favorable valuation of positively
skewed assets. Barberis & Huang (2008) show that agents characterized by such a pref-
erence find not only positively skewed portfolios attractive, but also positively skewed
individual assets as well, which in turn will be overpriced relative to the prediction of EUT
and will earn a smaller return than the risk-free rate. This prediction has already been put
to the test with broadly confirmatory results. Assets with positively skewed return distribu-
tions include, for example, IPO stocks, high-volatility stocks, and out-of-the-money options.
Green & Hwang (2012) show that IPO stocks predicted to be more positively skewed
12In a similar vein, Barberis et al. (2006) identify narrow framing as a potential cause of nonparticipation in thestock market.
586 Fehr-Duda " Epper
Ann
u. R
ev. E
con.
201
2.4:
567-
593.
Dow
nloa
ded
from
ww
w.a
nnua
lrevi
ews.o
rgby
178
.193
.5.1
41 o
n 01
/05/
13. F
or p
erso
nal u
se o
nly.

indeed earn lower long-run average returns. Similarly, stocks with high idiosyncratic vola-
tility, which typically also have positively skewed return distributions, seem to be overpriced
as well (Ang et al. 2006, Boyer et al. 2010).
Two recent studies try to identify probability weighting directly in the prices of options
on the S&P500 index. Kliger & Levy (2009) estimate various models for the period
1986–1995 and conclude that models that allow for probability weighting fit much better
than EUT does. The second study, covering the period 1996–2008, also finds evidence
for nonlinear probability weighting using a nonparametric approach (Polkovnichenko &
Zhao 2009).
Another implication of probability weighting concerns the household underdiversi-
fication puzzle (Polkovnichenko 2005). If people concentrate their stock holdings on
positively skewed assets because of the prospect of becoming wealthy, they are likely to be
less diversified than standard theory predicts. Mitton & Vorkink (2007) provide empirical
support for this conjecture: Individuals who are less diversified indeed tend to hold stocks
with more positively skewed returns than those of the typical stock. Firms with more
volatile stock returns may even exploit their employees’ preference for positively skewed
assets: By granting employee stock options to rank-and-file employees, firms can effec-
tively reduce their total personnel cost. Consequently, riskier firms are more likely to have
a broad-based stock option plan. Spalt (2012) shows that firm volatility has significant
explanatory power for the presence of such plans and for the number of stock options
granted to nonexecutive employees.
The discussion above examines the effects of probability weighting on relative stock
prices, but one of the most important challenges for the discipline has been the perfor-
mance of the universe of stocks characterized by a high equity premium, i.e., the return
earned by stocks in excess of that earned by relatively risk-free government bonds. Plausible
levels of risk aversion in the context of expected utility cannot explain these high excess
returns, observed in the United States and in other industrialized countries (Mehra 2006).
The prevailing behavioral explanation for the equity premium puzzle has been myopic loss
aversion (Benartzi & Thaler 1995, Barberis et al. 2001). Myopic investors who closely
watch uncertainty resolve will experience losses more often than investors with a long
evaluation horizon because, over the longer term, gains will compensate losses and the
net effect is likely to be positive. In contrast, De Giorgi & Legg (2012) show that proba-
bility weighting can raise the equity premium considerably above the level predicted by
loss aversion alone. The intuition behind this result is that S-shaped probability weighting
leads to overweighting of a distribution’s tails. It thereby generates aversion to negatively
skewed stock returns, which characterize the overall market. Similarly, Routledge & Zin
(2010) present promising calibrations for the movement of the equity premium in the United
States on the basis of their generalized disappointment-aversion model, which also entails
probability dependence.
Regarding insurance decisions, several facts are at odds with EUT. Because a risk-
averse expected utility maximizer with a differentiable utility function is almost risk
neutral with respect to small risks, her major concern will be the expected value of
the prospect in these decision situations (Pratt 1964). Therefore, she will never buy full
insurance when there is so-called marginal loading, i.e., when the insurance premium is
greater than the expected loss: If all but the last unit are already insured, the decision
maker will consider this last unit almost by its expected value and will insure it only if
the insurance premium at the margin is actuarially fair. This prediction is counterfactual
www.annualreviews.org " Probability and Risk 587
Ann
u. R
ev. E
con.
201
2.4:
567-
593.
Dow
nloa
ded
from
ww
w.a
nnua
lrevi
ews.o
rgby
178
.193
.5.1
41 o
n 01
/05/
13. F
or p
erso
nal u
se o
nly.

as people are willing to buy warranties for household appliances and other small-scale
insurance policies at exorbitant prices. One possible solution to this puzzle within EUT
is that the utility function has a kink at a given wealth level, which generates first-order
risk aversion about this wealth level. However, the phenomenon of the full purchase of
unfair insurance is observed at general wealth levels. Although one can posit many kink
points in the utility function, EUT does not seem to be a good modeling choice here
(Machina 2001). In contrast, rank-dependent preferences can exhibit first-order risk
aversion at general wealth levels.
Another example concerns households’ choices of deductibles. Many people prefer low
deductibles to high deductibles even when the low deductible costs many times more than
the expected value of the extra insurance (Sydnor 2010). Reminiscent of the equity pre-
mium puzzle, this kind of behavior implies extreme risk aversion when interpreted within
the framework of EUT. A more plausible explanation for this kind of widely observed
behavior is that people overweight the probability of damage, resulting in a high degree of
risk aversion over low-probability events. Barseghyan et al. (2010) test this hypothesis by
analyzing consumers’ deductible choices in auto and home insurance policies. Their sample
comprises 4,170 households that purchased new policies from a large US property and
casualty insurance company in 2005 or 2006. Estimates of a structural model allowing for
probability weighting and loss aversion suggest that probability weighting plays the most
important role in explaining observed deductible choices.13
Wakker et al. (1997) raise another issue by showing that customers intensely dislike
insurance policies involving a small probability that claims will not be honored, so-called
probabilistic insurance. Probability weighting can also accommodate the reluctance to buy
probabilistic insurance: If people overweight small probabilities, they demand a compen-
sation for taking on the additional risk of not being reimbursed. The amount of the
required compensation greatly exceeds its actuarial value in this case.
Gambling and betting behavior represents another real-world application of proba-
bility weighting. A famous paradox concerns the favorite-long-shot bias in horse race
and other betting markets, involving underbetting on favorites and overbetting on horses
with a small chance of winning (Jullien & Salanie 2000, Snowberg & Wolfers 2010).
Similarly, state lotteries featuring large jackpots to be won have become extremely popu-
lar. Cook & Clotfelter (1993) show that ticket sales are strongly correlated with the
size of the jackpot rolled over from previous weeks. Overweighting of small probabili-
ties can explain both phenomena, the favorite-long-shot bias and the attractiveness of
state lotteries.
Jullien & Salanie (2000) use British horsetrack data on win bets to fit a representative
model. They argue in favor of a cumulative prospect theory model that appears to provide
a better fit for the favorite-long-shot bias than expected utility does. Snowberg & Wolfers
(2010) provide estimates on the basis of 6.4 million horse race starts in the United States
from 1992 to 2001. By exploiting the prevalence of complex bets,14 they are able to
13An earlier study on purchases of insurance against the risk of telephone line trouble by Cicchetti & Dubin(1994, p. 183) finds some evidence of probability distortions, but “not to any significant degree.” Their findingshave raised some controversy because Cicchetti & Dubin never asked whether buying insurance against such atiny risk at the cost of twice the expected loss is reasonable in the first place (Camerer 2000, Rabin & Thaler2001). Grgeta (2003) argues that their low estimate of relative risk aversion is inconsistent with buying thisexpensive insurance and concludes that their estimates should not be used in support of EUT.14 For the wagering experts among our readers, these complex bets are exacta, quinella, and trifecta.
588 Fehr-Duda " Epper
Ann
u. R
ev. E
con.
201
2.4:
567-
593.
Dow
nloa
ded
from
ww
w.a
nnua
lrevi
ews.o
rgby
178
.193
.5.1
41 o
n 01
/05/
13. F
or p
erso
nal u
se o
nly.

discriminate between the competing models of convex utility and probability weighting,
which yield observationally equivalent predictions for simple win bets. Their results sug-
gest that probability weighting rather than convex utility drives the bias.
All these studies demonstrate that probability dependence is not just a robust feature of
laboratory data, but also provides a rationale for a host of puzzling real-world phenomena.
6. WHERE DO WE GO FROM HERE?
A large body of experimental evidence has challenged the descriptive validity of the
expected utility model. Two behavioral regularities have emerged: loss aversion and prob-
ability dependence. Probability dependence is the more fundamental of the two because it
is observed for all types of prospects: pure gain prospects as well as pure loss and mixed
prospects. In contrast, loss aversion is effective for mixed prospects only. It is our impres-
sion that probability-dependent risk preferences have not received as much attention as
loss aversion has, however. Despite the importance of probability dependence, surprisingly
little is known empirically about its drivers. Are emotional processes such as disappoint-
ment aversion (Gul 1991, Walther 2003), the psychophysics of perception (Tversky &
Kahneman 1992, Wakker 2010), or simply errors of judgment the ultimate cause of
nonlinear preferences? In an early experiment, MacCrimmon (1968) gives subjects the
opportunity to reconsider choices that violated various axioms of EUT. Although many
subjects readily admitted to having made a mistake in cases of violations of transitivity,
they were not willing to change their choices that violated the independence axiom,
which guarantees linearity in probabilities. In fact, they did not even accept the validity
of the independence axiom in discussions with the experimenter [see also the experiment
by Slovic & Tversky (1974)]. It seems that probability dependence is a deeply rooted
characteristic of preferences and not a manifestation of erroneous prospect valuation.
Whatever the mechanism behind probability dependence, some kind of reference depen-
dence seems to play a role: A prospect’s certainty equivalent in the case of disappointment
aversion and the boundaries of the probability scale in the case of diminishing sensitivity are
possible examples. If reference dependence is the ultimate source of probability weighting,
what is the correct reference point? Is it an exogenous point, or does it emerge endoge-
nously? If risk preferences are a fairly stable individual characteristic, the instability of
behavioral parameters may be an indication of shifting reference points. So how do reference
points evolve? These issues are also crucial in loss aversion, which raises the question of
whether probability dependence and loss aversion are more closely related than previously
acknowledged. Dissatisfaction with prospect theory, which does not explain reference-point
formation, has recently triggered the development of new models of reference-dependent
preferences. We expect these new concepts to help clarify the relative roles of loss aversion
and probability dependence in revealed risk-taking behavior.
Another issue to be resolved concerns heterogeneity. We should gain a better under-
standing of market-specific heterogeneity—we need to identify the mix of different types of
agents and the evolution of heterogeneity over time. For this purpose, extensive panel data
on the broad population are required, data that are rich enough to disentangle utility and
probability weighting parameters.
Finally, the atemporal nature of the existing theories must be reconsidered. Accumu-
lating evidence of delay-dependent risk-taking behavior, which is likely attributable to
delay-dependent probability weighting, questions the assumption of the separability of risk
www.annualreviews.org " Probability and Risk 589
Ann
u. R
ev. E
con.
201
2.4:
567-
593.
Dow
nloa
ded
from
ww
w.a
nnua
lrevi
ews.o
rgby
178
.193
.5.1
41 o
n 01
/05/
13. F
or p
erso
nal u
se o
nly.

and delay. Modeling interactions of risk and delay is an active area of current research
that opens up a new direction for empirical research.
Decision research has filled a treasure chest with theories and evidence for over half a
century. It is time for the chest’s contents to be put to good use, and for new research to
build on the knowledge accumulated so far. A lot of work is still to be done, however,
despite the abundance of available insights.
DISCLOSURE STATEMENT
The authors are not aware of any affiliations, memberships, funding, or financial holdings
that might be perceived as affecting the objectivity of this review.
ACKNOWLEDGMENTS
We are grateful for valuable comments and suggestions by Mohammed Abdellaoui, Nick
Barberis, Han Bleichrodt, Vincent Crawford, Ernst Fehr, Drew Fudenberg, Richard Gonzalez,
Faruk Gul, David Laibson, David Levine, Mark Machina, Andrew Oswald, John Quiggin,
Chris Starmer, and Peter Wakker. We assume full responsibility for any errors.
LITERATURE CITED
Abdellaoui M. 2000. Parameter-free elicitation of utility and probability weighting functions. Manag.
Sci. 46:1497–512
Abdellaoui M, Diecidue E, Onculer A. 2011. Risk preferences at different time periods: an experimental
investigation.Manag. Sci. 57:975–87
Allais M. 1953. L’extension des theories de l’equilibre economique general et du rendement social
au cas du risque. Econometrica 21:269–90
Andrikogiannopoulou A. 2010. Estimating risk preferences from a large panel of real-world betting
choices. Unpublished manuscript, Princeton Univ.
Ang A, Hodrick R, Xing Y, Zhang X. 2006. The cross-section of volatility and expected returns.
J. Finance 61:259–99
Backus D, Routledge B, Zin S. 2005. Exotic preferences for macroeconomists. In NBER Macro-
economics Annual 2004, ed. M Gertler, K Rogoff, pp. 319–414. Cambridge, MA: MIT Press
Barberis N, Huang M. 2008. Stocks as lotteries: the implications of probability weighting for security
prices. Am. Econ. Rev. 98:2066–100
Barberis N, Huang M, Santos T. 2001. Prospect theory and asset prices. Q. J. Econ. 116:1–53
Barberis N, Huang M, Thaler RH. 2006. Individual preferences, monetary gambles, and stock market
participation: a case for narrow framing. Am. Econ. Rev. 96:1069–90
Barseghyan L, Molinari F, O’Donoghue T, Teitelbaum JC. 2010. The nature of risk preferences:
evidence from insurance choices. Unpublished manuscript, Cornell Univ.
Battalio R, Kagel J, Jiranyakul K. 1990. Testing between alternative models of choice under uncer-
tainty: some initial results. J. Risk Uncertain. 3:25–50
Battalio R, Kagel J, MacDonald D. 1985. Animals’ choices over uncertain outcomes: some initial
experimental results. Am. Econ. Rev. 75:597–613
Bellemare C, Krause M, Kroger S, Zhang C. 2005. Myopic loss aversion: information feedback vs.
investment flexibility. Econ. Lett. 87:319–24
Benartzi S, Thaler R. 1995. Myopic loss aversion and the equity premium puzzle.Q. J. Econ. 110:73–92
Booij A, van Praag B, van de Kuilen G. 2010. A parametric analysis of prospect theory’s functionals
for the general population. Theory Decis. 68:115–48
590 Fehr-Duda " Epper
Ann
u. R
ev. E
con.
201
2.4:
567-
593.
Dow
nloa
ded
from
ww
w.a
nnua
lrevi
ews.o
rgby
178
.193
.5.1
41 o
n 01
/05/
13. F
or p
erso
nal u
se o
nly.

Boyer B, Mitton T, Vorkink K. 2010. Expected idiosyncratic skewness. Rev. Financ. Stud. 23:169–202
Bruhin A, Fehr-Duda H, Epper T. 2010. Risk and rationality: uncovering heterogeneity in probability
distortion. Econometrica 78:1375–412
Camerer C. 1992. Recent tests of generalizations of expected utility theory. In Utility Theories:
Measurements and Applications, ed. W Edwards, pp. 207–51. Norwell, MA: Kluwer
Camerer C. 2000. Prospect theory in the wild: evidence from the field. In Choices, Values, and Frames,
ed. D Kahneman, A Tversky, pp. 288–300. Cambridge, UK: Cambridge Univ. Press
Camerer C. 2004. Individual decision making. In Handbook of Experimental Economics, ed. J Kagel,
A Roth, pp. 587–703. Princeton, NJ: Princeton Univ. Press
Camerer C, Ho T-H. 1994. Violations of the betweenness axiom and nonlinearity in probability.
J. Risk Uncertain. 8:167–96
Chapman D, Polkovnichenko V. 2009. First-order risk aversion, heterogeneity, and asset market out-
comes. J. Finance 64:1863–87
Chew S. 1989. Axiomatic utility theories with the betweenness property. Ann. Oper. Res. 19:273–98
Cicchetti C, Dubin J. 1994. A microeconometric analysis of risk aversion and the decision to self-
insure. J. Polit. Econ. 102:169–86
Conlisk J. 1989. Three variants on the Allais example. Am. Econ. Rev. 79:392–407
Cook PJ, Clotfelter CT. 1993. The peculiar scale economies of Lotto. Am. Econ. Rev. 83:634–43
Crawford VP. 1990. Equilibrium without independence. J. Econ. Theory 50:127–54
Croson R, Gneezy U. 2009. Gender differences in preferences. J. Econ. Lit. 47:448–74
De Giorgi E, Legg S. 2012. Dynamic portfolio choice and asset pricing with narrow framing and
probability weighting. J. Econ. Dyn. Control 36:951–72
De Giorgi E, Post T. 2011. Loss aversion with a state-dependent reference point. Res. Pap. 07-14,
Swiss Finance Inst., Zurich
Dekel E. 1986. An axiomatic characterization of preferences under uncertainty: weakening the inde-
pendence axiom. J. Econ. Theory 40:304–18
Diecidue E, Wakker P. 2001. On the intuition of rank-dependent utility. J. Risk Uncertain. 23:281–98
Epper T, Fehr-Duda H, Bruhin A. 2011a. Viewing the future through a warped lens: why uncertainty
generates hyperbolic discounting. J. Risk Uncertain. 43(3):169–203
Epper T, Fehr-Duda H, Schubert R. 2011b. Energy-using durables: the role of time discounting in
investment decisions. Publ. 290417, Swiss Fed. Off. Energy, Bern
Epstein L, Zin S. 2001. The independence axiom and asset returns. J. Empir. Finance 8:537–72
Fehr-Duda H, Bruhin A, Epper T. 2010. Rationality on the rise: why relative risk aversion increases
with stake size. J. Risk Uncertain. 40:147–80
Fehr-Duda H, de Gennaro M, Schubert R. 2006. Gender, financial risk, and probability weights.
Theory Decis. 60:283–313
Fehr-Duda H, Epper T. 2011. The missing link: a unifying theory of behavior under risk and over time.
Unpublished manuscript, ETH Zurich
Fox CR, Rogers BA, Tversky A. 1996. Options traders exhibit subadditive decision weights. J. Risk
Uncertain. 13:5–17
Friedman M, Savage L. 1948. The utility analysis of choices involving risk. J. Polit. Econ. 56:279–304
Gneezy U, Potters J. 1997. An experiment on risk taking and evaluation periods. Q. J. Econ. 112:
631–45
Goldstein W, Einhorn H. 1987. Expression theory and the preference reversal phenomena. Psychol. Rev.
94:236–54
Gonzalez R, Wu G. 1999. On the shape of the probability weighting function. Cognit. Psychol.
38:129–66
Green T, Hwang B-H. 2012. Initial public offerings as lotteries: expected skewness and first-day
returns. Manag. Sci. 58:432–44
Grgeta E. 2003. Estimating risk aversion. Unpublished manuscript, Univ. Chicago
Gul F. 1991. A theory of disappointment aversion. Econometrica 59:667–86
www.annualreviews.org " Probability and Risk 591
Ann
u. R
ev. E
con.
201
2.4:
567-
593.
Dow
nloa
ded
from
ww
w.a
nnua
lrevi
ews.o
rgby
178
.193
.5.1
41 o
n 01
/05/
13. F
or p
erso
nal u
se o
nly.

Gul F, Pesendorfer W. 2006. The revealed preference implications of reference dependent preferences.
Unpublished manuscript, Princeton Univ.
Hagen O. 1979. Towards a positive theory of preference under risk. In Expected Utility and the
Allais Paradox, ed. M Allais, O Hagen, pp. 271–302. Dordrecht: D. Reidel
Haigh M, List J. 2005. Do professional traders exhibit myopic loss aversion? An experimental analysis.
J. Finance 60:523–34
Halevy Y. 2008. Strotz meets Allais: diminishing impatience and certainty effect. Am. Econ. Rev. 98:
1145–62
Harbaugh WT, Krause K, Vesterlund L. 2010. The fourfold pattern of risk attitudes in choice and
pricing tasks. Econ. J. 120:595–611
Harless D, Camerer C. 1994. The predictive utility of generalized expected utility theories. Econometrica
62:1251–89
Hey JD, Orme C. 1994. Investigating generalizations of expected utility theory using experimental data.
Econometrica 62:1291–326
Holt C, Laury S. 2005. Risk aversion and incentive effects: new data without order effects. Am. Econ.
Rev. 95:902–4
Ingersoll JE. 2008. Non-monotonicity of the Tversky-Kahneman probability-weighting function: a
cautionary note. Eur. Financ. Manag. 14:385–90
Jullien B, Salanie B. 2000. Estimating preferences under risk: the case of racetrack bettors. J. Polit.
Econ. 108:503–30
Kachelmeier S, Shehata M. 1992. Examining risk preferences under high monetary incentives: experi-
mental evidence from the People’s Republic of China. Am. Econ. Rev. 82:1120–41
Kagel J, MacDonald D, Battalio R. 1990. Tests of “fanning out” of indifference curves: results from
animal and human experiments. Am. Econ. Rev. 80:912–21
Kahneman D, Tversky A. 1979. Prospect theory: an analysis of decision under risk. Econometrica
47:263–92
Karmarkar US. 1979. Subjectively weighted utility and the Allais paradox. Organ. Behav. Hum.
Perform. 24:67–72
Kliger D, Levy O. 2009. Theories of choice under risk: insights from financial markets. J. Econ. Behav.
Organ. 71:330–46
Kobberling V, Wakker P. 2005. An index of loss aversion. J. Econ. Theory 112:119–31
Koszegi B, Rabin M. 2007. Reference-dependent risk attitudes. Am. Econ. Rev. 97:1047–73
Kumar A. 2009. Who gambles in the stock market? J. Finance 64:1889–933
List J, Haigh M. 2005. A simple test of expected utility theory using professional traders. Proc. Natl.
Acad. Sci. USA 102:945–48
Loomes G, Segal U. 1994. Observing different orders of risk aversion. J. Risk Uncertain. 9:239–56
Loomes G, Sugden R. 1986. Disappointment and dynamic consistency in choice under uncertainty.
Rev. Econ. Stud. 53:271–82
MacCrimmon K. 1968. Descriptive and normative implications of the decision theory postulates.
In Risk and Uncertainty, ed. K Borch, J Mossin, pp. 3–32. London: MacMillan
MacCrimmon K, Larsson S. 1979. Utility theory: axioms versus paradoxes. In Expected Utility and
the Allais Paradox, ed. M Allais, O Hagen, pp. 333–409. Dordrecht: D. Reidel
Machina M. 1984. Temporal risk and the nature of induced preferences. J. Econ. Theory 33:199–231
Machina M. 1987. Choice under uncertainty: problems solved and unsolved. J. Econ. Perspect. 1(1):
121–54
Machina MJ. 2001. Payoff kinks in preferences over lotteries. J. Risk Uncertain. 23:207–60
Mehra R. 2006. The equity premium puzzle: a review. Found. Trends Finance 2(1):1–81
Mitton T, Vorkink K. 2007. Equilibrium underdiversification and the preference for skewness. Rev.
Financ. Stud. 20:1255–88
Polkovnichenko V. 2005. Household portfolio diversification: a case for rank-dependent preferences.
Rev. Financ. Stud. 18:1467–502
592 Fehr-Duda " Epper
Ann
u. R
ev. E
con.
201
2.4:
567-
593.
Dow
nloa
ded
from
ww
w.a
nnua
lrevi
ews.o
rgby
178
.193
.5.1
41 o
n 01
/05/
13. F
or p
erso
nal u
se o
nly.

Polkovnichenko V, Zhao F. 2009. Probability weighting functions implied by options prices. Unpub-
lished manuscript, Univ. Texas, Dallas
Pratt JW. 1964. Risk aversion in the small and in the large. Econometrica 32:122–36
Prelec D. 1998. The probability weighting function. Econometrica 66:497–527
Prelec D. 2000. Compound invariant weighting functions in prospect theory. In Choices, Values, and
Frames, ed. D Kahneman, ATversky, pp. 67–92. Cambridge, UK: Cambridge Univ. Press
Quiggin J. 1982. A theory of anticipated utility. J. Econ. Behav. Organ. 3:323–43
Rabin M, Thaler R. 2001. Anomalies: risk aversion. J. Econ. Perspect. 15(1):219–32
Rachlin H, Raineri A, Cross D. 1991. Subjective probability and delay. J. Exp. Anal. Behav. 55:233–44
Routledge B, Zin S. 2010. Generalized disappointment aversion and asset prices. J. Finance 65:1303–32
Saha A. 1993. Expo-power utility: a ‘flexible’ form for absolute and relative risk aversion. Am. J.
Agric. Econ. 75:905–13
Schoemaker P. 1982. The expected utility model: its variants, purposes, evidence and limitations.
J. Econ. Lit. 20:529–63
Segal U, Spivak A. 1990. First order versus second order risk aversion. J. Econ. Theory 51:111–25
Slovic P, Tversky A. 1974. Who accepts Savage’s axiom? Behav. Sci. 19:368–73
Snowberg E, Wolfers J. 2010. Explaining the favorite-longshot bias: Is it risk-love or misperceptions?
J. Polit. Econ. 118:723–46
Sobel R, Ryan M. 2008. Unifying the favorite-longshot bias with other market anomalies. InHandbook
of Sports and Lottery Markets, ed. D Hausch, W Ziemba, pp. 137–60. Amsterdam: North Holland
Spalt O. 2012. Probability weighting and employee stock options. J. Financ. Quant. Anal. In press
Starmer C. 2000. Developments in non-expected utility theory: the hunt for a descriptive theory of
choice under risk. J. Econ. Lit. 38:332–82
Stott H. 2006. Cumulative prospect theory’s functional menagerie. J. Risk Uncertain. 32:101–30
Sugden R. 2003. Reference-dependent subjective expected utility. J. Econ. Theory 111:172–91
Sugden R. 2004. Alternatives to expected utility: foundations. In Handbook of Utility Theory, Vol. 2:
Extensions, ed. S Barbera, P Hammond, C Seidl, pp. 685–755. Dordrecht: Kluwer
Sydnor J. 2010. (Over)insuring modest risks. Am. Econ. J. Appl. Econ. 2:177–99
Tversky A, Kahneman D. 1992. Advances in prospect theory: cumulative representation of uncer-
tainty. J. Risk Uncertain. 5:297–323
van de Kuilen G, Wakker P. 2011. The midweight method to measure attitudes towards risk and
ambiguity. Manag. Sci. 57:582–98
Wakker P. 2010. Prospect Theory for Risk and Ambiguity. Cambridge, UK: Cambridge Univ. Press
Wakker P, Thaler R, Tversky A. 1997. Probabilistic insurance. J. Risk Uncertain. 15:7–28
Walther H. 2003. Normal-randomness expected utility, time preference and emotional distortions.
J. Econ. Behav. Organ. 52:253–66
Yaari M. 1987. The dual theory of choice under risk. Econometrica 55:95–115
www.annualreviews.org " Probability and Risk 593
Ann
u. R
ev. E
con.
201
2.4:
567-
593.
Dow
nloa
ded
from
ww
w.a
nnua
lrevi
ews.o
rgby
178
.193
.5.1
41 o
n 01
/05/
13. F
or p
erso
nal u
se o
nly.
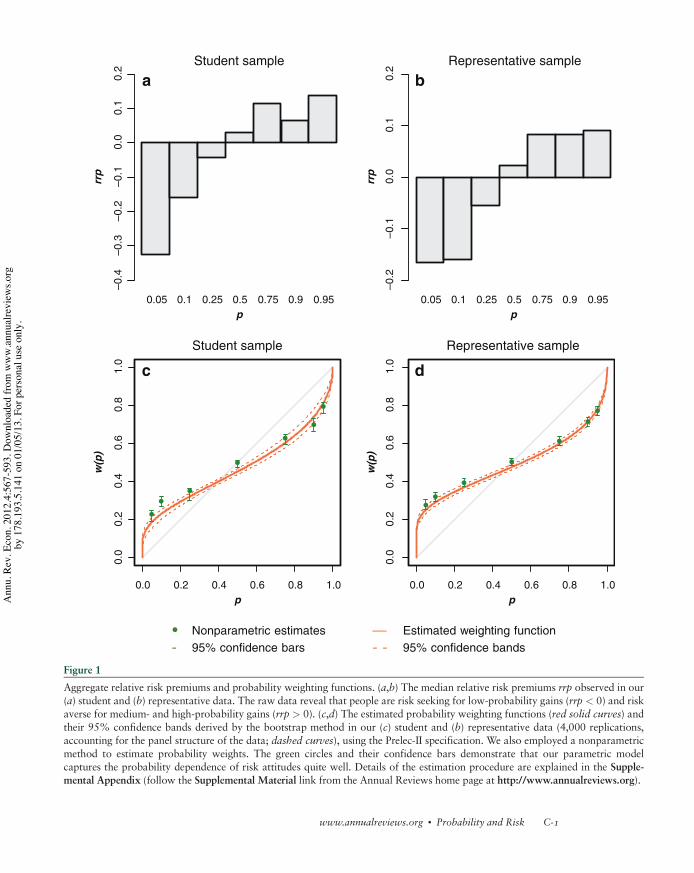
0.05 0.1 0.25 0.5 0.75 0.9 0.95
Student sample
p
rrp
–0.4
–0.3
–0.2
–0.1
0.0
0.1
0.2
0.05 0.1 0.25 0.5 0.75 0.9 0.95
Representative sample
p
rrp
–0.2
–0.1
0.0
0.1
0.2
0.0 0.2 0.4 0.6 0.8 1.0
0.0
0.2
0.4
0.6
0.8
1.0
Student sample
p
w(p)
0.0 0.2 0.4 0.6 0.8 1.0
0.0
0.2
0.4
0.6
0.8
1.0
Representative sample
p
w(p)
Nonparametric estimates Estimated weighting function95% confidence bars 95% confidence bands
a b
c d
Figure 1
Aggregate relative risk premiums and probability weighting functions. (a,b) The median relative risk premiums rrp observed in our(a) student and (b) representative data. The raw data reveal that people are risk seeking for low-probability gains (rrp < 0) and riskaverse for medium- and high-probability gains (rrp > 0). (c,d) The estimated probability weighting functions (red solid curves) andtheir 95% confidence bands derived by the bootstrap method in our (c) student and (b) representative data (4,000 replications,accounting for the panel structure of the data; dashed curves), using the Prelec-II specification. We also employed a nonparametricmethod to estimate probability weights. The green circles and their confidence bars demonstrate that our parametric modelcaptures the probability dependence of risk attitudes quite well. Details of the estimation procedure are explained in the Supple-mental Appendix (follow the Supplemental Material link from the Annual Reviews home page at http://www.annualreviews.org).
www.annualreviews.org " Probability and Risk C-1
Ann
u. R
ev. E
con.
201
2.4:
567-
593.
Dow
nloa
ded
from
ww
w.a
nnua
lrevi
ews.o
rgby
178
.193
.5.1
41 o
n 01
/05/
13. F
or p
erso
nal u
se o
nly.

Rank–dependent utility
0
1
p 1
p3
Increasing preference
Disappointment aversion
0
1
p 1
p3
Increasing preference
1 1
a b
Figure 2
Unit probability triangles. The panels juxtapose the indifference curves in the unit probability trianglepredicted (a) by rank-dependent utility theory and (b) by Gul’s disappointment-aversion theory.Each curve represents the combination of probabilities (p3,1 % p1 % p3, p1) that yields a constant levelof prospect utility for a fixed set of outcomes x1 > x2 > x3. Independence requires indifference curvesto be parallel straight lines. Rank-dependent utility features nonlinear indifference curves, whereasdisappointment aversion features fanning out (risk aversion increases in the direction of increasingpreference; red lines) in the lower regions of the triangle and fanning in (risk aversion decreases inthe direction of increasing preference; blue lines) in the upper regions of the triangle. Preferences forrank-dependent utility are quasi-concave or quasi-convex depending on the region, whereas theyconform to betweenness for disappointment aversion. We used an inverse S-shaped probabilityweighting function (Prelec-II) together with the parameter estimates presented in Table 3 to constructthe indifference curves for rank-dependent utility.
C-2 Fehr-Duda " Epper
Ann
u. R
ev. E
con.
201
2.4:
567-
593.
Dow
nloa
ded
from
ww
w.a
nnua
lrevi
ews.o
rgby
178
.193
.5.1
41 o
n 01
/05/
13. F
or p
erso
nal u
se o
nly.

| | | | | | | | | | | | | | | | | | | ||
| | | | | | | | | | | | | | | | | | | || | | | | | | | | | | | | | | | | | | | ||
Outcome rank
+
a Prelec–II
c Convex
b Goldstein–Einhorn
0.00
21 16 11 6 1
0.03
0.06
0.09
0.12
Outcome rank
0.00
21 16 11 6 1
0.03
0.06
0.09
0.12
Outcome rank
0.00
21 16 11 6 1
0.03
0.06
0.09
0.12
Figure 3
Decision weights in rank-dependent models, showing the effects of rank dependence on the decision weights p(p) for a discreteuniform probability distribution p of 21 outcomes ranked i (black crosses), depending on the characteristics of the probabilityweighting function. The one-parameter versions (b ¼ d ¼ 1) with an index of nonlinearity of a ¼ g ¼ 0.9 are denoted by the redtriangles. When nonlinearity is increased, decision weights diverge more dramatically from uniform probabilities, shown by theblue dots. Moving elevation d or convexity b away from unity affects skewness, noted by the green squares. Inverse S-shapedprobability transformations, Prelec and Goldstein-Einhorn, lead to a systematic overweighting of both tails of the distribu-tion. Globally convex transformations of probabilities lead to an overweighting of the lower tail at the expense of the uppertail. Contrary to the Karmarkar weighting function (Goldstein-Einhorn with d ¼ 1), Prelec-I (Prelec-II with b ¼ 1) predicts anasymmetric redistribution of weights. Two-parameter specifications of these probability weighting functions overweight bothtails, whereby one of the tails may be overweighted comparatively more strongly.
www.annualreviews.org " Probability and Risk C-3
Ann
u. R
ev. E
con.
201
2.4:
567-
593.
Dow
nloa
ded
from
ww
w.a
nnua
lrevi
ews.o
rgby
178
.193
.5.1
41 o
n 01
/05/
13. F
or p
erso
nal u
se o
nly.

0.00
0.03
0.06
0.09
0.12
Outcome by magnitudeDisappointing Elating
Figure 4
Decision weights in Gul’s model, revealing the basic difference between rank-dependent utility (seeconvex transformation in Figure 3) and disappointment aversion. In rank-dependent utility, outcomesare weighted according to their rank in the distribution, whereas their weights depend on their posi-tion relative to the disappointment threshold in Gul’s model. This leads to a systematic overweightingof all outcomes below the threshold at the expense of all outcomes above the threshold. The strengthof the effect depends on the magnitude of the disappointment-aversion parameter ! > 0.
C-4 Fehr-Duda " Epper
Ann
u. R
ev. E
con.
201
2.4:
567-
593.
Dow
nloa
ded
from
ww
w.a
nnua
lrevi
ews.o
rgby
178
.193
.5.1
41 o
n 01
/05/
13. F
or p
erso
nal u
se o
nly.

0.0 0.2 0.4 0.6 0.8 1.0
0.0
0.2
0.4
0.6
0.8
1.0
Student sample
p
w(p)
w(p)
0.0 0.2 0.4 0.6 0.8 1.0
0.0
0.2
0.4
0.6
0.8
1.0
Representative sample
p
Type I Type II
a b
Figure 5
Probability weighting functions for two types, showing type-specific probability weighting functions for (a) students and(b) the representative sample. We find a majority group in the student population exhibiting a strongly curved probabilityweighting function (type I, 80% of the subjects) and a minority group of expected value maximizers (type II, 20%). Themajority in the representative sample is classified as a comparatively optimistic type (type I, 67%), whereas the minoritydisplays considerable pessimism expressed by pronounced underweighting of large probabilities (type II, 33%). Parameterestimates are available from the authors.
0
1
p 1
p3
Increasing preference
1
Figure 6
Interior of Marschak-Machina triangle for rank-dependent utility. This figure reproduces Figure 2abut omits the areas close to the boundaries of the triangle. It is evident that indifference curves onthe interior of the triangle are close to linear. As a result, it will be hard to statistically discriminatebetween rank-dependent utility theories with inverse S-shaped weighting and theories imposing linearindifference curves. These curves are predicted by the parameters we estimated for our representativedata (see Table 3).
www.annualreviews.org " Probability and Risk C-5
Ann
u. R
ev. E
con.
201
2.4:
567-
593.
Dow
nloa
ded
from
ww
w.a
nnua
lrevi
ews.o
rgby
178
.193
.5.1
41 o
n 01
/05/
13. F
or p
erso
nal u
se o
nly.

0.0 0.2 0.4 0.6 0.8 1.0
0.0
0.2
0.4
0.6
0.8
1.0
Atemporal
p
w~(p)
m = 1
m = 2
m = 12
0.0 0.2 0.4 0.6 0.8 1.0
0.0
0.2
0.4
0.6
0.8
1.0
12-month delay
p
m = 1
m = 2
m = 12
a b
w~(p)
Figure 8
Effect of recursive evaluation on observed probability weights, depending on the number of stages m. (a) Atemporal probabilityweighting functions for a one-shot evaluation (m ¼ 1) and recursive multistage evaluations (m ¼ 2 and m ¼ 12). Compoundingof probability weights implies more convex transformations. (b) The same as in panel a but for a 12-month delay under theassumption of an additional layer of uncertainty (i.e., the future is always uncertain). The model captures future uncertainty witha geometrically declining annual rate of prospect survival s, which results in a probability pst for a prospect (x, p) materializingin t periods. In this example, s is assumed to be 0.8. When the resolution of uncertainty is delayed by 12 months, risk toleranceincreases because of a more elevated probability weighting curve (m ¼ 1). Recursive evaluation (m ¼ 2, m ¼ 12), however, hasthe same qualitative, but less pronounced, effect as in the atemporal model.
C-6 Fehr-Duda " Epper
Ann
u. R
ev. E
con.
201
2.4:
567-
593.
Dow
nloa
ded
from
ww
w.a
nnua
lrevi
ews.o
rgby
178
.193
.5.1
41 o
n 01
/05/
13. F
or p
erso
nal u
se o
nly.

EconScholar AppAvailable for iOS and Android
Economics scholars can now access highly cited, mobile-optimized review articles from a variety of mobile devices. The EconScholar app, from Annual Reviews, allows immediate access to full-text review articles for users with personal or institutional subscriptions to the Annual Review of Economics, the Annual Review of Financial Economics, and the Annual Review of Resource Economics.
Also, non-subscribers and new users can access selected complimentary articles HUK�HSS�HIZ[YHJ[Z��HUK�KPZJV]LY�ÄYZ[OHUK�[OL�IYLHK[O�HUK�X\HSP[`�VM�[OLZL�YL]PL^�articles.
The app allows users to:
��read and cache full-text articles on a mobile device
��view high-resolution images and video
��IVVRTHYR�HY[PJSLZ��ZH]PUN�M\SS�[L_[�PUKLÄUP[LS`���search journal content
��read and share content through social media tools
Subscribers can either enter their personal login information or connect via institutional access to view full-text content.
To download the free EconScholar app, please visit the Apple AppStore or GooglePlay store.
For more information visit: www.annualreviews.org/page/econscholaroverview
NEW FROM ANNUAL REVIEWSA
nnu.
Rev
. Eco
n. 2
012.
4:56
7-59
3. D
ownl
oade
d fr
om w
ww
.ann
ualre
view
s.org
by 1
78.1
93.5
.141
on
01/0
5/13
. For
per
sona
l use
onl
y.

v
Annual Review of Economics
Volume 4, 2012Contents
Paul Samuelson’s LegacyAvinash Dixit . . . . . . . . . . . . . . . . . . . . . . . . . . . . . . . . . . . . . . . . . . . . . . 1
Saving Money or Just Saving Lives? Improving the Productivity of US Health Care SpendingKatherine Baicker, Amitabh Chandra, and Jonathan S. Skinner . . . . . . . . 33
International Comparisons in Health Economics: Evidence from Aging StudiesJames Banks and James P. Smith . . . . . . . . . . . . . . . . . . . . . . . . . . . . . . . 57
Rare Macroeconomic DisastersRobert J. Barro and José F. Ursúa . . . . . . . . . . . . . . . . . . . . . . . . . . . . . . 83
Endogenous Extreme Events and the Dual Role of PricesJon Danielsson, Hyun Song Shin, and Jean-Pierre Zigrand . . . . . . . . . . 111
The Distribution of Teacher Quality and Implications for PolicyEric A. Hanushek and Steven G. Rivkin . . . . . . . . . . . . . . . . . . . . . . . . 131
Economic Modeling and Analysis of Educational VouchersDennis Epple and Richard Romano . . . . . . . . . . . . . . . . . . . . . . . . . . . 159
Heterogeneity in Human Capital Investments: High School Curriculum, College Major, and CareersJoseph G. Altonji, Erica Blom, and Costas Meghir . . . . . . . . . . . . . . . . 185
Credit Constraints in EducationLance Lochner and Alexander Monge-Naranjo . . . . . . . . . . . . . . . . . . . 225
New Perspectives on Statistical Decisions Under AmbiguityJörg Stoye . . . . . . . . . . . . . . . . . . . . . . . . . . . . . . . . . . . . . . . . . . . . . . . 257
The Empirics of Firm Heterogeneity and International Trade Andrew B. Bernard, J. Bradford Jensen, Stephen J. Redding, and Peter K. Schott . . . . . . . . . . . . . . . . . . . . . . . . . . . . . . . . . . . . . . . . 283
Natural Resource Wealth: The Challenge of Managing a WindfallFrederick van der Ploeg and Anthony J. Venables . . . . . . . . . . . . . . . . . 315
Ann
u. R
ev. E
con.
201
2.4:
567-
593.
Dow
nloa
ded
from
ww
w.a
nnua
lrevi
ews.o
rgby
178
.193
.5.1
41 o
n 01
/05/
13. F
or p
erso
nal u
se o
nly.

The Economics and Politics of Women’s RightsMatthias Doepke, Michèle Tertilt, and Alessandra Voena . . . . . . . . . . . 339
Recent Developments in the Economics of Time UseMark Aguiar, Erik Hurst, and Loukas Karabarbounis . . . . . . . . . . . . . . 373
Life-Cycle Wage Growth and Heterogeneous Human CapitalCarl Sanders and Christopher Taber . . . . . . . . . . . . . . . . . . . . . . . . . . . 399
Behavioral Economics and Psychology of IncentivesEmir Kamenica . . . . . . . . . . . . . . . . . . . . . . . . . . . . . . . . . . . . . . . . . . . 427
The Relationship Between Economic Preferences and Psychological Personality Measures Anke Becker, Thomas Deckers, Thomas Dohmen, Armin Falk, and Fabian Kosse . . . . . . . . . . . . . . . . . . . . . . . . . . . . . . . . . . . . . . . . . 453
Corruption in Developing CountriesBenjamin A. Olken and Rohini Pande . . . . . . . . . . . . . . . . . . . . . . . . . . 479
A Reduced-Form Approach to Behavioral Public FinanceSendhil Mullainathan, Joshua Schwartzstein, and William J. Congdon . . . . . 511
Recent Research on the Economics of PatentsBronwyn H. Hall and Dietmar Harhoff . . . . . . . . . . . . . . . . . . . . . . . . 541
Probability and Risk: Foundations and Economic Implications of Probability-Dependent Risk PreferencesHelga Fehr-Duda and Thomas Epper . . . . . . . . . . . . . . . . . . . . . . . . . . 567
The Theory of Clubs and Competitive CoalitionsMyrna Wooders . . . . . . . . . . . . . . . . . . . . . . . . . . . . . . . . . . . . . . . . . . . 595
The Promises and Pitfalls of Genoeconomics Daniel J. Benjamin, David Cesarini, Christopher F. Chabris, Edward L. Glaeser, David I. Laibson, Vilmundur Guðnason, Tamara B. Harris, Lenore J. Launer, Shaun Purcell, Albert Vernon Smith, Magnus Johannesson, Patrik K.E. Magnusson, Jonathan P. Beauchamp, Nicholas A. Christakis, Craig S. Atwood, Benjamin Hebert, Jeremy Freese, Robert M. Hauser, Taissa S. Hauser, Alexander Grankvist, Christina M. Hultman, and Paul Lichtenstein . . . . . . . . . . . . . . . . . . . . 627
Indexes
Cumulative Index of Contributing Authors, Volumes 1–4 . . . . . . . . . . . . . 663Cumulative Index of Chapter Titles, Volumes 1–4 . . . . . . . . . . . . . . . . . . . 665
Errata
An online log of corrections to Annual Review of Economicsarticles may be found at http://econ.annualreviews.org
vi Contents
Ann
u. R
ev. E
con.
201
2.4:
567-
593.
Dow
nloa
ded
from
ww
w.a
nnua
lrevi
ews.o
rgby
178
.193
.5.1
41 o
n 01
/05/
13. F
or p
erso
nal u
se o
nly.