probabilistic graphical models - perception...
TRANSCRIPT
Probabilistic Graphical Models
Florence Forbes
INRIA RHONE-ALPES
POP tutorial, Coimbra 2006
About this Tutorial
Probabilistic Graphical Models (POP tutorial, Coimbra 2006) Florence Forbes
• Directed graphs: Bayesian Networks• Conditional independence and Markov properties• Undirected graphs: Markov Random Fields• Inference and learning• Some illustrations
• Reference: Pattern Recognition and Machine Learning. C.Bishop
Probabilistic graphical models
Probabilistic Graphical Models (POP tutorial, Coimbra 2006) Florence Forbes
• Graphical models are used in various domains:– Machine learning and artificial intelligence– Computational biology– Statistical signal and image processing– Communication and information theory– Statistical physics…..
• Based on correspondences between graph theory and probability theory
• Important but difficult problems:– Computing likelihoods, marginal distributions, modes– Estimating model parameters and structure from noisy data
Probabilistic Graphical Models
Probabilistic Graphical Models (POP tutorial, Coimbra 2006) Florence Forbes
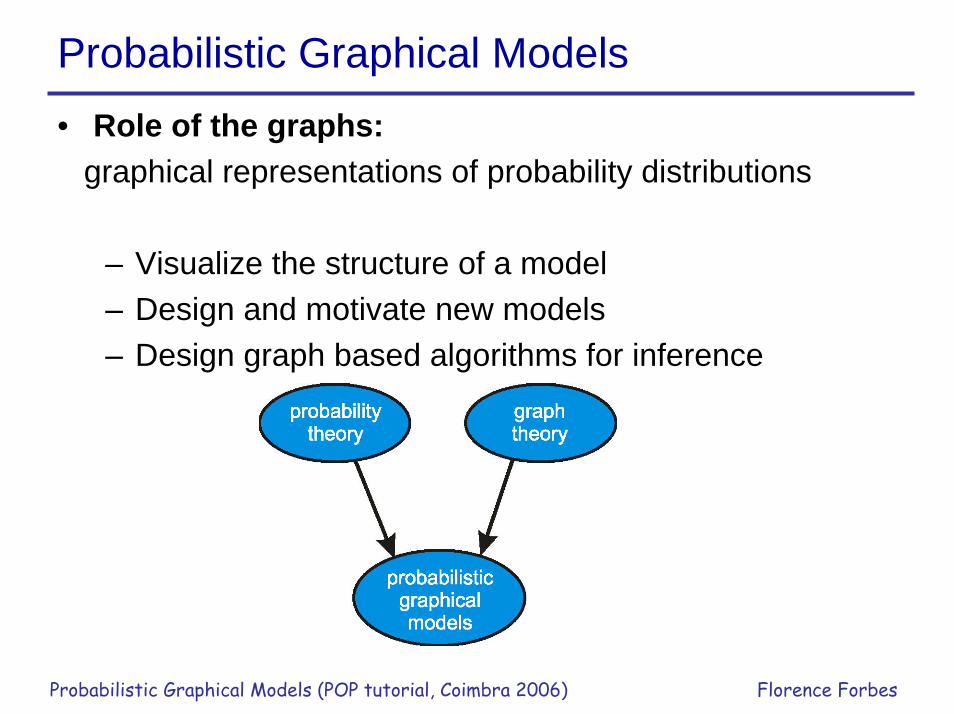
• Role of the graphs: graphical representations of probability distributions
– Visualize the structure of a model– Design and motivate new models– Design graph based algorithms for inference
Probability Theory
Probabilistic Graphical Models (POP tutorial, Coimbra 2006) Florence Forbes
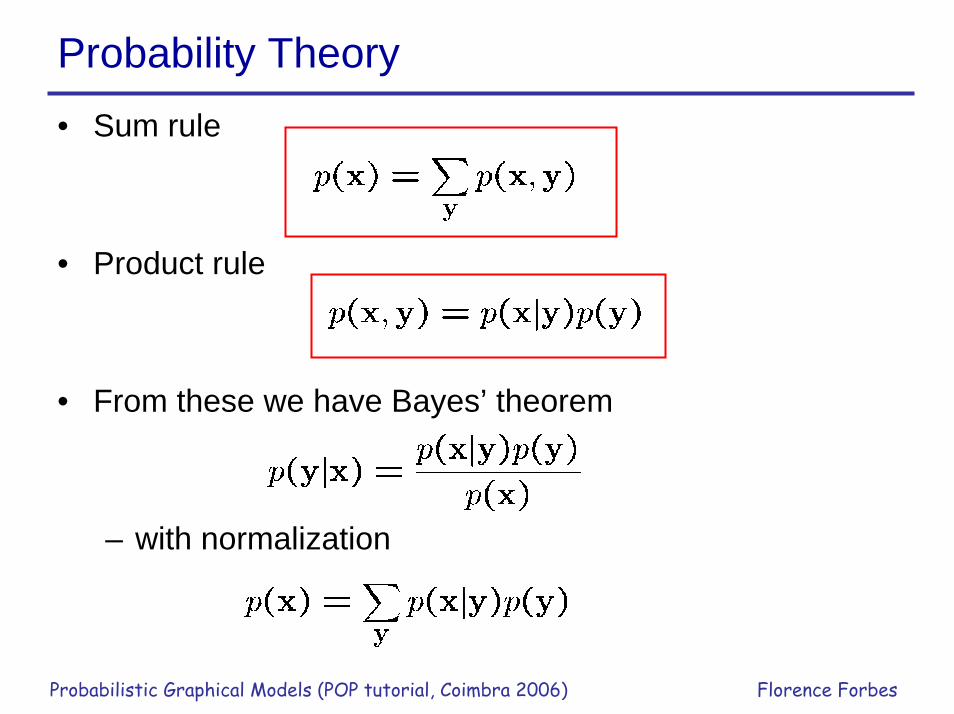
• Sum rule
• Product rule
• From these we have Bayes’ theorem
– with normalization
Directed graphsBayesian Networks
Directed Graphs: Decomposition
Probabilistic Graphical Models (POP tutorial, Coimbra 2006) Florence Forbes
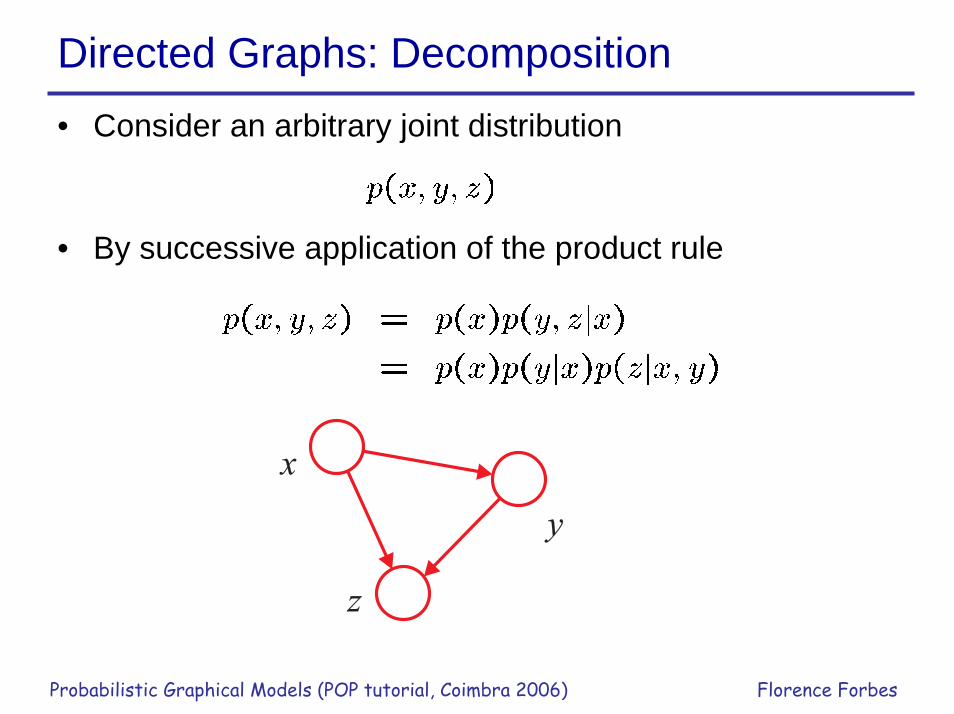
• Consider an arbitrary joint distribution
• By successive application of the product rule
x
z
y
General Case
Probabilistic Graphical Models (POP tutorial, Coimbra 2006) Florence Forbes
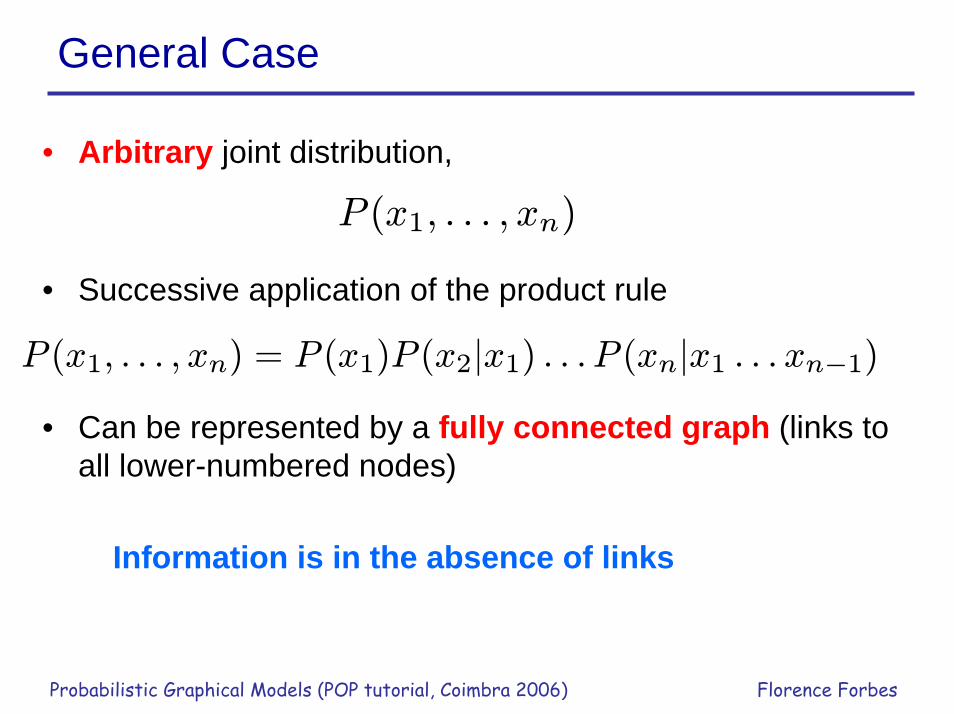
• Arbitrary joint distribution,
• Successive application of the product rule
• Can be represented by a fully connected graph (links to all lower-numbered nodes)
Information is in the absence of links
P (x1, . . . , xn)
P (x1, . . . , xn) = P (x1)P (x2|x1) . . . P (xn|x1 . . . xn−1)
General relationship
Probabilistic Graphical Models (POP tutorial, Coimbra 2006) Florence Forbes
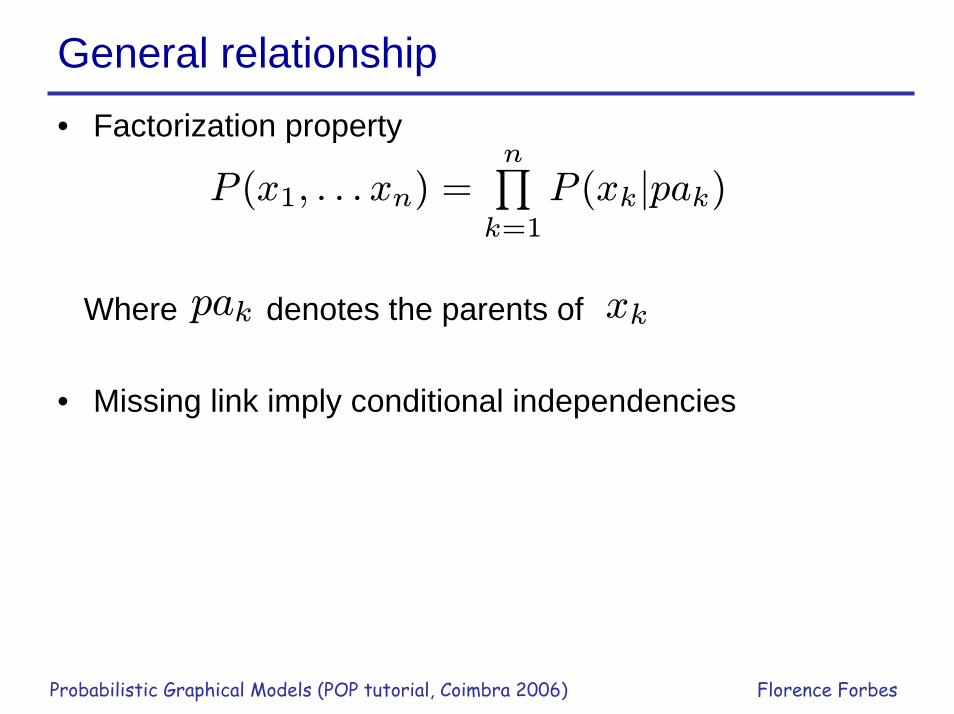
• Factorization property
Where denotes the parents of
• Missing link imply conditional independencies
P (x1, . . . xn) =nQk=1
P (xk|pak)
pak xk
Directed Acyclic Graphs: Bayesian Networks
Probabilistic Graphical Models (POP tutorial, Coimbra 2006) Florence Forbes
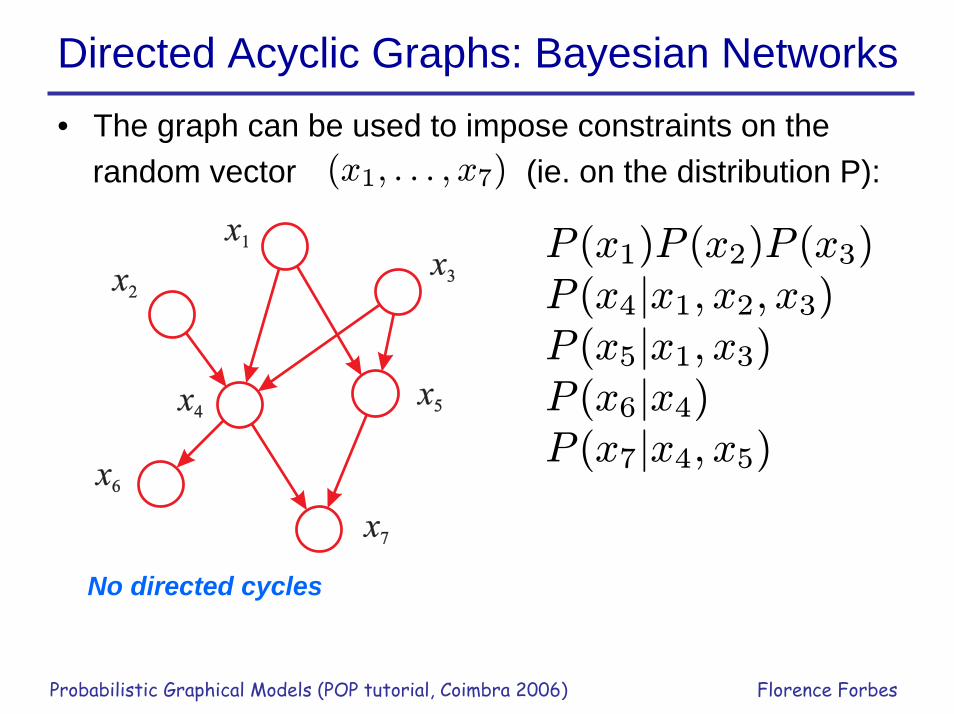
• The graph can be used to impose constraints on therandom vector (ie. on the distribution P):
No directed cycles
x2x2
x1x1
x4x4x5x5
x6x6
x7x7
x3x3
P (x1)P (x2)P (x3)P (x4|x1, x2, x3)P (x5|x1, x3)P (x6|x4)P (x7|x4, x5)
(x1, . . . , x7)
Hidden variables
Probabilistic Graphical Models (POP tutorial, Coimbra 2006) Florence Forbes
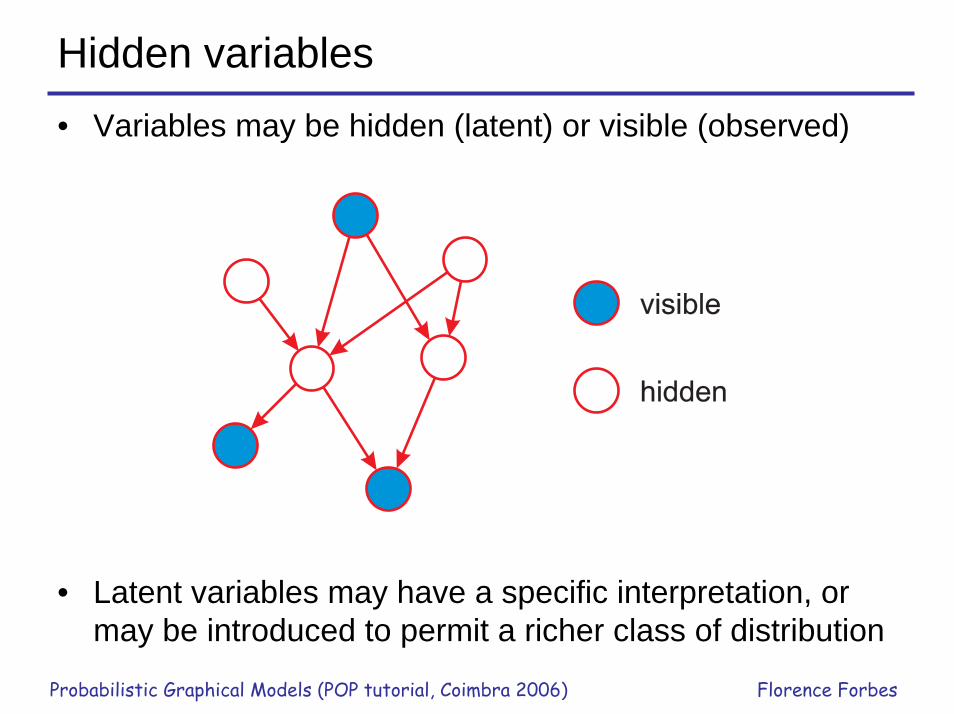
• Variables may be hidden (latent) or visible (observed)
• Latent variables may have a specific interpretation, or may be introduced to permit a richer class of distribution
hidden
visible
Example 1: Mixtures of Gaussians
Probabilistic Graphical Models (POP tutorial, Coimbra 2006) Florence Forbes
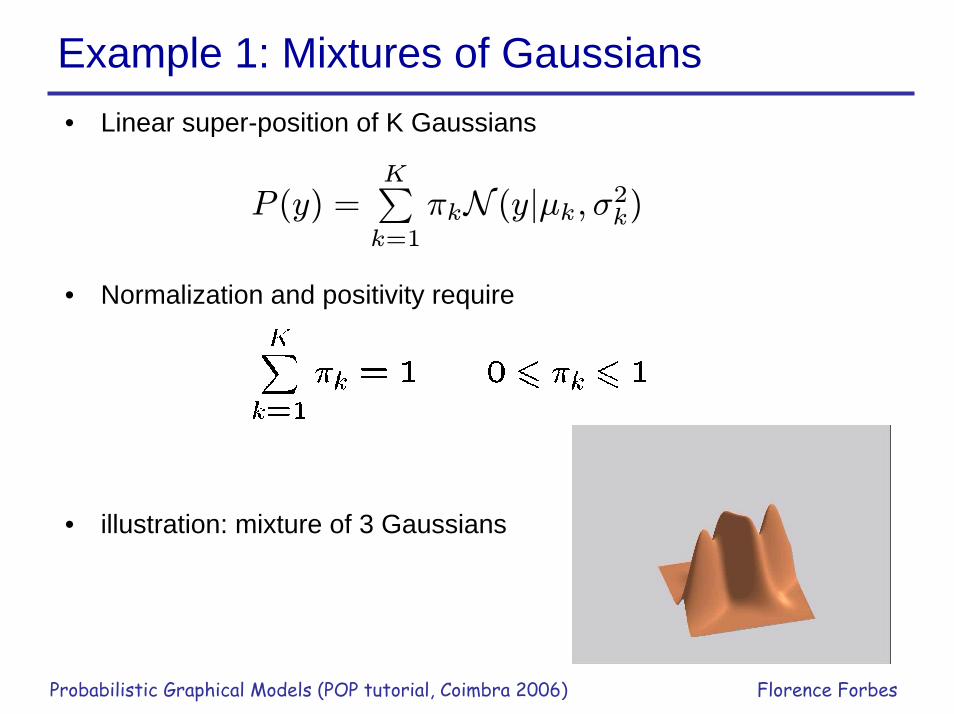
• Linear super-position of K Gaussians
• Normalization and positivity require
• illustration: mixture of 3 Gaussians
P (y) =KPk=1
πkN (y|µk,σ2k)
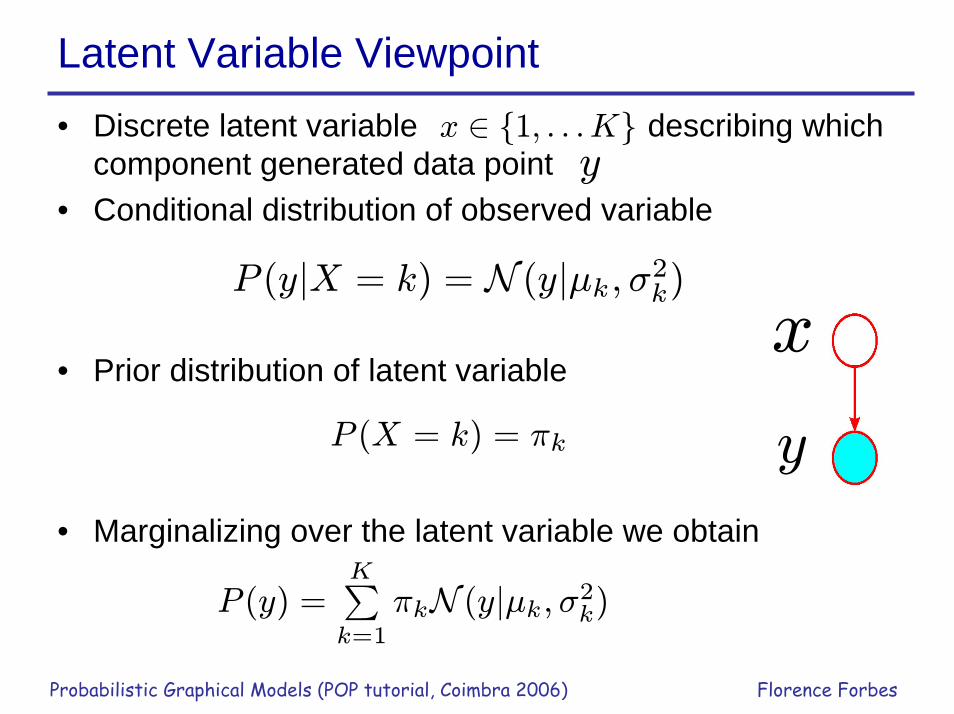
Latent Variable Viewpoint
Probabilistic Graphical Models (POP tutorial, Coimbra 2006) Florence Forbes
• Discrete latent variable describing which component generated data point
• Conditional distribution of observed variable
• Prior distribution of latent variable
• Marginalizing over the latent variable we obtain
y
x
x ∈ {1, . . .K}y
P (y|X = k) = N (y|µk, σ2k)
P (X = k) = πk
P (y) =KPk=1
πkN (y|µk,σ2k)
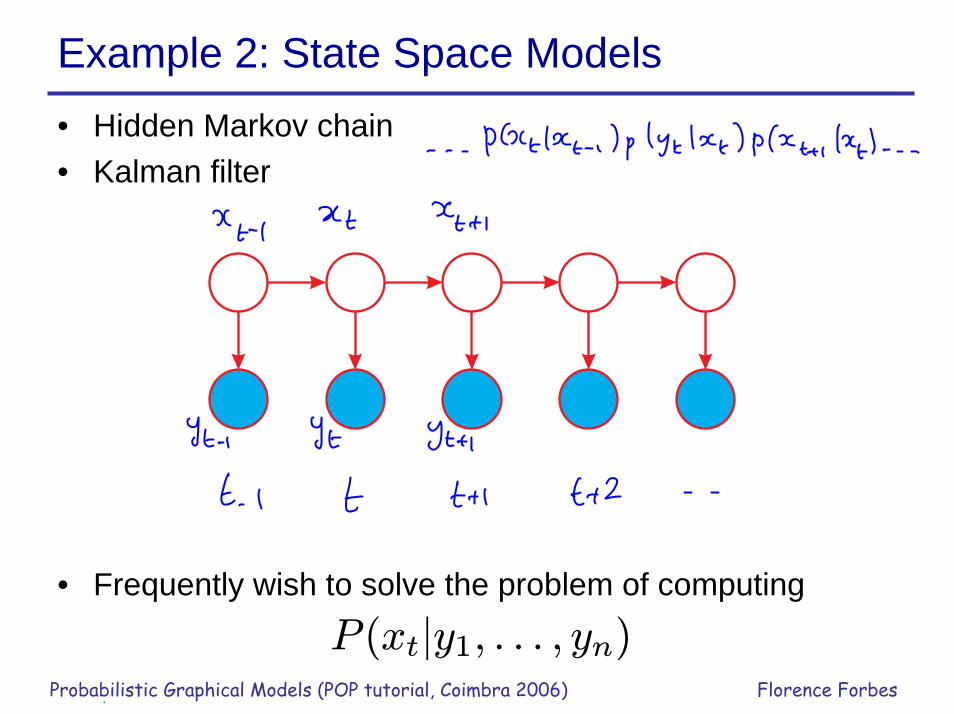
Example 2: State Space Models
Probabilistic Graphical Models (POP tutorial, Coimbra 2006) Florence Forbes
• Hidden Markov chain• Kalman filter
• Frequently wish to solve the problem of computing
P (xt|y1, . . . , yn)
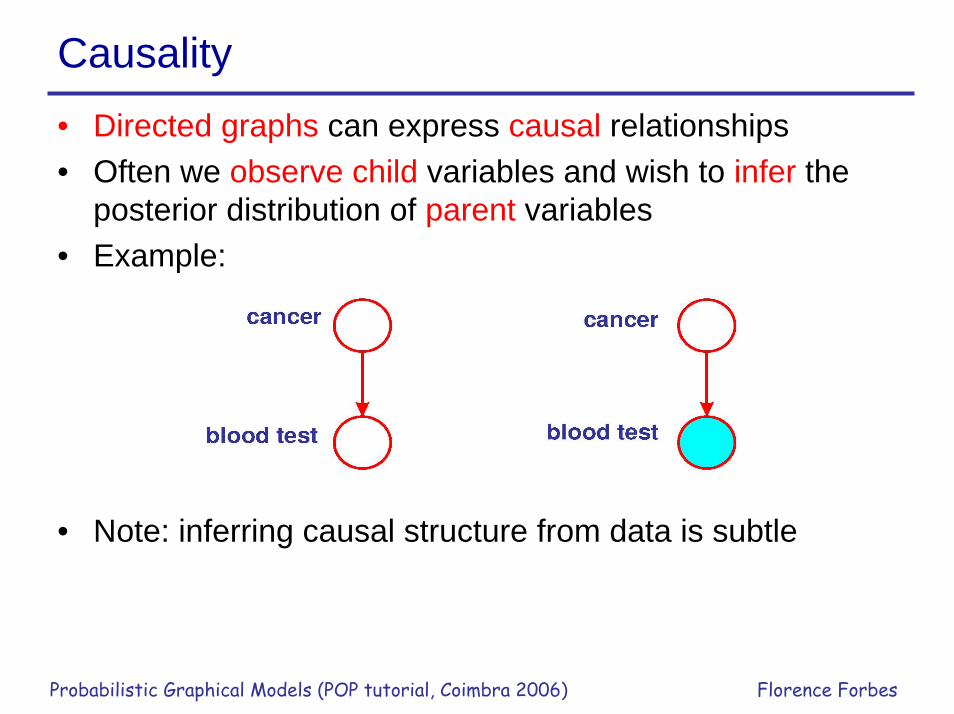
Causality
Probabilistic Graphical Models (POP tutorial, Coimbra 2006) Florence Forbes
• Directed graphs can express causal relationships• Often we observe child variables and wish to infer the
posterior distribution of parent variables• Example:
• Note: inferring causal structure from data is subtle

Conditional independence and Markov properties
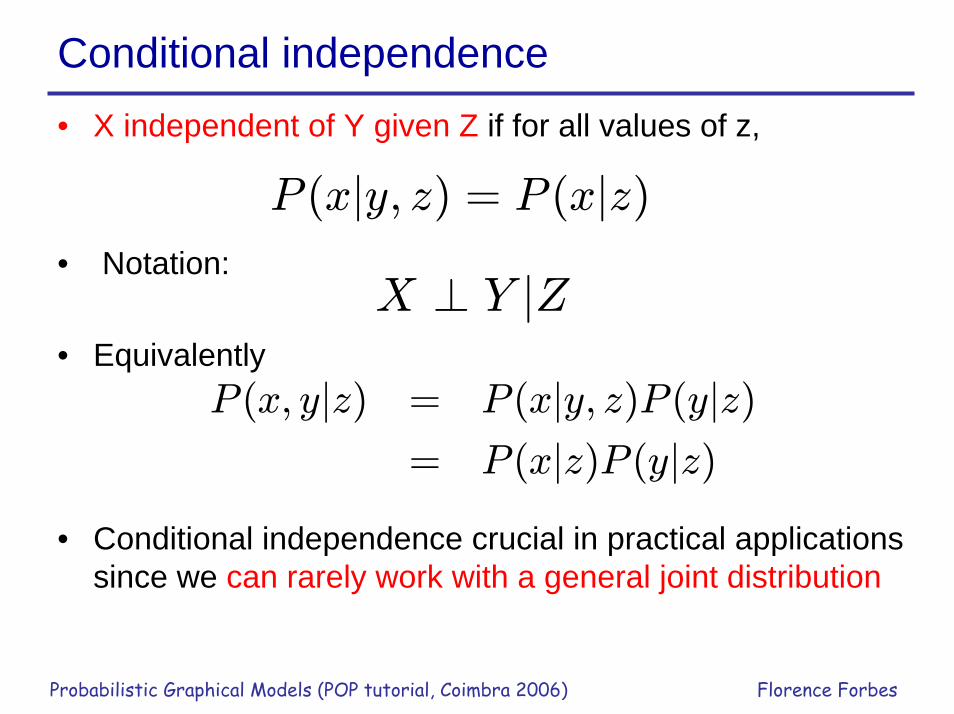
Conditional independence
Probabilistic Graphical Models (POP tutorial, Coimbra 2006) Florence Forbes
• X independent of Y given Z if for all values of z,
• Notation:
• Equivalently
• Conditional independence crucial in practical applications since we can rarely work with a general joint distribution
P (x|y, z) = P (x|z)
X ⊥ Y |Z
P (x, y|z) = P (x|y, z)P (y|z)= P (x|z)P (y|z)
Markov properties
Probabilistic Graphical Models (POP tutorial, Coimbra 2006) Florence Forbes
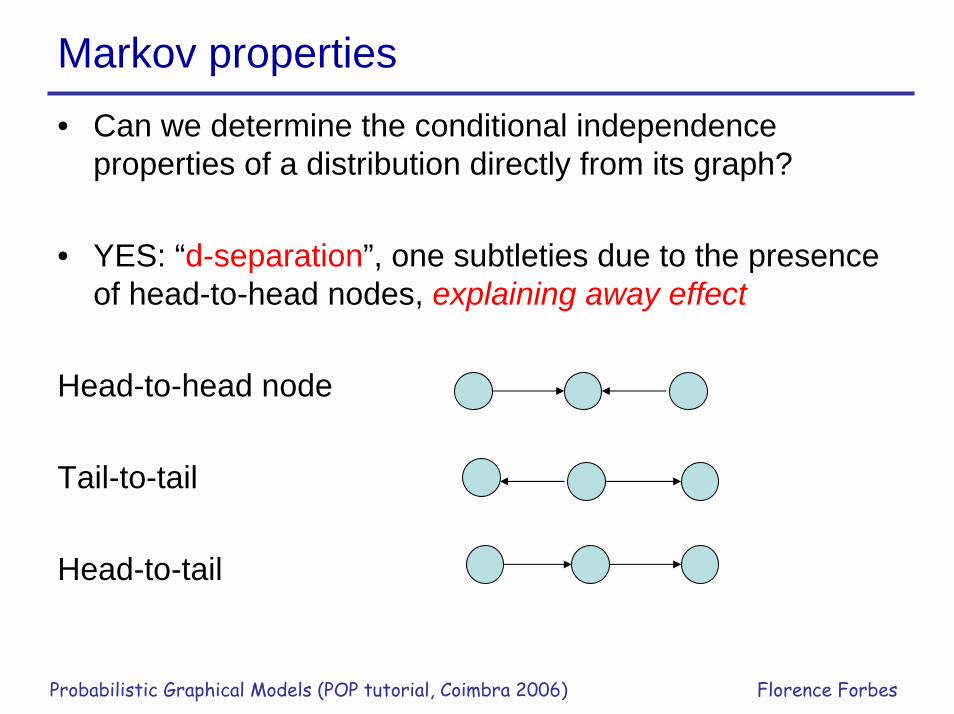
• Can we determine the conditional independence properties of a distribution directly from its graph?
• YES: “d-separation”, one subtleties due to the presence of head-to-head nodes, explaining away effect
Head-to-head node
Tail-to-tail
Head-to-tail
Example 1: Tail-to-head node
Probabilistic Graphical Models (POP tutorial, Coimbra 2006) Florence Forbes
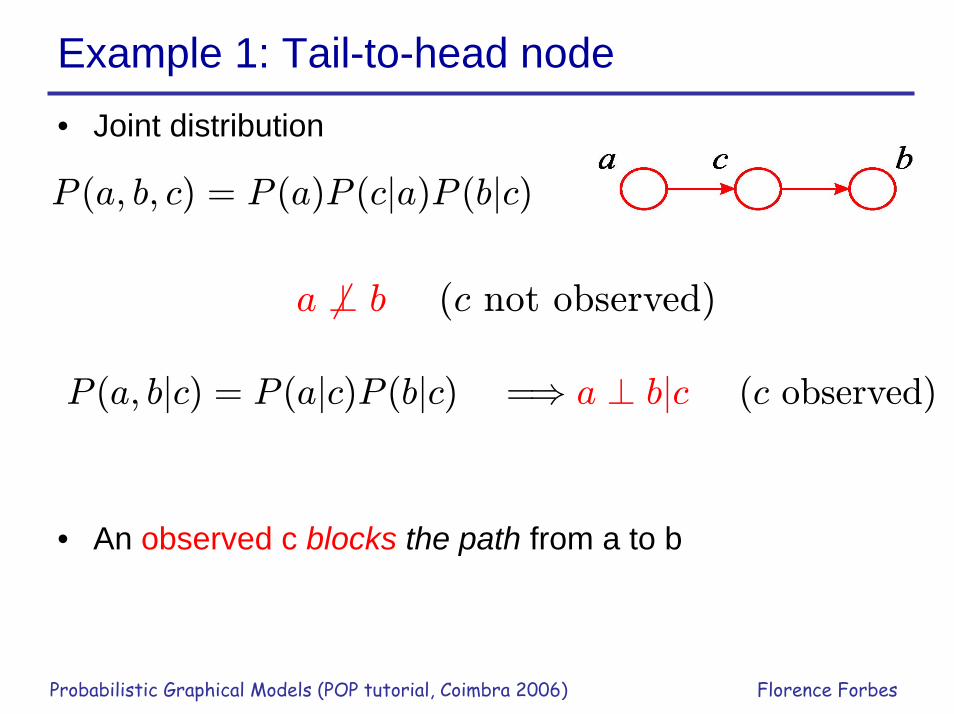
• Joint distribution
• An observed c blocks the path from a to b
P (a, b, c) = P (a)P (c|a)P (b|c)
a 6⊥ b (c not observed)
P (a, b|c) = P (a|c)P (b|c) =⇒ a ⊥ b|c (c observed)
Example 2: Tail-to-tail node
Probabilistic Graphical Models (POP tutorial, Coimbra 2006) Florence Forbes
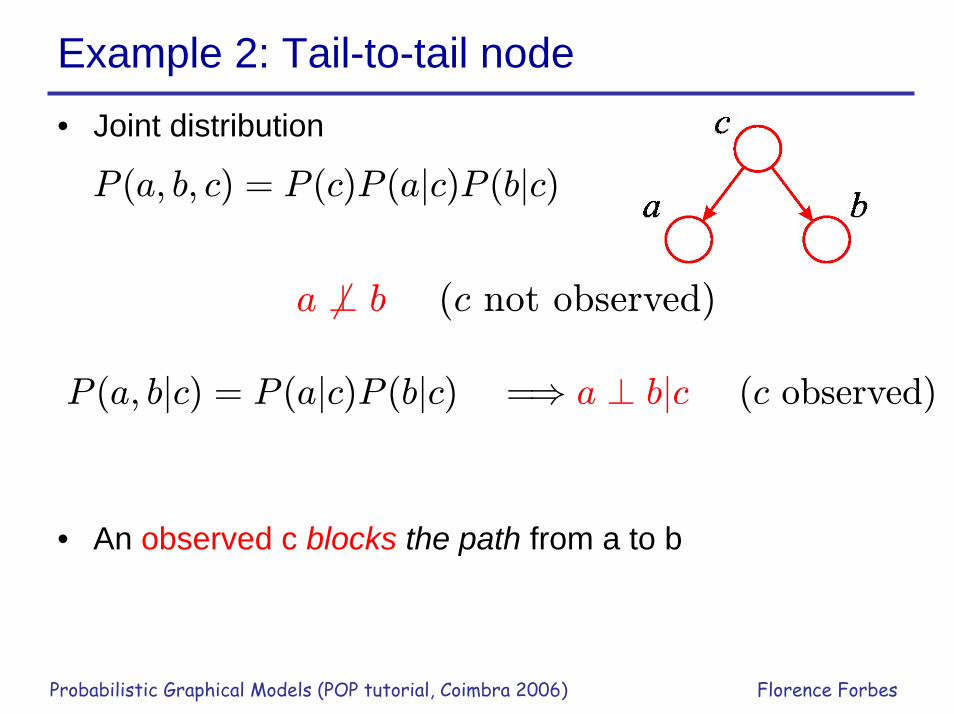
• Joint distribution
• An observed c blocks the path from a to b
a 6⊥ b (c not observed)
P (a, b|c) = P (a|c)P (b|c) =⇒ a ⊥ b|c (c observed)
P (a, b, c) = P (c)P (a|c)P (b|c)

Example 3: “Explaining Away”
Probabilistic Graphical Models (POP tutorial, Coimbra 2006) Florence Forbes
Illustration: pixel colour in an image
An observed I unblocks the path from S to L
image colour
surfacecolour
lightingcolour
d-separation
Probabilistic Graphical Models (POP tutorial, Coimbra 2006) Florence Forbes
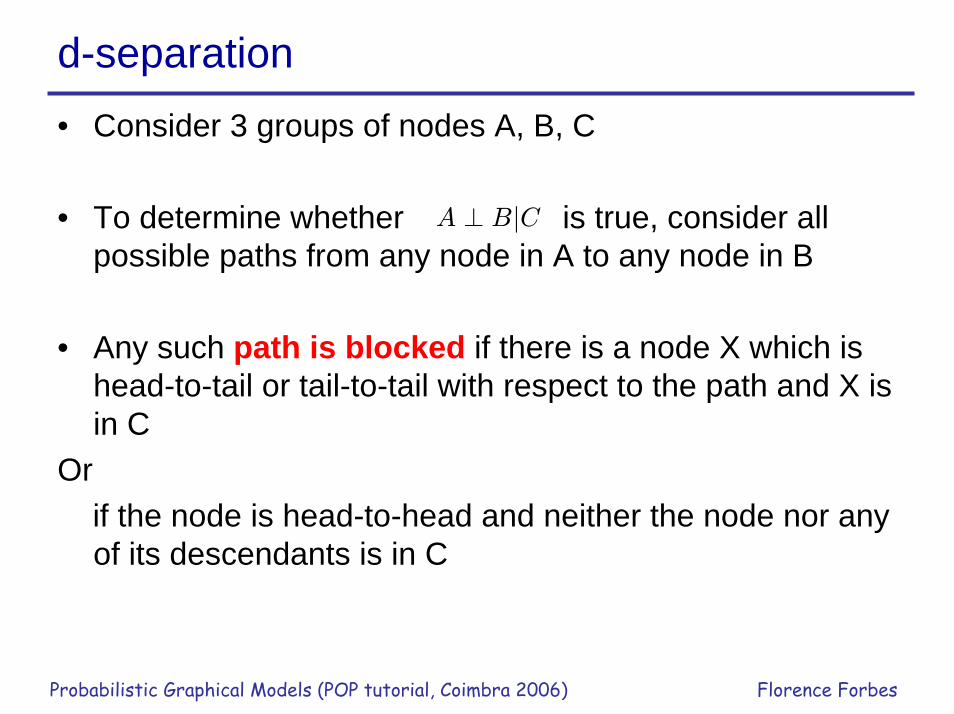
• Consider 3 groups of nodes A, B, C
• To determine whether is true, consider all possible paths from any node in A to any node in B
• Any such path is blocked if there is a node X which is head-to-tail or tail-to-tail with respect to the path and X is in C
Or if the node is head-to-head and neither the node nor any of its descendants is in C
A ⊥ B|C
Undirected graphsMarkov Random Fields
Undirected graphical models
Probabilistic Graphical Models (POP tutorial, Coimbra 2006) Florence Forbes
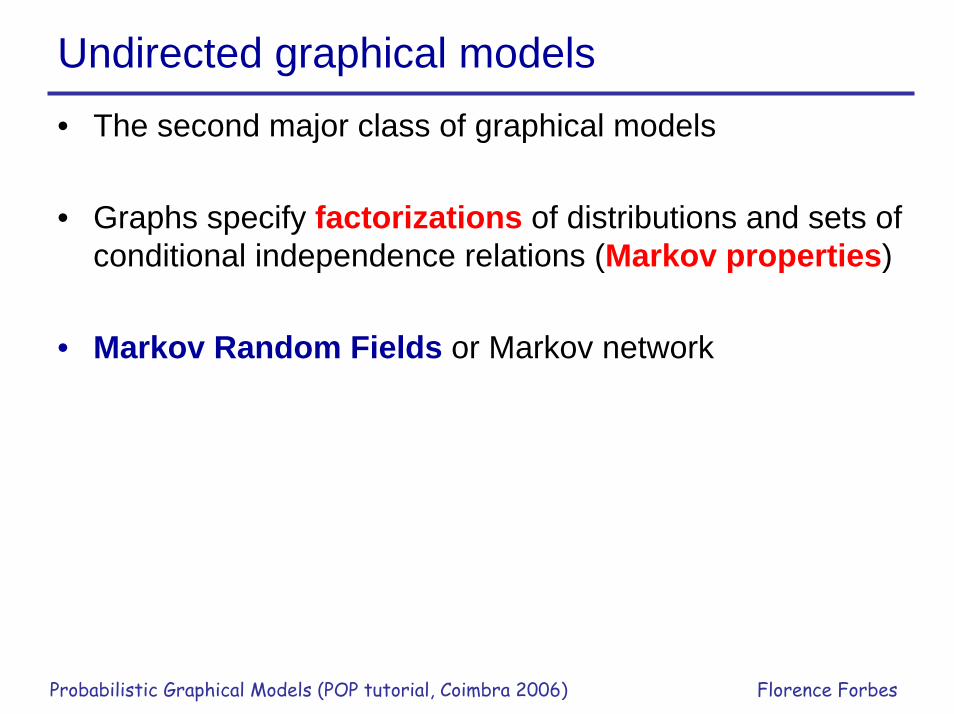
• The second major class of graphical models
• Graphs specify factorizations of distributions and sets of conditional independence relations (Markov properties)
• Markov Random Fields or Markov network
Undirected Graphs: Factorization
Probabilistic Graphical Models (POP tutorial, Coimbra 2006) Florence Forbes
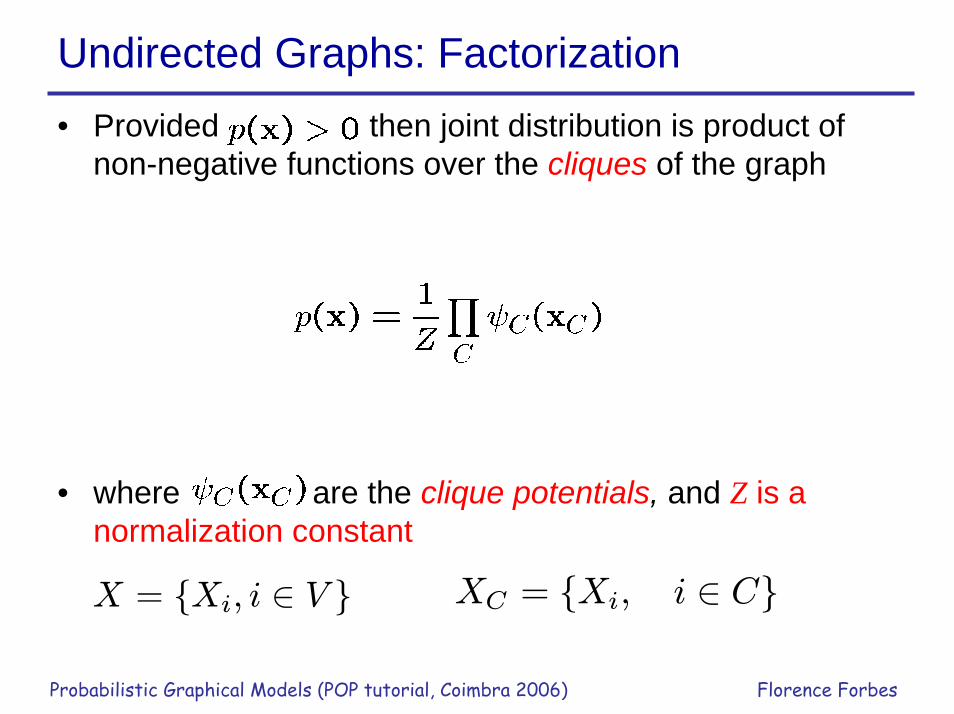
• Provided then joint distribution is product of non-negative functions over the cliques of the graph
• where are the clique potentials, and Z is a normalization constant
XC = {Xi, i ∈ C}X = {Xi, i ∈ V }
Cliques and maximal cliques
Probabilistic Graphical Models (POP tutorial, Coimbra 2006) Florence Forbes
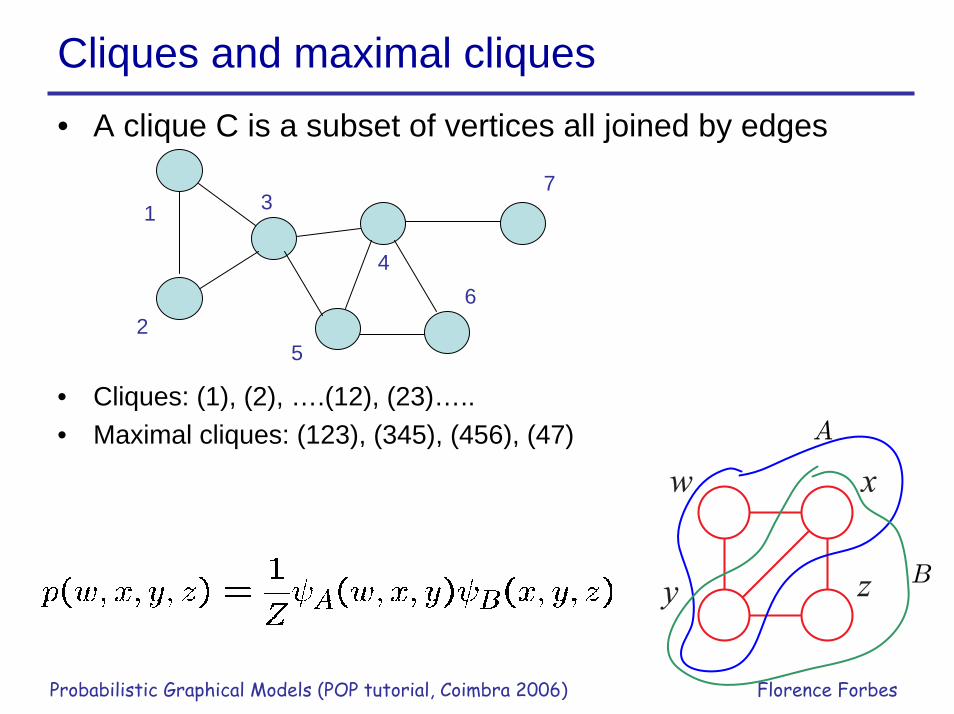
• A clique C is a subset of vertices all joined by edges
• Cliques: (1), (2), ….(12), (23)…..• Maximal cliques: (123), (345), (456), (47)
1
2
4
37
6
5
w
zy
x
A
B
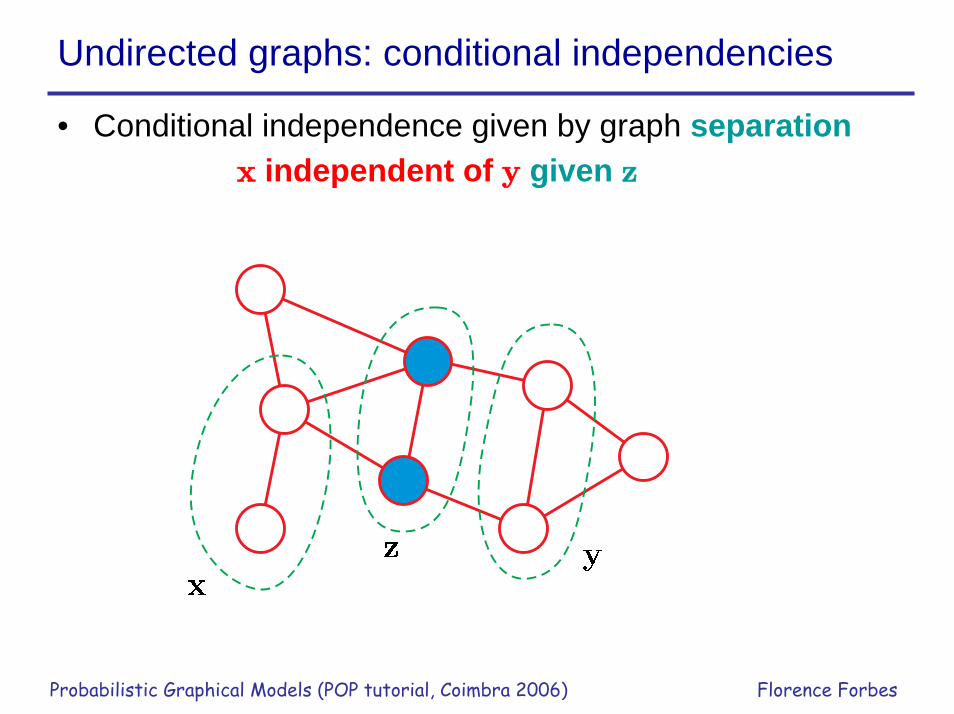
Undirected graphs: conditional independencies
Probabilistic Graphical Models (POP tutorial, Coimbra 2006) Florence Forbes
• Conditional independence given by graph separationx independent of y given z
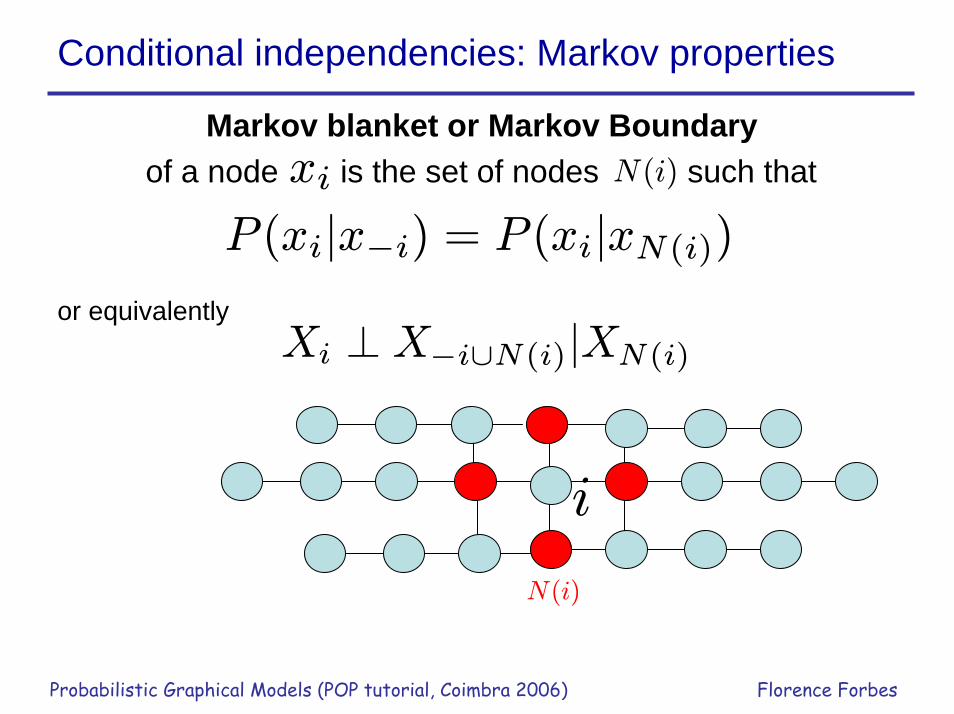
Conditional independencies: Markov properties
Probabilistic Graphical Models (POP tutorial, Coimbra 2006) Florence Forbes
Markov blanket or Markov Boundaryof a node is the set of nodes such that
or equivalently
P (xi|x−i) = P (xi|xN(i))xi N(i)
Xi ⊥ X−i∪N(i)|XN(i)
N(i)
i
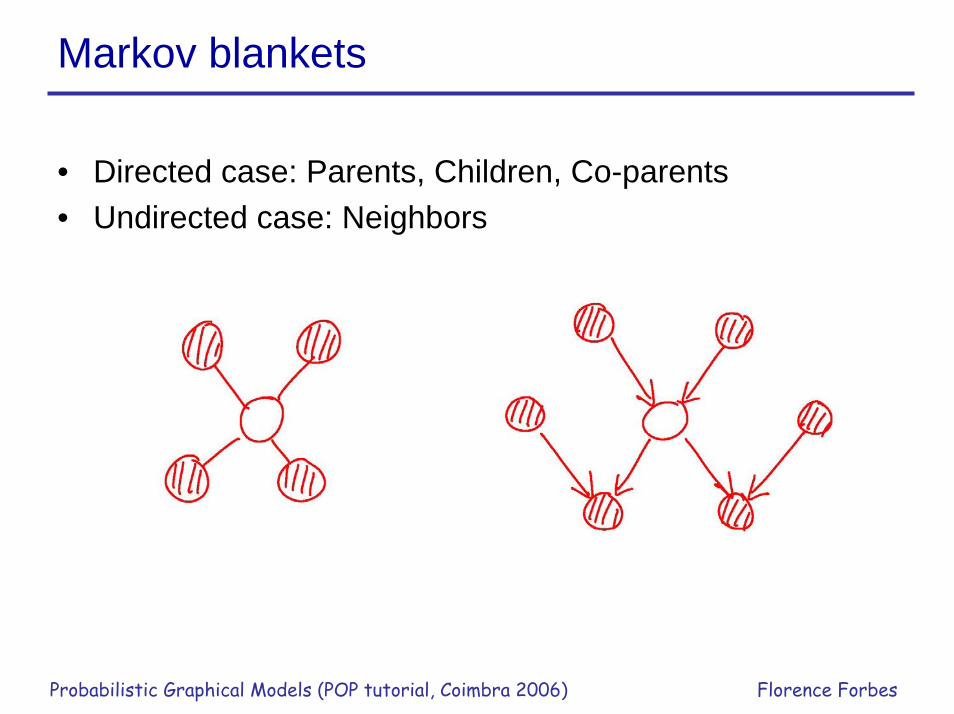
Markov blankets
Probabilistic Graphical Models (POP tutorial, Coimbra 2006) Florence Forbes
• Directed case: Parents, Children, Co-parents• Undirected case: Neighbors
Markov property
Probabilistic Graphical Models (POP tutorial, Coimbra 2006) Florence Forbes
• Graph G=(V,E)
• random vector•
• is Markov wrt Gif and are conditionally independent given whenever C separates A and B
• Specifying conditional independencies using the neighborhood N(i) is enough (V finite)
X = {Xi, i ∈ V }XA = {Xi, i ∈ A}
X
XA XB XC
Hammersley-Clifford theorem
Probabilistic Graphical Models (POP tutorial, Coimbra 2006) Florence Forbes
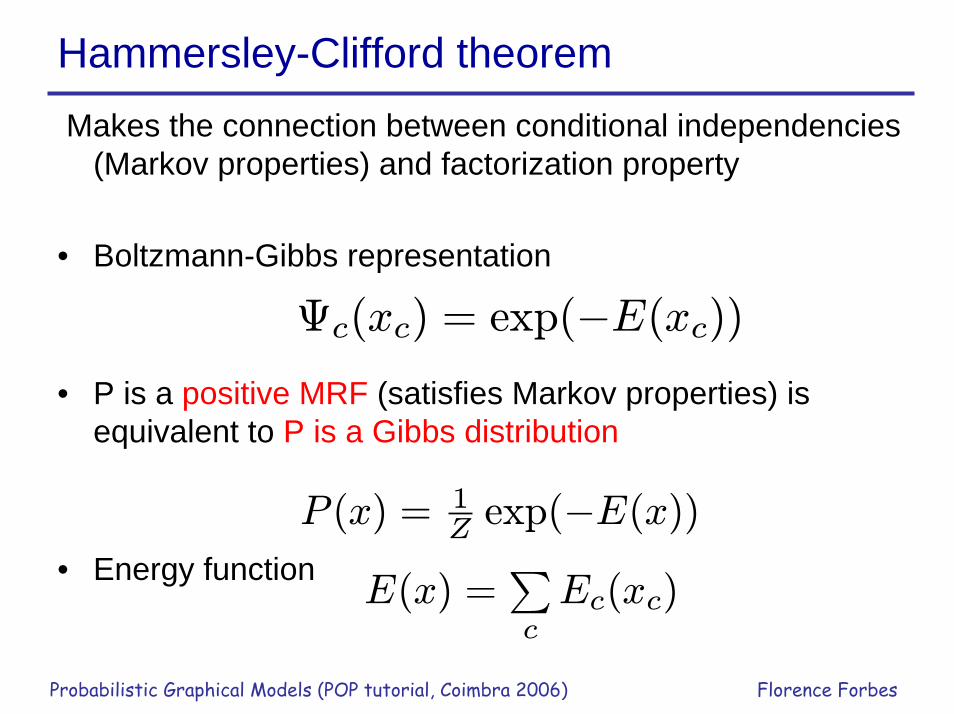
Makes the connection between conditional independencies (Markov properties) and factorization property
• Boltzmann-Gibbs representation
• P is a positive MRF (satisfies Markov properties) is equivalent to P is a Gibbs distribution
• Energy function
Ψc(xc) = exp(−E(xc))
P (x) = 1Z exp(−E(x))
E(x) =PcEc(xc)
Example: pairwise Markov Random Fields
Probabilistic Graphical Models (POP tutorial, Coimbra 2006) Florence Forbes
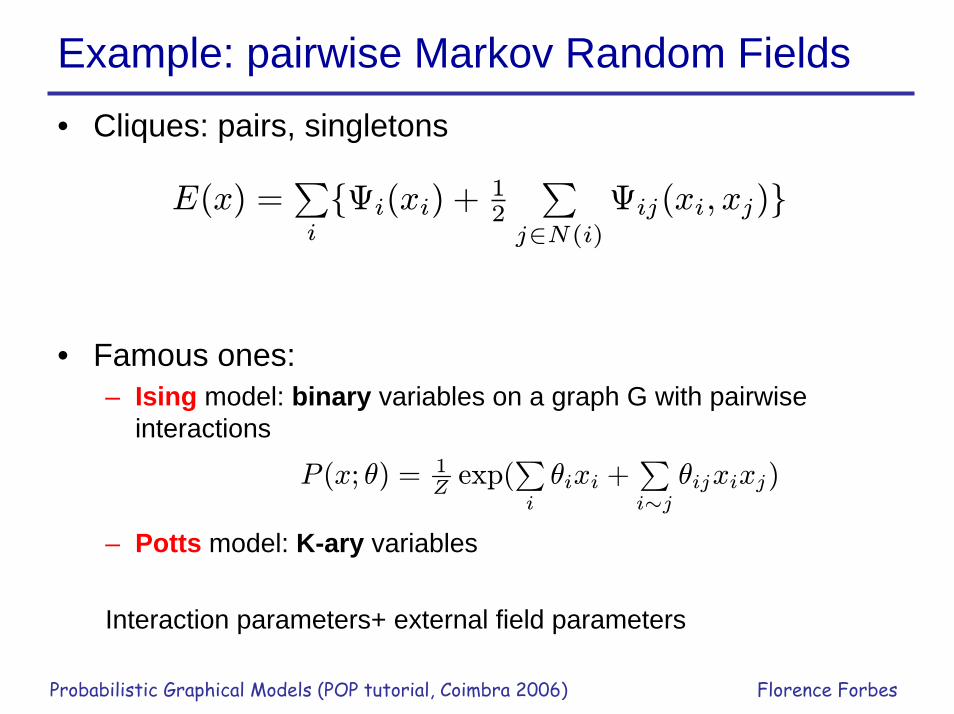
• Cliques: pairs, singletons
• Famous ones:– Ising model: binary variables on a graph G with pairwise
interactions
– Potts model: K-ary variables
Interaction parameters+ external field parameters
E(x) =Pi
{Ψi(xi) + 12
Pj∈N(i)
Ψij(xi, xj)}
P (x; θ) = 1Zexp(
Pi
θixi +Pi∼j
θijxixj)
Example: graph representation of a Pairwise MRF
Probabilistic Graphical Models (POP tutorial, Coimbra 2006) Florence Forbes
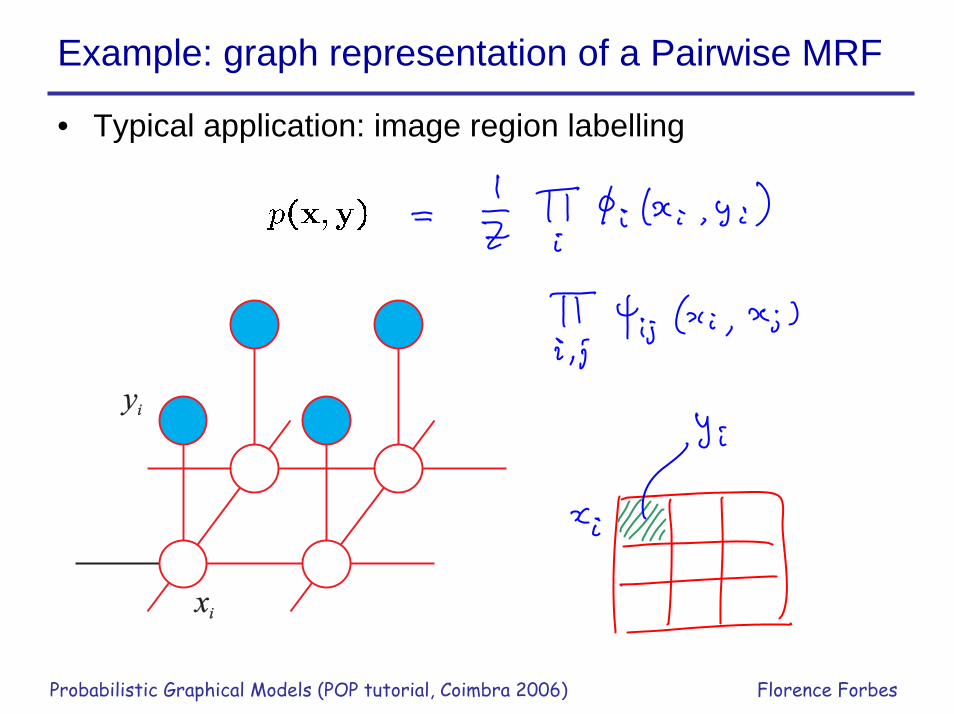
• Typical application: image region labelling
yiyi
xixi
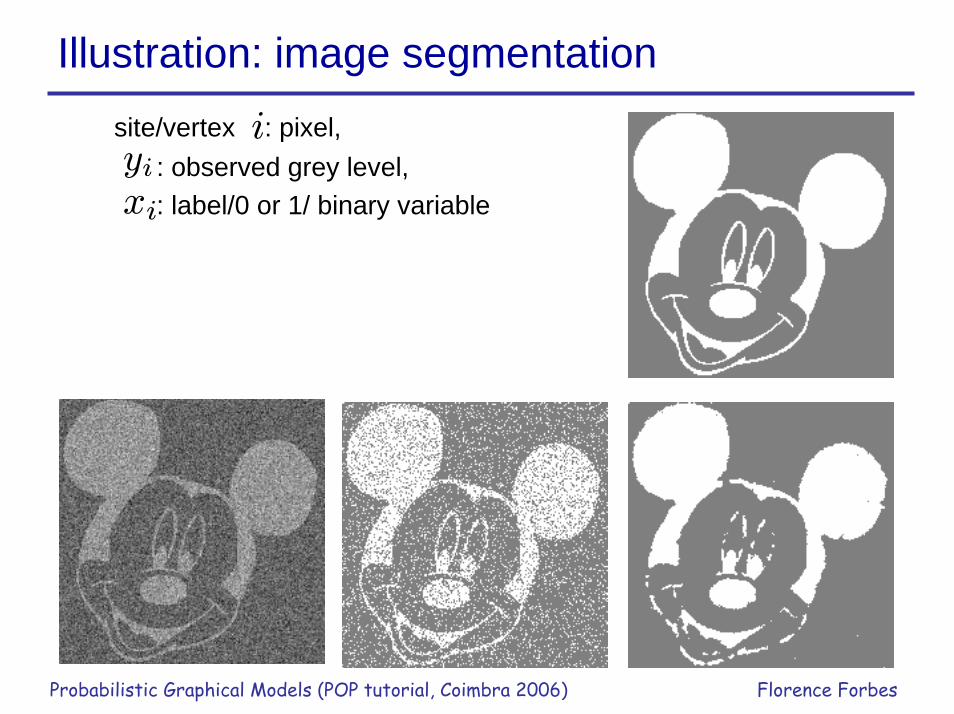
Illustration: image segmentation
Probabilistic Graphical Models (POP tutorial, Coimbra 2006) Florence Forbes
site/vertex : pixel,: observed grey level,: label/0 or 1/ binary variable
yii
xi
Challenging computational problems
Probabilistic Graphical Models (POP tutorial, Coimbra 2006) Florence Forbes
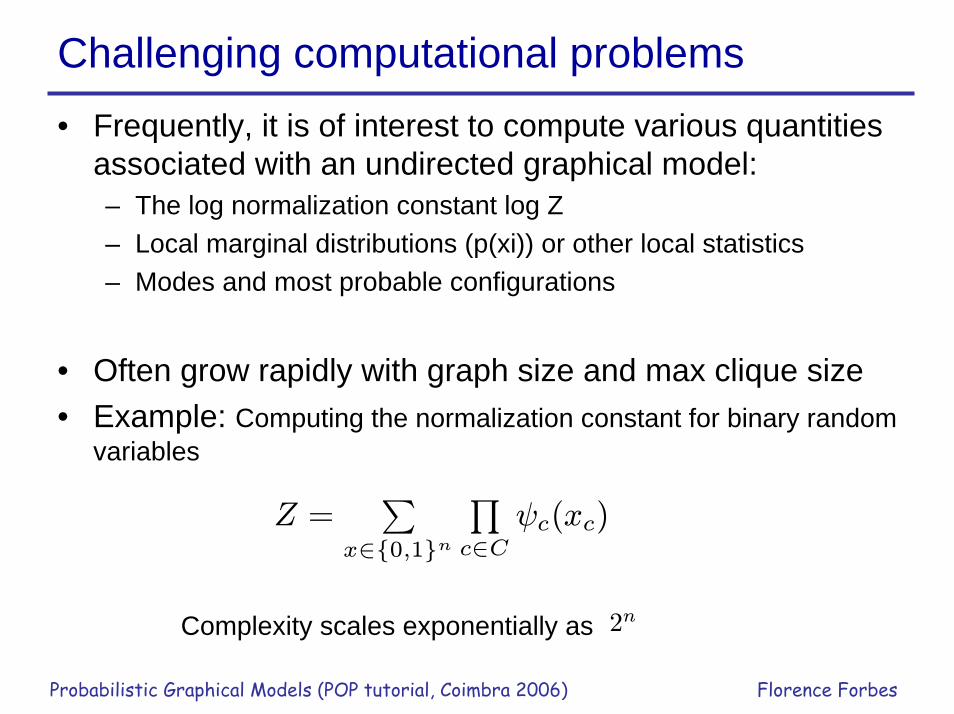
• Frequently, it is of interest to compute various quantities associated with an undirected graphical model:– The log normalization constant log Z– Local marginal distributions (p(xi)) or other local statistics– Modes and most probable configurations
• Often grow rapidly with graph size and max clique size• Example: Computing the normalization constant for binary random
variables
Complexity scales exponentially as
Z =P
x∈{0,1}n
Qc∈C
ψc(xc)
2n
Inference and learning
Inference in Graphical models
Probabilistic Graphical Models (POP tutorial, Coimbra 2006) Florence Forbes
• Exploit the graphical structure to find efficient algorithm for inference and to make the structure of these algorithms clear (eg propagation of local messages around the graph)
• Exact inference• Approximate inference
Inference
Probabilistic Graphical Models (POP tutorial, Coimbra 2006) Florence Forbes
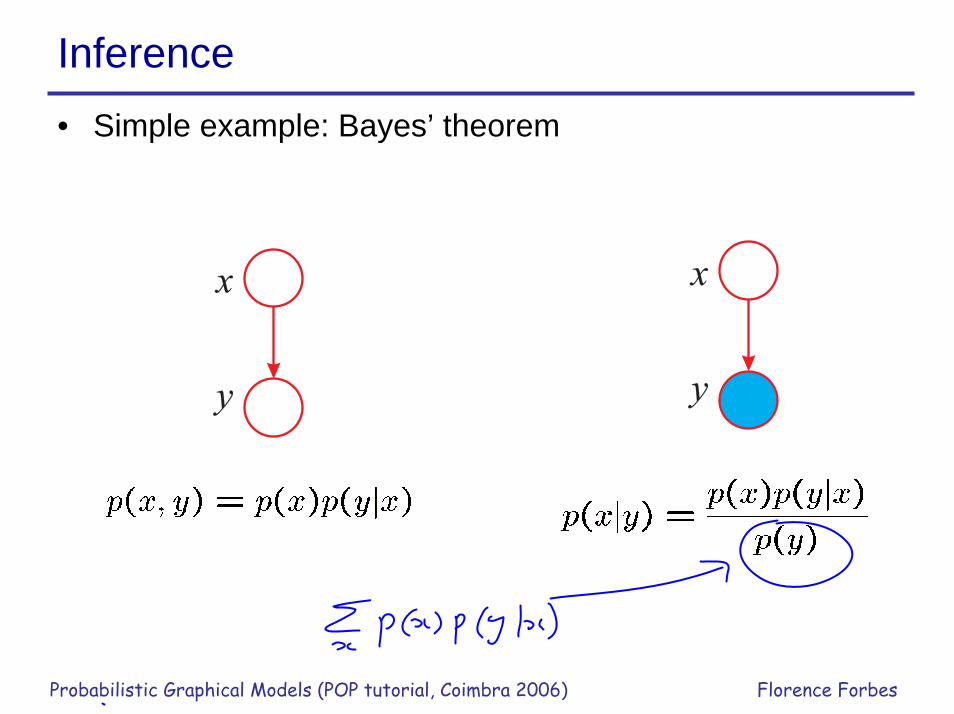
• Simple example: Bayes’ theorem
x
y
x
y
Message Passing: compute marginals
Probabilistic Graphical Models (POP tutorial, Coimbra 2006) Florence Forbes
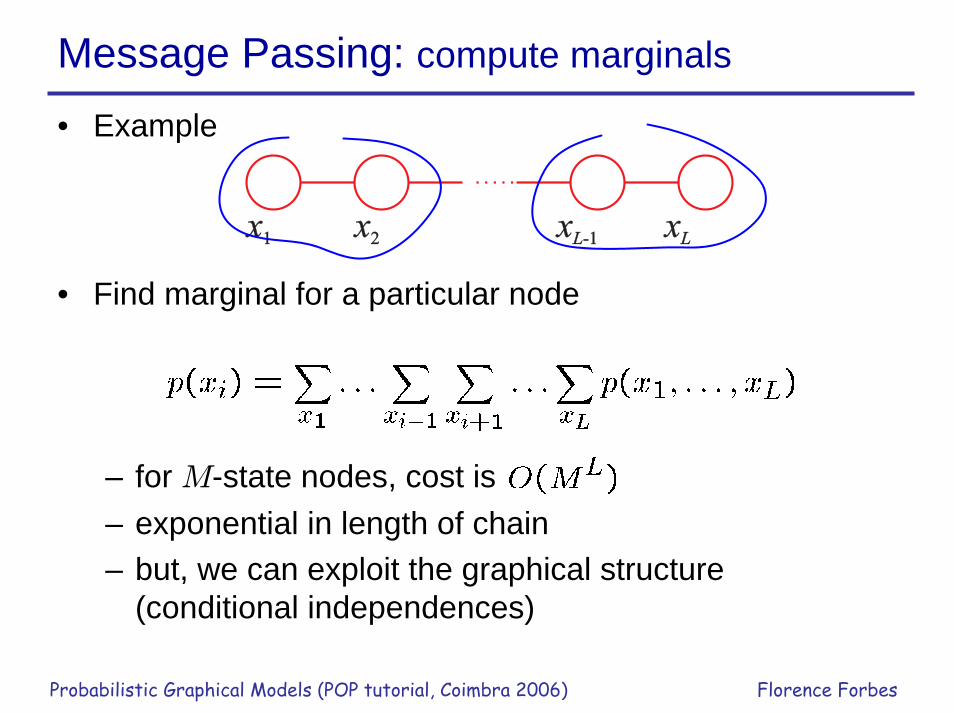
• Example
• Find marginal for a particular node
– for M-state nodes, cost is – exponential in length of chain– but, we can exploit the graphical structure
(conditional independences)
x1x1 x2x2 xL-1xL-1 xLxL
Message Passing
Probabilistic Graphical Models (POP tutorial, Coimbra 2006) Florence Forbes
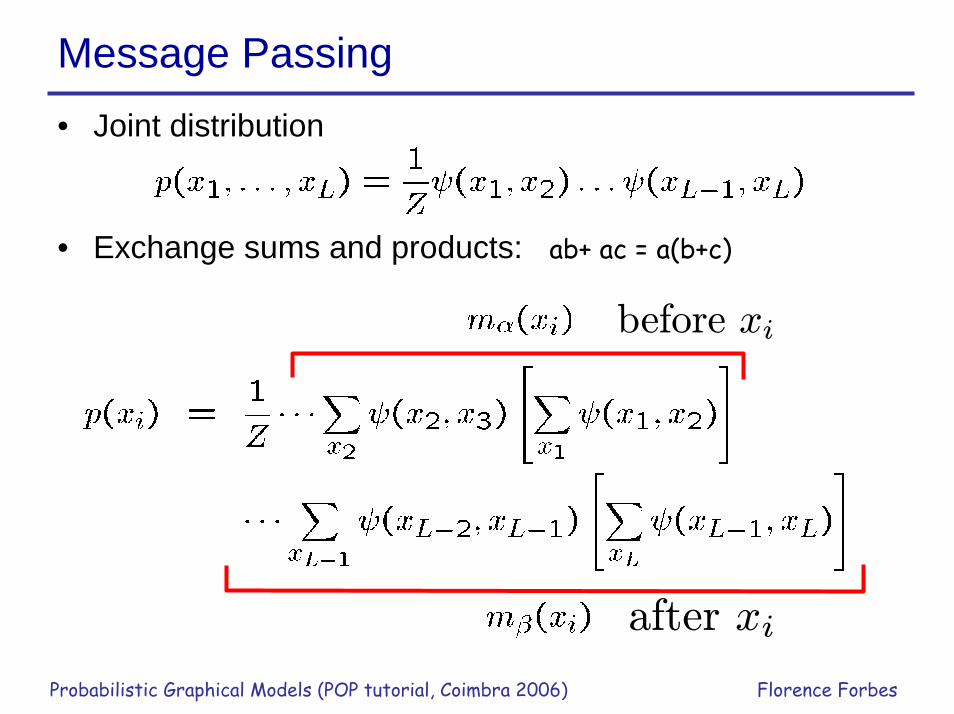
• Joint distribution
• Exchange sums and products: ab+ ac = a(b+c)
before xi
after xi
Message Passing
Probabilistic Graphical Models (POP tutorial, Coimbra 2006) Florence Forbes
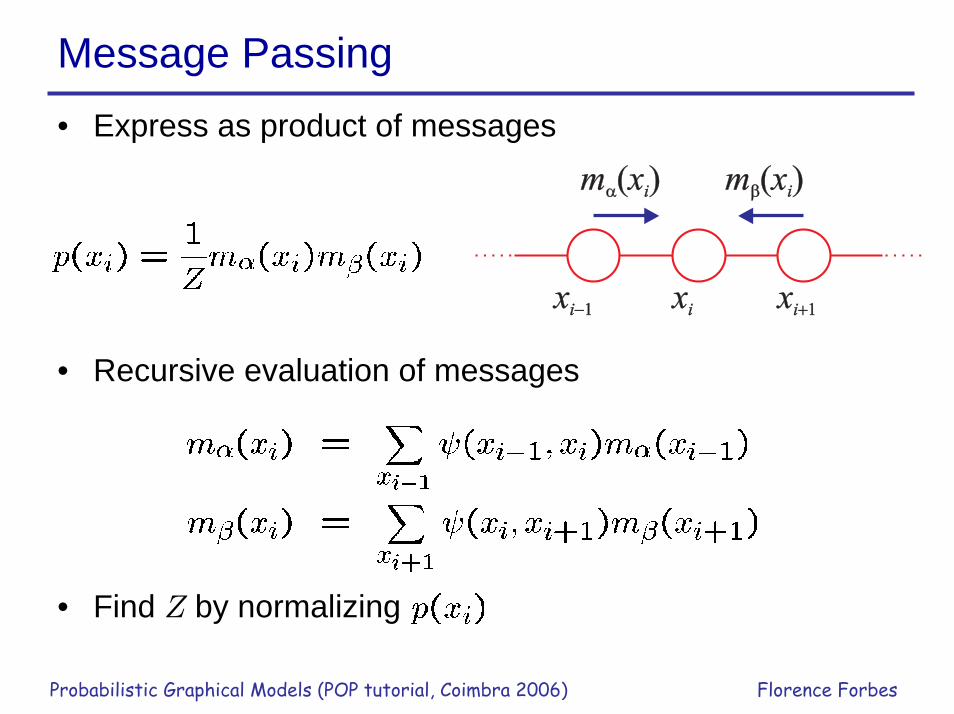
• Express as product of messages
• Recursive evaluation of messages
• Find Z by normalizing
xi�1xi�1 xixi
m x�( )im x�( )i m x�( )im x�( )i
xi�1xi�1
Belief Propagation
Probabilistic Graphical Models (POP tutorial, Coimbra 2006) Florence Forbes
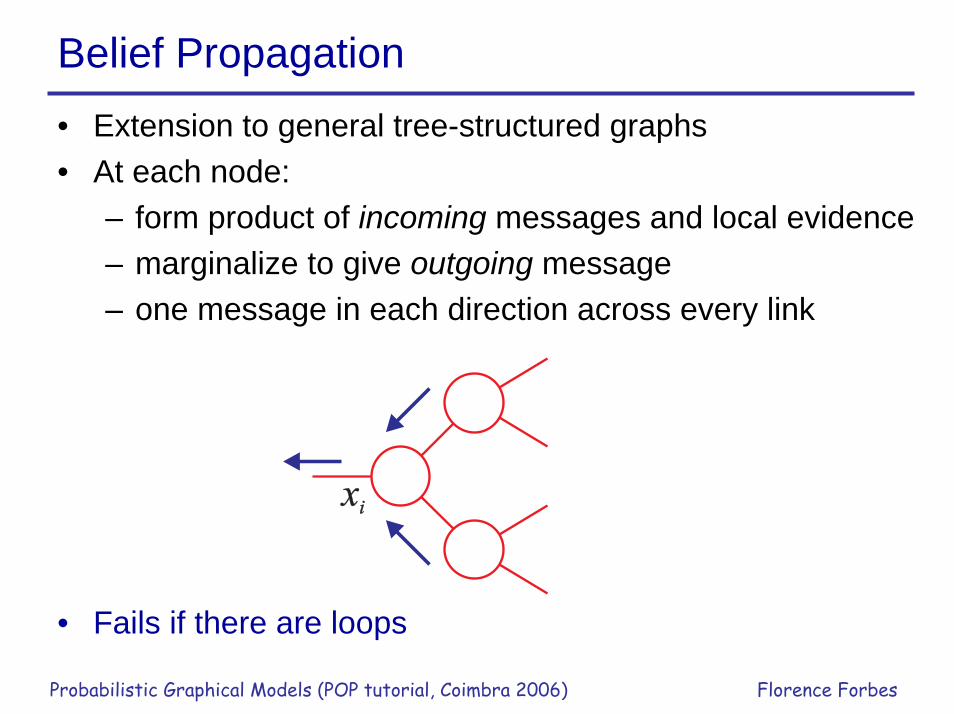
• Extension to general tree-structured graphs• At each node:
– form product of incoming messages and local evidence– marginalize to give outgoing message– one message in each direction across every link
• Fails if there are loops
xixi
Junction Tree Algorithm
Probabilistic Graphical Models (POP tutorial, Coimbra 2006) Florence Forbes
• An efficient exact algorithm for a general graph– applies to both directed and undirected graphs– compile original graph into a tree of cliques– then perform message passing on this tree
• Problem: – cost is exponential in size of largest clique– many vision models have intractably large cliques
Loopy Belief Propagation
Probabilistic Graphical Models (POP tutorial, Coimbra 2006) Florence Forbes
• Apply belief propagation directly to general graph– possible because message passing rules are local– need to keep iterating– might not converge
• State-of-the-art performance in error-correcting codes
Max-product Algorithm: most probable x
Probabilistic Graphical Models (POP tutorial, Coimbra 2006) Florence Forbes
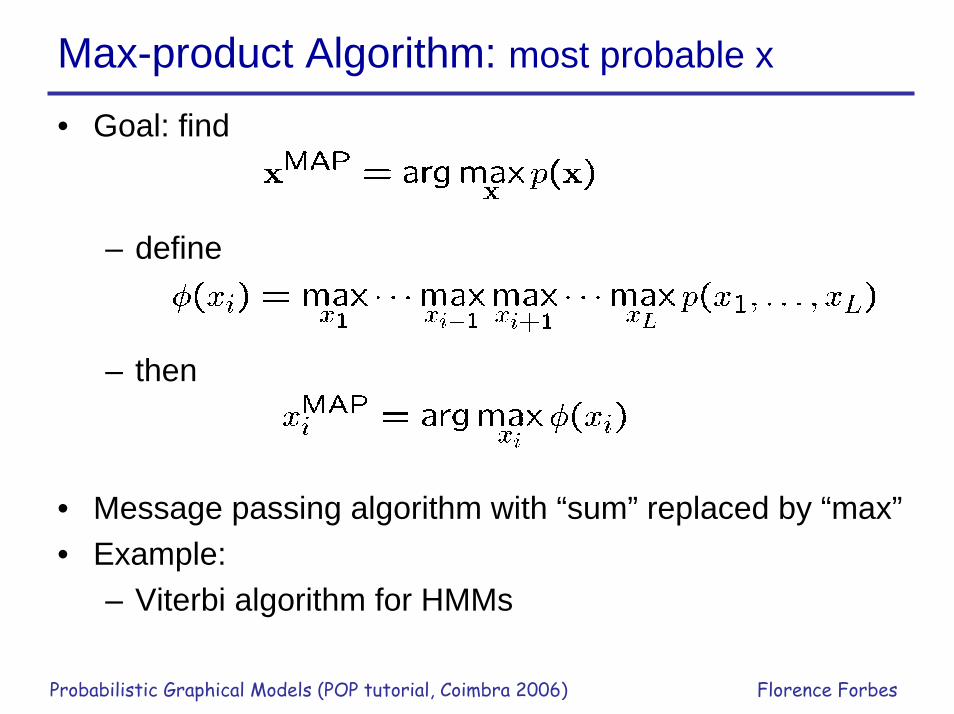
• Goal: find
– define
– then
• Message passing algorithm with “sum” replaced by “max”• Example:
– Viterbi algorithm for HMMs
Inference and learning
Probabilistic Graphical Models (POP tutorial, Coimbra 2006) Florence Forbes
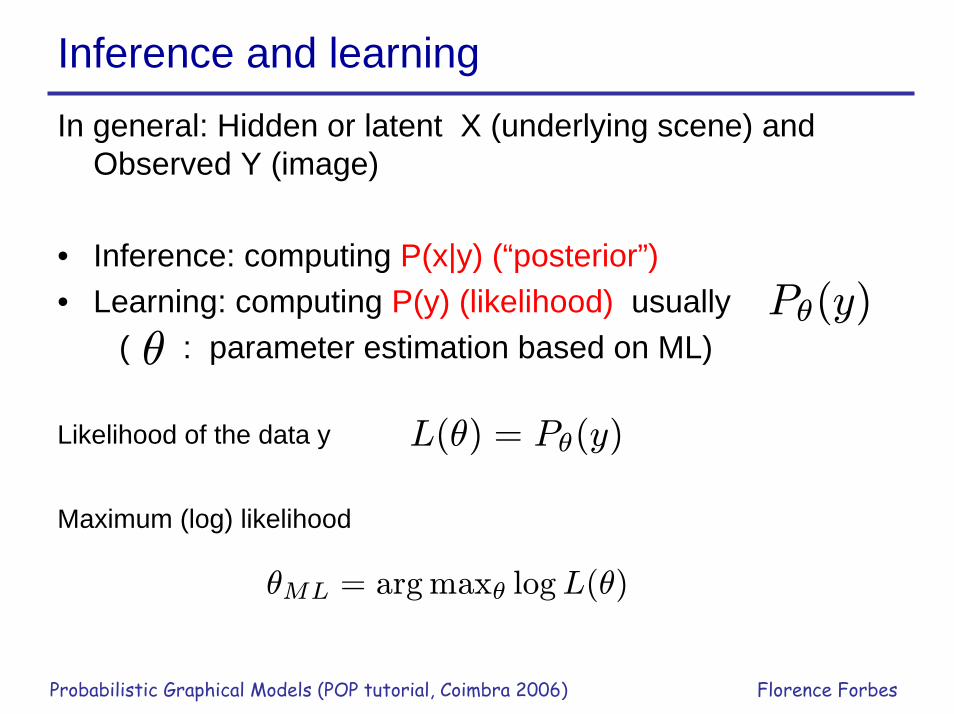
In general: Hidden or latent X (underlying scene) and Observed Y (image)
• Inference: computing P(x|y) (“posterior”)• Learning: computing P(y) (likelihood) usually
( : parameter estimation based on ML)
Likelihood of the data y
Maximum (log) likelihood
Pθ(y)θ
L(θ) = Pθ(y)
θML = argmaxθ logL(θ)
Example: classification with context
Probabilistic Graphical Models (POP tutorial, Coimbra 2006) Florence Forbes
• The labeling problem
F n objects/individuals (i ∈ V = {1, . . . , n})F K labels (k ∈ L = {1, . . . ,K})F n ∗ . . . observations (y = (y1, y2, . . .))
assign a label to each object consistently with y:x : V → L
x = (x1, . . . , xn ∈ Ln)
(assignement, colouring (graph), configuration (random fields)
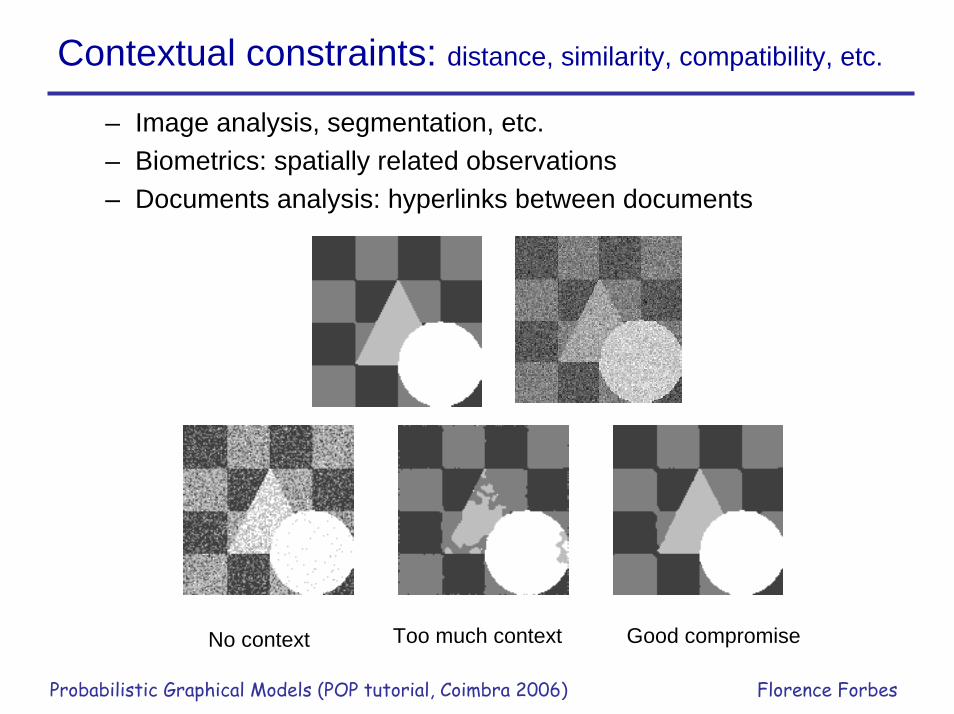
Contextual constraints: distance, similarity, compatibility, etc.
Probabilistic Graphical Models (POP tutorial, Coimbra 2006) Florence Forbes
– Image analysis, segmentation, etc.– Biometrics: spatially related observations– Documents analysis: hyperlinks between documents
Too much context Good compromiseNo context
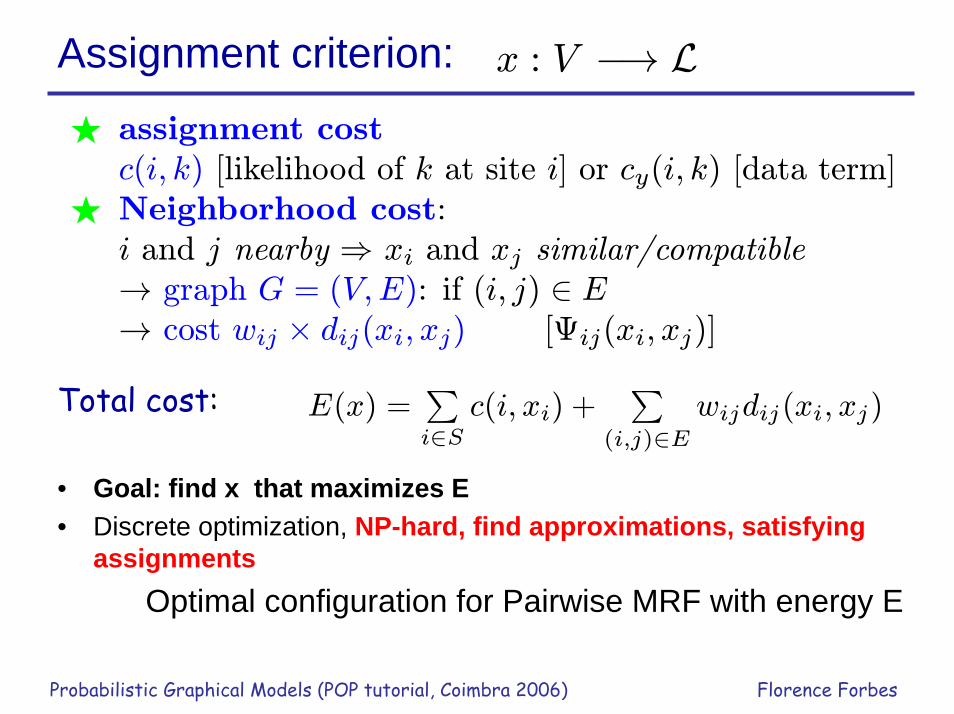
Assignment criterion:
Probabilistic Graphical Models (POP tutorial, Coimbra 2006) Florence Forbes
x : V −→ L
Total cost:
• Goal: find x that maximizes E• Discrete optimization, NP-hard, find approximations, satisfying
assignmentsOptimal configuration for Pairwise MRF with energy E
E(x) =Pi∈S
c(i, xi) +P
(i,j)∈Ewijdij(xi, xj)
F assignment costc(i, k) [likelihood of k at site i] or cy(i, k) [data term]
F Neighborhood cost:i and j nearby ⇒ xi and xj similar/compatible→ graph G = (V,E): if (i, j) ∈ E→ cost wij × dij(xi, xj) [Ψij(xi, xj)]
Markovian approach and MAP rule
Probabilistic Graphical Models (POP tutorial, Coimbra 2006) Florence Forbes
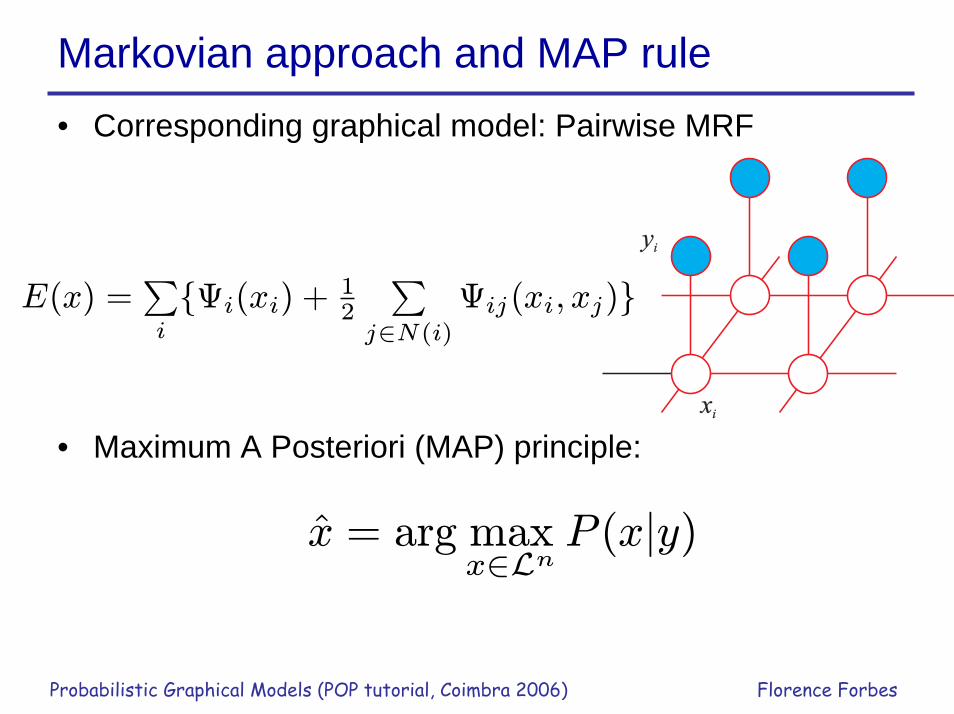
• Corresponding graphical model: Pairwise MRF
• Maximum A Posteriori (MAP) principle:
yiyi
xixi
x̂ = arg maxx∈Ln
P (x|y)
E(x) =Pi
{Ψi(xi) + 12
Pj∈N(i)
Ψij(xi, xj)}
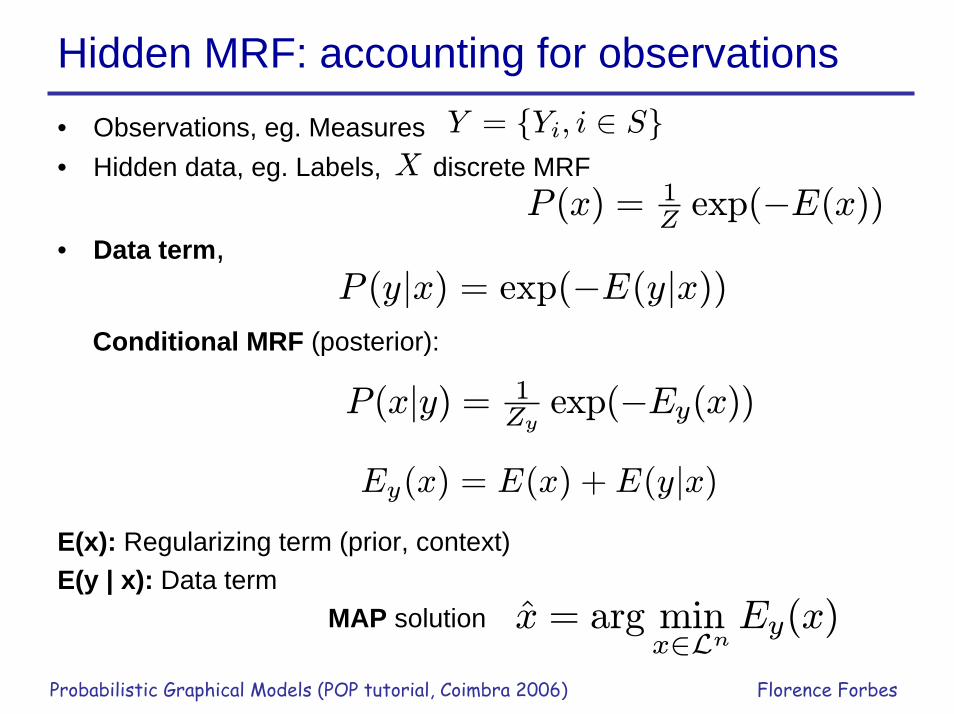
Hidden MRF: accounting for observations
Probabilistic Graphical Models (POP tutorial, Coimbra 2006) Florence Forbes
• Observations, eg. Measures• Hidden data, eg. Labels, discrete MRF
• Data term,
Conditional MRF (posterior):
E(x): Regularizing term (prior, context)E(y | x): Data term
MAP solution
Y = {Yi, i ∈ S}X
P (x) = 1Zexp(−E(x))
P(x|y) = 1Zyexp(−Ey(x))
x̂ = arg minx∈Ln
Ey(x)
Ey(x) = E(x) + E(y|x)
P (y|x) = exp(−E(y|x))
Approximate solutions
Probabilistic Graphical Models (POP tutorial, Coimbra 2006) Florence Forbes
• Deterministic approaches: relaxation, variational methods (mean field, etc.)
• Stochastic approaches: Gibbs sampling, simulation methods (MC)
• Classification approaches: hard clustering, ICM, K-means• Parameter estimation approaches: soft clustering, EM
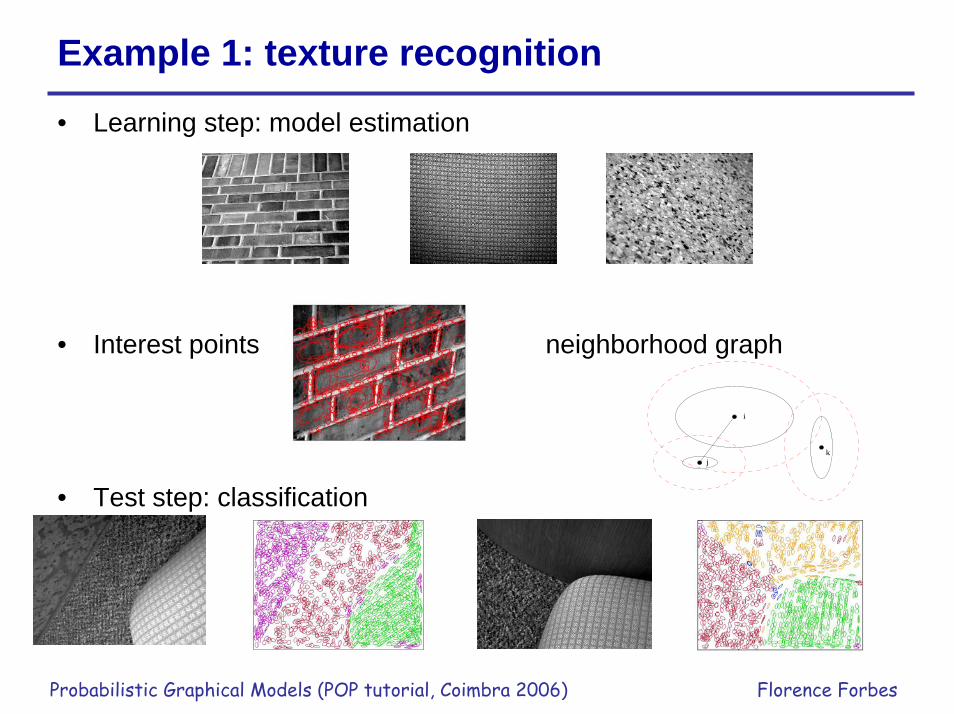
Example 1: texture recognition
Probabilistic Graphical Models (POP tutorial, Coimbra 2006) Florence Forbes
• Learning step: model estimation
• Interest points neighborhood graph
• Test step: classification
i
jk
Probabilistic Graphical Models (POP tutorial, Coimbra 2006) Florence Forbes
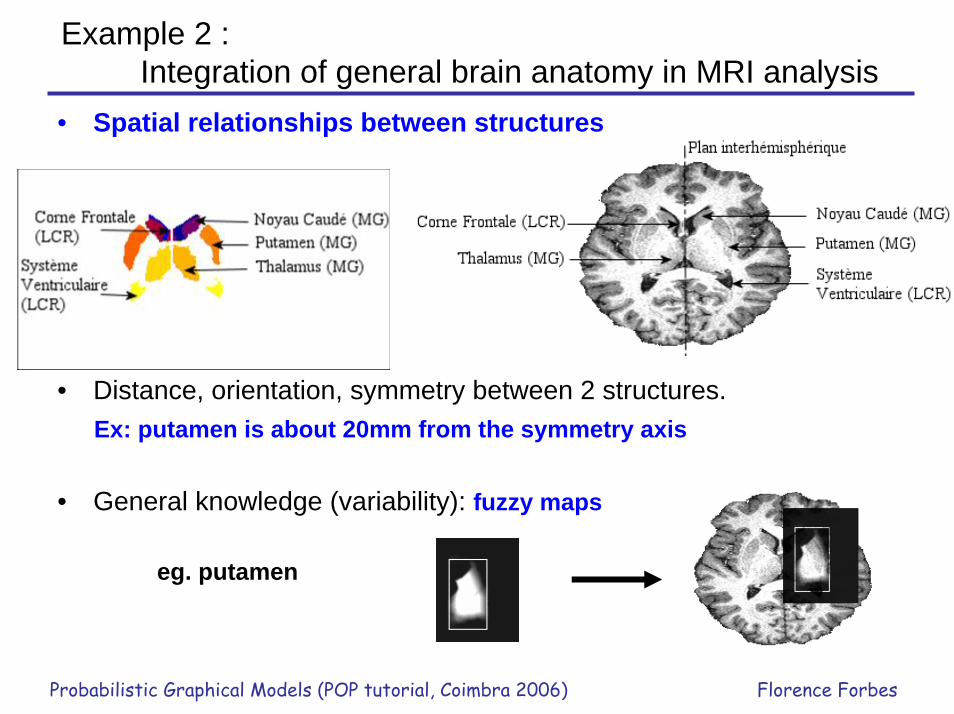
Example 2 :Integration of general brain anatomy in MRI analysis
• Spatial relationships between structures
• Distance, orientation, symmetry between 2 structures. Ex: putamen is about 20mm from the symmetry axis
• General knowledge (variability): fuzzy maps
eg. putamen
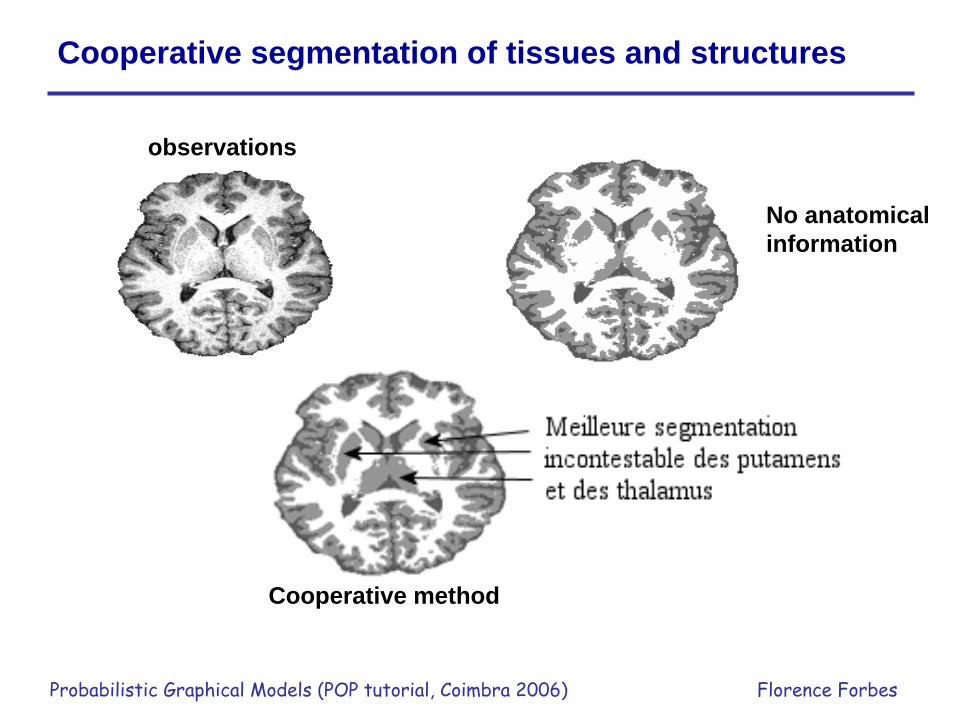
Cooperative segmentation of tissues and structures
Probabilistic Graphical Models (POP tutorial, Coimbra 2006) Florence Forbes
observations
No anatomical information
Cooperative method
Why do we think MRFs can be useful ?
Probabilistic Graphical Models (POP tutorial, Coimbra 2006) Florence Forbes
• Graphical models for audiovisual fusion– Most (all?) approaches treat audio and video signals similarly,
ignoring the spatial nature of images: • Video as bag of frames (add temporal correlation)• Frames as bag of pixels • HMM based models only? Couple, factorial HMM
– Introduce dependencies (MRF) for the video part– In general, goal is audiovisual object tracking, recognition– Generalize to other multimedia tasks?
• Integrating external information (eg audio) into a pairwiseinteraction model (video), generalizing the brain MRI example
The End
Probabilistic Graphical Models (POP tutorial, Coimbra 2006) Florence Forbes
• Thank you for your attention• Please ask questions!