probabilistic calibration and experimental validation of...
TRANSCRIPT

Journal of Earthquake Engineering, 13:426–462, 2009
Copyright � A.S. Elnashai & N.N. Ambraseys
ISSN: 1363-2469 print / 1559-808X online
DOI: 10.1080/13632460802598610
Probabilistic Calibration and ExperimentalValidation of the Seismic Design Criteria
for One-Story Concrete Frames
FABIO BIONDINI and GIANDOMENICO TONIOLO
Department of Structural Engineering, Politecnico di Milano, Milan, Italy
This article investigates the seismic performance of one-story reinforced concrete structures for indus-trial buildings. To this aim, the seismic response of two structural prototypes, a cast-in-situ monolithicframe and a precast hinged frame, is compared for four different levels of translatory stiffness andseismic capacity. For these structures an incremental nonlinear dynamic analysis is performed within aMonte Carlo probabilistic simulation. The results obtained from the probabilistic analysis prove thatprecast structures have the same seismic capacity of the corresponding cast-in-situ structures andconfirm the overall goodness of the design criteria proposed by Eurocode 8, even if a noteworthydependency of the actual structural behavior from the prescribed response spectrum is pointed out.
The experimental verification of these theoretical results is searched for by means of pseudo-dynamic tests on full-scale structures. The results of these tests confirm the overall equivalence ofthe seismic behavior of precast and cast-in-situ structures. Moreover, two additional prototypeshave been designed to investigate the seismic behavior of precast structures with roof elementsplaced side by side. The results of these further tests show that an effective horizontal diaphragmaction can be activated even if the roof elements are not connected among them, and confirm theexpected good seismic performance of these precast systems. Finally, the results of the experimentaltests are compared with those obtained from nonlinear structural analyses. The good agreementbetween numerical and experimental results confirms the accuracy of the theoretical model and,with it, the results of the probabilistic investigation.
Keywords Concrete Structures; Seismic Design; Behavior Factor; Probabilistic Analysis;Eurocodes; Pseudodynamic Tests
1. Introduction
Seismic design of structures is usually based on the results of elastic analyses under static
forces corresponding to the peak acceleration of the system subjected to the ground
motion and properly reduced to take into account the structural resources able to attenuate
the seismic effects (i.e., ductility, overstrength, damping, redundancy). According to
Eurocode 8 (EC8) [CEN-EN 1998-1, 2004], the static force F equivalent to seismic
action can be evaluated as follows:
F ¼ 2:5�g
qS�ðTÞW ; (1)
where W is the weight of the vibrating mass, ag = ag/g is the peak ground acceleration
(PGA) normalized with respect to the gravity constant g, S is the soil factor, Z(T) � 1 is
Received 22 October 2007; accepted 18 September 2008.
Address correspondence to Fabio Biondini, Department of Structural Engineering, Politecnico di Milano,
Piazza L. Da Vinci 32, 20133 Milan, Italy; E-mail: [email protected]
426

the decreasing function of the elastic response spectrum computed for the natural vibra-
tion period T of the structure, and q is a proper reducing behavior factor. This factor
simulates, in an overall way, the effects of plastic hysteretical dissipation of energy and
other nonlinearities of the structure under seismic events.
EC8 gives a set of q-factors related to the different types of structures, with their
potential capacity of energy dissipation conventionally evaluated on the base of the
ultimate failure mechanism. At present such q-values are defined more or less on the
basis of empirical choices, not supported by a rigorous investigation of sufficient relia-
bility, and are assumed to be independent from the type of ground motion as represented
by the specific response spectrum. This empirical procedure may obviously lead to
unjustified inequalities between different materials and structures. Therefore, there is a
need of a more accurate calibration of the behavior factors by also taking into account the
random nature of the seismic event.
In the old ENV version of EC8 (ENV 1998-1:1994) precast frames were penalized
by a lower q-factor with respect to cast-in-situ frames. This inequality resulted from a
wrong statement of the fundamental requirement for the structural ductility necessary for
energy dissipation: ‘‘An overall ductile behaviour is ensured if the ductility demand is
spread over a large number of elements and locations in the structure.’’ According to this
statement, the cast-in-situ monolithic frame shown in Fig. 1a should be characterized by
better seismic performance than the precast hinged frame shown in Fig. 1b, since the
critical zones where the energy dissipation takes place are four in the monolithic case and
only two in the hinged case. Contrary to this assumption, the actual behavior is that, under
the same seismic force, the monolithic arrangement of Fig. 1a, with four critical sections
dimensioned for a moment m @ Fh/2, may dissipate the same amount of energy which the
hinged arrangement of Fig. 1b dissipates in its two critical sections, dimensioned as they
are for a doubled moment M = Fh @ 2m (4u = 2U) [Biondini and Toniolo, 2000]. This
point of view is also reflected by the new statement included in the last version of EC8
[2004]: ‘‘An overall ductile behaviour is ensured if ductility demand involves globally a
large volume of the structure spread to different elements and location of all its storeys.’’
In fact, it is the global volume involved in dissipation, and not the number of plastic
hinges, that gives the total amount of energy dissipated by the structure.
In order to verify the accuracy of the design criteria proposed by EC8 for reinforced
concrete frame systems, this article presents a fully probabilistic approach for the
calibration of the behavior factors made through the comparison between the results of
the simplified design in which they are used, and the results of nonlinear dynamic
h
u
u
u
u
m m
m m
FF
UU
M M
F F
h
)b()a(
FIGURE 1 Energy dissipation in one-story frames: (a) monolithic and cast-in-situ;
(b) hinged and precast.
Seismic Design of Concrete Frames 427

analyses which should simulate the actual seismic behavior of the structure [Biondini and
Toniolo, 2002]. In particular, the attention is focused on the seismic performance of one-
story frames for industrial buildings, either cast-in-situ or precast. The seismic response
of two structural prototypes, a cast-in-situ monolithic frame and a precast hinged frame, is
compared for four levels translatory stiffness and seismic capacity. For these structures,
an incremental nonlinear dynamic analysis is performed within a Monte Carlo probabil-
istic simulation by taking the randomness of both the ground motion and the material
properties into account. The use of recorded accelerograms provided by strong motion
collections, as well as of artificial accelerograms properly generated to comply with
prescribed design response spectra, is also discussed [Biondini et al., 2001; Biondini and
Toniolo, 2003]. The whole process is repeated for the different types of response spectra
and, with each spectrum, for a set of different natural vibration periods, so to investigate a
wide range of structural solutions [Biondini and Toniolo, 2006].
The results of the probabilistic analysis are described in terms of ‘‘overstrength’’
ratio between the computed ultimate resistance and the seismic capacity deduced from
the EC8 design rules. The distributions of the overstrength show that precast structures
have the same seismic capacity of the corresponding cast-in-situ structures and highlight
a good accuracy of the design rules of EC8, even if some unreliable values of over-
strength are obtained for the higher vibration period and a noteworthy dependency of the
behavior factor from the prescribed response spectrum is pointed out.
The experimental verification of these theoretical results is searched for by means of
pseudodynamic tests on full-scale structures carried out at ELSA Laboratory of the Joint
Research Center of the European Commission at Ispra (Italy) within the scope of the
European research project ECOLEADER (2001–2003). Two structural prototypes con-
sisting of six-columns with two lines of beams and an interposed continuous slab have
been designed [Biondini et al., 2004]. The prototypes differ for the beam-column con-
nections only, made with monolithic joints for the cast-in-situ solution and with hinged
joints for the precast solution. The results of these tests confirm the overall equivalence of
the seismic behavior of precast and cast-in-situ structures.
The seismic behavior of precast structures with roof elements placed side by side and
lateral wall panel claddings is also investigated. To this purpose, two additional prototypes
have been designed and tested at ELSA Laboratory within the scope of the European
research project GROWTH (2002–2006). These prototypes are similar to the previous ones
and differ only for the orientation of the roof elements with respect to the direction of
the seismic action [Biondini and Toniolo, 2007; Ferrara et al., 2006; Kramar et al., 2006].
The results of these additional tests show that an effective horizontal diaphragm action can
be activated even if the roof elements are not connected among them. Moreover, they
confirm the expected good seismic performance of this type of precast systems.
2. Short Survey of European Codes
An overview of the seismic design criteria adopted for the type of buildings investigated
in this study is given with reference to the code provisions adopted by Eurocodes and
national codes of European countries particularly subjected to seismic risk.
As already pointed out, the new version of EC8 – Part 1 [EN1998-1:2004, 2004] in
Clause 5.11.1.4 gives to precast structures the same q-factors of cast-in-situ structures,
provided they have what in this survey we call ‘‘seismic connections’’ for the sake of
brevity. These connections, as regulated in Clause 5.11.2.1, are those ‘‘located away
from critical regions,’’ or ‘‘overdesigned’’ with respect to the critical regions, or with
‘‘energy dissipation’’ capacity. In particular, for ‘‘precast frame systems with hinged
428 F. Biondini and G. Toniolo

column-to-beam connections’’ a special requirement for the base supports is added in
Clause 5.11.3.2 (overdesigned pocket foundations).
In Portugal, precast integrated systems shall be certified by the National Laboratory
of Civil Engineering (LNEC). Precast structures designed by order do not need this
certification and are designed with the same rules of cast-in-situ structures. For both
precast and cast-in-situ structures, the q-factors are lower than those given in EC8.
However, within 2008 the EC8 should be adopted and the draft of the National Annex
equalises precast structures with ‘‘seismic connections’’ to cast-in-situ structures.
In Italy, a new code has been issued in 2008 (Technical rules for contructions – DM
14.01.2008). The seismic design rules of this code are very similar to those of EC8. Precast
structures are equalized to the cast-in-situ ones, with the addition of a specific type of ‘‘isostatic
frames’’ (frames with sliding column-to-beam bearings) which is penalized with a lower
q-factor. The other type of structures, including the hinged frames, have the same q-factors as
given by the EC8. The previous code (DM 16.01.1996) had no disequalities between precast
and cast-in-situ structures. For a short period (2003–2008), a provisional code for seismic
design (Ordinance PCM 3274) was in force, with rules that were very similar to those of EC8.
Slovenia has adopted Eurocodes as the only applicable codes since the beginning of
2008, and this includes the equalization between precast and cast-in-situ structures. For
one-story precast frames, design in high ductility class DCH is allowed only if the
‘‘column tops are connected along both the main directions.’’ In the other cases, special
tests are required, or the design shall be made in medium ductility class DCM. Before
2008, the Yugoslavian seismic design code YU1981 was used. In terms of seismic
equivalent forces, this code did not make differences between precast and cast-in-situ
structures. Tests were obligatory for ‘‘industrially produced prefabricated buildings,’’ or
precast integrated systems ‘‘produced in large series.’’
Since 2000, Greece has in force two codes—the seismic code EAK and the code for
reinforced concrete EKOS—which are very similar to the final version of EC8 and EC2,
respectively. For seismic design there are no disequalities between cast-in-situ and precast
structures with seismic connections. For both these types of structures the q-factors are lower
than those given by EC8. Since 1999, there is a special code for precast structures based on
the previous ENV version of the Eurocodes. For seismic design of hinged frames this code
gives a penalization of 2/3 in terms of q-factor. However, even though it is at present still
applied, this special code will be withdrawn when only the Eurocodes will be in force.
3. Measure of the Seismic Performance of Concrete Frames
3.1. Cast-In-Situ and Precast Structural Prototypes
The prototypes shown in Fig. 2 are considered, where (a) represents the typical arrangement
of a cast-in-situ monolithic frame, and (b) represents the typical arrangement of a precast
hinged frame. A span length of the beam l = 12.0 m is chosen for both the arrangements,
while two different cases are considered for the heights h of the columns. For the cast-in-situ
arrangement, a taller solution with h = 6.0 m and a lower solution with h = 5.0 m are firstly
selected. The heights h for the precast arrangement are then correspondingly chosen to
achieve the same vibration periods T of the cast-in-situ structures. The size and the
reinforcement of the columns vary for each type of frame over two levels of strengths as
indicated in Fig. 3, where the details of the cross sections are shown. Such cross sections are
proportioned in such a way that the two type of frames have approximately the same design
seismic capacity in terms of base shear strength. In addition, a minimum stirrups spacing of
3.5� is assumed and the shear reinforcement is chosen to achieve the same mechanical ratio
Seismic Design of Concrete Frames 429

ow. Combined with the two heights, the four types of frames listed in Table 1 are selected for
each arrangement, which correspond to as many levels of translatory stiffness and seismic
capacity.
The beams are proportioned for the non seismic load conditions. In the cast-in-situ
arrangement the beam has flexural stiffness much larger than the columns and its resistant
moment at the ends remains larger than the ones at the connected columns. In this way,
with negligible rotations of the joints the structural systems are reduced to a single degree
of freedom model associated with the story drift d and controlled by the behavior of the
critical sections of the columns. By assuming a total weight 2W = 2 · 180 kN acting on the
frame, the axial force on each column is Nad = W = 180 kN. This may correspond to an in
plan mesh of 12 · 15 m covered by ordinary precast roof elements with 1.7 kN/m2 of dead
loads, or to an in plan mesh of 12 · 6 m covered by a cast-in-situ floor with 4.0 kN/m2 of
dead loads. The snow live load is not considered in the seismic combination of actions.
TABLE 1 Design data of the prototypes
Type
h
[m]
Mrd
[kNm] nd nEdy
[mm]
Frd
[kN]
k’[kNm2]
kd[kN/m]
T
[sec]
1a/tall 6.00 87.3 0.06 0.11 78.0 29.1 5739 289 1.58
1a/low 5.00 87.3 0.06 0.08 54.2 34.9 5739 515 1.19
2a/tall 6.00 171.2 0.04 0.04 47.5 57.1 18418 993 0.85
2a/low 5.00 171.2 0.04 0.02 33.0 68.5 18418 1732 0.65
1b/tall 5.56 171.2 0.04 0.12 81.7 30.8 18418 289 1.58
1b/low 4.64 171.2 0.04 0.08 56.8 36.9 18418 515 1.19
2b/tall 5.25 339.8 0.03 0.04 53.4 64.7 49511 993 0.85
2b/low 4.38 339.8 0.03 0.03 37.1 77.7 49511 1732 0.65
l
h h
l
(b)(a)
FIGURE 2 Prototypes of one-story frames: (a) monolithic and cast-in-situ; (b) hinged
and precast.
300 mm
300 8φ14
450 mm
300 8φ16
TYPE 1a TYPE 1b TYPE 2a
300
600 mm
8φ20
TYPE 2b3 0
0
450 mm
8φ161st.φ8/55 1st.φ8/45 1st.φ8/45 1st.φ10/65
FIGURE 3 Cross-section details of the columns (concrete cover 25 mm + �/2).
430 F. Biondini and G. Toniolo

The principal structural and vibratory parameters are summarized in Table 1, where
[Biondini and Toniolo, 2000]:
� Mrd = Mrd(Nad) is the resistant moment of the section corresponding to the design
values of the material strengths fcd = fck / gc = 40/1.5 = 26.7 N/mm2 and fsd = fyk / gs
= 500/1.15 = 437 N/mm2;
� Frd = cMrd/h is the first order contribution of the shear force at the column base,
with c = 2 for the cast-in-situ frame and c = 1 for the precast frame (Fig. 4);
� nd = Nad/Nrd is the specific value of the design axial force Nad with respect to the
ultimate strength Nrd = Acfcd+Asfsd;
� nE = Nad/NE is the specific value of the axial action with respect to the critical load
NE @ 10k’(c/2h)2;
� dy = wyh2/3c is the first yield displacement, where the curvature wy is computed on
the cracked section with N = Nad and M = 0.75 Mrd;
� k’ is the flexural stiffness of the cracked cross-section;
� kd = 3c2 k’ / h3 - Nad / h is the traslatory stiffness of the column, inclusive of the
second order effects associated with the axial load Nad;
� T ¼ 2�ffiffiffiffiffiffiffiffiffiffim=k�
pis the first natural vibration period associated with the vibrating
mass m = W/g.
3.2. Modeling of Cyclic Behavior
The modeling techniques for nonlinear analysis of concrete structures are usually developed
in the context of finite element analysis and may refer to different levels of description
[CEB, 1996]. The more accurate modeling is developed at the material level. The structure
is subdivided in a proper number of finite elements whose characteristics are mainly
derived on the basis of the cyclic constitutive laws of the materials, concrete and steel. In
general, these models allow to accurately reproduce many aspects of experimental results,
and their use in seismic design can be very effective [Biondini, 2004]. However, due to the
high computational effort, the use of these models is not suitable when a large number of
analyses is involved, as it is usually required in probabilistic investigations aimed to
calibrate probability based design rules [Biondini and Toniolo, 2002, 2003, 2006]. In
such cases, more simplified models, characterized by a limited number of degree of
freedoms and able to catch the overall structural behavior, should be chosen.
Based on such considerations, a single degree of freedom model is adopted to
describe the behavior of the structural prototypes considered in the present investigation.
h
MV
Nadd
MV
(a)V
h
M(b)
Nd
V
ad
FIGURE 4 Traslatory behavior of (a) cast-in-situ and (b) precast columns.
Seismic Design of Concrete Frames 431

With reference to the schemes shown in Fig. 4, this model relates the story drift d to the
first order contribution F of the shear force V at the base of the columns:
V ¼ F � Nad
hd; (2)
where F = cM/h is the force evaluated on the basis of the bending momentM of the critical
sections, with c = 2 for the monolithic arrangement of Fig. 4a, and c = 1 for the hinged
arrangement of Fig. 4b, and the negative term represents the second order effect associated
with the acting axial load Nad.
The cyclic model F = F(d) is based on the model proposed by Takeda et al. [1970],
completed with a final decreasing branch as suggested by Priestley et al. [1994] for wall
elements, and applied by Biondini and Toniolo [2000], to columns in flexure. The envelope
curve of the hysteretic cycles is shown in Fig. 5. The limit points of this curve correspond
respectively to the first cracking of the critical section, to the full yielding of the reinforce-
ment, to the spalling of the concrete cover, and to the failure of the concrete confined core.
The co-ordinates (Fi, di) of the limit points i = 1, . . ., 4 are computed as described in
Biondini and Toniolo [2000, 2006].
The slope of the descending end branch after point 4 has been empirically defined as
ku = – F2 / d2 and verified a posteriori by comparing the outcome of the analysis with the
results of experimental tests. This branch represents the failure process which leads to the
collapse of the structure, due to the fall of local flexural stiffness combined with the
increasing second order effects of the vertical load.
3.3. Incremental Non-Linear Dynamic Analysis
For the types of one-story frames considered in the present study, the nonlinear dynamic
analysis refers to a single degree of freedom model based of the following motion equation:
m€dðtÞ þ c _dðtÞ þ kðdÞdðtÞ ¼ �maðtÞ; (3)
where m is the vibrating mass, c is the viscous damping coefficient (assumed equal to the
5% of the critical one), k(d) is the degrading elastoplastic stiffness, and a(t) is the ground
acceleration. The static term is given by:
1
F
d1'
4
4'
2 3
2'3'
FIGURE 5 Cyclic model.
432 F. Biondini and G. Toniolo

kðdÞdðtÞ ¼ VðdÞ ¼ FðdÞ � Nad
hdðtÞ; (4)
with F = F(d) deduced from the hysteretic model shown in Fig. 5.
The dynamic variation of the vertical loads during the earthquake is neglected. The
axial compression forces on the columns is consequently assumed equal to the static value
Nad. Moreover, since the analytical model considers only the flexural mode of failure of the
critical zones of the columns, it is assumed that shear failures and other types of failures,
such as those of joint connections, are avoided by proper capacity design.
A tangent representation of the static term V(d) = k(d)d(t) is adopted. The numerical
integration of the motion equation is performed by using the Newmark method
[Newmark, 1959] with b = 0.25 and g = 0.50 (mean acceleration method).
The incremental procedure, assumed for the definition of the ultimate capacity of the
structure, consists of the repetition, under a prescribed accelerogram a = a(t), of the
integration mentioned above, with intensities ag = ag/g increasing up to failure. Starting
from a basic value ag0, corresponding to the serviceability level of the structure, the
intensity ag is increased with small increments Dag so to catch, with adequate accuracy,
the ultimate capacity agmax of the structure, that is the ultimate response of stable vibratoryequilibrium before collapse. In the numerical analysis the collapse is pointed out by the loss
of vibratory equilibrium, with unlimited amplification of the displacements due to the
effects of the second order moments on the decreasing stiffness of the structure.
3.4. Overstrength Ratio
For a reliable calibration of the behavior factor q, a comparison shall be made between the
ultimate capacity calculated with the seismic design rules and the ultimate capacity tested on
the structure under the same seismic action. The tested capacity of the structure is assumed
to be the seismic intensity agmax at collapse obtained from the incremental dynamic analysis
procedure. The corresponding design seismic capacity agd is computed as follows:
�gd ¼ agd
g¼ qFrd
2:5S�W(5)
with:
Frd ¼ cMrd
h(6)
and where S is the soil factor and Z = Z(T) is the reduction function of the design responsespectrum:
�ðTÞ ¼ 1 for TB � T � TC
�ðTÞ ¼ TCT� 0:08q for TC � T � TD
�ðTÞ ¼ TCTDT2 � 0:08q for TD < T
: (7)
Table 2 gives the values of SZ associated to the four couple of prototypes for the soil
classes proposed by EC8. The corresponding values of the design capacity agd computedwith a behavior factor q = 4.5 are listed in Table 3.
It is worth noting the very high intrinsic design seismic capacity agd of the structureshere examined. This is due to the relevant attenuation of the vibratory response of the
Seismic Design of Concrete Frames 433

more flexible proportioning and to the large overstrength of the stiffened proportioning.
In fact, the sizes and reinforcement deduced for the columns from the non-seismic
loading conditions (wind pressure or crane actions) are normally sufficient also for the
no-collapse verification under seismic conditions. Therefore, the threshold values given
to the story drift for the serviceability limit states, under the reduced action of the more
frequent earthquakes, usually govern the design of this type of structures.
The comparison between the results agmax of the numerical analyses and the com-
puted design capacity agd is made with reference to their ratio:
� ¼ �gmax
�gd
(8)
which will be called overstength ratio. A value k =1.0 would mean coincidence of EC8
design capacity and actual tested capacity, and values k � 1.0 are expected to verify the
reliability of the design rules.
4. Modeling of Uncertainty
For the evaluation of the seismic capacity a full probabilistic procedure based on the Monte
Carlo method is applied. To this aim, the randomness of both the seismic action and the
material properties are considered, since they are the parameters which lead to the larger
variability of the response. Smaller effects come from the variability of the geometric
dimensions of the structure which are taken here as deterministic, corresponding to the
design values used in calculation. Also the mass involved in the vibratory response is taken
as deterministic. Actually, the random variability of the mass could lead to significant
effects on the response, but in the present work it has not been investigated. Statistical
independence among the random variables is also assumed.
TABLE 2 Values of the coefficient SZ of the design response spectra Type 1 of EC8
Prototype A (S = 1.00) B (S = 1.20) C (S = 1.15) D (S = 1.35) E (S = 1.40)
1/tall 0.360 0.379 0.436 0.682 0.442
1/low 0.360 0.506 0.582 0.910 0.590
2/tall 0.468 0.702 0.808 1.264 0.820
2/low 0.618 0.928 1.067 1.350 1.082
TABLE 3 EC8 design seismic capacity agd of the prototypes
Prototype A B C D E
1a/tall 0.808 0.768 0.668 0.427 0.658
1a/low 0.970 0.690 0.600 0.384 0.592
2a/tall 1.219 0.812 0.706 0.451 0.696
2a/low 1.107 0.738 0.642 0.507 0.633
1b/tall 0.855 0.813 0.707 0.451 0.696
1b/low 1.025 0.730 0.635 0.405 0.626
2b/tall 1.383 0.922 0.802 0.512 0.790
2b/low 1.256 0.837 0.728 0.575 0.718
434 F. Biondini and G. Toniolo

4.1. Randomness of the Material Properties
For concrete the randomness of the compression strength fc is modeled by a lognormal
distribution with characteristic value fck = 40 MPa (5% fractile) and standard deviation
s = 5 MPa.
For any random value fc, the limit strains, the tensile strengths, and the elastic
modulus are computed with:
fct ¼ 0:25f 2=3c (9)
fctf ¼ 1:3fct (10)
Ec ¼ 22000ðfc=10Þ0:3 (11)
"ctu ¼ fctf =Ec (12)
"c1 ¼ 0:20% (13)
"cu ¼ 0:35%: (14)
The concrete constitutive laws shown in Fig. 6a are assumed for sectional analysis at the
full yielding limit and ultimate collapse limit. The cyclic strength decay of the section at
the ultimate collapse limit is simulated by assuming the reduced strength f’c = fc/gc, with
c
f
f 'c
c
cεcuεε ε cuε∗ ∗c1 c1
cuε =ε ε /ε c1∗c1
∗cu
(a)
f
ε
s
s
y
yf '
ε = / Ey sy f
E =206000 MPas
(b)
FIGURE 6 Constitutive laws of the materials: (a) concrete and (b) steel.
Seismic Design of Concrete Frames 435
gc = 1.5. Due to the low axial load acting on the columns, the effect of confinement on the
concrete strength is not considered. The ultimate strain "�cu of the confined concrete is
computed as a function of the stirrup mechanical ratio as follows [CEB, 1985]:
"�cu ffi "cu þ 0:05!w (15)
For reinforcing steel the randomness of the yielding strength fy is modeled by a
lognormal distribution with characteristic value fyk = 500 MPa (5% fractile) and standard
deviation s = 30 MPa.
For any random value fy, the constitutive laws described in Fig. 6b are assumed for
sectional analysis at the full yielding limit and the ultimate collapse limit. The cyclic strength
decay of the section at the ultimate collapse limit is simulated by asuming the reduced strength
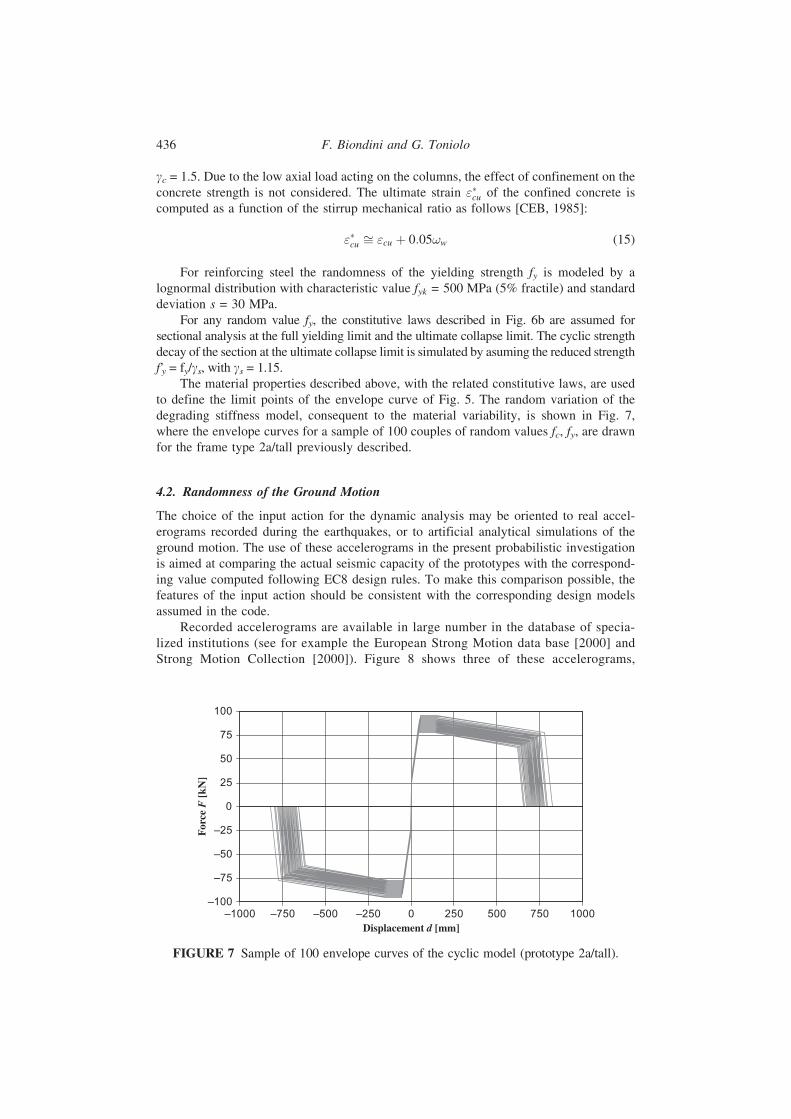
f’y = fy/gs, with gs = 1.15.The material properties described above, with the related constitutive laws, are used
to define the limit points of the envelope curve of Fig. 5. The random variation of the
degrading stiffness model, consequent to the material variability, is shown in Fig. 7,
where the envelope curves for a sample of 100 couples of random values fc, fy, are drawn
for the frame type 2a/tall previously described.
4.2. Randomness of the Ground Motion
The choice of the input action for the dynamic analysis may be oriented to real accel-
erograms recorded during the earthquakes, or to artificial analytical simulations of the
ground motion. The use of these accelerograms in the present probabilistic investigation
is aimed at comparing the actual seismic capacity of the prototypes with the correspond-
ing value computed following EC8 design rules. To make this comparison possible, the
features of the input action should be consistent with the corresponding design models
assumed in the code.
Recorded accelerograms are available in large number in the database of specia-
lized institutions (see for example the European Strong Motion data base [2000] and
Strong Motion Collection [2000]). Figure 8 shows three of these accelerograms,
–100
–75
–50
–25
0
25
50
75
100
–1000 –750 –500 –250 0 250 500 750 1000Displacement d [mm]
For
ce F
[kN
]
FIGURE 7 Sample of 100 envelope curves of the cyclic model (prototype 2a/tall).
436 F. Biondini and G. Toniolo

together with the corresponding elastic response spectra superimposed to EC8 spec-
trum for ground type A. Despite that these accelerograms have been chosen to comply
as best as possible with the target spectrum, their compliance is not sufficiently
accurate. In addition, from the whole database in Strong Motion Collection [2000],
only 65 accelerograms could be found with a reasonable minimum compliance. A
probabilistic analysis using this set of accelerograms has been attempted in Biondini
et al. [2001], but, as expected, the results showed a large scatter due to the limited
compatibility of the recorded ground motions with the response model assumed in
EC8, and the sample size was too small to allow a reliable statistical interpretation of
the results.
0.00–0.15
–0.10
–0.05
0.00
0.05
0.10
0.15
0.20
–0.15
–0.10
–0.05
0.00
0.05
0.10
0.15
0.20
10.00 20.00 30.00 40.00 50.00 60.
0.00 10.00 20.00 30.00 40.00 50.00 60.00 70.
0.00 0.40 0.80 1.20 1.60 2.00 2.40 2.80 3.20 3.60 4.0
Time (sec)
Time (sec)
Time (sec)
0.00
0.30
0.60
0.90
1.20
1.50
1.80
2.10
2.40
2.70
3.00
0.00
0.30
0.60
0.90
1.20
1.50
1.80
2.10
2.40
2.70
3.00
0.00
0.30
0.60
0.90
1.20
1.50
1.80
2.10
2.40
2.70
3.00
0.00 5.00 10.00 15.00 20.00 25.00 30.00 35.00 4.0
0.00 0.40 0.80 1.20 1.60 2.00 2.40 2.80 3.20 3.60 4.0
0.00 0.40 0.80 1.20 1.60 2.00 2.40 2.80 3.20 3.60 4.0
T(s)
T(s)
T(s)
0.25
0.20
0.15
0.10
0.05
0.00
–0.05
–0.10
–0.15
–0.20
–0.25
FIGURE 8 Sample of three recorded accelerograms a(t)/g and their elastic response
spectra Se(T)/ag [Strong Motion Collection, 2000].
Seismic Design of Concrete Frames 437

Therefore, recorded accelerograms have the following main drawbacks:
� They are in general poor of frequency content and may lead, for the same value of
the peak acceleration, to much different responses of the structure.
� They have a rough compatibility with the response spectra of the code, and lead to
additional uncertainty in the comparison with the design rule.
� They form non homogeneous sets which are not suitable for a statistical elabora-
tion of the results.
� They are of insufficient numerousness for the computation of stabilized statistical
parameters of the structural response.
On the other hand, they properly reproduce the nature of the real earthquakes.
In order to overcome the drawbacks related to the use of recorded accelerograms,
artificial accelerograms can be generated so to match with good compatibility the
response spectrum of the code [SIMQKE, 1976]. The amplitude of the generated ground
motion follows an envelope curve with random duration of its phases (initial, stationary,
and descending), as shown in Fig. 9. The present application assumes a random duration
of the strong stationary phase uniformly varying in the range 1–20 s. The signal is a
composition of many sinusoidal harmonics where any single amplitude is chosen so to
match the prescribed response spectrum along the whole range of frequencies, while the
phase is a random variable. Figure 10 shows three of these accelerograms, generated
according with the EC8 spectrum for ground type A, together with the corresponding
elastic response spectra. The compliance of these accelerograms with the target design
model is, as expected, very good.
Therefore, the main features of artificial accelerograms can be summarised as
follows:
� They are rich of frequency content with a more defined response of the structure
for a given value of the peak ground acceleration.
� They can be generated so to match with good accuracy the response spectra of the
code and allow a reliable comparative verification of its design rules.
� They may have homogeneous features, through a wide random variation of the
shape parameters, so as to allow a proper statistical elaboration of the results.
� They may give sets of numerousness large at will following the requirements of
the statistical process.
For these reasons, despite that they are not fully realistic with respect to the nature of
actual earthquakes, artificial accelerograms are used in the present investigation.
I(t)
tttt0.05
321
1.0
s30 to5s20 to1s10 to2
23
12
1
===
−−
tttt
t
FIGURE 9 Envelope shape curve of ground motion.
438 F. Biondini and G. Toniolo

5. Probabilistic Analysis
The probabilistic model is based on the material strengths with lognormal distribution and
the random sets of artificial accelerograms. A Monte Carlo simulation based on a sample
of 1,000 nonlinear analyses is carried out for each one of the five considered ground
types. The target of this analysis is to quantify the seismic capacity in terms of the
characteristic value of the peak ground acceleration of the ground motion which takes the
structure to the no-collapse limit state. The diagrams of Figs. 11–15 show the results of
these analyses in terms of overstrength ratio k as a function of the first natural vibration
period T of the structure. The five lines of each diagram refer the mean values m, to theboundaries m ± s of the standard deviation s, and to the extreme minimum and maximum
values found in the simulation process. Diagrams (a) refer to cast-in-situ monolithic
frame; diagrams (b) refer to precast hinged frames.
Moreover, as an example of the distribution features of these simulation results, Fig. 16
shows the density distributions of the overstrength ratio k for the prototype 1a/tall with
(a) ground type A and (b) ground type E. A lognormal model starting from a minimum
value kmin = m �3s represents with good accuracy these distributions and leads to the
following 5% and 10% fractiles: k0.05 = 1.13 and k0.10 = 1.18 for ground type A; k0.05 =0.79 and k0.10 = 0.85 for ground type E. Table 4 gives the maps of the corresponding
fractile values of the behavior factors q = 4.5k for all the examined cases. Finally, the
–1.0–0.8–0.6–0.4–0.20.00.20.40.60.81.0
0 5 10 15 20 25 30 35 40 45 500.0
0.5
1.0
1.5
2.0
2.5
3.0
0.0 0.5 1.0 1.5 2.0 2.5 3.0 3.5 4.0 4.5 5.0
–1.0–0.8–0.6–0.4–0.20.0
0.20.40.60.81.0
0 5 10 15 20 25 30 35 40 45 500.0
0.5
1.0
1.5
2.0
2.5
3.0
0.0 0.5 1.0 1.5 2.0 2.5 3.0 3.5 4.0 4.5 5.0
–1.0–0.8–0.6–0.4–0.20.0
0.20.40.60.81.0
0 5 10 15 20 25 30 35 40 45 500.0
0.5
1.0
1.5
2.0
2.5
3.0
0.0 0.5 1.0 1.5 2.0 2.5 3.0 3.5 4.0 4.5 5.0
a(t)
/ag
S e(T
)/a g
a(t)
/ag
S e(T
)/a g
a(t)
/ag
S e(T
)/a g
Time t T [sec]
FIGURE 10 Sample of three artificial accelerograms and their elastic response spectra.
Seismic Design of Concrete Frames 439

validity of the simulation results with respect to the sample size is highlighted by the
diagrams of Fig. 17, which allow to verify the expected convergence towards stable values
of both the mean and standard deviation of the two distributions shown in Fig. 16.
The direct comparison of the results obtained from the probabilistic analysis proves
that precast structures have the same seismic capacity of the corresponding cast-in-situ
structures, with a very high correlation varying between 93% and 99%. The results also
confirm the overall goodness of the design criteria proposed by EC8, even if a noteworthy
0.00
0.50
1.00
1.50
2.00
2.50
3.00
3.50
4.00
4.50
5.00
0.60 0.80 1.00 1.20 1.40 1.60Period T [s]
Ove
rrst
reng
th κ
Ove
rrst
reng
th κ
0.00
0.50
1.00
1.50
2.00
2.50
3.00
3.50
4.00
4.50
5.00
0.60 0.80 1.00 1.20 1.40 1.60Period T [s]
µµ ± σmin/max
µµ ± σmin/max
(a) (b)
FIGURE 11 Statistical parameters of the overstrength ratio k for a ground type A
(response spectrum type 1): (a) monolithic prototype; (b) hinged prototype.
µµ ± σmin/max
µµ ± σmin/max
0.00
0.50
1.00
1.50
2.00
2.50
3.00
3.50
4.00
4.50
5.00
0.60 0.80 1.00 1.20 1.40 1.60Period T [s]
0.00
0.50
1.00
1.50
2.00
2.50
3.00
3.50
4.00
4.50
5.00
0.60 0.80 1.00 1.20 1.40 1.60Period T [s]
(a) (b)
Ove
rrst
reng
th κ
Ove
rrst
reng
th κ
FIGURE 12 Statistical parameters of the overstrength ratio k for a ground type B
(response spectrum type 1): (a) monolithic prototype; (b) hinged prototype.
440 F. Biondini and G. Toniolo

dependency from the prescribed response spectrum is found. In addition, the analysis of
the results shows that for all ground types the overstrength systematically decreases with
the increasing of the vibration periods, down to values which are in some cases lower
than 1.0. This means that the design methods based on lump factors of force reduction are
not always reliable. They are not able to capture the dependence of plastic hysteretical
dissipation from the specific pattern of the response spectrum. Also, the correlation
µµ ± σmin/max
µµ ± σmin/max
0.00
0.50
1.00
1.50
2.00
2.50
3.00
3.50
4.00
4.50
5.00
0.60 0.80 1.00 1.20 1.40 1.60Period T [s]
(a) (b)
Ove
rrst
reng
th κ
0.00
0.50
1.00
1.50
2.00
2.50
3.00
3.50
4.00
4.50
5.00
0.60 0.80 1.00 1.20 1.40 1.60Period T [s]
Ove
rrst
reng
th κ
FIGURE 13 Statistical parameters of the overstrength ratio k for a ground type C
(response spectrum type 1): (a) monolithic prototype; (b) hinged prototype.
µµ ± σmin/max
µµ ± σmin/max
0.00
0.50
1.00
1.50
2.00
2.50
3.00
3.50
4.00
4.50
5.00
0.60 0.80 1.00 1.20 1.40 1.60Period T [s]
(a)
Ove
rrst
reng
th κ
0.00
0.50
1.00
1.50
2.00
2.50
3.00
3.50
4.00
4.50
5.00
0.60 0.80 1.00 1.20 1.40 1.60Period T [s]
(b)
Ove
rrst
reng
th κ
FIGURE 14 Statistical parameters of the overstrength ratio k for a ground type D
(response spectrum type 1): (a) monolithic prototype; (b) hinged prototype.
Seismic Design of Concrete Frames 441

µµ ± σmin/max
µµ ± σmin/max
0.00
0.50
1.00
1.50
2.00
2.50
3.00
3.50
4.00
4.50
5.00
0.60 0.80 1.00 1.20 1.40 1.60Period T [s]
(a)
Ove
rrst
reng
th κ
0.00
0.50
1.00
1.50
2.00
2.50
3.00
3.50
4.00
4.50
5.00
0.60 0.80 1.00 1.20 1.40 1.60Period T [s]
(b)
Ove
rrst
reng
th κ
FIGURE 15 Statistical parameters of the overstrength ratio k for a ground type E
(response spectrum type 1): (a) monolithic prototype; (b) hinged prototype.
0.00
0.50
1.00
1.50
2.00
Overstrength κ0.00 0.80 1.60 2.40 3.20 4.00
Prob
abili
ty D
ensi
ty f
(κ)
(a)
0.00
0.50
1.00
1.50
2.00
Overstrength κ0.00 0.80 1.60 2.40 3.20 4.00
Prob
abili
ty D
ensi
ty f
(κ)
(b)
FIGURE 16 Example of density distributions of the overstrength ratio k (prototype 1a/tall):(a) ground type A; (b) ground type E.
TABLE 4 Fractile values of the behavior factors q = 4.5k
A B C D E
Prototype q0.05 q0.10 q0.05 q0.10 q0.05 q0.10 q0.05 q0.10 q0.05 q0.10
1a/tall 5.09 5.31 3.38 3.60 3.78 4.05 4.23 4.46 3.56 3.83
1a/low 4.28 4.50 4.01 4.28 4.37 4.64 4.82 5.09 4.32 4.59
2a/tall 5.45 5.76 5.54 5.90 5.99 6.39 6.66 7.02 5.94 6.35
2a/low 6.62 6.98 6.93 7.29 7.16 7.56 6.30 6.66 7.34 7.79
1b/tall 4.91 5.13 3.24 3.47 3.60 3.87 4.05 4.32 3.47 3.69
1b/low 4.14 4.37 3.83 4.10 4.14 4.41 4.64 4.91 4.14 4.41
2b/tall 5.00 5.31 5.00 5.36 5.45 5.81 5.99 6.35 5.36 5.76
2b/low 5.99 6.30 6.26 6.57 6.44 6.80 5.67 5.99 6.62 7.02
442 F. Biondini and G. Toniolo

between the ductility factor and the behavior factor, based on the equal displacement
criterion, seems to be not fully verified.
However, with regard to these comments it is reminded that, to allow a proper
comparison of the results, the analyses for the different values of the vibratory stiffness
of the frames have been performed with the same mechanical ratio of transverse reinfor-
cement so to have the same degree of confinement of the concrete core. Starting from the
smaller section type 1a, a minimum diameter of stirrups of � = 8 mm has been taken
which leads, together with a spacing of 3.5�, to a high value ow @ 0.40 of the mechanicalratio, value which has been kept the same also for the other sections. For the larger
sections, this value is clearly not consistent with the detailing adopted in current practice
for this type of structures. Moreover, the specific values of axial force for larger sections
of the columns are rather low and not consistent with the ordinary situations. Without any
loss of validity of the results previously obtained, it is outlined that a further wider
investigation needs to be performed to cover all the field of practical applications.
6. Experimental Investigation
The experimental verification of the previous theoretical results is searched for by means
of pseudodynamic tests on full-scale structures. The pseudodynamic tests described in the
following have been performed at ELSA European Laboratory for Structural Assessment
of the Joint Research Center of the European Commission at Ispra (Italy).
6.1. Pseudodynamic Tests on Cast-In-Situ and Precast Frames
This experimental activity has been performed within the scope of the European research
project ECOLEADER (2001–2003). Two structural prototypes have been designed, both
consisting of six columns with height equal to 5.00 m, connected by two lines of beams
with span equal to 4.00 m, and an interposed slab with span equal to 3.00 m (Figs. 18 and
19). The overall size has been proportioned to the limits of the testing plant, reducing the
dimensions which do not have a relevant effect on the dynamic response (roof span and
beam length). The connections between columns and beams are made with monolithic
joints for the cast-in-situ prototype, shown in Fig. 18, and with hinged joints for the
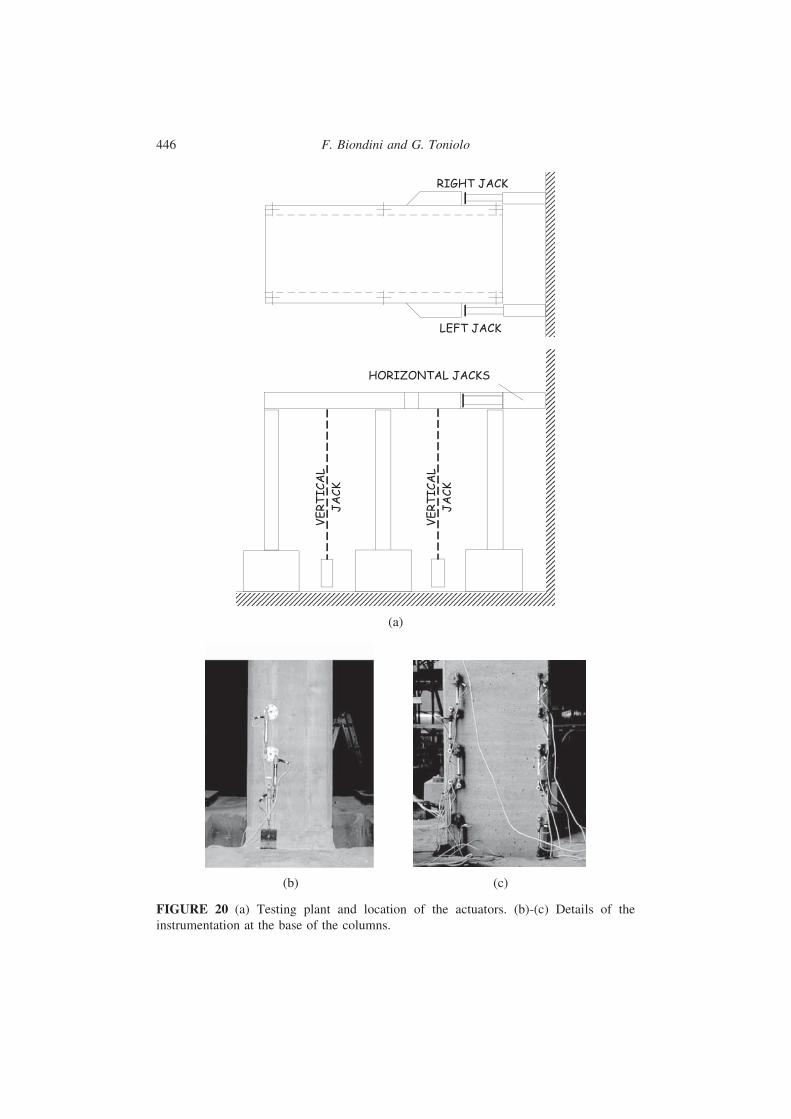
precast prototype, shown in Fig. 19. Figure 20 shows some details of the testing plant.
The cross-sections of the columns and the joints details are shown in Figs. 21 and 22,
(a) (b)
0
0.2
0.4
0.6
0.8
1
1.2
1.4
1.6
0 100 200 300 400 500 600 700 800 900 1000
Sample Size
Stat
istic
al P
aram
eter
s
Mean
Standard Deviation
Mean
Standard Deviation
0
0.2
0.4
0.6
0.8
1
1.2
1.4
1.6
0 100 200 300 400 500 600 700 800 900 1000
Sample Size
Stat
istic
al P
aram
eter
s
FIGURE 17 Evolution of the statistical parameters during the simulation process
(prototype 1a/tall): (a) ground type A; (b) ground type E.
Seismic Design of Concrete Frames 443
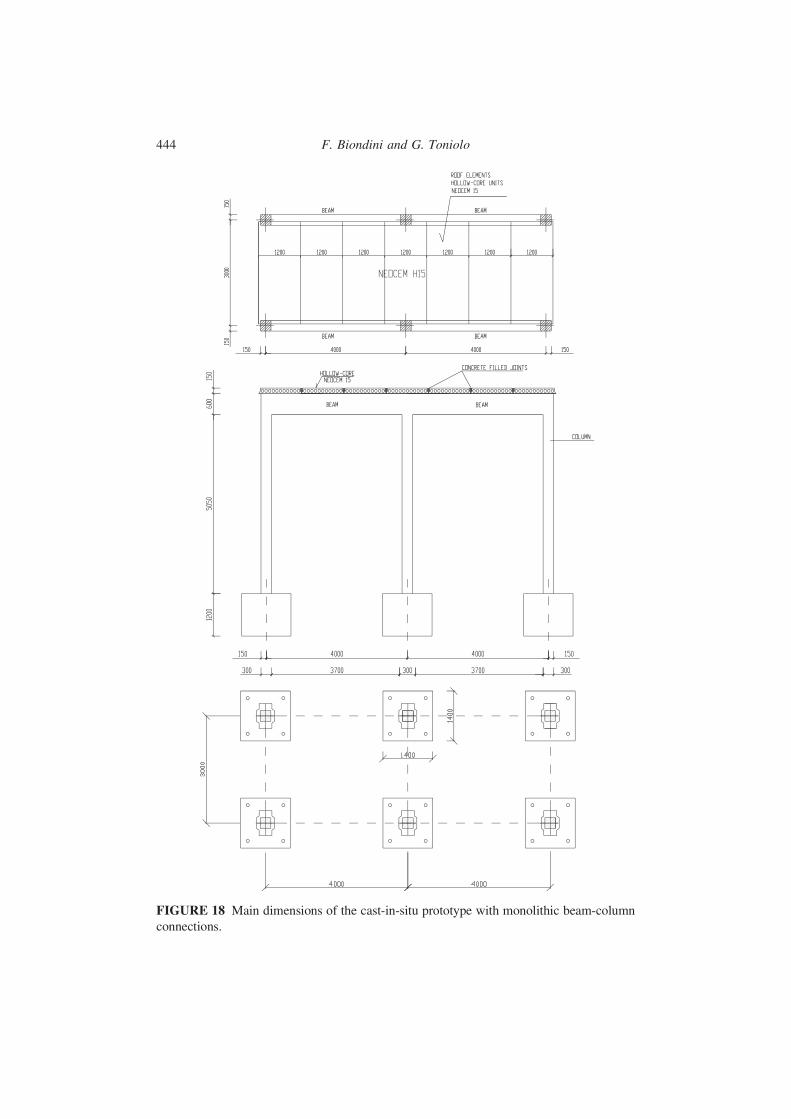
FIGURE 18 Main dimensions of the cast-in-situ prototype with monolithic beam-column
connections.
444 F. Biondini and G. Toniolo

FIGURE 19 Main dimensions of the precast prototype with hinged beam-column
connections.
Seismic Design of Concrete Frames 445
(a)
(b) (c)
FIGURE 20 (a) Testing plant and location of the actuators. (b)-(c) Details of the
instrumentation at the base of the columns.
446 F. Biondini and G. Toniolo

respectively. Steel class B500 and concrete strength class C40/50 have been used. The total
virtual weight of the deck is W = 720 kN. Such realistic weight is actually distributed as
axial actions on the columns by means of vertical jacks. The corresponding vibration period
of the frames is T = 1.02 s for the cast-in-situ arrangement, and T = 1.15 s for the precast
arrangement. The inertia forces are numerically simulated within the model governing the
pseudodynamic procedure, together with the related second order effects. More detailed
information about the testing set up can be found in Biondini et al. [2004].
The pseudodynamic test has been performed using an artificial accelerogram com-
patible with the EC8 response spectrum for ground type B (Fig. 23). Taking into account
the expected collapse limit agu, as computed by EC8 design rules, the following
three load steps have been scheduled: ag = 0.32 (0.33agu), ag = 0.64 (0.67agu), and
FIGURE 22 Joint detail for the precast prototype.
300 mm
300
8φ14
450 mm
300
8φ16
)b()a(
FIGURE 21 Cross-section of the columns for (a) cast-in-situ and (b) precast prototypes.
Seismic Design of Concrete Frames 447

ag = 0.80 (0.83agu) for the cast-in-situ frame; ag = 0.36 (0.33agu), ag = 0.72 (0.67agu), andag = 1.08 (1.00agu) for the precast frame. Figure 24 shows a view of the prototypes during
the pseudodynamic tests.
From the large set of data recorded during the test, this article reproduces only the
force-displacement diagrams referred to the horizontal displacement of the upper deck
and the total force recorded by the actuators. Such diagrams are shown in Fig. 25 for the
three levels of seismic action.
The direct comparison of the cycles shown in Fig. 25 highlights the expected large
strength resources of this type of structures against seismic collapse and confirms the
overall equivalence of the seismic behavior of precast and cast-in-situ structures. It is
worth noting that at the third level for the precast prototype (ag = 1.08), the amplitude of
the motion took the jacks to the end of stroke and the test had to be stopped. However, the
maximum displacement of 400 mm was reached without any incipient decay of the
reaction force and the cover of the critical zones of the columns was still intact. The
structural collapse was still far.
6.2. Pseudodynamic Tests on Precast Frames with Side by Side Roof Elements
This experimental activity has been performed within the scope of the European research
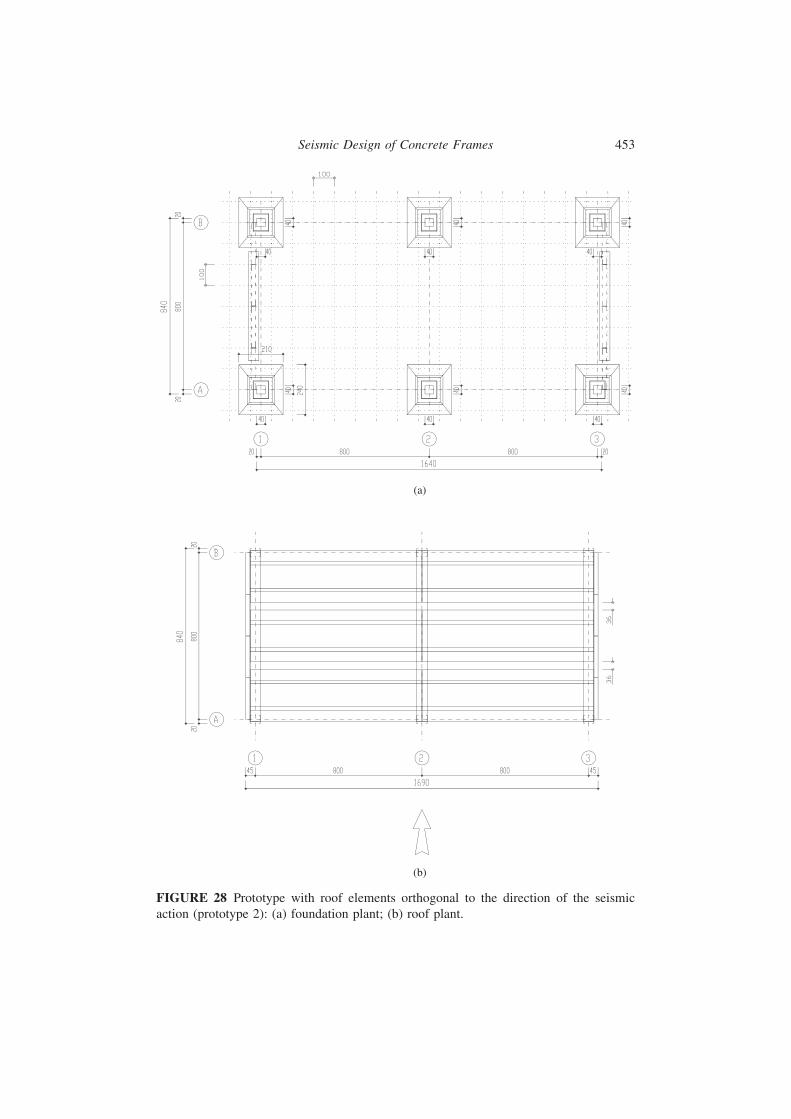
project GROWTH (2002–2006). Two prototypes have been designed to investigate the
seismic behavior of precast structures with roof elements placed side by side. These
prototypes are shown in Figs. 26–29. They are similar to the precast prototypes previously
investigated, and differ only for the orientation of the roof elements with respect to the
seismic action. The axis of the roof elements and the direction of the seismic action are
parallel in the first prototype (Figs. 26 and 27), and orthogonal in the second one (Figs. 28
and 29). In the following, for the sake of synthesis these structures are referred as prototype 1
and prototype 2, respectively.
The typical connections adopted for precast one-story frames are reproduced. The
beam-column joint connections allow the relative rotation in the plane of the beam only.
Moreover, the beam-roof joint connections allow, in each one of the four supports of the roof
elements, the relative rotation in the vertical plane parallel to the axis of the roof elements.
The dead loads are the weight of roof elements (2.94 kN/m2), beams (6.95 kN/m),
columns (4 kN/m), and test devices (8.5 kN). The corresponding axial load at the base
of the columns is: N = 178.2 kN for central columns, and N = 99.1 kN for lateral
columns of prototype 1; N = 152.1 kN for central columns, and N = 100.6 kN for lateral
columns of prototype 2.
Time t [sec] Period T [sec]
a(t)
/ag
S e(T
)/a g
–1.00
–0.75
–0.50
–0.25
0.00
0.25
0.50
0.75
1.00
0.0 5.0 10.0 15.0 20.0 25.0 30.00.0
0.5
1.0
1.5
2.0
2.5
3.0
3.5
4.0
0.0 0.5 1.0 1.5 2.0 2.5 3.0
FIGURE 23 Time-history and response spectrum of the artificial accelerogram used in
the pseudodynamic tests.
448 F. Biondini and G. Toniolo

Figure 30 shows the geometry and the reinforcement layout of the column cross-
sections. Steel class B500 and concrete strength class C40/50 have been used.
Experimental tests carried out on specimens made with the adopted materials highlighted
for concrete a cubic compressive strength varying in the range 55–56.5 MPa, with mean
value of the cylindrical strength fc = 46 MPa, and for steel a yielding strength varying in
the range 532–576 MPa, with mean value fy = 555 MPa.
(a)
(b)
FIGURE 24 A view of the prototypes during the pseudodynamic tests: (a) cast-in-situ
frame; (b) precast frame.
Seismic Design of Concrete Frames 449

The control of the pseudodynamic test is based on the two degree of freedoms
associated with the top horizontal displacements of the lateral frames, assumed to have
symmetric behavior, and of the central frame, respectively. Based on this assumption, for
prototype 1 a set of four actuators connected by spherical joints to the first and the last
roof element of each span has been used. Actuators in symmetric locations are enforced
to have the same displacements. For prototype 2, a set of two actuators, connected each
one at the midspan of the roof elements, has been used. Figure 31 shows a global view of
the two prototypes and of the corresponding testing plants. Further details on the testing
set up can be found in Ferrara et al. [2006].
The pseudodynamic tests are aimed to investigate the effectiveness of the horizontal
diaphragm action in both the configurations of the roof elements. A preliminary experi-
mental test aimed to investigate the role of lateral panels on the seismic response of
prototype 2 (Figs. 28 and 29), is performed. Actually, the two lateral supports provided by
the cladding panels, which are much stiffer than the central frame, take over most of the
horizontal force through a strong diaprhagm action which releases the central frame. The
Displacement [mm] Displacement [mm]
(a) (b)
-400
-300
-200
-100
0
100
200
300
400
-400 -300 -200 -100 0 100 200 300 400
Fo
rce
[kN
]
-400
-300
-200
-100
0
100
200
300
400
-400 -300 -200 -100 0 100 200 300 400
Fo
rce
[kN
]
-400
-300
-200
-100
0
100
200
300
400
-400 -300 -200 -100 0 100 200 300 400
Fo
rce
[kN
]
-400
-300
-200
-100
0
100
200
300
400
-400 -300 -200 -100 0 100 200 300 400
Fo
rce
[kN
]
-400
-300
-200
-100
0
100
200
300
400
-400 -300 -200 -100 0 100 200 300 400
Fo
rce
[kN
]
-400
-300
-200
-100
0
100
200
300
400
-400 -300 -200 -100 0 100 200 300 400
Fo
rce
[kN
]
ag = 0.32g ag = 0.36g
ag = 0.72gag = 0.64g
ag = 0.80g ag = 1.08g
FIGURE 25 Force-displacement diagrams of the pseudodynamic tests: (a) cast-in situ
frame; (b) precast frames.
450 F. Biondini and G. Toniolo

(a)
(b)
FIGURE 26 Prototype with roof elements parallel to the direction of the seismic action
(prototype 1): (a) foundation plant; (b) roof plant.
Seismic Design of Concrete Frames 451

results of this test, that for the sake of synthesis are not shown here, highlighted a very
high cooperation between frame and panels, with very limited cracking of the columns.
After the preliminary tests, a set of three pseudodynamic tests have been carried out
under the artificial accelerogram shown in Fig. 23 with increasing values of seismic
intensity ag = 0.14, 0.35, and 0.525. These values have been defined on the basis of the
EC8 design seismic capacity of the prototypes, computed as agu = 0.86 for prototype 1,
and agu = 0.93 for prototype 2. At the end of the pseudodynamic tests, both prototypes
have been subjected to a cyclic test under imposed displacements. The semi-amplitude of
the symmetric cycles started from the displacement limit associated with the first yielding
(a)
(b)
FIGURE 27 Prototype with roof elements parallel to the direction of the seismic action
(prototype 1): (a) frontal view; (b) lateral view.
452 F. Biondini and G. Toniolo
(a)
(b)
FIGURE 28 Prototype with roof elements orthogonal to the direction of the seismic
action (prototype 2): (a) foundation plant; (b) roof plant.
Seismic Design of Concrete Frames 453

(a)
(b)
FIGURE 29 Prototype with roof elements orthogonal to the direction of the seismic
action (prototype 2): (a) frontal view; (b) lateral view.
400 mm
400
8φ1640
φ8/75φ8/75
FIGURE 30 Geometry and reinforcement layout of the cross section of the columns.
454 F. Biondini and G. Toniolo

(a)
(b)
FIGURE 31 Global view of the prototypes and of the testing plants. Roof elements with
axis (a) parallel and (b) orthogonal to the direction of the seismic action.
Seismic Design of Concrete Frames 455

of reinforcement, approximately evaluated at the design stage as dy � 80 mm, and has
been increased by 40 mm after each sequence of three subsequent cycles up to collapse.
The measured top displacements of lateral and central columns resulted practically
coincident. Significant differences have been found only during the pseudodynamic tests
with ag = 0.525. This result confirms that double connections between beams and roof
elements (see Fig. 32) gives a rotational restraint which enables the activation of an
effective diaphragm action, even if the roof elements are not connected among them (see
Ferrara and Toniolo [2008]).
From the large set of recorded data, this article reproduces only the force-
displacement diagrams shown in Fig. 33. These diagrams refer to the total force recorded
in the actuators, and to the mean value of the displacements measured at the top of the
columns. It is worth noting that these displacements are sensibly smaller than the
corresponding displacements imposed by the actuators at the top of the roof.
The direct comparison of the cycles shown in Fig. 33 highlights the overall good
seismic behavior of both prototypes, with moderate damage and small residual deforma-
tions, at least for the first two levels of pseudodynamic tests. For the higher level, the
spalling of concrete cover with incipient buckling of the longitudinal bars placed on the
same side at the base of one central column occurred for prototype 1. This local damage
had a consequence on the global seismic behavior of the prototype during the subsequent
cyclic test. In fact, the results of this test show a non symmetric strength decay associated
with positive and negative displacements (Fig. 33.a). With this regards, as already pointed
out, it should be noted that a stirrup spacing equal 5�, as adopted for prototype 1 in thecritical zones at the base of the columns, is not sufficient to prevent the early rupture of
FIGURE 32 Detail of the double joint roof-to-beam connection.
456 F. Biondini and G. Toniolo

the buckled bars during their reloading in tension. This experimental evidence was
already noted during some cyclic tests carried out on single columns [Saisi and
Toniolo, 1998], for which the obtained results indicated a limit spacing of stirrups
equal 3.5� in order to obtain a displacement ductility of 4.5 with a stable force response.
0 0
–120
–90
–60
–30
30
60
90
120
–60 –45 –30 –15 0 15 30 45 60
–100 –75 –550 –25 0 25 50 75 100
–160 –120 –80 –40 0 40 80 120 160
–400 –300 –200 –100 0 100 200 300 400
Forc
e [k
N]
–120
–90
–60
–30
30
60
90
120
–60 –45 –30 –15 0 15 30 45 60
Forc
e [k
N]
–180
–135
–90
–45
0
45
90
135
180
Forc
e [k
N]
–100 –75 –550 –25 0 25 50 75 100–180
–135
–90
–45
0
45
90
135
180
Forc
e [k
N]
–200
–150
–100
–50
0
50
100
150
200
Forc
e [k
N]
–160 –120 –80 –40 0 40 80 120 160–200
–150
–100
–50
0
50
100
150
200
Forc
e [k
N]
–220
–165
–110
–55
0
55
110
165
220
Displacement [mm]
Forc
e [k
N]
–400 –300 –200 –100 0 100 200 300 400–220
–165
–110
–55
0
55
110
165
220
Forc
e [k
N]
Displacement [mm]
(a) (b)
ag = 0.14 g ag = 0.14 g
ag = 0.525 g ag = 0.525 g
ag = 0.35 g ag = 0.35 g
FIGURE 33 Force-displacement diagrams of the pseudodynamic tests (ag = 0.14, 0.35,
and 0.525), and of the cyclic test. Roof elements with axis (a) parallel and (b) orthogonal
to the direction of the seismic action.
Seismic Design of Concrete Frames 457
Based on these considerations, the stirrup spacing in the critical zones has been
reduced to 3.5� for prototype 2. This allowed to avoid the early failure of the compressed
bars during the pseudodynamic test with ag = 0.525, and allowed to obtain a subsequent
cyclic response more stable and characterized by higher dissipative resources (Fig. 33b).
For both prototypes a ultimate displacement du � 360 mm has been reached. With
reference to a yielding displacement dy � 80 mm, a global displacement ductility equal
4.5 is deduced, as assumed by EC8 for the behavior factor of frame systems.
6.3. Calibration of the Numerical Model
The results of the pseudodynamic tests have been used also to assess the accuracy of the
numerical model used in the dynamic analyses required by the probabilistic investigation.
A first calibration of this model has been performed with reference to the pseudodynamic
tests carried out on the first two prototypes, the cast-in-situ frame and the precast frame.
The results of this preliminary calibration showed a good accuracy of the numerical
model. Details on this calibration process can be found in Biondini and Toniolo [2003]. In
the following, the results obtained from the numerical simulation of the pseudodynamic
tests on the GROWTH precast prototypes with roof elements placed side by side are
presented [Biondini and Toniolo, 2007].
In the numerical model, the strength parameters have been introduced with their
actual mean values as tested in samples of the materials. The vibrating mass is m = 57912 kg.
Consistently with the physical behavior of the prototypes under the pseudodynamic tests
and with the control algorithm, a value c = 0 of the viscous damping has been assumed.
The limit points of the envelope curve of the hysteretic model used to evaluate the
degrading stiffness k = k(d) are defined with the previously introduced criteria. It is worth
noting that the co-ordinates of the first point, of great importance to achieve a proper
calibration of the model, have been defined by using a value of the secant elastic modulus
Ec* directly assessed on the experimental curves. By denoting Ec* = aEc, with Ec tangent
modulus evaluated as proposed by EC2, for the first two levels of the pseudodynamic
tests the values aI = 0.65 and aII = 0.40 for prototype 1, and aI = aII = 0.55 for prototype 2,have been adopted. For the third level, this point has been omitted since the critical
sections were already fully cracked. In addition, a posteriori calibration of the model
required to slightly modify the co-ordinate of the second point associated with the full
yielding force that, for all test levels, has been assumed equal to 90% and 80% of the
theoretical values for prototypes 1 and 2, respectively.
The good agreement between numerical and experimental results are shown in
Figs. 34 and 35, which give the vibration curves obtained for the three levels of
pseudodynamic tests in terms of displacements d = d(t) measured at the top of the
columns and total force F = F(t) recorded by the actuators. This comparison highlights
the effectiveness of the proposed global hysteretic model to reproduce with good
accuracy the overall structural behavior, particularly for the third level of the pseudo-
dynamic tests, which results are not affected by the large uncertainty associated with
the definition of the cracking limit point. This confirms the accuracy of the theoretical
model to evaluate the seismic capacity of the structure and, with it, the results of the
probabilistic investigation.
7. Conclusions
The seismic performance of one-story reinforced concrete structures for industrial build-
ings has been investigated. In the first part of the article it has been shown by a
458 F. Biondini and G. Toniolo

probabilistic approach that precast structures have the same seismic capacity of the
corresponding cast-in-situ structures, with a very high correlation varying between 93%
and 99%. Moreover, the value 4.5 given by EC8 to behavior factor of frame systems has
been proven to be generally appropriate, even if a noteworthy dependency from the
specific response spectrum is found. For all ground types, its value systematically
–60
–45
–30
–15
0
15
30
45
60
0 5 10 15 20 25 30 35
0 5 10 15 20 25 30 35
0 5 10 15 20 25 30 35
Dis
plac
emen
t [m
m]
–60
–45
–30
–15
15
30
45
60
0 5 10 15 20 25 30 35
Dis
plac
emen
t [m
m]
ExperimentalNumerical
0
ExperimentalNumerical
–140
–105
–70
–35
0
35
70
105
140
Dis
plac
emen
t [m
m]
0 5 10 15 20 25 30 35
0 5 10 15 20 25 30 35
–140
–105
–70
–35
0
35
70
105
140
Dis
plac
emen
t [m
m]
ExperimentalNumerical
ExperimentalNumerical
–200
–150
–100
–50
0
50
100
150
200
Time [sec]
Dis
plac
emen
t [m
m]
ExperimentalNumerical
–200
–150
–100
–50
0
50
100
150
200
Time [sec]
Dis
plac
emen
t [m
m]
ExperimentalNumerical
(a) (b)
ag = 0.14 g
ag = 0.525 g
ag = 0.35 g
ag = 0.14 g
ag = 0.525 g
ag = 0.35 g
FIGURE 34 Displacement time-histories d = d(t) for the thee levels of pseudodynamic
tests. Roof elements with axis (a) parallel and (b) orthogonal to the direction of the
seismic action.
Seismic Design of Concrete Frames 459

decreases with the increasing of the vibration period, down to values which are in some
cases lower than 4.5. This means that the design methods based on lump factors of force
reduction are not generally reliable. They are not able to capture the dependence of
plastic hysteretical dissipation from the specific pattern of the response spectrum.
However, with this regards it is reminded that, to allow a proper comparison of the
–100
–75
–50
–25
0
25
50
75
100Fo
rce
[kN
]
ExperimentalNumerical
ExperimentalNumerical
–200
–150
–100
–50
0
50
100
150
200
Forc
e [k
N]
ExperimentalNumerical
ExperimentalNumerical
–200
–150
–100
–50
0
50
100
150
200
Time [sec]
Forc
e [k
N]
ExperimentalNumerical
Time [sec]
ExperimentalNumerical
(a) (b)
ag = 0.14 g
ag = 0.525 g
ag = 0.35 g
ag = 0.14 g
ag = 0.525 g
ag = 0.35 g
0 5 10 15 20 25 30 35
0 5 10 15 20 25 30 35
0 5 10 15 20 25 30 35–200
–150
–100
–50
0
50
100
150
200
Forc
e [k
N]
0 5 10 15 20 25 30 35
–200
–150
–100
–50
0
50
100
150
200
Forc
e [k
N]
0 5 10 15 20 25 30 35
–100
–75
–50
–25
0
25
50
75
100
Forc
e [k
N]
0 5 10 15 20 25 30 35
FIGURE 35 Force time-histories F = F(t) for the thee levels of pseudodynamic tests. Roof
elements with axis (a) parallel and (b) orthogonal to the direction of the seismic action.
460 F. Biondini and G. Toniolo

results, the analyses for the different values of the vibratory stiffness of the studied frames
have been performed with the same mechanical ratio of transverse reinforcement so to
have the same degree of confinement of the concrete core. Moreover, for the larger
sections rather low values of axial force in the columns have been considered. Therefore,
without any loss of validity of the obtained results, a further wider investigation needs to
be performed to cover all the field of practical applications.
The second part of the article has been devoted to find an experimental verification
of these theoretical results by means of pseudodynamic tests on full-scale structures. The
results of these tests confirmed the overall equivalence of the seismic behavior of precast
and cast-in-situ structures. They also highlighted the good seismic performance of precast
structures with roof elements placed side by side, for which an effective horizontal
diaphragm action can be activated even if the roof elements are not connected among
them. Finally, the results of the pseudodynamic tests have been compared with those
obtained from dynamic nonlinear structural analyses, by obtaining a very good agreement
between numerical and experimental results. This successful comparison confirmed the
accuracy of the numerical model and, with it, the results of the probabilistic investigation
carried out for the calibration of the behavior factor.
In this article only the seismic capacity in terms of strength and ductility at the no-
collapse ultimate limit state (ULS) has been investigated and, to this requirement, the
behavior q-factor has been calibrated. However, it is worth noting that for the type of
structures of concern, as for other types of structures, in some conditions the damage limit
state (DLS) related to deformations might govern the structural proportioning. In such
cases, since the requirements related to both ULS and DLS have to be fulfilled with
proper separate verifications, an excess of structural strength can be achieved.
Acknowledgments
The present research has been performed within the scope of the European projects
ECOLEADER (contract No. HPRI-CT-1999-00059) and GROWTH (contract No.
G6RD-CT-2002-70002). The experimental pseudodynamic tests have been performed
at the ELSA Laboratory of the Joint Research Center of the European Commission at
Ispra (Italy) under the supervision of Dr. Paolo Negro, Dr. Georges Magonette, and Dr.
Javier Molina.
References
Biondini, F. and Toniolo, G. [2000] ‘‘Comparative analysis of the seismic response of precast and
cast-in-situ frames,’’ Studies and Researches, Graduate School for Concrete Structures,
Politecnico di Milano, 21, 1–17.
Biondini, F., Toniolo, G., and Tsionis, G. [2001] ‘‘Design reliability of cast-in-situ and precast
concrete frames under recorded earthquakes,’’ Studies and Researches, Graduate School for
Concrete Structures, Politecnico di Milano, 22.
Biondini, F. and Toniolo, G. [2002] ‘‘Probabilistic parameters of the seismic performance of
reinforced concrete frames,’’ 1st fib Congress, Paper E-228, Osaka, Japan, October 13–19.
Biondini, F. and Toniolo, G. [2003] ‘‘Seismic behaviour of concrete frames: experimental and
analytical verification of Eurocode 8 design rules,’’ fib Symposium on Concrete Structures in
Seismic Regions, Athens, Greece, May 6–9.
Biondini, F., Ferrara, L., Negro, P., and Toniolo, G. [2004] ‘‘Results of pseudodynamic test on a
prototype of precast R.C. frame,’’ International Conference on Advances in Concrete and
Structures (ICACS), Beijing-Xuzhou-Shangai, China, May 25–27.
Seismic Design of Concrete Frames 461

Biondini, F. [2004] ‘‘A three-dimensional finite beam element for multiscale damage measure and
seismic analysis of concrete structures,’’ 13th World Conference on Earthquake Engineering,
Paper No. 2963, Vancouver, B.C., Canada, August 1–6.
Biondini, F. and Toniolo, G. [2006] ‘‘Probabilistic calibration of behaviour factor for concrete
frames,’’ 2nd fib Congress, Naples, June 5–8.
Biondini, F. and Toniolo, G. [2007] ‘‘Analisi teorico-sperimentale del comportamento sismico di
strutture prefabbricate,’’ XII Convegno Nazionale L’Ingegneria Sismica in Italia (ANIDIS
2007), Pisa, June 10–14 (in Italian).
CEB. [1985] Model Code for seismic design of concrete structures. Bulletin 165.
CEB. [1996] Reinforced concrete elements under cyclic loading. State-of-the-art report. Bulletin 230.
CEN-EN 1998-1: 2004 [2004] Eurocode 8: Design of Structures for Earthquake Resistance. Part 1:
General Rules, Seismic Actions and Rules for Buildings, European Committee for
Standardization, Brussels.
European Strong Motion database. [2000] Imperial College of London-UK, SOGIN and Servizio
Sismico Nazionale-I, ENEA-I, IPSN-F.
Fajfar, P., Banovec, J., and Saje, F. [1978] ‘‘Behaviour of a prefabricated industrial building in
Breginj during the Friuli earthquake,’’ 6th European Conference on Earthquake Engineering
(ECEE) 2, 493–500, Dubrovnik, September.
Fardis, M. N. [1994] ‘‘SOA lecture: Lessons learnt in past earthquakes,’’ 10th European Conference
on Earthquake Engineering (ECEE), 1, 779–788, Vienna, Austria, August 28-September 2.
Ferrara, L., Mola, E., and Negro, P. [2006] ‘‘Cyclic test on a full scale prototype of r/c one storey
industrial building,’’ 2nd fib Congress, Naples, June 5–8.
Ferrara, L. and Toniolo, G. [2008] ‘‘Design approach for diaphragm action of roof decks in precast
concrete buildings under earthquake,’’ fib Symposium ‘‘Tailor Made Concrete Structures: New
Solutions for Our Society,’’ Amsterdam, The Netherlands, May 19–22.
Kramar, M., Fishinger, M., and Isakovic, T. [2006] ‘‘Seismic vulnerability of the EC8 designed
columns in industrial buildings,’’ 2nd fib Congress, Naples, June 5–8.
Newmark, N. M. [1959] ‘‘A method of computation for structural dynamics,’’ ASCE Journal of the
Engineering Mechanics Division 85(3), 67–94.
Park, R. and Paulay, T. [1975] Reinforced Concrete Structures, John Wiley & Sons, New York.
Priestley, M. J. N., Verma, R., and Xiao, Y. [1994] ‘‘Seismic shear strength of R.C. columns,’’
ASCE Journal of Structural Engineering 120(8), 2310–2329.
Psycaris, I. N., Mouzakis, H. P., and Carydis, P. G. [2006] ‘‘Experimental investigation of seismic
behaviour of prefabricated rc structures,’’ 2nd fib Congress, Naples, June 5–8.
Saisi, A. and Toniolo, G. [1998] ‘‘Precast r.c. columns under cyclic loading: an experimental
program oriented to EC8,’’ Studi e Ricerche, School for Concrete Structures ‘‘F.lli Pesenti,’’
Politecnico di Milano, 19, 373–414.
SIMQKE, [1976] A Program for Artificial Ground Motion Generation. User’s Manual and
Documentation, NISEE, Department of Civil Eng., Massachusetts Institute of Technology.
Strong Motion Collection [2000] National Geophysical Data Center, Boulder, Colorado.
Takeda, T., Sozen, M. A., and Nielsen, N. N. [1970] ‘‘Reinforced concrete response to simulated
earthquakes,’’ ASCE Journal of the Structural Division 96(12), 2557–2573.
462 F. Biondini and G. Toniolo