probabilistic analysis of manufacturing uncertainties...
TRANSCRIPT
1
PROBABILISTIC ANALYSIS OF MANUFACTURING
UNCERTAINTIES FOR AN AUTOMOTIVE TURBOCHARGER
CENTRIFUGAL COMPRESSOR USING NUMERICAL AND
EXPERIMENTAL METHODS
A. Javed1, E. Kamphues
Mitsubishi Turbocharger and Engine Europe BV
The Netherlands
Email: [email protected], [email protected]
T. Hartuc, R. Pecnik, J. P. van Buijtenen
Delft University of Technology
The Netherlands
Email: [email protected], [email protected], [email protected]
ABSTRACT
The compressor impellers for mass-produced turbochargers are generally die-casted and
machined to their final configuration. Manufacturing uncertainties are inherently introduced
as stochastic dimensional deviations in the impeller geometry. These deviations eventually
propagate into the compressor functionality as variability in output performance. This paper
presents a probabilistic evaluation of the impact of manufacturing uncertainties on the
compressor performance using the non-intrusive Monte Carlo method coupled with
metamodels prepared for compressor performance modeling using computational fluid
dynamics (CFD) and comprehensive experimentation. The probabilistic evaluation or the
uncertainty quantification (UQ) of manufacturing uncertainties has identified the most
sensitive and uncertain of the impeller geometric parameters contributing the most to
variability in compressor performance. Consequently, the tolerances of different impeller
dimensions can be reviewed, thereby influencing the production quality and costs.
NOMENCLATURE
1 Currently at École Polytechnique Fédérale de Lausanne (EPFL), CH-1015 Lausanne, Switzerland.
Symbols Subscripts
b Height [mm] 1 Impeller inlet
D Diameter [mm] 2 Impeller outlet
r Radius [mm] 5 Diffuser exit
R2
Coefficient of determination 7 Volute outlet
t Thickness, Tip-clearance [mm] adj Adjusted
y+ Non-dimensional distance [-] b Blade
Z Blade number [-] clr Clearance
Greek Symbols s Shroud
β Relative angle [o] t Tip
µ Mean
η Efficiency [%]
Π Pressure Ratio [-]
σ Standard Deviation
Proceedings of
11th European Conference on Turbomachinery Fluid dynamics & Thermodynamics
ETC11, March 23-27, 2015, Madrid, Spain
OPEN ACCESS
Downloaded from www.euroturbo.eu Copyright © by the Authors
2
INTRODUCTION
Manufacturing processes introduce systematic and random deviations in part geometry due to
inherent manufacturing uncertainties. These manufacturing uncertainties are the errors which can be
caused by any aspect of a manufacturing process such as geometric errors in the production
machines, wear in the cutting tools, human error, etc. The manufacturing uncertainties propagate to
part performance as an undesirable variation. Therefore, a validated quantification of the influence
of manufacturing uncertainties on part performance is valuable.
Several studies have been performed on axial turbomachinery to quantify the effects of
manufacturing uncertainties on performance using probabilistic techniques. Effects of
manufacturing tolerances on axial turbine cooling have been presented in (Bunker, 2009). A
probabilistic methodology using principal-component analysis (PCA) based blade geometry model
coupled with a quasi-2D blade-passage analysis tool has been defined in ref. (Gazron and Darmofal,
2003) to optimize compressor airfoils with 30% to 40% lower variability in efficiency. Similar
studies have been performed in ref. (Lecerf et al, 2003, Bestle et al, 2010, Kumar et al, 2008) using
a metamodel based robust optimization of axial compressor blades. However, all these case studies
have been performed on simplified 2D airfoil sections without experimental validation.
Automotive turbochargers are produced in millions every year. Such machines have miniature
dimensions and tolerance specifications compared to their larger equivalents. For a turbocharger
compressor, a number of manufacturing processes are involved in its production, all of which can
induce dimensional deviations caused by the manufacturing uncertainties. The impellers in
particular, are generally manufactured by aluminum die casting process (Sotome and Sakoda, 2007)
with subsequent machining of the raw impeller castings to their final configuration. The impeller
castings are also trimmed using appropriate machining to achieve different flow capacities and
pressure heads by removing excess material from the impeller blade tips. Manufacturing uncertainty
quantification for a turbocharger application focusing on the impeller is, therefore, very valuable
since the procedure can lead to the identification and removal of unnecessarily strict tolerances,
tolerance relaxation for difficult dimensions and an overall reduction in manufacturing costs.
METHODOLOGY
For the turbocharger compressor under focus, a three-step generic methodology has been
applied to perform the manufacturing uncertainty quantification. A parameter-wise sensitivity
evaluation is first performed to determine how the variability in an output quantity of interest is
connected to the input in a system. A sensitivity ranking is finally built to identify the most sensitive
input parameters, dominating the system response. The sensitivity analysis is followed by the UQ,
which measures the variability in the output caused by the presence of stochastic uncertainties in the
inputs. The non-intrusive Monte Carlo method (Hurtado and Barbat, 1998) has been used for
uncertainty propagation by simulating the random manufacturing uncertainties. Statistical
evaluation of the output performance is performed to determine the output mean and variability
either as standard deviation or variance. Finally the analysis of variance (ANOVA) identifies the
most uncertain input parameters by decomposing the variance in a measured outcome to the input
sources. Suitable experimental information is required for validating the outcomes from a model in
order to achieve a reasonable assurance of its predictive accuracy. As a final step, the computational
UQ has been experimentally validated by testing a selected number of impellers on a turbocharger
test bench at Mitsubishi Turbocharger and Engine Europe BV (MTEE).
TURBOCHARGER COMPRESSOR TEST CASE
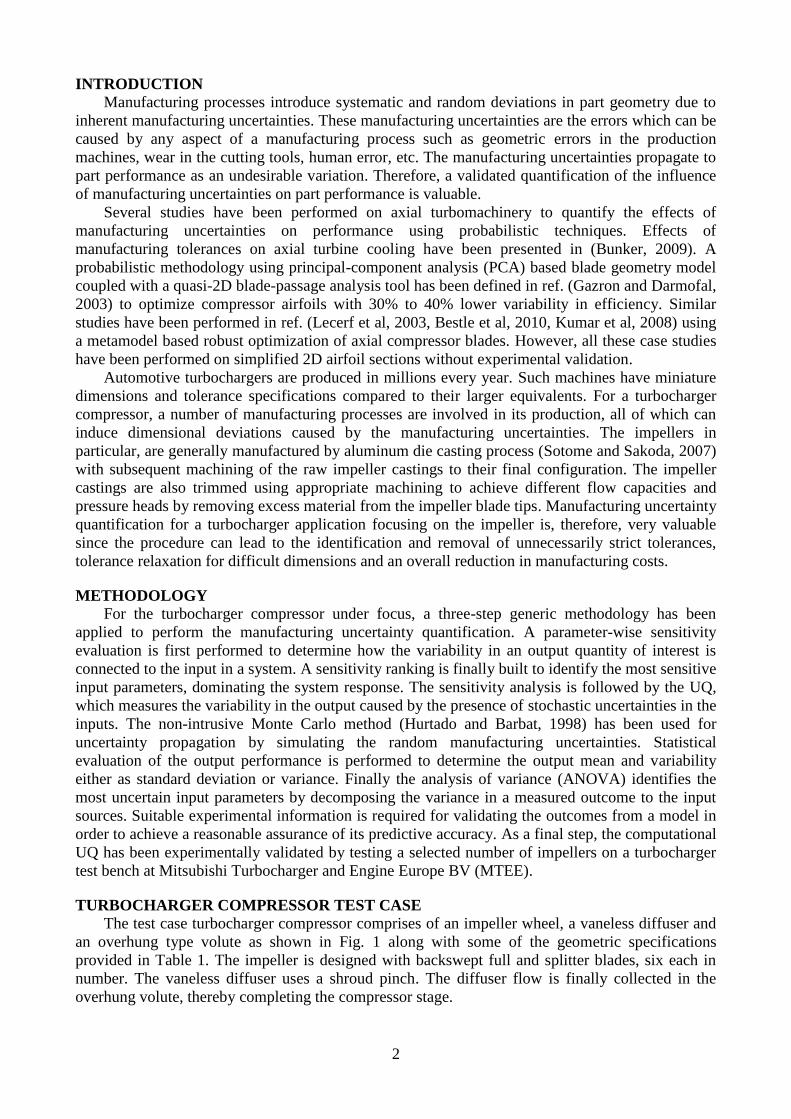
The test case turbocharger compressor comprises of an impeller wheel, a vaneless diffuser and
an overhung type volute as shown in Fig. 1 along with some of the geometric specifications
provided in Table 1. The impeller is designed with backswept full and splitter blades, six each in
number. The vaneless diffuser uses a shroud pinch. The diffuser flow is finally collected in the
overhung volute, thereby completing the compressor stage.
3
Generally, the operating or dynamic tip-
clearance is smaller than the stationary tip-
clearance. The clearance gap between the
impeller and the shroud cover reduces due to
radial and axial displacement of the
impeller, caused by centrifugal effects and
shaft movement. For the test case
compressor, the operating tip-clearance was
unknown. Therefore, an approximated
operating tip-clearance of 6% of the impeller
tip height b2 estimated by a CFD evaluation
(Olivero et al, 2011) has been used for the
analysis.
COMPRESSOR PERFORMANCE
MODELING
In order to carry out the probabilistic
evaluation using the Monte Carlo method, a
computationally inexpensive and reasonably
accurate compressor performance model is
required. Metamodels have been constructed
therefore, through a comprehensive design
of experiments (DoE) conducted in CFD for
swift compressor performance calculations.
DoE for the Test Case Impeller
The technique of defining and investigating the possible conditions in an experiment or trial
calculations involving multiple design variables is known as DoE (Shahpar, 2004). The objective of
DoE in such a context is to generate a data that can be used to fit a metamodel, which reliably
predicts the true trends of the input-output relationship (Keane and Nair, 2005). Latin hypercube
sampling (LHS), a well-known and widely used space-filling DoE method, has been applied as the
DoE method for the test case impeller. The underlying concept of LHS sampling method is to
divide the design space into a number of bins of equal probability and generate pseudo random
samples, such that for each design variable, no two design points lie in the same bin. A total of 200
LHS designs have been employed. All the DoE samples have been parameterized and simulated in
CFD at the best-efficiency operating point, i.e., 60g/s mass flow rate at 220,000rpm rotational
speed.
Impeller Parameterization for DoE
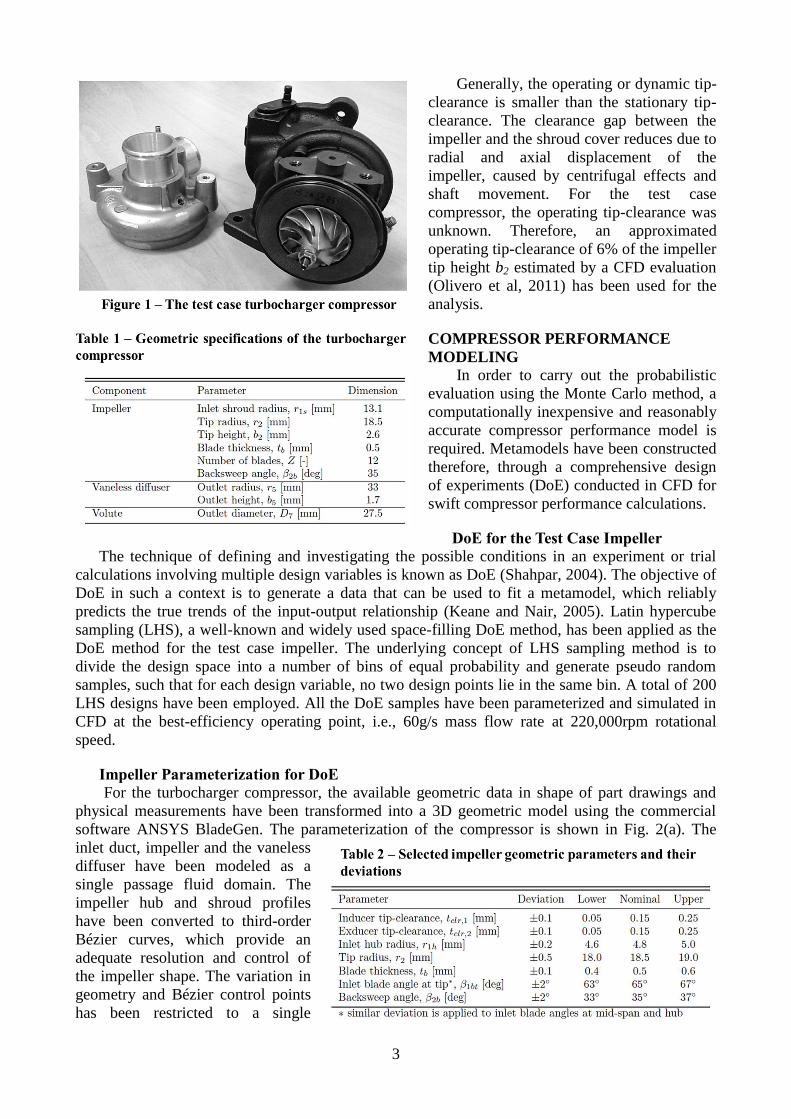
For the turbocharger compressor, the available geometric data in shape of part drawings and
physical measurements have been transformed into a 3D geometric model using the commercial
software ANSYS BladeGen. The parameterization of the compressor is shown in Fig. 2(a). The
inlet duct, impeller and the vaneless
diffuser have been modeled as a
single passage fluid domain. The
impeller hub and shroud profiles
have been converted to third-order
Bézier curves, which provide an
adequate resolution and control of
the impeller shape. The variation in
geometry and Bézier control points
has been restricted to a single
4
dimension. The blade thickness has been assumed constant from hub to shroud while the volute has
been excluded to reduce the computational expense. Seven main impeller geometric parameters
have been selected and assigned a hypothetical deviation range as given in Table 2 in order to
define the DoE design space. Manufacturing deviations introduced during impeller trimming will
ultimately vary the tip-clearance gaps between the impeller and the constant shroud cover.
Therefore, the deviations in the inlet tip radius r1t and exducer height b2 have been modeled as the
inducer tip-clearance tclr,1 and exducer tip-clearance tclr,2. The geometry of the impeller shroud cover
formed by the compressor housing has been maintained constant to focus on the influence of
manufacturing deviations in the impeller only. Finally, the impeller blade shape is controlled by the
inlet blade angles β1b and the backsweep angle β2b. The remaining blade shape is kept constant.
CFD Preprocessing and Solution Setup
Grid Processing
A 3D structured grid has been created in ANSYS TurboGrid using the H-Grid and O-Grid
topologies as illustrated in Fig. 2(c). The O-Grid topology provides a good mesh around the blades,
while rest of the passage consists of the H-Grid. The mesh at the inlet-impeller and impeller-
diffuser interfaces is conformal, i.e., the grid is shared between the two connecting surfaces at the

5
interface. The grid downstream of the impeller blades into the diffuser is also well resolved thus
facilitating a good modeling of downstream blade wakes. The near-wall mesh has been made fine
by providing sufficient number of nodes in the boundary layer region. As a result, an overall y+
approximately equal to 1 has been achieved at the wall boundaries except the TE of the blades,
where a fine near-wall mesh could not be constructed. The tip-clearance gap of 0.15mm
(approximately 6% of tip height b2) is introduced in TurboGrid by trimming down the blade shroud
profile. The number of hexahedral elements in the clearance gap has been set to 15 to capture the
clearance gap flow and associated properties.
A grid independence study has been performed at the best-efficiency operating point using three
different grid sizes of 0.25 million, 0.475 million and 0.70 million hexahedral elements. Impeller
and diffuser outlet properties including pressure ratio and efficiency have been compared for the
three grid sizes. Maximum difference in pressure ratio and isentropic efficiency has been found to
be approximately 0.18% and 0.15% respectively for the three grid sizes. Based on this marginal
variation in properties with increasing grid size, the intermediate grid of 0.475 million elements is
selected for further modeling.
Boundary Conditions
Figure 2(b) also illustrates the different boundary conditions applied to the compressor fluid
domain. Periodic boundary conditions are defined at the symmetric surfaces by assuming the fluid
properties to be periodically repetitive (especially near the best-efficiency operating point). The

6
impeller shroud has been defined as a
counter-rotating wall. The compressor
walls have been assumed to be
hydraulically smooth. At the
compressor inlet, total temperature and
total pressure of 288.15K and
101.325kPa, respectively, have been
defined, which correspond to the
International Standard Atmosphere
(ISA) ambient conditions. In addition,
a medium turbulent intensity of 5% has
been maintained at the inlet boundary
for all compressor simulations.
Different mass flow rates have been
defined at the outlet boundary
condition to simulate the compressor
speed line. However, close to choke,
where slightest variations in mass flow
can result in a considerable change in
performance, static pressure has been
defined. Finally, the interfaces between
the inlet duct, impeller and the
vaneless diffuser are defined as frozen
rotor.
Turbulence Model Selection
The widely used k-ω Shear Stress
Transport (SST) turbulence model (Menter, 1993) has been applied for the CFD simulations of the
test case turbocharger compressor.
Metamodel for the Test Case Impeller
Metamodels are constructed using the DoE data drawn from high-fidelity models, and provide
fast approximations of the function values at new design points. Many kinds of metamodels are
available. For this study, the polynomial response surface model (Meyers and Montgomery, 1995)
has been selected as the metamodel for impeller performance prediction.
Two quadratic response surface models, each for the impeller pressure ratio and isentropic
efficiency were constructed over the DoE responses. To check the model fit, coefficient of
correlation R2 and the adjusted R
2adj statistical tests are used. With 200 LHS designs the response
surface for the pressure ratio resulted in R2 and R
2adj to be 0.989 and 0.975 respectively. This
indicates that the model can capture about 98.9% and 97.5% of the variability respectively in
predicting new observations. For the impeller efficiency response surface, R2 and R
2adj are 0.977
and 0.945 respectively, which also reveals that the model can mimic 97.7% and 94.5% of the
variability respectively in predicting new observations. The high values for the coefficient of
correlations from 0.9 to 1.0 indicate a good model fit.
Figure 3 shows a comparison between the outcomes from the two response surface models
constructed for different sample sizes, and compared with the corresponding CFD data. The hub
radius r1h has been excluded from the analysis due to its negligible influence on impeller
performance. Interestingly, as the number of DoE samples increases from 60 to a maximum of 200,
the predictions made by response surface models gradually improve in accuracy. As convergence is
achieved, the response surface models have successfully emulated the CFD data and are now
capable to predict impeller performance at new observations.

7
SENSITIVITY ANALYSIS AND PARAMETER-WISE RANKING
In addition to presenting the metamodel convergence, Fig. 3 also illustrates the sensitivity of
impeller pressure ratio and isentropic efficiency as a function of different geometric parameters.
The results have been used to determine the sensitivity derivatives ∂q/∂ξ for each input parameter
by calculating the ratio of the total variation in the output quantity of interest q to the total deviation
in the input ξ for the predefined deviation range given in Table 2. Figure 4 summarizes the impeller
pressure ratio and isentropic efficiency sensitivities as percentages. Evidently, the inducer tip-
clearance tclr,1 and the exducer tip-clearance tclr,2 are contributing the most to impeller performance
variation, while blade thickness tb and tip radius r2 are also sensitive geometric parameters. In
comparison, the remaining geometric parameters have a marginal influence on impeller
performance. Therefore, based on the sensitivity ranking, the inducer tip-clearance tclr,1, exducer tip-
clearance tclr,2, along with the blade thickness tb and the tip radius r2 have been selected for further
analyses as the most sensitive impeller geometric parameters.
MANUFACURING UNCERTAINTY QUANTIFICATION To propagate the manufacturing uncertainties using Monte Carlo method, suitable tolerances
have been defined for the sensitive geometric parameters as given in Table 3. Actual manufacturing
tolerances for the impeller cannot be disclosed due to confidentiality. Uniform probability
distribution has been assumed for defining the input parameter variability. It is the simplest type in
which all the quantities of a random input variable occur with equal probability. As a consequence,
the computed results can be considered as conservative estimates of the actual predictions. A total
of hundred thousand Monte Carlo samples have been simulated using the metamodels. The results
have been used to calculate the mean μ and standard deviation σ of impeller pressure ratio and
isentropic efficiency. The impeller pressure ratio and isentropic efficiency exhibit normal or
Gaussian probability distributions as shown in Fig 5. The mean and standard deviation of impeller
pressure ratio are 2.69 and 0.055, respectively, while the mean and standard deviation of impeller

8
isentropic efficiency are 81.11% and 0.81, respectively. The resulting variation in pressure ratio
ranges approximately from 2.53 to 2.85, while isentropic efficiency ranges from 78.69% to 85.53%,
equally covering ±3σ normal distributions.
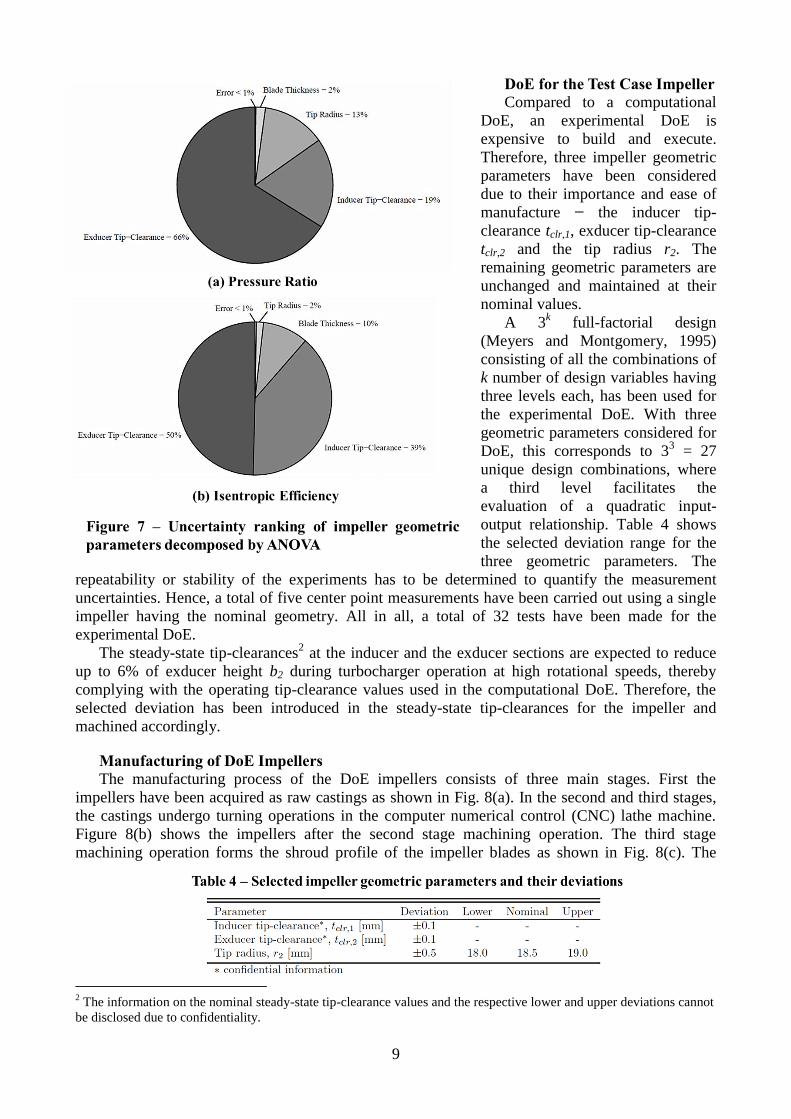
The data from the Monte Carlo simulation has been used to perform the analysis of variance
(ANOVA) to identify the most uncertain impeller geometric parameters. Figure 6 shows the scatter
plots of impeller performance variation. The impeller pressure ratio and isentropic efficiency,
predicted by their respective response surface models, have been plotted against the sensitive
impeller geometric parameters. Consider Fig. 6(a), which shows the impeller performance scatter
for blade thickness tb. For a fixed value of tb, the scatter observed in impeller performance is being
caused by the uncertainty introduced from the rest of the geometric parameters. The plot hence
shows that the uncertainty in impeller performance is large, but the contribution of tb to this
uncertainty is insignificant. In comparison, the scatter plot given in Fig. 6(d) for exducer tip-
clearance tclr,2 shows a large contribution of the geometric parameter to uncertainty in impeller
performance. The sum of squares due to regression SSR, partitioned for each of the impeller
geometric parameters, and the sum of squares due to error SSE have been used to evaluate and rank
the sources of variance. Uncertainty ranking of impeller geometric parameters is shown in Fig. 7.
The inducer tip-clearance tclr,1 and the exducer tip-clearance tclr,2 are contributing the most to
impeller performance uncertainty. The tip radius r2 has more influence on uncertainty in pressure
ratio, while having a marginal contribution to uncertainty in impeller isentropic efficiency.
Conversely, uncertainty in impeller pressure ratio has a marginal contribution from tb, while it has a
considerable influence on uncertainty in impeller isentropic efficiency. Lastly, the sum of squares
due to error SSE related to model fit has a negligible impact on overall performance uncertainty.
ANOVA has suggested that tclr,1 and tclr,2 are the most critical parameters due to their considerable
influence on overall impeller performance.
EXPERIMENTAL VALIDATION
The computational UQ has been validated through a comprehensive experimentation at MTEE
turbocharger testing facility.
9
DoE for the Test Case Impeller
Compared to a computational
DoE, an experimental DoE is
expensive to build and execute.
Therefore, three impeller geometric
parameters have been considered
due to their importance and ease of
manufacture − the inducer tip-
clearance tclr,1, exducer tip-clearance
tclr,2 and the tip radius r2. The
remaining geometric parameters are
unchanged and maintained at their
nominal values.
A 3k full-factorial design
(Meyers and Montgomery, 1995)
consisting of all the combinations of
k number of design variables having
three levels each, has been used for
the experimental DoE. With three
geometric parameters considered for
DoE, this corresponds to 33 = 27
unique design combinations, where
a third level facilitates the
evaluation of a quadratic input-
output relationship. Table 4 shows
the selected deviation range for the
three geometric parameters. The
repeatability or stability of the experiments has to be determined to quantify the measurement
uncertainties. Hence, a total of five center point measurements have been carried out using a single
impeller having the nominal geometry. All in all, a total of 32 tests have been made for the
experimental DoE.
The steady-state tip-clearances2 at the inducer and the exducer sections are expected to reduce
up to 6% of exducer height b2 during turbocharger operation at high rotational speeds, thereby
complying with the operating tip-clearance values used in the computational DoE. Therefore, the
selected deviation has been introduced in the steady-state tip-clearances for the impeller and
machined accordingly.
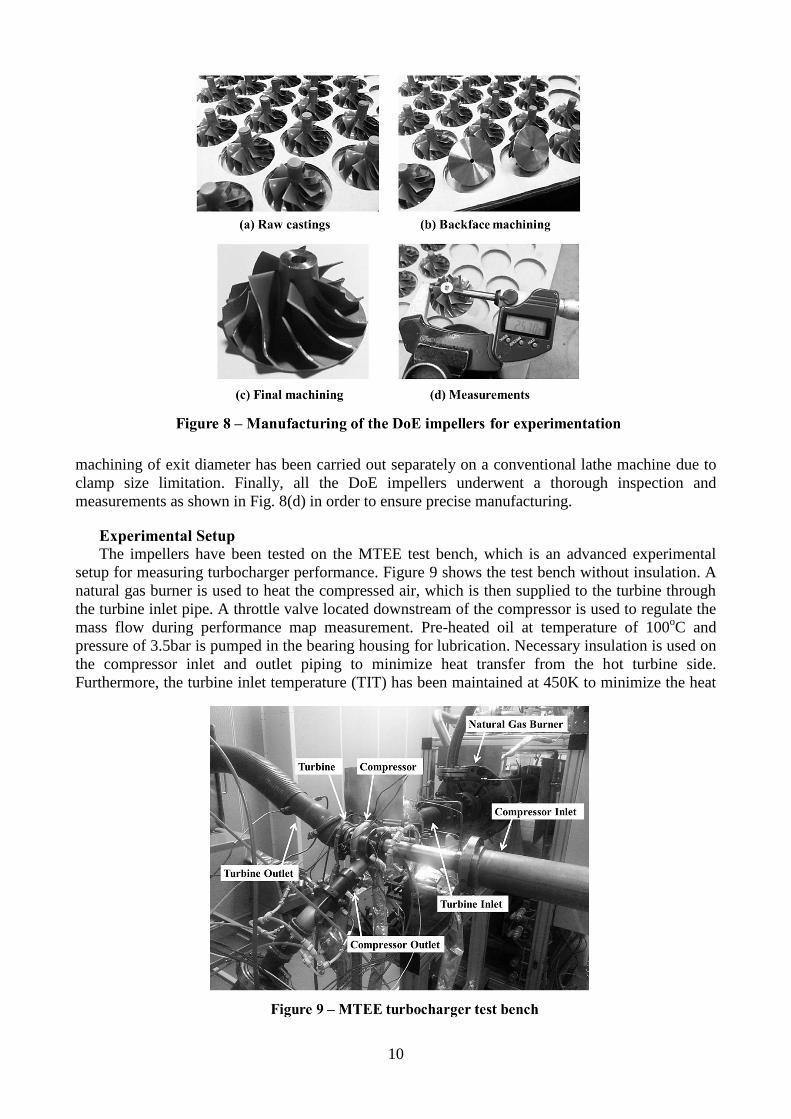
Manufacturing of DoE Impellers
The manufacturing process of the DoE impellers consists of three main stages. First the
impellers have been acquired as raw castings as shown in Fig. 8(a). In the second and third stages,
the castings undergo turning operations in the computer numerical control (CNC) lathe machine.
Figure 8(b) shows the impellers after the second stage machining operation. The third stage
machining operation forms the shroud profile of the impeller blades as shown in Fig. 8(c). The
2 The information on the nominal steady-state tip-clearance values and the respective lower and upper deviations cannot
be disclosed due to confidentiality.
10
machining of exit diameter has been carried out separately on a conventional lathe machine due to
clamp size limitation. Finally, all the DoE impellers underwent a thorough inspection and
measurements as shown in Fig. 8(d) in order to ensure precise manufacturing.
Experimental Setup
The impellers have been tested on the MTEE test bench, which is an advanced experimental
setup for measuring turbocharger performance. Figure 9 shows the test bench without insulation. A
natural gas burner is used to heat the compressed air, which is then supplied to the turbine through
the turbine inlet pipe. A throttle valve located downstream of the compressor is used to regulate the
mass flow during performance map measurement. Pre-heated oil at temperature of 100oC and
pressure of 3.5bar is pumped in the bearing housing for lubrication. Necessary insulation is used on
the compressor inlet and outlet piping to minimize heat transfer from the hot turbine side.
Furthermore, the turbine inlet temperature (TIT) has been maintained at 450K to minimize the heat

11
transfer effects on compressor performance. Total temperatures and static pressures are measured at
inlet and outlet stations of the turbocharger compressor, turbine and bearing housing. The sensors
are placed at locations set according to MTEE measurement standards based on recommendations
from the International Organization for Standardization (ISO). The 32 DoE impellers are installed
one by one for each test on a single bearing housing. All the tests have been performed at the best-
efficiency point and corrected to ISA ambient temperature and pressure of 288.15K and
101.325kPa, respectively.
Metamodel Construction and Evaluation
The experimental DoE responses for the compressor pressure ratio and isentropic efficiency
have been fitted with quadratic response surfaces, which act as metamodels to predict the
compressor performance at new observations. To check the usefulness of the metamodels in
predicting the correct responses, the coefficient of determination R2 and its adjusted form R
2adj have
been calculated. For the 32 impeller designs, the response surface for the pressure ratio resulted in
R2 and R
2adj of 0.987 and 0.938, respectively, while for the impeller efficiency response surface, R
2
and R2
adj are 0.985 and 0.931, respectively are achieved. The response surface models show a good
fit, since R2 and R
2adj lie in a satisfactory range of 0.9-1.0. Nonetheless, the model fit for
compressor isentropic efficiency is lower than the model fit for compressor pressure ratio.
Manufacturing Uncertainty Quantification
It is important to mention that the operating tip-clearance did not reduce to approximately 6% of
tip height b2 at the best-efficiency operating point. Following a sensitivity analysis using the test

12
data, the variation in tip-clearance between steady-state and operating turbocharger rotational
speeds was found to be marginal during the tests, thus invalidating the nominal tip-clearance values
used in the computational evaluations. To resolve this contradiction, the compressor performance
has been extrapolated with the experimental metamodels corresponding to the nominal operating
tip-clearance used in the computational evaluations. Furthermore, since the overall compressor
stage performance is measured by the MTEE test bench, the relative change in performance has
been considered for a suitable comparison between the computational and experimental outcomes.
For uncertainty propagation, a total of hundred thousand uniformly distributed Monte Carlo
samples within the deviation ranges (now assumed as tolerances) defined in Table 4 have been
evaluated using the experimental metamodels. For a comparison, similar Monte Carlo simulation
using the computational metamodel has also been performed. Figure 10 presents the probability
distributions, along with the statistical data produced by the computational and experimental
metamodel based Monte Carlo simulations. As expected, the pressure ratio variation is closely
predicted by the computational and experimental response surface models, where both are having
comparable probability distributions and standard deviations. In comparison, the correspondence
between the computational and experimental results for isentropic efficiency is rather satisfactory.
CONCLUSIONS
Comprehensive manufacturing uncertainty quantification for a micro centrifugal compressor
impeller belonging to an automotive turbocharger has been carried out using computational and
experimental methods. A versatile selection of engineering models has been used, which have been
properly assessed, integrated and applied as a unit. As a result, the impeller shroud profile has been
identified as the most critical geometric parameter. Deviations introduced in the impeller shroud
profile due to inherent manufacturing uncertainties during trimming operation influence the tip-
clearances. Accordingly, a strict tolerance has to be defined for the impeller shroud profile to
regulate these dimensional deviations and the resulting performance variation.
Few discrepancies have been found mainly due to the differences in nominal tip-clearances at
steady-state and operating turbocharger. In addition, the measurement uncertainties in the test bench
are also contributing to the overall inconsistency found between the computational and
experimental evaluations. Subsequently, these differences have been translated into the
disagreements in the metamodel assisted computational and experimental analysis of isentropic
efficiency. However, the experimental outcomes, although extrapolated, have given a good and
valuable validation to the computational methods applied for the manufacturing uncertainty
quantification of a turbocharger compressor impeller.
REFERENCES
R.S. Bunker, (2009), The Effects of Manufacturing Tolerances on Gas Turbine Cooling, ASME
Journal of Turbomachinery, Vol. 131, P 1 – 11.
V.E. Gazron, D. L. Darmofal, (2003), Impact of Geometric Variability on Axial Compressor
Performance”, ASME Journal of Turbomachinery, Vol. 125, P 692 – 703.
N. Lecerf, D. Jeannel, A. Laude, (2003), A Robust Design Methodology for High-Pressure
Compressor Throughflow Optimization, Proceedings of the ASME Turbo Expo 2003, Atlanta,
Georgia, USA, GT2003-38264.
D. Bestle, P. M. Flassig, A. K. Dutta, (2011), Robust Design of Compressor Blades in the Presence
of Manufacturing Noise, Proceedings of European Turbomachinery Conference ETC9, 2011,
Istanbul, Turkey.
A. Kumar, P. B. Nair, A. J. Keane, S. Shahpar, (2008), Robust Design using Bayesian Monte Carlo,
Int. J. Numer. Meth. Engng 2008, Vol 73, P 1497 – 1517.

13
T. Sotome, S. Sakoda, (2007), Development of Manufacturing Technology for Precision
Compressor Wheel Castings for Turbochargers, Technical Review 32, Castings and Forging
Division, Furukawa-Sky Aluminum, P. 56 - 60.
J. E. Hurtado, A. H. Barbat, (1998), Monte Carlo Techniques in Computational Stochastic
Mechanics, Archives of Computational Methods in Engineering, Vol. 5, P. 3-30.
M. Olivero, A. Javed, R. Pecnik, J. P. van Buijtenen, (2011), Study of Tip-Clearance Effects in the
Centrifugal Compressor of a Micro Turbine by Means of Numerical Simulations, Proceedings of
International Gas Turbine Congress, Osaka, Japan.
S. Shahpar, (2004), Design of Experiment, Screening and Response Surface Modeling to Minimize
the Design Cycle Time, Optimization Methods & Tools for Multi-criteria/Multidisciplinary Design,
Lecture Series 2004-07, Von Karman Institute, Brussels, Belgium.
A. J. Keane, P. B. Nair, (2005), Computational Approaches for Aerospace Design - The Pursuit of
Excellence, John Wiley and Sons Ltd.
F. R. Menter, (1993), Zonal Two-Equations k-ω Turbulence Models for Aerodynamic Flows, AIAA
93-2906, Proceedings of 24th Fluid Dynamics Conference, July 6-9 1993, Orlando, Florida.
R. H. Meyers, D. C. Montgomery, (1995), Response Surface Methodology: Process and Product
Optimization Using Designed Experiments, Wiley, New York.