probabilistic analysis of aircraft gas turbine disk life ... · pdf fileprobabilistic analysis...
TRANSCRIPT

NASA/TM--1999-107436 _-- ,_)
Probabilistic Analysis of Aircraft Gas Turbine
Disk Life and Reliability
Matthew E. Melis and Erwin V. Zaretsky
Glenn Research Center, Cleveland, Ohio
Richard August
NYMA, Inc., Brook Park, Ohio
National Aeronautics and
Space Administration
Glenn Research Center
June 1999
https://ntrs.nasa.gov/search.jsp?R=19990064381 2018-05-17T11:14:08+00:00Z

NASA Center for Aerospace Information7121 Standard Drive
Hanover, MD 21076Price Code: A03
Available from
National Technical Information Service
5285 Port Royal Road
Springfield, VA 22100Price Code: A03

PROBABILISTIC ANALYSIS OF AIRCRAFT GAS TURBINE DISK LIFE
AND RELIABILITY
Matthew E. Melis and Erwin V. ZaretskyNational Aeronautics and Space Administration
Glenn Research Center
Cleveland, Ohio 44135
and
Richard AugustNYMA, Inc.
Brook Park, Ohio 44142
ABSTRACT
Two series of low-cycle-fatigue (LCF) test data for two different groups of aircraft gas turbine
engine compressor disk geometries were reanalyzed and compared by using Weibull statistics. Both
groups of disks were manufactured from titanium (Ti-6AI-4V) alloy. A probabilistic computer code
called Probable Cause was used to predict disk life and reliability. A material-life factor A was
determined for the titanium (Ti-6AI-4V) alloy by using fatigue disk data and was applied to predict
disk life as a function of speed. A comparison was made with results from the currently used life
prediction method, which is based on crack growth rate. Applying an endurance limit to the computer
code did not significantly affect the predicted lives under engine operating conditions. Failure
location predictions correlated with experimentally observed failure locations in the LCF tests. A
reasonable correlation was obtained between the disk lives predicted by using the Probable Cause
code and those predicted by using a modified crack growth method. Both methods slightly
overpredicted life for one disk group and significantly underpredicted it for the other.
NOMENCLATURE
A material-life factor
c stress-life exponent
e Weibull slope
F probability of failure, fraction or percent
1l exponent
NASA/TM--1999-107436 1

K T constant, deg C (deg F)
L life, number of stress cycles or hr
L0. I O. l-percent life, or life at which 99.9 percent of a population survives, number of stress
cycles or hr
L 1 1-percent life, or life at which 99 percent of a population survives, number of stress cycles
or hr
LI0 lO-percent life, or life at which 90 percent of a population survives, number of stress
cycles or hr
L50 50-percent life, or life at which 50 percent of a population survives, number of stress
cycles or hr
L_ characteristic life, or life at which 63.2 percent of a population fails, number of stress
cycles or hr
m Weibull slope
N life, number of stress cycles
n number of components, elemental volumes, or bolt holes
S probability of survival, fraction or percent
T steady-state temperature, °C (°F)
AT thermal gradient, deg C (deg F)
V stressed volume, m 3 (in. 3)
X load, time, or stress
X I, X 2 fractional time at load and/or speed
NASAFFM-- 1999-107436 2

Z depth to maximum critical shear stress, m (in.)
_5 stress or strength, N/m 2 (psi)
¢5 location parameter, N/m 2 (psi)
z critical shear stress, N/m 2 (psi)
"r45 maximum shear stress, N/m 2 (psi)
Subscripts
ith component or stressed volume
tl number of components or elemental volumes
ref reference point, stress, volume, or life
sys system or component probability of survival or life
v related to stressed volume
[3 designates characteristic life or stress
INTRODUCTION
According to Coy, 1 a simplistic approach to component life and reliability would be a completely
deterministic one. That is, each component in the system would be subjected to the scrutiny of
determining its calculated stress for an assumed load in service. The calculated stress would be
compared with an allowable stress for an assumed material strength. The deterministic approach
assumes that if the material strength is greater than the applied stress, the component will not fail (i.e.,
the life will be infinite). (Stress is compared with strength by using the appropriate failure criteria,
e.g., maximum shear stress, strain energy, distortion energy, or fatigue.) The deterministic method
assumes that full and certain knowledge exists for the service conditions and the material strength.
For most aerospace applications designing for infinite life with a zero probability of component
failure would require structural size and weight that would not be compatible with aircraft and
spacecraft flight. As a result it becomes prudent to design for finite life with an acceptable risk or
NASAFFM-- 1999-107436 3

probability of failure. Hence, a more reasonable assessment of component life and reliability for
aerospace and, perhaps, nonaerospace applications is based on a probabilistic approach to design and
analysis.
A. Palmgren 2.3 in 1924 suggested a probabilistic approach to predicting the lives of machine
components and, more specifically, rolling-element bearings. On the basis of his test results he
suggested that an acceptable life be defined as that time at which 10 percent of a population of
bearings will have failed or 90 percent will have survived. He also noted that there was an apparent
size effect on life. That is, larger bearings with the same equivalent load as smaller bearings had
shorter lives than the smaller bearings.
In 1939 W. Weibull 4-6 published two papers that describe a statistical approach to determining
the strength of solids. Weibull postulated that the dispersion in material strength for a homogeneous
group of test specimens can be expressed according to the following relation:
(l)
where X = (_ and X[3 = _13 (see Appendix A).
Equation (1) relates the probability of survival S and the fracture (or rupture) strength _. When
In In (I/S) is used as the ordinate and In _ as the abscissa, fracture (and fatigue) data are assumed to
plot as a straight line. The slope (tangent) of this line is referred to as the "Weibull slope" or "Weibull
modulus" usually designated by the letter e or m. The plot itself is referred to as a "Weibull plot."
By using a Weibull plot it becomes possible to estimate a cumulative distribution of an infinite
population from an extremely small sample size. The Weibull slope is indicative of the dispersion
of the data and its density (statistical) distribution. Weibull slopes of 1,2, and 3.57 are indicative of
exponential, Raleigh, and normal (Gaussian) distributions, respectively. 7
The scatter in the data is inversely proportional to the Weibull slope. That is, the lower the value
of the Weibull slope, the larger the scatter in the data and vice versa. The Weibull slope is also liable
to statistical variation depending on the sample size (data base) making up the distribution. 8 The
smaller the sample size, the greater the statistical variation in the slope.
Weibull 4'5 related the material strength with the volume of the material subjected to stress. If we
imagine the solid to be divided in an arbitrary manner into n volume elements, the probability of
survival for the entire solid can be obtained by multiplying the individual survivabilities together asfollows:
S = S I •$2... St, (2)
where the probability of failure F is
F=I-S (3)
NASA/TM-- 1999-107436 4

Weibul145furtherrelatedtheprobabilityof survivalS, the material strength cL and the stressed
volume V, according to the following relation:
In-1 = _v.f(X)d V (4)S
where
f(X) = _" (5)
For a given probability of survival S
(6)
From Eq. (6) for the same probability of survival the components with the larger stressed volume
will have the lower strength (or shorter life). This principle was applied to successfully normalize
rolling-element fatigue life by Carter 9 and Zaretsky et al. l° This equation was also applied by
Grisaffe I J in a Weibull analysis of the bond strength of plasma-sprayed alumina coatings on stainless
steel. Grisaffe showed that the calculated mean bond shear strength decreased with increasing test
area in accordance with Eq. (6).
In 1947, G. Lundberg and A. Palmgren 12 applied Weibull analysis to the prediction of rolling-
element bearing fatigue life. The Lundberg-Palmgren theory expressedf(X) in Eq. (4) as
f(X)- zl _ (7)
where "t is the critical shear stress, N is the number of stress cycles to failure, and Z is the depth to
the maximum critical shear stress in a concentrated (Hertzian) contact. From Eqs..(4) and (7)
]N L#J k#J LzJ (8)
From Lundberg and Palmgren 12 (see Appendix B) the lives of individual stressed volumes at a
given probability of survival are summarized as follows:
(9)
NASA/TM-- 1999-107436 5
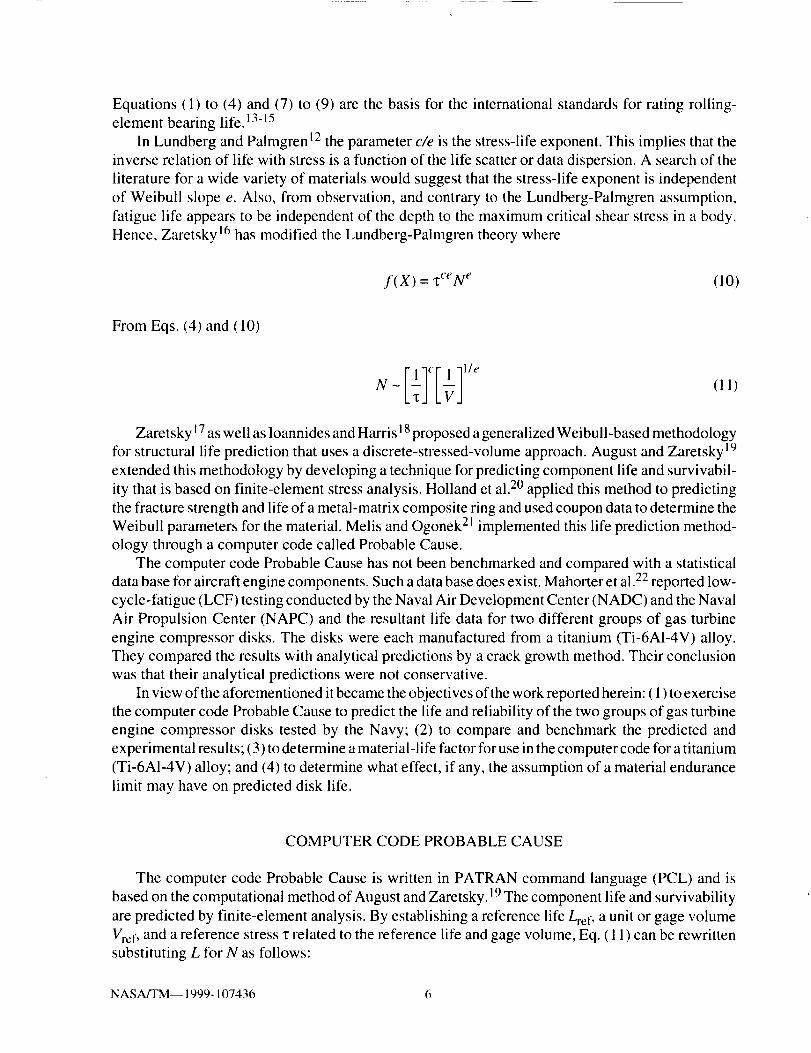
Equations (1) to (4) and (7) to (9) are the basis for the international standards for rating rolling-
element bearing life. 13-15
In Lundberg and Palmgren 12 the parameter c/e is the stress-life exponent. This implies that the
inverse relation of life with stress is a function of the life scatter or data dispersion. A search of the
literature for a wide variety of materials would suggest that the stress-life exponent is independent
of Weibull slope e. Also, from observation, and contrary to the Lundberg-Palmgren assumption,
fatigue life appears to be independent of the depth to the maximum critical shear stress in a body.
Hence, Zaretsky 16 has modified the Lundberg-Palmgren theory where
f (X) = "cceN e (10)
From Eqs. (4) and (10)
(11)
Zaretsky 17as well as Ioannides and Harris !8 proposed a generalized Weibuil-based methodology
for structural life prediction that uses a discrete-stressed-volume approach. August and Zaretsky 19
extended this methodology by developing a technique for predicting component life and survivabil-
ity that is based on finite-element stress analysis. Holland et al. 2° applied this method to predicting
the fracture strength and life of a metal-matrix composite ring and used coupon data to determine the
Weibull parameters for the material. Melis and Ogonek 21 implemented this life prediction method-
ology through a computer code called Probable Cause.
The computer code Probable Cause has not been benchmarked and compared with a statistical
data base for aircraft engine components. Such a data base does exist. Mahorter et al. 22 reported low-
cycle-fatigue (LCF) testing conducted by the Naval Air Development Center (NADC) and the Naval
Air Propulsion Center (NAPC) and the resultant life data for two different groups of gas turbine
engine compressor disks. The disks were each manufactured from a titanium (Ti-6AI-4V) alloy.
They compared the results with analytical predictions by a crack growth method. Their conclusion
was that their analytical predictions were not conservative.
In view of the aforementioned it became the objectives of the work reported herein: ( 1) to exercise
the computer code Probable Cause to predict the life and reliability of the two groups of gas turbine
engine compressor disks tested by the Navy; (2) to compare and benchmark the predicted and
experimental results; (3) to determine a material-life factor for use in the computer code for a titanium
(Ti-6AI-4V) alloy; and (4) to determine what effect, if any, the assumption of a material endurance
limit may have on predicted disk life.
COMPUTER CODE PROBABLE CAUSE
The computer code Probable Cause is written in PATRAN command language (PCL) and is
based on the computational method of August and Zaretsky. 19The component life and survivability
are predicted by finite-element analysis. By establishing a reference life Lret,, a unit or gage volume
Vrel-, and a reference stress "_related to the reference life and gage volume, Eq. ( 1 1) can be rewritten
substituting L for N as follows:
NASA/TM-- 1999- 107436 6
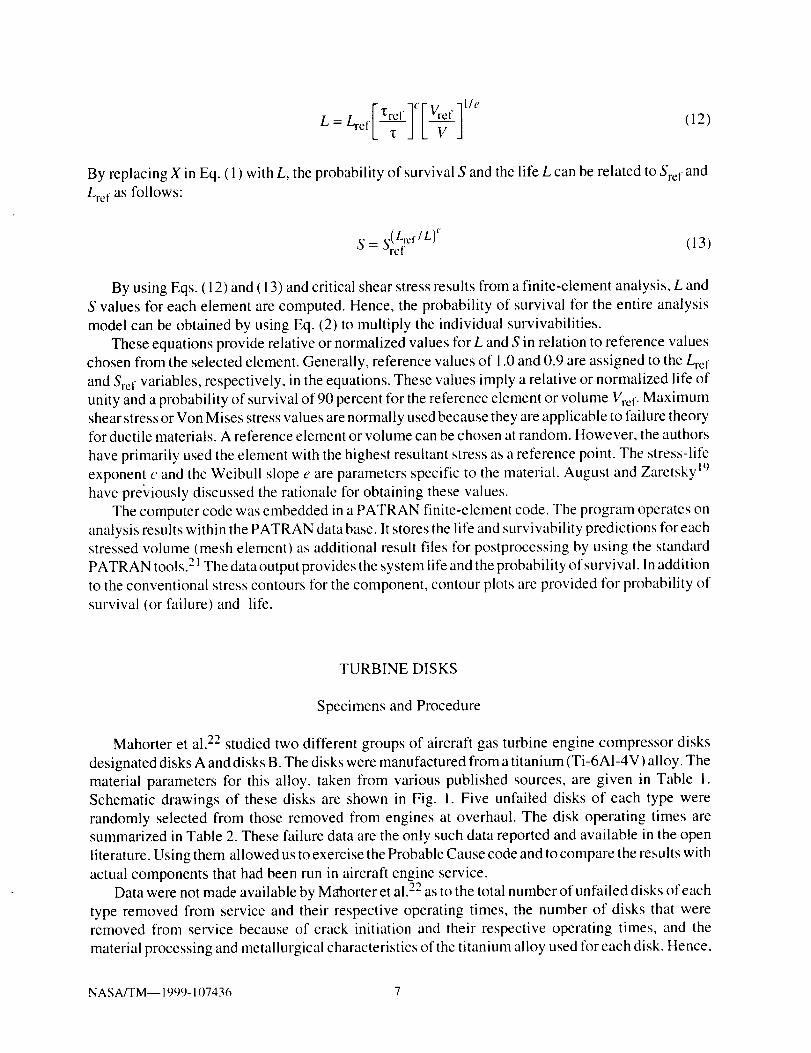
. FTrcf IcFVref I ifeL= " fL-7-J LT-J (12)
By replacing X in Eq. ( 1) with L, the probability of survival S and the life L can be related to Sre f and
Lre f as follows:
S = _(Lref/L)e_'ref ( 13 )
By using Eqs. (12) and (13) and critical shear stress results from a finite-element analysis, L and
S values for each element are computed. Hence, the probability of survival for the entire analysis
model can be obtained by using Eq. (2) to multiply the individual survivabilities.
These equations provide relative or normalized values for L and S in relation to reference values
chosen from the selected element. Generally, reference values of 1.0 and 0.9 are assigned to the Lre f
and Sre f variables, respectively, in the equations. These values imply a relative or normalized life of
unity and a probability of survival of 90 percent for the reference element or volume Vre f. Maximum
shear stress or Von Mises stress values are normally used because they are applicable to failure theory
for ductile materials. A reference element or volume can be chosen at random. However, the authors
have primarily used the element with the highest resultant stress as a reference point. The stress-life
exponent c and the Weibull slope e are parameters specific to the material. August and Zaretsky 19
have previously discussed the rationale for obtaining these values.
The computer code was embedded in a PATRAN finite-element code. The program operates on
analysis results within the PATRAN data base. It stores the life and survivability predictions for each
stressed volume (mesh element) as additional result files for postprocessing by using the standard
PATRAN tools. 21 The data output provides the system life and the probability of survival. In addition
to the conventional stress contours for the component, contour plots are provided for probability of
survival (or failure) and life.
TURBINE DISKS
Specimens and Procedure
Mahorter et al. 22 studied two different groups of aircraft gas turbine engine compressor disks
designated disks A and disks B. The disks were manufactured from a titanium (Ti-6A1-4V) alloy. The
material parameters for this alloy, taken from various published sources, are given in Table 1.
Schematic drawings of these disks are shown in Fig. I. Five unfailed disks of each type were
randomly selected from those removed from engines at overhaul. The disk operating times are
summarized in Table 2. These failure data are the only such data reported and available in the open
literature. Using them allowed us to exercise the Probable Cause code and to compare the results with
actual components that had been run in aircraft engine service.
Data were not made available by M_orter et al. 22 as to the total number of unfailed disks of each
type removed from service and their respective operating times, the number of disks that were
removed from service because of crack initiation and their respective operating times, and the
material processing and metallurgical characteristics of the titanium alloy used for each disk. Hence,
NASA/TM-- 1999-107436 7

we do not know the actual population size that each set of disks represents. Also not reported were
the manufacturing process and engine operating temperature for each disk. These unreported
variables can affect disk life and the accuracy of the statistical life results reported herein.
In the aircraft engine these disks operated at speeds between 11 000 and 11 800 rpm. The disks'
in-flight operating temperatures were not reported. After removal at engine overhaul these disks were
isothermally cyclic tested at a speed of 11 200 rpm in spin pits at the Naval Air Propulsion Center
(NAPC). 22 A spin pit test cycle is shown in Fig. 2. One cycle is equivalent to 1.45 flight hours for
disks A and 1.54 flight hours for disks B. The equivalent stress cycles for engine operation and for
the NAPC (spin pit) tests are given in Table 2. A failure is defined as the first occurring crack equal
to or greater than 0.7938 mm (0.03125 in.) no matter where in the disk it occurs. 22 These data were
analyzed by using the method of Johnson 8 and two-parameter Weibull analysis because of the limited
number of data points. Three-parameter Weibull analysis would estimate a running time below which
no failure would be expected to occur ( 100 percent probability of survival). (See Appendix A.) The
results of these analyses are shown in the Weibull plots of Fig. 3 and summarized in Table 2.
For aircraft engine applications and comparisons a probability of survival of 99.9 percent is used
(i.e., the operating time exceeded by 99.9 percent of the components or the time at which 0.1 percent
have failed). This time is designated as the L0.1 life. According to Mahorter et al. 22 at the L0. I life
disk retirement policy recommends either the removal or reworking of the "used disk." From Eq. (1),
where X = L, the L0. I life is calculated from the data of Fig. 3 according to the following:
1-6.9073 ]
L a (14)
Stress Analysis and Life Prediction
A NASTRAN linear static finite-element analysis (FEA) was used to predict the maximum shear
stresses 1745of the disks. The FEA model mesh of sections of disks A and B are shown in Fig. 4.
Symmetry in the disks allowed for reduced model segments to be used for analysis. Hence, disk A
was analyzed as a 60 ° segment and disk B as a 30 ° segment.
Both disks were analyzed for stress and probability of failure for two load conditions at 11 200
rpm. One condition related to disk operation in the engine under full compressor blade (rim) loading.
The second condition related to the NAPC spin tests without compressor blade (rim) loading. These
FEA maximum shear stress results for the disks are shown in Fig. 5. For these analyses the contact
(Hertz) stresses between the bolt and the bolt hole and between the blade root and the blade slot were
not considered.
For both disks a common gage or reference volume was chosen with a reference stress. Although
this volume and stress can be chosen arbitrarily, it is most efficient for calculation purposes to select
a gage volume having a high stress. For purposes of these calculations a reference volume of
2.264709x10 -l° m 3 (1.3820105×10 -5 in. 3) having a 1745 stress of 509.2 MPa (73.846 ksi) was
chosen.
A sensitivity analysis performed by Zaretsky et al. 23 os a generic rotating disk showed that the
Lj0 life was insensitive to changes in Weibull slope e greater than 2 and to stress-life exponents c
NASA/TM-- 1999-107436 8

between 7 and 13. The results of these analyses are shown in Fig. 6. From these analyses and the data
of Fig. 3 a Weibull slope of 2 was chosen for the current life analysis to represent the failure
distribution of both disks. By using fatigue data from the Aerospace Materials Handbook 24 we
calculated a stress-life exponent of 9.2 for the titanium (Ti-6A1-4V) alloy and assumed it to represent
that of the disk.
The results of these analyses showing the probability of failure and the failure location on each
disk are shown in Fig. 7. This figure suggests that for both disks and at all load conditions the bolt
holes have the highest probability of failure. All the failure locations reported by Mahorter et al. 22
for both sets of disks were bolt hole cracks. According to Mahorter et al. 22 turbine engine LCF
experience has shown that the bolt holes are the primary location of engine disk failure.
RESULTS AND DISCUSSION
Comparison of Lives
By using the method of Zaretsky 16"17,19 and the computer code Probable Cause, 2 J a life analysis
was undertaken of two different groups of aircraft gas turbine engine compressor disks lbr which
there existed fatigue data. 22 These disks were manufactured from titanium (Ti-6AI-4V) alloy. The
normalized predicted lives are summarized in Table 3(a). The disks may have been operated under
two load conditions. Life prediction for a disk under combined loading depends on the percentage
of the total operating time at each load and the individual life attainable under that load. When using
a linear damage (Palmgren-Langer-Miner) 2"25'26 rule, the predicted disk life under the combined load
conditions is as follows:
1 X I X__ + - (15)
/-sys LI /-2
Referring to Table 2, the time at each load condition was varied for both disks A and B. However,
it can be reasonably assumed, for purposes of calculation, that for disks A the time share was 18
percent under engine load conditions and 82 percent under spin pit conditions and that for disks B
the time share was 15 and 85 percent, respectively. The results of these combined load-cycle
calculations are shown in Table 3. Comparing these results qualitatively would suggest that disks A
would provide a life approximately 14 percent longer than that provided by disks B.
According to Mahorter et al. 22 "the test buildup for the compressor disks was essentially a
subsection of the compressor complete with spacers and blade." It could therefore be reasonably
assumed that the spin test loading approached or equaled the engine loading. As a result further
comparisons were made for the loaded (engine) conditions. Under these conditions the lives of disks A
would be expected to be 35 percent longer than those of disks B.
From Fig. 3 and Table 2 the L0. t and L10 lives of disks B were longer than those of disks A, but
the reverse was true for the L50 life. Unfortunately, the number of data points for both disks A and
B was not sufficient to provide statistical significance to the life differences, to the absolute life
values, or to the failure distributions (Weibull slopes) shown in Fig. 3.
NASA/TM-- 1999-107436 9
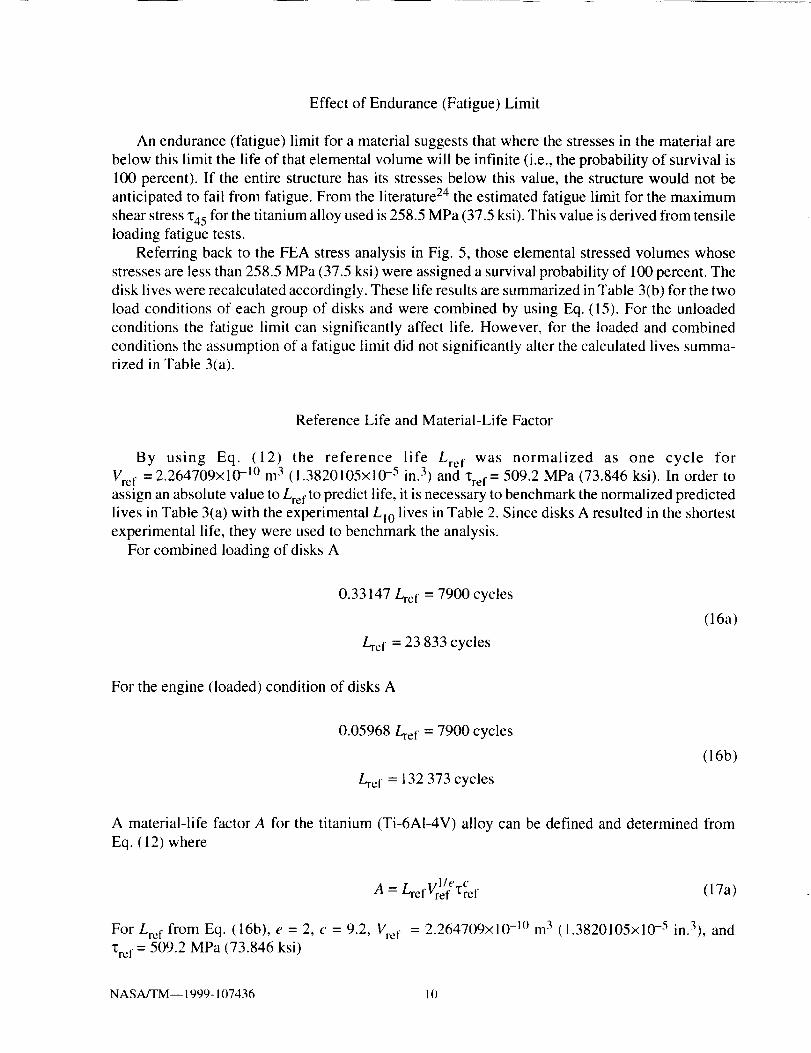
Effect of Endurance (Fatigue) Limit
An endurance (fatigue) limit for a material suggests that where the stresses in the material are
below this limit the life of that elemental volume will be infinite (i.e., the probability of survival is
100 percent). If the entire structure has its stresses below this value, the structure would not be
anticipated to fail from fatigue. From the literature 24 the estimated fatigue limit for the maximum
shear stress "t45 for the titanium alloy used is 258.5 MPa (37.5 ksi). This value is derived from tensile
loading fatigue tests.
Referring back to the FEA stress analysis in Fig. 5, those elemental stressed volumes whose
stresses are less than 258.5 MPa (37.5 ksi) were assigned a survival probability of 100 percent. The
disk lives were recalculated accordingly. These life results are summarized in Table 3(b) for the two
load conditions of each group of disks and were combined by using Eq. (15). For the unloaded
conditions the fatigue limit can significantly affect life. However, for the loaded and combined
conditions the assumption of a fatigue limit did not significantly alter the calculated lives summa-
rized in Table 3(a).
Reference Life and Material-Life Factor
By using Eq. (12) the reference life Lre f was normalized as one cycle for
Vre f = 2.264709x10 -I° m 3 (1.3820105x10 -5 in. 3) and "tref = 509.2 MPa (73.846 ksi). In order to
assign an absolute value to Lre f to predict life, it is necessary to benchmark the normalized predicted
lives in Table 3(a) with the experimental LI0 lives in Table 2. Since disks A resulted in the shortest
experimental life, they were used to benchmark the analysis.
For combined loading of disks A
0.33147 Lre f = 7900 cycles
Lre f = 23 833 cycles
(16a)
For the engine (loaded) condition of disks A
0.05968 Lre f = 7900 cycles
Lre f = t32 373 cycles
(16b)
A material-life factor A for the titanium (Ti-6AI-4V) alloy can be defined and determined from
Eq. (12) where
-- .,1/e cA = Lref Vref "[ref (17a)
For Lre f from Eq. (16b), e = 2, c = 9.2, Vre f = 2.264709x10 -I° m 3 (1.3820105x10 -5 in.3), and
'tre f = 509.2 MPa (73.846 ksi)
NASA/TM-- 1999-107436 10

IN 92 ]
A = 2.527 × 1080 cycles .] m_FfTF.9|i- .,,,,1
(International units)
lib 92 ]A = 3.024 x 1047 cycles-/in.16.----_/
I....I
(Customary units)
(17b)
From Eq. ( 1) for a Weibull slope e of 2 the L0. i life can be calculated as a function of the Li0 life asfollows:
4). I = 0.07447LI 0 (18)
By using the reference lives from Eqs. (16a) and (16b) and the computer code Probable Cause, the
absolute predicted Li0 lives in number of cycles were calculated for disks A and B at four speeds.
From the LI0 live the L0.1 lives were calculated from Eq. (18) and converted into engine hours.
These results are summarized in Table 4. The predicted L0. t lives from Table 4(b) are plotted as
a function of speed in Fig. 8 and compared with the experimental L0.1 lives from Table 2. At the lower
speeds disks B are predicted to have longer life than disks A. At the higher speeds the reverse is
predicted. This crossover appears to occur at or about 11 200 rpm. Had the Von Mises stress values
been used for this analysis the resultant lives may have been altered from those predicted by using
the maximum shear stress "t45.
Thermal and Residual Stress Effects
The analysis reported was undertaken only with those material data and operating conditions
available in the open literature. Because the disk operating temperatures were not reported, 22 we did
not consider them. That is not to imply that temperature has no effect. The temperature and resulting
temperature gradients in the disk have a two-fold effect. First, the fatigue life of a material generally
decreases with temperature. Second, thermal gradients in the disk induce thermal stresses.
Zaretsky et al. 23 present an expression for thermal effects (based on uniform, radial, linear
temperature gradients) on disk relative life as follows:
(19)
where AT is the total radial temperature difference and K 7-is a constant equal to 0.56 deg C when
ATis in degree Celsius or 1 deg F when ATis in degrees Fahrenheit and where ATis equal to or greater
than K T. Hence, if the temperature gradient in the disk is known, Eq. (19) can be used to adjust the
life prediction up or down.
NASA/TM-- 1999-107436 I I

Thebulk operatingdisk temperaturewill alsoaffectlife. In general,compressordiskoperatingtemperaturescanapproachor exceed649 °C (1200°F). Therearenoavailabledatafor thediskmaterialshowingtheeffectof bulk temperatureon fatiguelife.
Anothervariablenotconsideredandfor which informationwasnotavailablewascompressiveresidualstressespresentin thediskmaterial.Theseresidualstressescouldbepresentastheresultofeitherheattreatmentor shotpeening.Accordingly,thecompressiveresidualstressescanreducetheeffectiveshearstressesandthusincreaselife. Thesedataarealsonotavailable.
The effectsof temperature,thermalstresses,andresidualstresseson the accuracyof the lifepredictionsandthedeterminationof thematerial-lifefactorA may or may not be significant to the
work reported herein. Since for approximately 15 to 20 percent of the time the disks were run at
elevated temperatures in the engine, the value of A as it applies to ambient (room) temperature
conditions may be too low. However, at elevated conditions the value of A may be to high.
The effect of residual stresses may be relatively the same at both room temperature and elevated
temperatures. Thermal stresses were not present at room temperature in the spin pit tests. At ambient
(room) temperature the residual stresses will increase life relative to the same material withoutresidual stresses.
Crack Growth Life Prediction Method
The currently used analytical life prediction method is based on material crack propagation rates
at the highest stress point in the structure. The time for an initial flaw size to reach a defined length
or size determines the mean or average life of the structure.
Mahoner et al.22 did not report what this initial flaw size was assumed to be but defined the initial
crack length to failure as being equal to or greater than 0.7938 mm (0.03125 in.). The logic in
choosing this crack length is that it is the smallest that can be detected by current state-of-the-art
inspection techniques.
It is assumed that the density distribution about the log of the mean life prediction is normal (or
Gaussian). Accordingly, a 3_ deviation about the log of the mean life results in an L0.1 (99.9 percent
probability of survival) life prediction.
For the compressor disk the bolt holes are the highly stressed area and are the location where
Mahorter et al. 22 assumed crack initiation to occur. They detected no cracks in the blade slot area
of disks A. Mahorter et al. 22 calculated disk life for only a single bolt hole location and did not
consider multiple bolt hole locations. Their calculated L0.1 lives are summarized in Table 5. Wemodified the NAPC-predicted lives 22 by using Eq. (9) to account for the entire number of bolt holes
in each disk, where Eq. (9) (see Appendix B) can be written as follows:
L
Lsy s (n)l/e (20)
and where L is the NAPC-predicted life for disks with a single bolt hole, n is the number of bolt holes,
and e is the Weibull slope of 2. For disks A and B, n equal 12. The recalculated lives based on
Eq. (20) for disks A and B are summarized in Table 5. Comparing the L0.1 life predictions by the
modified current method with those by the Zaretsky Probable Cause method shows a reasonably
close correlation. Both methods slightly overpredicted life for disks A and significantly underpredictedlife for disks B.
NASA/TM-- 1999-107436 12

SUMMARY OFRESULTS
Two seriesof low-cycle-fatigue(LCF)testdatafor two differentgroupsof aircraftgasturbineenginecompressordiskswerereanalyzedandcomparedby usingWeibull statistics.Bothgroupsofdisks,designateddisksA anddisksB,weremanufacturedfromatitanium(Ti-6AI-4V) alloy.TestshadbeenrunbytheU.S.NavalAir PropulsionCenter(NAPC).A probabilisticcomputercodebasedon themethodsof ZaretskyandcalledProbableCausewasusedto predictdisk life andreliability.ProbableCause,which is a methodfor estimatinga component'sdesignsurvivability and life,incorporatesfinite-elementanalysisand probabilisticmaterial-lifeproperties.The analysiswasnormalizedto onesetof diskdatato obtainamaterial-lifefactorA applicable to the titanium alloy.
This material-life factor A was used with the computer code to predict disk life as a function of speed.
A comparison was made with a modified current life prediction method, which is based on crack
growth rate. The following results were obtained:
1. A reasonable correlation was obtained between the disk lives predicted by using the computer
code Probable Cause and those predicted by using a modified crack growth life prediction method.
Both methods sightly overpredicted the life tbr disks A and significantly underpredicted life for
disks B.
2. A material-life factor A based on disk fatigue data was determined for the titanium (Ti-6AI-
4V) alloy and applied to predict disk life as a function of speed. The value of A for the titanium alloy
was 2.527x10⁸° cycles • Ng2/m 16"9 (3.024x1047 cycles • ]bg-2/in.169).
3. The failure probability analysis for both disk groups predicted with reasonable engineering
certainty the failure locations at the bolt holes of each disk. These locations correlated to those
observed experimentally in the disk LCF tests.
4. Applying an endurance (fatigue) limit to the computer code Probable Cause did not
significantly affect the predicted disk lives under engine operating conditions relative to when an
endurance limit was not used in the analysis.
NASA/TM-- 1999-107436 13

APPENDIX A--DERIVATION OF WEIBULL DISTRIBUTION FUNCTION
According to Weibull 6 any distribution function can be written as
F(X) = 1- exp - If(x)]
where F(X) is the probability of an event (failure) occurring. Conversely, from the above the
probability of an event not occurring (survival) can be written as
(A1)
or
1- F(X) = exp - [f(X)] (A2a)
1 - F= exp-[f(X)] (A2b)
where F = F(X) and ( 1 - F) = S, the probability of survival.
If we have n independent components, each with a probability of the event (failure) not occurring
being ( 1 - F), the probability of the event not occurring in the combined total of all components can
be expressed from Eq. (A2b) as
1-F" =exp-[nf(X)] (A3)
Equation (A3) gives the appropriate mathematical expression for the principle of the weakest link
in a chain or, more generally, for the size effect on failures in solids. As an example of the application
of Eq. (A3), we assume a chain consisting of several links. Also, we assume that by testing we find
the probability of failure F at any load X applied to a "single" link. If we want to find the probability
of failure F, of a chain consisting of n links, we must assume that if one link has failed the whole
chain fails. In other words, if any single part of a component fails, the whole component has failed.
Accordingly, the probability of nonfailure of the chain ( 1 - F,), is equal to the probability of the
simultaneous nonfailure of all the links. Thus,
I - F, = (1 - F)" (A4a)
or
S, = S" (A4b)
Or, where the probabilities of failure (or survival) of each link are not necessarily equal (i.e.,
S]¢ S 2 ¢ S 3 _ ...), Eq. (A4b) can be expressed as
NASA/TM-- 1999-107436 14

S,, = $1 •S2' &-...
This is the same as Eq. (2) of the main text.
From Eq. (A3) for a uniform distribution of stresses throughout a volume V
F_, = I - exp - [Vf(c)]
or
(A4c)
(A5a)
S = 1- Fv = exp-[Vf(cy)] (A5b)
Equation (A5b) can be expressed as follows:
In ln[l]=lnf(cy)+lnV (a6)
It follows that if In In(l/S) is plotted as an ordinate and ln.f(_) as an abscissa in a system of
rectangular coordinates, a variation of volume V of the test specimen will imply only a parallel
displacement but no deformation of the distribution function. Weibull 4 assumed the form
and Eq. (A6) becomes
In ln[s] = mln (cY- cY,,)- mlncY!3 + In V
(A7)
(A8)
If cyt,, which is the location parameter, is assumed to be zero and V is normalized whereby In V is zero,
Eq. (A8) can be written as
(A9)
Equation (A9) is identical to Eq. ( 1) of the main text.
The form of Eq. (A9) where o_, is assumed to be zero is referred to as "two-parameter Weibull."
Where _,, is not assumed to be zero, the form of the equation is referred to as "three-parameter
Weibull." The Weibull slope or modulus m, which is also designated by e, is the slope or tangent of
the line when the equation is plotted on rectangular coordinates.
NASA/TM-- 1999-107436 15
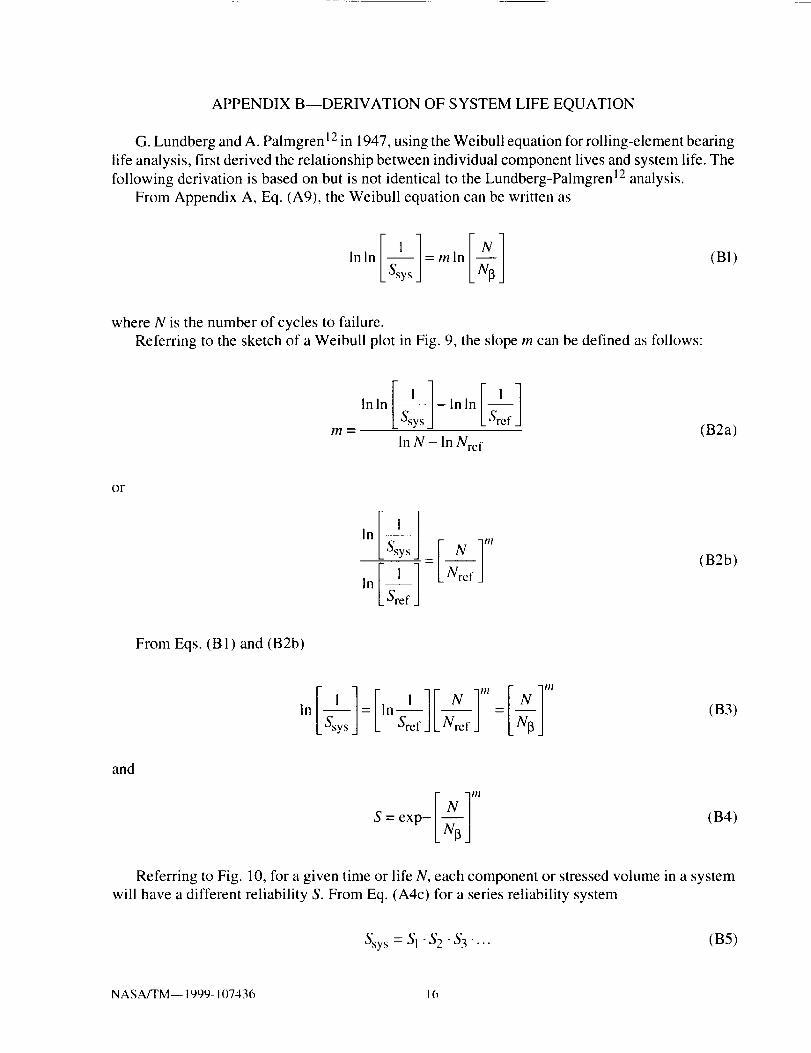
APPENDIX B--DERIVATION OF SYSTEM LIFE EQUATION
G. Lundberg and A. Palmgren 12 in 1947, using the Weibull equation for rolling-element bearing
life analysis, first derived the relationship between individual component lives and system life. The
following derivation is based on but is not identical to the Lundberg-Palmgren 12 analysis.
From Appendix A, Eq. (A9), the Weibull equation can be written as
(BI)
where N is the number of cycles to failure.
Referring to the sketch of a Weibull plot in Fig. 9, the slope m can be defined as follows:
'nln[ ]In'nEllm = (B2a)
In N - In Nre f
or
['](B2b)
From Eqs. (B l ) and (B2b)
,.[_,1 F 1"'LS_y_JL LNrefJ L_-_J(B3)
and
IN ]m
s=e×P-L_-j(B4)
Referring to Fig. 10, for a given time or life N, each component or stressed volume in a system
will have a different reliability S. From Eq. (A4c) for a series reliability system
Ssy s = S I -S 2 •$3"... (B5)
NASA/TM-- 1999- 107436 16

Combining Eqs. (B4) and (B5) gives
rNl'" IN]"'+ IN]'"+ FNI'"_×P-L_I e×P-L_,J e×P-L_-_2Je×P-L_3J
+... (B6a)
or
F_T" Jr_l"r_l rNl+te×P-L_j =e×P-[L-_-_,j+L_-_2j+L_-_f._j...(B6b)
It is assumed that the Weibull slope m is the same for all components. From Eq. (B6b)
FN]"'lr_l'"FN]"'FNI'"t-L_J =-[L_m_,J+L_-_-_2J+L_-_J+(B7a)
Factoring out N from Eq. (B7a) gives
' 1'"-['l'"I' I'"+F'l"'+_J L_--_,J+L_J L_-_-_3J' (BVb,
From Eq. (B3) the characteristic lives NI3, NI32, N!33, etc., can be replaced with the respective lives
N1, N 2, N 3, etc., at Sre f (or the lives of each component that have the same probability of survival Sre f )as follows:
1 , r,r+E,.2]rlT_ __ r__,I'"+[,n_]LWj LN,j +I,n' lI'Src f J L Nrc f J
where, in general, from Eq. (B3)
(B8)
and
[, '-F_J LNre,,
,1' e,cN_7_lJ LNiJ '
(B9a)
(B9b)
NASA/TM-- 1999- 107436 17

Factoring out In (1/Sre f) from Eq. (B8) gives
+F']'"+F'1"'+1""'L_-f2j L_--_3j ...j (B,0)
or rewriting Eq. (B 10) results in
(B]])
Substituting e as the symbol for the Weibull slope m in Eq. (B 11 ) gives Eq. (9) of the main text.
NASA/TM-- 1999-107436 18

REFERENCES
1. Coy, J.J., "System Life and Reliability," Tribologyfor Aerospace Applications, E.V. Zaretsky,
ed., STLE SP-37, Society of Tribologists and Lubrications Engineers, Park Ridge, IL,
1997, pp. 683-734.
2. Palmgren, A., "The Service Life of Ball Bearings," Zectsckr_ft des Vereines Deutscher
lngenieure, Vol. 68, No. 14, 1924, pp. 339-341.
3. Zaretsky, E.V., "A. Palmgren Revisited--A Basis for Bearing Life Prediction," Lubrication
Engineering, J. STLE, Vol. 54, No. 2, Feb. 1998, pp. 18-24.
4. Weibull, W., "A Statistical Theory of the Strength of Materials," blgeniors Vemnskaps
Akademien-Handlinger, No. 151, 1939.
5. Weibull, W., "The Phenomenon of Rupture in Solids," lngeniors Vetanskaps Akademien-
Handlinger, No. 153, 1939.
6. Weibull, W., "A Statistical Distribution Function of Wide Applicability," Trans. ASME, J.
Applied Mechanics, Vol. 18, No. 3, 1951, pp. 293-297.
7. Weibull, W., "Efficient Methods for Estimating Fatigue Life Distribution of Rolling Bearings,"
Rolling Contact Phenomena, J.B. Bidwell, ed., Elsevier, New York, pp. 252-265.
8. Johnson, L.G., The Statistical Treamlent of Fatigue Experiments, Elsevier, New York, 1964.
9. Carter, T.L., "Preliminary Studies of Rolling-Contact Fatigue Life of High-Temperature
Bearing Materials," NACA RM E57KI2, 1958.
10. Zaretsky, E.V., Anderson, W.J. and Parker, R.J., "The Effect of Contact Angle on Rolling-
Contact Fatigue and Bearing Load Capacity," ASLE Trans., Vol. 5, 1962, pp. 210-219.
11. Grisaffe, S.L., "Analysis of Shear Bond Strength of Plasma-Sprayed Alumina Coatings on
Stainless Steel, NASA TND-3113, 1965.
12. Lundberg, G., and Palmgren, A., "Dynamic Capacity of Rolling Bearings," Acta Polytechnica,
Mechanical Engineering Series, Vol. 1, No. 3, Stockholm, 1947.
13. Anon., "Load Ratings and Fatigue Life for Ball Bearings," ANSI/AFBMA Std. 9-1990, The
Anti-Friction Bearing Manufacturers Association, Washington, DC, 1990.
14. Anon., "Load Rating and Fatigue Life for Roller Bearings," ANSI/AFBMA Std. 11-1990, The
Anti-Friction Bearing Manufacturers Association, Washington, DC, 1990.
15. Anon., "Rolling Bearings. Dynamic Load Ratings and Rating Life," ISO 281-1990(E),
International Organization for Standardization, 1990.
16. Zaretsky, E.V., "Design for Life, Plan for Death," Machine Design, Vol. 66, No. 15, 1994,
pp. 55-59.
17. Zaretsky, E.V., "Fatigue Criterion to System Design, Life and Reliability," Trans. AIAA,
J. Propulsion and Power, Vol. 3, No. 1, 1987, pp. 76-83.
18. Ioannides, E., and Harris, T.A., "A New Fatigue Life Model for Rolling Bearing," Trans. ASME.
J. Tribology, Vol. 107, No. 3, 1985, pp. 367-378.
19. August, R., and Zaretsky, E.V., "Incorporating Finite Element Analysis Into Component Life
and Reliability," Trans. ASME, J. Mechanical Design, Vol. 115, No. 4, 1993, pp. 706-710.
20. Holland, F.A., Jr., Zaretsky, E.V., and Melis, M.E., "Probabilistic Failure Prediction of
SCS-6/Ti-15-3 MMC Ring, Trans. ASME, J. Mechnical Design, Vol. 120, No. 4, 1998,
pp. 714-720.
21. Melis, M.E., and Ogonek, J.A., "A Life Prediction Algorithm Implemented in P3 Using PCL,"
Paper 19, Proceedings of MSC World Users Cot!ference, MacNeal-Schwendler, Los
Angeles, 1995.
NASA/TM-- 1999-107436 19

22. Mahorter, R., London, G., Fowler, S., and Salvino J., "Life Prediction Methodology for Aircraft
Gas Turbine Engine Disks," Proceedings of A1AA, SAE, ASME, ASEE 21st Joint Propulsion
Conference, Monterey, CA, July 8-10, 1985. (AIAA Paper 85-1141, 1985.)
23. Zaretsky, E.V., Smith, T.E., and August R., "Effect of Design Variables, Temperature Gradients
and Speed on Life and Reliability of a Rotating Disk," Trans. ASME, J. Vibration, Acoustics,
Stress and Reliability in Design, Vol. 111, No. 3, 1989, pp. 311-317.
24. Anon., Aerospace Structural Materials Handbook, W.F. Brown, Jr., H. Mindlin, and C.Y. Ho,
eds., ClNDAS/USAF CRDA Handbooks Operation, Purdue University, West Lafayette, IN,1997.
25. Langer, B.F., "Fatigue Failure From Stress Cycles of Varying Amplitude," Trans. ASME, J.
Applied Mechanics, Vol. 59, 1937, pp. AI60-AI62.
26. Miner, M.A., "Cumulative Damage in Fatigue," Trans. ASME, J. Applied Mechanics, Vol. 12,
No. 3, 1945, pp. A 159-A 164.
TABLE I.--TURBINE DISK MATERIAL PARAMETERS
Material
Elastic modulus GPa (ksi)Poisson's ratio
Weibull slopeI)ensity kg/m _ (Ib/in. _ )
Stress-life exponent
"q_ fatigue limit. MPa I ksi)
Titanium (Ti-6AI-4V) alloyI 1.0 {16x I(_,_)
0.33
2
4429 (0.16)9.2
2585 (37.5)
Testdisk
TABLE 2.--SUMMARY OF LOW-CYCLE-FATIGUE ENDURANCE DATA FOR
GAS TURBINE ENGINE COMPRESSOR DISKS SUBJECTED TO BOTH
ENGINE OPERATION AND SPIN PIT TESTS
[Material. titanium (Ti-6AI-4V) ailo_': _peed, 11 200 rpm.]
Operating time, cycles:' Conunents" Experimental life,
cycles _
Loaded Unloaded
(engine (spin pit
ol0eration) tests)
Total
Disks A (Fi_. I(a))AI 1966 7 IIR) 9 066 FailedA2 2932 I I 100 14 032 Failed
A3 2779 17 I00 19879 Failed
A4 3750 21 000 24 750 Unfailed
A5 2947 33 lO(I 36 047 Failed
Disks B (Fi_. lib))BI 3437 12 I(X) 15 537 Failed
B2 2616 13 IIKI 15 716 Failed
B3 3149 16 100 19249 Failed
B4 2880 21 O(X) 23 880 UnfailedB5 2755 30 (I_X) 32 885 Unfailed
:'Data from Ref. 22.
594 7900 219(X) 1.8
5832 1360(1 19200 5.5
Weibull
slope,
hAll failures were bolt hole cracks exceeding 0.7938 nnn (0.03125 in.) (ref. 22).
_See Fig. 3 for Weibull plot of data.
NASA/TM-- 1999-107436 20

TABLE 3.--NORMALIZED PREDICTED LI__LIVES OF GAS TURBINE ENGINE
COMPRESSOR DISKS AS FUNCTION LOAD
[Material, tilanium (Ti-6AI-4V) alloy; reference stress, z4_, 509.2 MPa (73.846 ksi);
reference volume, !,"r_., , 2.264709::< 10 _'' m _( 1.3820105× 10 _ in. _): reference life,
1._,,, I cycle (normalized): disk speed, II 200 rpm: stress-life exponent, 9.2;
Weibull slope. 2: "r4,, fatigue limit, 250;.6 MPa (37.5 ksi).]
Paralllete r
Segment lift:Disk life
Time al load, percent
Combined load-cycle disk life
Ca) No t'atik_ue limil
Predicted normalized L i,_ life. cycles
60
2630.9 (I. 14618
1074.1 0.0596882 18
(I.33147
Disks A (Fi_. l(a)) [ Disks B (]:i_. lib))Unloaded ] Loaded Unloaded Loaded
Se_mem an_le, de_3O
75.118 0.15307
21.7(t49 0.(_19
85 15
0.29123
1hi Fali_ue limit
Segmenl life 8171.2 0.14673Disk life 3335.8 0.0599()
Time at load, percen! 82 18
Combined load-cycle disk life 0.33275
7692.5 0 15324
222(I.6 0.04424
85 15
0.294_0
TABLE 4.--PREI)ICTEI) L,, _ LIVES OF GAS TURBINE ENGINE
COMPRESSOR DISKSFOR ENGINE LOADS AS FUNCTION OF SPEED
[Material, titanium (Ti-6AI-4V) alloy: reference stress. "ca,. 509.2 MPa
(73.846 ksi); reference volume, V,,._, 2.264709x 10 i_, m _ ( 1.382(1105× 10 _ in. _):
stress-life exponenl. 9.2; Weibull slope, 2; faligue linfit, none assumed.]
Ca) l._,._= 23833 cycles
Speed. rpm Predicted L,, _life
Disks ,4. Disks B
Hr
3 730
7 459
I I 200
14 93(1
Cycles
3 862
963
139
16
Hr C_,cles5 6(X) 24 153
I 396 2 1332O2 103
23 5
37 186
3 285
159
8
(hi Lro = 132 373 cycles
3 730
7 459
I 1 2(X)
14 930
21 45O5 349
774
i 89
7 754 I I 847 18 245
I 122 572 883
128 28 44
TABLE 5.--SUMMARY AND COMPARISON OF DISK l,. _ LIFE PREDICTIONS WITH
EXPERIMENTAL L,, t LIVES
[Material. titanium ITi-6AI-4V) alloy: speed, 1 I 2(Xt rpm.]
Disk
designation
NAPC crack growthmethod (from Ref. 221
C_cles HrA 2138 3100
B 1655 240(I
Disk L,,llife
Modified crack grc, wth Zaretsky probable cause
method (Eq. (20)) method (frolll Table 4(b))
C.vcles Hr Cycles Hr617 895 774 1122
478 693 572 883
Experimental(frc, m Table 2 )
Cycles Hr594 86 I
5832 8981
NASA/TM-- 1999-107436 21

-_J 0.71 in.--4- J--
(a) Disk A.
4-- 1.0 in. --_(b) Disk B.
Figure 1 .--Schematic of compressor disks used for
analysis and testing. Material, titanium (Ti-6AI-4V)alloy.
12xl 03 F 11 200/
_ 4
2
o I0 2 4 6 8 10
Time, min
Figure 2._pin pit test cycle speed for compressor
disks as function of time. (From ref. 22.)
90
80
=_."O
C
o_
Or)
60
40
20
10
8
6
4
L10 = 7.9x10³
L50 = 21.9xl 03e=1.8
23
l I i I JlJl
10 20 30 50 100x103
Life, stress cycles
(a) Disks A.
90
80
__ 6O,B
(/)
40"13
_ 20e-ll)
(ID
°-10
_ 6
4
23 5
L10 = 13.6x10³
LS0 = 19.2x10³e=5.5
I I I I[ ii_J10 20 30 50 100x103
Life, stress cycles
(b) Disks B.
Figure 3.--Weibull analysis of low-cycle-fatigue test-
ing of combined rim-loaded and unloaded turbine
disks. Speed, 11 200 rpm. (Data from ref. 22.)
NASA/TM-- 1999-107436 22

(a) Disk A, 60 ° segment.
(b) Disk B, 30 ° segment.
Figure 4.--Mesh layout of turbine disks for
finite-element analysis.
276 MPa
(40 ksi) _,
510 MPa
(74 ksi) _.
172 MPa
(25 ksi)
241 MPa
(35 ksi) -->_
228 MPa
(33 ksi) _/
//
\\
_- 172 MPa
(25 ksi)
(a) Disk A, 60 ° segment.
276 MPa 483 MPa
(40 ksi) _, (70 ksi) --n r-- 55 MPa
\ I I1 (8 ksi)241 MPa \,, i lq
) _ ,-- 193 MPa(35 ksi) --_ \\ f s_ /
J I _I (28 ksi)I I I .:_i:
I
I
345 MPa
(50 ksi)
_-- 55 MPa
(8 ksi)
(b) Disk B, 30 ° segment.
Figure 5.--Maximum shear stress profiles for rim-
loaded compressor disks based on finite-element
analysis. Speed, 11 200 rpm.
NASA/TM-- 1999-107436 23

1.50
._>
_ ..71.25
N _
_ .___.oo0
z0.75 I J I I I
0 1 2 3 4 5
Material Weibull slope, e
(a) Effect of Weibull slope.
O
_ 1.25
B
0
Z0.75
1.50 --
Weibull slope,e
-- F 2, 3.57/
(
-L I I I
6 8 10 12 14
Stress-life exponent, c
(b) Effect of stress-life exponent.
Figure 6.--Effect of Weibull slope and stress-lifeexponent on predicted L10 life of generic rotating
disk. (From ref. 23.)
0% probability_
(a) Disk A, 60 ° segment.
0% probability
(b) Disk B, 30 ° segment.
Figure 7.--Normalized probability of failure based
on Probable Cause analysis of rim-loaded
compressor disks. Speed, 11 200 rpm.
NASA/TM-- 1999- 107436 24

20xl 0-3
106
U)
.__a 2
Experimental life, L0.1 (from Table 3)
Calculated _life, b
L0.1
---O-- Disk A
Disk B
1 I , I I , t I , ] I , I I0.01 0.1 0.5 1 2 5 10 100x103
Disk life, cycles
Figure 8.---Calculated L0.1 lives of gas turbine engine
compressor disks as function of speed under
engine load. Material, titanium (Ti-6AI-4V) alloy;
reference life, Lre f, 132 373 cycles; reference stress,
-r45, 509.2 MPa (73.846 ksi); reference volume, Vre f,2.264709xl 0-10 m3 (1.38201 05xl 0 -5 in.3); stress-life
exponent, c, 9.2; Weibull slope, e, 2; fatigue limit,none assumed.
Ssy s = exp - r]L_.__.jm /
Ssys /
•- lu) //
s0
Sref an m
Nre f NI_ NInN
Figure 9.--Sketch of Weibull plot where (Weibull) slope
or tangent of line is m. S 0 is probability of survival
of 36.8 percent at which N = NI3 or N/N_ = 1.
Ssys
$1
•-it_o
__ S 2_c
S3
Sref
/ /
/11
////_ystem ,from /_///
/// Ssys=S 1 .S 2.S 3....
Nref N1 N2 N3N
In N
Figure 10.---Sketch of multiple Weibull plots where each numbered
plot represents cumulative distribution of each component in system
and system Weibull plot represents combined distribution of plots
1, 2, 3, etc. (All plots are assumed to have same Weibull slope m.)
NASA/TM-- 1999-107436 25

REPORT DOCUMENTATION PAGE Fo.oApprovedOMB No. 0704-0188
Public reporting burden for this collection of information is estimated to average 1 hour per response, including the time for revpewing instructions, searching existing data sources,
gathering and maintaining the data needed, and completing and reviewing the collection of information Send comments regarding this burden estimate or any other aspecl of this
collection of information, including suggestions for reducing this burden, to Washington Headquarters Services, Directorate for information Operations and Reports, 1215 Jefferson
Davis Highway. Suite 1204, Arlington, VA 22202-4302, and to the Office of Management and Budget. Paperwork Reduction Project (0704-0188), Washington, DC 20503.
1. AGENCY USE ONLY (Leave blank) 2. REPORT DATE 3. REPORT TYPE AND DATES COVERED
June 1999 Technical Memorandum
4. TITLE AND SUBTITLE
Probabilistic Analysis of Aircraft Gas Turbine Disk Life and Reliability
6. AUTHOR(S)
Matthew E. Melis, Erwin V. Zaretsky, and Richard August
7. PERFORMING ORGANIZATION NAME(S) AND ADDRESS(ES)
National Aeronautics and Space Administration
John H. Glenn Research Center at Lewis Field
Cleveland, Ohio 44135-3191
9. SPONSORING/MONITORING AGENCY NAME(S) AND ADDRESS(ES)
National Aeronautics and Space Administration
Washington. DC 20546-0001
:5. FUNDING NUMBERS
WU-523-22-13_)0
8. PERFORMING ORGANIZATION
REPORT NUMBER
E- 10629-2
110. SPONSORING/MONITORINGAGENCY REPORT NUMBER
NASA TM--1999-107436
11. SUPPLEMENTARY NOTES
Matthew E. Melis and Erwin V. Zarctsky, NASA Glenn Research Center: Richard August, NYMA, Inc., 2001 Aerospace
Parkway, Brook Park, Ohio (work partially funded by NASA Contract NAS3-27186. Currently with NYMA, Incorpo-
rated, 9 North Wright Street, Langley Research Center, Hampton, Virginia 23681 ). Responsible person, Matthew E.
Melis, organization code 5930, (216) 433-3322.
12a. DISTRIBUTION/AVAILABILITY STATEMENT
Unclassified - Unlimited
Subject Category: 37 Distribution: Nonstandard
This publication is available from the NASA Center for AeroSpace Information, (301) 621-0390.
12b. DISTRIBUTION CODE
13. ABSTRACT (Maximum 200 words)
Two series of low cycle fatigue (LCF) test data for two groups of different aircraft gas turbine engine compressor disk ge-
ometries were reanalyzed and compared using Weibuli statistics. Both groups of disks were manufactured from titanium
(Ti-6AI-4V) alloy. A NASA Glenn Research Center developed probabilistic computer code "Probable Cause" was used to
predict disk life and reliability. A material-life factor "A" was determined for titanium (Ti-6AI-4V) alloy based upon fa-
tigue disk data and successfully applied to predict the life of the disks as a function of speed. A comparison was made
with the currenlly used life prediction method based upon crack growth rate. The application of an endurance limit to the
computer code did not significantly affect the predicted lives under engine operating conditions. Failure location predic-
tion correlates with those experimentally observed in the LCF tests. A reasonable correlation was obtained between the
predicted disk lives using the Probable Cause code and a modified crack growth method for life prediction. Both methods
slightly overpredict life for one disk group and significantly under predict it for the other.
14. SUBJECT TERMS
Probability theory: Fatigue life: Life (durability); Rotating disks: Crack initiation;
Structural design; Structural reliability
17. SECURITY CLASSIFICATION 18. SECURITY CLASSIFICATION
OF REPORT OF THIS PAGE
Unclassified Unclassified
NSN 7540-01-280-5500
15. NUMBER OF PAGES31
16. PRICE CODE
A03
19. SECURITY CLASSIFICATION 20. LIMITATION OF ABSTRACTOF ABSTRACT
Unclassified
Standard Form 298 (Rev. 2-89)
Prescribed by ANSI Std. Z39-18
298-102

