prizewinning dissertation 2018
TRANSCRIPT

International Development ISSN 1470-2320
Prizewinning Dissertation 2018
No.18-KL
Decentralisation: Road to Development or Bridge to Nowhere? Estimating the Effect of
Devolution on Infrastructure Spending in Kenya
Kurtis Lockhart
Published: February 2019
Department of International Development
London School of Economics and Political Science
Houghton Street Tel: +44 (020) 7955 7425/6252
London Fax: +44 (020) 7955-6844
WC2A 2AE UK Email: [email protected]
Website: http://www.lse.ac.uk/internationalDevelopment/home.aspx

Candidate Number: 91345
MSc in Development Management 2018
Dissertation submitted in partial fulfilment of the requirements of the degree
Decentralisation: Road to Development or Bridge to Nowhere?
Estimating the Effect of Devolution on Infrastructure Spending in
Kenya
Word Count: 10,081

Abstract
Does the decentralisation of state institutions result in a more equitable
distribution of public goods in the African context? To answer this question
this study examines a natural experiment in Kenya where the new 2010
Constitution devolved political and fiscal powers to 47 newly-established
county governments. A difference-in-differences strategy is employed that
exploits heterogeneity in the ethnic alignment of each county to the president.
This effectively varies the intensity of the ‘treatment’ of devolution across
counties. Using data on road expenditure across all 47 counties from 2010 to
2017, this study finds that the devolution of state structures in Kenya resulted
in a significantly more equitable distribution of road spending. These results
represent an important contrast to the prevailing view in the literature that
asserts that decentralisation reforms in sub-Saharan Africa have largely failed
to live up to expectations.

Acronyms
CoB Office of the Controller of the Budget
GoK Government of Kenya
KeNHA Kenya National Highways Authority
KeRRA Kenya Rural Roads Authority
KRB Kenya Roads Board
KURA Kenya Urban Roads Authority
LDC Late Developing Countries
MTEF Medium Term Expenditure Framework
PNU Party of National Unity
SSA Sub-Saharan Africa
TNA The National Alliance

Table of Contents
1. Introduction ....................................................................................................................................... 1
2. Literature Review............................................................................................................................... 3
2.1 Decentralisation ........................................................................................................................... 3
2.2 Ethnic Politics in Kenya .............................................................................................................. 5
2.2.1 Colonial District Boundaries and the Formalisation of Ethnicity ........................................................... 5
2.2.2 Ethnic Politics in Kenya and the 2010 Constitution ........................................................................... 7
2.3 Roads and Development ............................................................................................................. 8
3. Methods and Data ............................................................................................................................. 9
3.1 Variables and Data ....................................................................................................................... 9
3.2 Empirical Strategy ..................................................................................................................... 11
3.3 Identification Assumption: Parallel Trends ............................................................................. 12
4. Results .............................................................................................................................................. 14
4.1 Regression Analysis ................................................................................................................... 14
4.2 Robustness Checks .................................................................................................................... 16
4.2.1 Placebo Test .............................................................................................................................. 16
4.2.2 The 2013 Election, the New National Government, and Cabinet Formation ........................................ 17
4.2.3 Other Robustness Checks ............................................................................................................ 20
5. Limitations and Avenues for Future Research .............................................................................. 20
6. Conclusion and Policy Implications .............................................................................................. 22
References ............................................................................................................................................ 25
Appendix 1: Data Sources and Description of Key Variables ........................................................... 30
Appendix 2: Other Robustness Checks ............................................................................................. 32
Appendix 3: County Ethnic Composition, 2009 ................................................................................ 32
Appendix 4: The Public Spending Priorities of Kenyan Citizens .................................................... 34
Appendix 5: List of Key Informant Interviews .................................................................................. 35

DV410 Page 1 of 35 91345
1. Introduction
Does the decentralisation of political and fiscal institutions result in a more equitable
distribution of public goods in the sub-Saharan African (SSA) context? Over the preceding few
decades decentralisation reforms have increasingly been recommended by policy analysts and
donor agencies and, in turn, adopted by policymakers in late developing countries (LDCs) as a way
of ‘bringing government closer to the people’ (World Bank, 1999; Faguet, 2012). The theory
underlying this trend asserts that more devolved political and fiscal power increases government
accountability and responsiveness resulting in more effective public service delivery. Such
enhanced levels of accountability and responsiveness in a decentralised system are posited to be
brought about because subnational politicians have more accurate information about local needs
and, relatedly, local citizens possess more intimate knowledge about the performance of
subnational politicians (Oates, 2005; Ostrom et al., 1993; World Bank, 1994).
In addition to improving public service delivery, decentralisation advocates also stress that
devolved state structures can help reduce inter-group conflict in multi-ethnic societies (Roeder,
2010). This is because centralised states in LDCs are often dominated by the majority ethnic group
who, in control of a powerful executive branch, systematically target state resources to their co-
ethnics in exchange for electoral support, all but ignoring non-aligned, minority ethnic groups
(Bates, 1989; Franck & Rainer, 2012; Hodler & Raschky, 2014). It follows that by extending
subnational autonomy to these non-aligned groups – historically excluded by a strong, centralised
state – proponents avow that decentralisation can augment the size of the national pie that such
minorities receive and thereby decrease the potential for lingering ethnic cleavages to erupt into
outright violence (World Bank, 2004; van de Walle, 2001). This claim is especially important in the
African context due to the salience of ethnicity in politics throughout the sub-continent as well as
the ubiquity of centralised states with ‘big man’ presidents in the post-independence era (Horowitz,
1985; Hassan, forthcoming).
The study of decentralisation is motivated by overriding concerns of democratic
accountability, political responsiveness, and equity in the distribution of public goods. Moreover,
a further motivation from an academic perspective is that, despite most LDCs (and almost every
African country) embarking on some type of decentralisation reforms since the early 1990s
(Brosio, 2000; Manor, 1999), the literature is still largely ambiguous as to its ultimate effects.
In this study I examine the effect of devolution in Kenya on public goods provision.
Specifically, in 2010 Kenya passed a new Constitution that decentralised broad fiscal and political

DV410 Page 2 of 35 91345
functions to 47 newly created (and popularly elected) subnational county governments at a discrete
period in time (March, 2013). These constitutional changes to Kenya’s state structure create a
natural experiment. I use a difference-in-differences method to estimate the effect of devolution
on road spending. I exploit heterogeneity in the ethnic alignment of each county to the president
that, in effect, varies the intensity of the ‘treatment’ of devolution. The panel data constructed for
this study includes data on total road spending for every county for each fiscal year from 2010/11
to 2016/17 for a total of 287 observations.
Reviews of decentralisation on the sub-continent broadly characterise decentralisation
reforms in SSA as not having lived up to expectations (Hassan, forthcoming), with particular
epithets being used to label the specific breed of African decentralisation: ‘reluctant
decentralisation’ (Hassan, forthcoming), ‘centralised federalism’ (Dickovick, 2014), ‘fragile,
unstable, or failed federalism’ (Erk, 2014), and ‘recentralisation’ (Suberu, 2009). Contrary to this
prevailing pessimism about the effectiveness of decentralisation reforms in the African context, I
find that devolution has resulted in a significantly more equitable distribution of road spending in
Kenya. This finding takes on increased importance when one considers that road spending made
up about one-fifth of the total development budget in Kenya in 2016/17 (Kinuthia, 2018).
This study’s main contribution is that, to my knowledge, it is the first that attempts to
quantify the effect of Kenyan devolution on the distribution of public resources using all 47
counties. In addition, methodologically, this study’s quasi-experimental design combined with the
several robustness checks conducted goes beyond most research on decentralisation in SSA, which
typically relies on analytic narratives or before-and-after regressions. Furthermore, the study’s
focus on one country – Kenya – implies that the methodological issues that typically accompany
cross-country studies on decentralisation (e.g., external shocks, different legal and institutional
frameworks, low data comparability, etc) do not impede on the findings presented here. Finally, in
light of the findings that Kenya’s decentralised state institutions have significantly increased the
equitable distribution of a specific public good (one of the main objectives of the 2010
Constitution), this study suggests that perhaps the literature’s prevailing characterisation of African
decentralisation reforms as inconsequential (at best) or failed (at worst) requires re-examination.
In this sense, this study contributes to the broader literature that examines the effect of
institutions on African development more generally and the provision of public goods in particular.
Specifically, it brings together two strands of social science research. The first strand is typified by
empirical studies in economics and political science that focus on the weakness of institutional
checks on political elites and the state as a key driver of underdevelopment (see Acemoglu et al.,
DV410 Page 3 of 35 91345
2001; Acemoglu et al., 2014; Bates, 1981). The second strand is exemplified by historiographies of
the sub-continent that emphasise the importance of deep-seated, ethnic institutional traits as a
main factor in SSA’s poor development outcomes (see Bayart, 1993; Young, 1994; Horowitz, 1985;
Herbst, 2000). Ultimately, the way in which highly salient ethnic politics interacts with changes in
the institutional design of state structures (i.e., the transition from centralised to decentralised
governance) to affect the distribution of public goods is poorly understood.1
This paper is structured as follows: Section 2 overviews the relevant literature. Section 3
describes the data utilized and methodology employed. Section 4 presents the results of the
empirical analysis. Section 5 elucidates some limitations of the study as well as avenues for future
research. Section 6 concludes.
2. Literature Review 2.1 Decentralisation
The overwhelming trend of political history over the course of millennia has been the
continued centralisation of states (Faguet, 2012). However, recent decades have seen a dramatic
reversal of this trend. Since the mid-1980s over 80 percent of LDC governments have begun to
experiment with different types of decentralised state structures (Manor, 1999). Indeed, this new
trend towards decentralisation has been enthusiastically supported by multilaterals, who have
increasingly recommended that LDCs decentralise governance to more local levels (World Bank,
1999; World Bank, 1994). The main motivation behind such a stark reversal is that devolved
systems of government will enhance accountability and responsiveness to local needs (Ndegwa,
2002; Seabright, 1996).
As the term ‘decentralisation’ encompasses a wide-ranging set of institutional forms, it is
useful to establish concrete definitions before proceeding. Table 1 broadly defines the three main
forms of ‘decentralisation’: (i) deconcentration, (ii) delegation, and (iii) devolution. This study concerns
itself with the strongest form of decentralisation: devolution.
Beyond the broader concerns of government accountability and responsiveness, there are
two main rationales in the African context that are most cited by the literature for decentralising
state structures. Firstly, decentralisation deepens democracy by fostering ‘buy-in’ among voters.
‘Buy in’ for democracy is bolstered because, when contrasted with a winner-take-all, centralised
1 See Posner (2012) and Burgess et al. (2015) for exceptions.

DV410 Page 4 of 35 91345
system, devolved states at least allow the particular group that suffers national-level electoral defeat
to maintain some subnational powers and autonomy (Hassan, forthcoming). This defeated group
Table 1: Defining the Forms of Decentralisation
Form Description
Deconcentration (weakest)
Involves redistributing decision-making authority and financial/
management responsibilities among different levels of the central
government (e.g., shifting responsibilities from the capital to
frontline providers in regions, provinces, or districts).
Delegation Involves a central government transferring responsibility for
decision-making and administration of public functions to semi-
autonomous public sector agencies not wholly controlled by the
central government, but ultimately accountable to it. These
agencies usually have separate legal status and have a great deal of
discretion and autonomy.
Devolution (strongest)
Involves the central government devolving functions to
subnational governments. Subnational governments have clear and
legally recognized geographical boundaries over which they
exercise authority and within which they perform these functions.
Source: Adapted from definitions used by the World Bank and the World Health Organization (WHO) (see http://www1.worldbank.org/publicsector/decentralization/admin.htm; http://www.who.int/health-laws/topics/governance-decentralisation/en/)
also has an incentive to govern well in its subnational ‘homeland’ so as to demonstrate its ability
to take over national-level power in the next election (Riedl & Dickovick, 2013). Thus, both
winners and losers have some stake in the perpetuation of devolved, democratic institutions. On
top of this, a decentralised system can further democratisation because subnational units can
effectively serve to constrain the power of the president (Falleti, 2010; Cheeseman et al., 2016).
This is especially pertinent in the African context with its history of ‘big man’ presidents that have
typically dominated centralised, unitary states in the post-independence era (Erdmann & Engel,
2007).
Secondly, decentralisation, in the context of multi-ethnic populations, can bolster the
political representation and voice of minority groups, and, in turn, reduce the likelihood of inter-
group conflict relative to more centralised systems (World Bank, 2004; van de Walle, 2001;
Scherrer, 2008). For example, Tiebout (1956) notes how citizens in diverse societies can ‘vote with
their feet’ by moving to subnational jurisdictions that align with their policy preferences. The
accommodation of the diverse preferences of all groups brought about by the extension of
subnational autonomy can help mitigate ethnic violence. This has been a key motivation for some

DV410 Page 5 of 35 91345
of SSA’s largest and most ethnically varied countries to embark on decentralisation reforms,
including Nigeria, Sudan, South Africa, and Ethiopia (Suberu, 2009; Brancati, 2009).
Overall, the extent to which African decentralisation reforms have been successful in
addressing these two persistent problems – (i) incomplete democratisation since the advent of the
‘Third Wave’ in the 1990s (Huntington, 1991), and (ii) high levels of ethnic conflict throughout
SSA – is highly contested in the literature (see Dickovick, 2014; Erk, 2014; Suberu, 2009; Hassan,
forthcoming). Indeed, while there are quite literally thousands of studies – both academic and
policy literature – that attempt to make sense of the effects of decentralisation, the vast majority
consist of analytic narratives, broad surveys, or simple before-and-after regressions that leave the
sub-field of decentralisation studies largely ambiguous and unable to establish firm conclusions
(Treisman, 2007).2 Filling this gap in the literature is a key motivating factor of this study. Unlike
much of the literature, I use a quasi-experimental design in an attempt to more precisely estimate
the causal effects of decentralisation reforms on the sub-continent.
2.2 Ethnic Politics in Kenya
2.2.1 Colonial District Boundaries and the Formalisation of Ethnicity
The empirical strategy of the study (see Section 3.2) relies, in part, on the initial conditions
of the subnational counties being exogenously determined (i.e., the product of historical accident).
Indeed, both ethnographies and the historical record attest that prior to colonisation many of
Kenya’s 42 ethnic groups were mobile and geographic boundaries were fluid. For example, in the
Rift Valley, Waller (1993) notes that in the nineteenth century boundaries “between pastoralists,
cultivators and hunters in the Rift Valley region were permeable, constantly shifting and subject to
continuous redefinition…. With the establishment of colonial rule…boundaries hardened and
became policed borders that divided rather than united communities on either side,” (p. 226-27).
In Kenya’s Western region, Were (1967) states that in the two or three centuries preceding
colonialism, “various factors – famine, epidemics, domestic disputes, the spirit of adventure and
warfare – made the inhabitants of the region extremely mobile,” (p. 41). In the Central highlands,
Parsons (2012) records how “[i]n the pre-conquest era, highland peoples often assumed new
identities through migration, commerce, enslavement, intermarriage, and adoption,” (p. 69-70).
2 For examples of decentralisation studies that use analytic narratives see Qian (2003), Careaga & Weingast (2003), and Rondinelli et al. (1983). For examples of studies that constitute ‘broad surveys’ see Manor (1999) and Smoke (2001). For an example that utilizes simple before-and-after regressions see Enikolopov & Zhuravskaya (2007).

DV410 Page 6 of 35 91345
The imposition of British colonial rule in 1895 put a halt to this fluidity. With the onset of
colonisation, the distribution of ethnic groups across the country was “frozen by the Colonial
Government by the demarcation of ‘African Land Units’,” (Morgan & Shaffer, 1966: p. 16). As
was the norm in Britain’s African colonies, Kenya was to be administered via indirect rule (see
Lugard, 1922). Indirect rule in Kenya involved the establishment of areas where white settlers
could live (mainly in Kenya’s ‘White Highlands’), as well as the establishment of Native Reserves
into which the local African population was forced. Native Authorities were also created, with
locals loyal to the colonial regime (usually elites) appointed to administer different geographic
regions as ‘chiefs’ (Mamdani, 1996). The borders of these Native Reserves were drawn largely
along prevailing ethnic lines as perceived by the British, as the colonial administration thought
ethnic homogeneity would maximise the African population’s submission to their local chief,
chiefs who were responsible for administering tax collection and enforcing colonial labour
schemes (Burbidge, 2018). Such ready submission would minimise the costs of colonial rule for
the British. As Mamdani (1996) states, these imposed boundaries “enforc[ed] an ethnic identity on
the subject population through ethnically organized Native Authorities,” (p. 136-37). Moreover,
tribes that had once been mobile in Kenya now had their freedom of movement formally restricted
by the colonial requirement to carry kipande certificates if traveling between different jurisdictions,
which further entrenched ethnic homogeneity (Burbidge, 2018).
The boundaries of these colonial Native Reserves persisted: they were the basis of the 41
subnational districts created in 1963 at independence, and these districts were, in turn, used in the
formation of the 47 counties established by the 2010 Constitution (Burbidge, 2018). At
independence 38 of the 41 districts had ethnic groups that constituted over 50 percent of the
district’s population (Burgess et al., 2015). Such subnational ethnic homogeneity has remained
remarkably stable, with 40 of the 47 counties today possessing a single ethnic group that contains
over 50 percent of the county population (see Appendix 3). In this way, these subnational
jurisdictions can be used as identifiers of particular ethnic groups. Road spending for each fiscal
year of the study period can, in effect, be assigned to a particular ethnicity based on the subnational
location in which the road is built. Similarly, counties can be said to be aligned or non-aligned to
the sitting president based on the majority-ethnicity within a particular county. Such ethnic
alignment or non-alignment with the president effectively varies a given county’s exposure to the

DV410 Page 7 of 35 91345
‘treatment’ of devolution and can therefore allow me to determine whether devolution resulted in
more equitable levels of roads spending (see Section 3.2).3
2.2.2 Ethnic Politics in Kenya and the 2010 Constitution
The presence of ethnic cleavages, exacerbated by the persistence of colonial borders, has
combined with highly centralised political power in Kenya to give rise to ethnic politics. The
salience of ethnicity in politics has been a widely studied phenomenon due to its pervasiveness in
SSA’s emerging democracies. The literature extensively documents the reliance of politicians on
their coethnics for a sustained base of electoral support (Posner, 2012); support that is then
maintained through patron-client relationships that disproportionately provide coethnic voters
with both public resources and/or personalized, private favours (Chabal & Daloz, 1999). Over
time, these types of ethnically driven political exchanges create voter expectations and, in turn,
political candidates seeking to secure the votes of coethnics must then increasingly resort to what
Stokes et al. (2013) call ‘non-programmatic’ distributive politics to win elections.4 Several empirical
studies have provided robust evidence of such ‘non-programmatic’ distributions of public (and
private) resources towards coethnics across Africa generally (Franck & Rainer, 2012; Hodler &
Raschky, 2014; Dickens, 2018), and in Kenya in particular (Burgess et al., 2015; Kramon & Posner,
2016; Marx et al., 2017).
Given the evidence that the provision of public goods in Kenya is at least partly determined
by ethnic affiliation, and given Kenya’s centralised, winner-take-all state structure, it is unsurprising
that elections tend to exacerbate ethnic tensions. Indeed, ethnic violence has broken out in several
past elections under Kenya’s centralised system: 1992, 1997, and most egregiously in 2007/08.
Finally, aiming to put an end to this ethnically driven election violence, Kenyan politicians initiated
a constitutional reform process that culminated in a 2010 referendum. The new Constitution
passed overwhelmingly, with two-thirds of Kenyan voters in favour. Embedded in this
constitutional change was a sweeping devolution of political, fiscal, and administrative authority
to 47 subnational county governments that would come into existence in March, 2013. These
subnational governments would be transferred at least 15 percent of national revenues (GoK,
3 See Burgess et al. (2015) and Miguel & Gugerty (2005) for examples of other empirical work that exploits the imposition of Kenya’s colonial borders to examine public goods provision. 4 Stokes et al. (2013) define programmatic forms of public goods distribution as those that have formal and publicly available criteria for distribution, and where these criteria actually determine the distributions observed. Where there are no formal or publicly available criteria, distributions are said to be non-programmatic.
DV410 Page 8 of 35 91345
2010: Art. 203) via an objective formula.5 The county governments would then use these transfers
to autonomously manage several key functions (GoK, 2010: Schedule 4).6 The vast majority of
Kenyan citizens voted in favour of the new Constitution because they believed decentralisation
would alleviate large disparities in public goods provision and, by so doing, lessen the risk of ethnic
conflict in Kenya (Cheeseman et al., 2016).
2.3 Roads and Development
There is a large literature that highlights the importance of infrastructure in spurring
development. Theoretically, Jones (2011) emphasizes the significance of intermediate goods – like
transportation networks – in explaining the large income differences between rich and poor
countries. Empirically, Atkin & Donaldson (2015) show that intra-national trade costs are 4 to 5
times higher in Nigeria and Ethiopia than in the US. These high transaction costs have negative
implications for the ability of SSA firms to successfully integrate themselves into global markets,
as well as for remote SSA consumers whose welfare, Atkin and Donaldson show, is hardest hit by
such high trade costs. It follows then that poor roads increase the costs associated with trading
goods across lengthy distances, and that lowering these transport costs could not only improve the
competitiveness of SSA firms but could also help spread the gains from trade to remote SSA
consumers and thus alleviate regional inequalities – a key source of ethnic conflict (Donaldson et
al., 2017).
In addition to these relatively shorter-term gains from improved infrastructure, a new line
of inquiry is examining the long run effects of early road networks on economic development
today. Exploiting a natural experiment in the distribution of road networks throughout the Roman
Empire, Dalgaard et al. (2018) find that increased road density in Roman times is associated with
(i) increased contemporary road density, (ii) increased settlement formation, and (iii) increased
economic prosperity today.
Thus, the above literature attests to the importance of roads for both short- and long-run
economic development. In addition to these factors, roads were selected as the focus of this study
for several other reasons. First, roads are the largest item in Kenya’s total development budget
5 The current objective formula is set out by the Commission on Revenue Allocation and includes 6 parameters each with different weights: (i) population (45 percent); (ii) equalisation share (26 percent); (iii) poverty (18 percent); (iv) land area (8 percent); (v) fiscal responsibility (2 percent); and (iv) development factor (1 percent). See https://www.crakenya.org/information/revenue-allocation-formula/. 6 Devolved functions are enumerated in Schedule 4 of the 2010 Constitution. They include health services,
agriculture, land administration, water and sanitation, infrastructure, and several others.

DV410 Page 9 of 35 91345
(Kinuthia, 2018). Second, before the provision and maintenance of all class D roads (and below)
were transferred to county governments after March, 2013,7 road spending was highly centralised
in the Office of the President (Burgess et al., 2015: p. 1826). Third, roads are highly visible
development projects and thus theory posits that road building would be prioritised by the new
county governments in order to quickly demonstrate to local voters the value of devolved
government.8 Fourth, Afrobarometer surveys in Kenya suggest improved infrastructure is listed
by citizens as one of the most prioritised devolved public goods (see Appendix 4).
3. Methods and Data
3.1 Variables and Data
The empirical analysis builds off of the study by Burgess et al. (2015), who construct a
district-year panel on road expenditure in Kenya for each fiscal year from independence in 1963
to 2011. This paper has a similar aim to Burgess et al. (2015): the authors first estimate whether
the ethnicity of the president impacts the level of road spending that he directs towards coethnic
areas, then, once this is established, they examine whether ethnic favouritism in road spending is
relatively higher during autocratic periods than during democratic periods. Thus, they pinpoint
how changes in Kenya’s state structure (autocracy versus democracy) affect public goods provision
through altering the extent of ethnic favouritism. Indeed, the authors provide robust empirical
evidence that democracy quells ethnic patronage. Similarly, this paper extends the analysis beyond
Burgess et al.’s panel (which ends in 2011), to the post-2010 period during which Kenya passed
the 2010 Constitution that fundamentally altered Kenya’s state structure from a centralised,
‘imperial’ system dominated by the president, to a devolved system of government implemented
in 2013. In this sense, as in Burgess et al. (2015), I also seek to pinpoint how changes in state
structure (centralised versus decentralised) affect public goods provision.
To this end, I construct a county-year panel on road spending in Kenya for each fiscal year
from 2010/11 to 2016/17. Post-devolution (following the March, 2013 elections), some roads
functions were devolved to the newly created 47 county governments, and some roads functions
7 The Transition Authority (2015) as well as key informant interviews confirm that class A, B, C, and S roads are under the authority of the national government, and class D roads (and down) fall under the purview of the county governments. See Transition Authority (2015), p. 29-30, for further clarification on national versus county road classifications. 8 See Harding (2015) for a more detailed discussion of roads as a highly visible public good that can be readily attributed to specific branches of government in the African context.

DV410 Page 10 of 35 91345
remained under the jurisdiction of the national government (see footnote 7). Therefore, both
national- and county-level road spending are required for the post-devolution period. As in
Burgess et al. (2015), national-level road spending data is obtained from the Development Estimates
(a government report published yearly that contains budget information for all national
government ministries and agencies),9 and from the Medium Term Expenditure Framework
(MTEF) Budget Reports published for the infrastructure sector by the National Treasury. The
MTEF reports publish spending data on all individual road projects for each fiscal year, providing
the project’s name, the main locations that the road project runs through, and the cost (e.g.,
“Nakuru – Nyahururu – Nyeri road”). When individual road projects span more than one county,
Google Maps was used to ascertain the total length of the road and then to calculate how many
kilometres belong to each particular county.10
County government road expenditure data is obtained from the Office of the Controller
of the Budget (CoB), which has published an Annual County Governments Budget Implementation Review
Report every fiscal year since the creation of the 47 counties in 2013. The county-level road
spending data is then combined with the national-level road spending data to get total road
spending in each county in every fiscal year from 2010/11 to 2016/17. I converted both the
national and county road spending data in my county-year panel so that it conforms to the 1963
district boundaries used by Burgess et al. (2015). There were 41 districts in 1963.11 As a result, the
empirical analysis is based on a dataset of 47 counties (converted to 41 districts) over a period of
7 fiscal years for 287 total observations.
Following Burgess et al. (2015), I then normalize the share of all Kenyan road spending
received by a particular county relative to that county’s population share. That is, the share of all
Kenyan road spending that a particular county c receives (in a particular fiscal year) is divided by
9 While the Development Estimates were available for most fiscal years in the government publications section of the LSE Library, some fiscal years were missing. In such cases, the missing Development Estimates were ascertained at the National Archives at Kew. 10 Thus, when traversing multiple counties, road spending share is weighted by distance. I assumed spending is distributed equally across the entire road segment, as in Burgess et al. (2015). If a road project name does not provide sufficient information to ascertain its location(s), then I find the location through searches of reports and websites of Kenyan state agencies involved in road construction: (i) the Kenya National Highways Authority (KeNHA), (ii) the Kenya Roads Board (KRB), (iii) the Kenya Urban Roads Authority (KURA), and (iv) the Kenya Rural Roads Authority (KeRRA). 11 This was done so that data on several control variables used by Burgess et al. (2015) could be merged into my dataset. A further motivation for aligning my dataset with Burgess et al.’s was so that placebo tests could be performed on the period preceding my study period. Placebo results are presented in Section 4.2.1. Where necessary the authors kindly clarified questions I had in constructing variables to ensure maximal coherence between the two datasets.

DV410 Page 11 of 35 91345
that county c’s population share (of the national population) in 2009. As Burgess et al. (2015) note,
“[t]his statistic has a natural interpretation: a value 1 implies that a [county] received road spending
that is exactly proportional to its population. Values greater than (less than) 1 denote spending that
is above (below) the national per capita average,” (p. 1829). This measure of road expenditure is
the outcome variable (denoted 𝑟𝑜𝑎𝑑𝑐𝑡).
3.2 Empirical Strategy
An ideal experiment to estimate the effect of devolution on road spending would randomly
assign some counties to the ‘treatment’ of devolution, and the resulting road spending in these
‘treatment’ counties would then be compared to a counterfactual group of counties in which road
spending remained centralised. In reality, this counterfactual scenario cannot be observed, as
devolution in Kenya was implemented across all 47 newly created counties following the 2013
elections.
To address this challenge to causal inference, I use a difference-in-differences specification
that exploits the fact that ethnic heterogeneity across counties creates variation in the exposure of
these counties to the ‘treatment’ of devolution. In particular, Kenyan counties vary in their ethnic
alignment with the president.12 Most scholars on ethnicity in Kenya commonly agree that the
country is home to 42 different ethnic groups. Of these ethnic groups, 18 form the largest single
ethnic group within particular counties (Weismann et al., 2016). If we take the presence of ethnic
favouritism in Kenya (and the corollary of ethnically-driven voting behaviour) as given (see
Burgess et al., 2015; Kramon & Posner, 2016; Marx et al., 2017; Wrong, 2009), it follows then that,
pre-devolution, the spoils of a centralised, ‘imperial’ presidency are disproportionately targeted
towards the ethnic group that is able to win the presidency (the Kikuyus since 2002). In contrast,
post-devolution, such spoils in a decentralised state structure are now diffused among 47 counties
that are headed by 18 different ethnic groups.13 Taking this line of reasoning to its logical
12 The ethnicity of the president has remained constant throughout the entirety of the period from December
30th, 2002 to the present (both Mwai Kibaki and the current president, Uhuru Kenyatta, are ethnic Kikuyu). Thus, the logic goes that, pre-devolution, counties that are ethnically aligned to the president (Kikuyu-majority) receive a disproportionate level of road spending. There are seven such aligned counties (Kiambu, Kirinyaga, Laikipia, Muranga, Nakuru, Nyandarua, and Nyeri). On the other hand, counties that are ethnically non-aligned to the president (non-Kikuyu-majority) do not receive a representative level of road spending. There are 40 such non-aligned counties (as I use the 1963 district boundaries in my empirical analysis, which has 41 districts, there are then 7 aligned districts and 34 non-aligned districts). 13 See Appendix 3 for a list of all counties by ethnic composition. In an analysis of the ethnic composition of the 47 county governments (including both the 47 governors and 491 county executive committee members) Burbidge (2018) finds that the largest local ethnic group makes up, on average, 84 percent of the county
DV410 Page 12 of 35 91345
conclusion, one can posit then that the one aligned ethnic group (Kikuyus) – which prior to
devolution had received a disproportionate share of the spoils of centralisation – will be
comparatively more exposed to the ‘treatment’ of devolution than 18 different ethnic groups who
must share amongst themselves the new-found spoils of devolution (i.e., the same ‘road spending
pie’ is getting cut into many more pieces under devolution).
Therefore, the ‘treatment’ of devolution in non-aligned counties can be thought of as, in
effect, a placebo. Due to a lower intensity of treatment, these non-aligned counties can then be
used as a quasi-control group.
Several past studies use similar methodologies to the one described here, where authors
have exploited heterogeneity in ethnic alignment to explain the distribution of public resources in
the African context generally (Franck & Rainer, 2012; Hodler & Raschky, 2014; Dickens, 2018),
and in Kenya in particular (Burgess et al., 2015; Kramon & Posner, 2016; Marx et al., 2017).
3.3 Identification Assumption: Parallel Trends
The key identifying assumption in this difference-in-differences design is that, in the
absence of the ‘treatment’ of devolution, road spending trends would be the same in both the
treatment (aligned) counties and the quasi-control (non-aligned) counties. That is, a deviation from
a common (parallel) trend is brought about as a result of the treatment (Angrist & Pischke, 2009).
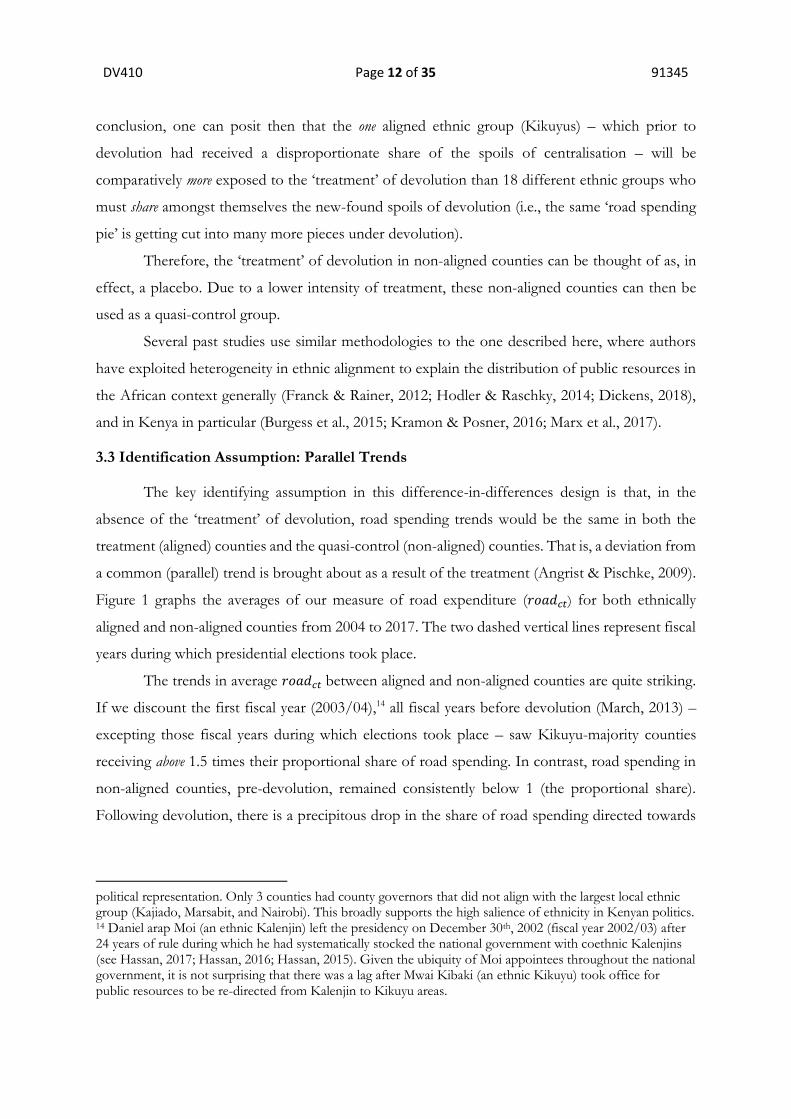
Figure 1 graphs the averages of our measure of road expenditure (𝑟𝑜𝑎𝑑𝑐𝑡) for both ethnically
aligned and non-aligned counties from 2004 to 2017. The two dashed vertical lines represent fiscal
years during which presidential elections took place.
The trends in average 𝑟𝑜𝑎𝑑𝑐𝑡 between aligned and non-aligned counties are quite striking.
If we discount the first fiscal year (2003/04),14 all fiscal years before devolution (March, 2013) –
excepting those fiscal years during which elections took place – saw Kikuyu-majority counties
receiving above 1.5 times their proportional share of road spending. In contrast, road spending in
non-aligned counties, pre-devolution, remained consistently below 1 (the proportional share).
Following devolution, there is a precipitous drop in the share of road spending directed towards
political representation. Only 3 counties had county governors that did not align with the largest local ethnic group (Kajiado, Marsabit, and Nairobi). This broadly supports the high salience of ethnicity in Kenyan politics. 14 Daniel arap Moi (an ethnic Kalenjin) left the presidency on December 30th, 2002 (fiscal year 2002/03) after 24 years of rule during which he had systematically stocked the national government with coethnic Kalenjins (see Hassan, 2017; Hassan, 2016; Hassan, 2015). Given the ubiquity of Moi appointees throughout the national government, it is not surprising that there was a lag after Mwai Kibaki (an ethnic Kikuyu) took office for public resources to be re-directed from Kalenjin to Kikuyu areas.

DV410 Page 13 of 35 91345
aligned counties – remaining below or at 1 throughout the post-devolution period – despite an ethnic
Kikuyu continuing to hold the presidency. Conversely, after the implementation of devolution, the share
Figure 1: Trends in Road Expenditure
Source: Author’s county-year panel from 2010/11 to 2016/17 is merged with Burgess et al.’s district-year panel (for fiscal years 2003/04 to 2009/10). The outcome variable (Share of Road Expenditure [c,t] divided by the Population Share [c,2009]) is averaged for both aligned (treatment) counties, and non-aligned (quasi-control) counties. Recall the intuition behind the outcome variable: “a value of 1 implies that a [county] receives road spending that is exactly proportional to its population. Values greater than (less than) 1 denote spending that is above (below) the national per capital average,” (Burgess et al., 2015: p. 1829).
of road spending received by non-aligned counties stays consistently above 1 – and above the
share received by aligned counties – for the duration of the study period. The general pattern of
interest to note is that pre-devolution the average 𝑟𝑜𝑎𝑑𝑐𝑡 measure is inequitable and heavily skewed
towards ethnically aligned counties, and post-devolution the share of road spending received by
both aligned and non-aligned counties becomes much more equitable (closer to 1), with non-
aligned counties registering a slight advantage. To the extent that Figure 1 satisfies the key
identification assumption of parallel pre-treatment trends, the claim to causal inference is
strengthened.
3.4 Estimation Approach

DV410 Page 14 of 35 91345
A difference-in-differences specification is used to estimate the effect of devolution on
road spending, where the ethnic alignment of each county (to the president) represents the
intensity of treatment across counties. The main estimating equation is expressed as follows:
𝑟𝑜𝑎𝑑𝑐𝑡 = 𝛼𝑐 + 𝛾𝑡 + 𝛿(𝑎𝑙𝑖𝑔𝑛𝑒𝑑𝑐 x 𝑑𝑒𝑣𝑜𝑙𝑢𝑡𝑖𝑜𝑛𝑡) + 𝜃(𝐗𝑐2009′ ) + 𝑒𝑐𝑡 ,
where the dependent variable, 𝑟𝑜𝑎𝑑𝑐𝑡, is a measure of road expenditure for county c in year t as
outlined above. The variable 𝛼𝑐 represents county fixed effects, which controls for fixed
differences between counties. Year fixed effects are denoted by 𝛾𝑡 and control for trends in road
spending that are common to all counties. The interaction term interacts 𝑎𝑙𝑖𝑔𝑛𝑒𝑑𝑐 and 𝑑𝑒𝑣𝑜𝑙𝑢𝑡𝑖𝑜𝑛𝑡:
𝑎𝑙𝑖𝑔𝑛𝑒𝑑𝑐 (the proxy for intensity of treatment) is a binary variable equal to 1 if the population of
county c is at least 50 percent ethnically aligned to the sitting president (Kikuyu), and 0 otherwise
(see Appendix 3). The term 𝑑𝑒𝑣𝑜𝑙𝑢𝑡𝑖𝑜𝑛𝑡 is a binary variable equal to 1 for the period following the
implementation of devolution (2014-2017).15 The coefficient on the interaction term, 𝛿, is the
coefficient of interest. It captures the difference between the effect of devolution in aligned
counties and the effect of devolution in non-aligned counties. The 𝐗𝑐2009′ term denotes a vector of
control variables for demographic, economic activity, and economic geography collected from the
Socio-Economic Atlas of Kenya (Weismann et al., 2016). The inclusion of these variables controls for
many factors that may be correlated with the main variable of interest (the interaction term) and
also influence the outcome variable (𝑟𝑜𝑎𝑑𝑐𝑡). As this analysis uses panel data, all specifications use
robust standard errors clustered at the county-level. See Appendix 1 for a full description of key
variables and their sources.
4. Results
4.1 Regression Analysis
Table 2 reports the regression results with 𝑟𝑜𝑎𝑑𝑐𝑡 as the dependent variable and the
interaction term, (𝑎𝑙𝑖𝑔𝑛𝑒𝑑𝑐 x 𝑑𝑒𝑣𝑜𝑙𝑢𝑡𝑖𝑜𝑛𝑡), as the main explanatory variable. Several different
specifications are reported beginning with a simple baseline specification (Column 1), followed by
specifications that progressively add controls.16 Column 2 adds demographic controls including
15 Recall, devolution was implemented following the elections in March, 2013. Kenya’s fiscal year runs from July 1st to June 30th. Therefore, as in Burgess et al. (2015), this study takes the notation that the road expenditure data provided in the Development Estimates and MTEF reports for year t gives spending for the time period July t – 1 to June t. 16 Note that the controls, where possible, were intentionally chosen to be similar to the controls used in Burgess et al. (2015) to maximise comparability between the results, and in turn heighten analytical insight (see Burgess et al. regression results on p. 1834 of their paper). While Burgess et al. (2015) used data from their

DV410 Page 15 of 35 91345
county population, area, and urbanization rate. Column 3 adds a control for economic activity
(total formal sector employment in each county). Column 4 includes controls for economic
geography: (i) whether a county is on the Mombasa-Nairobi-Kampala corridor, (ii) whether a
county borders a foreign country, and (iii) a county’s distance from Nairobi. As these controls are
fixed over time (or are ascertained from a single base year, 2009), they would be purged from the
model because of the model’s inclusion of fixed effects. To remedy this, following Burgess et al.
(2015), I allow these controls to vary over time (and thus remain in the model) by interacting them
with a linear time trend.
Table 2: Regression Results
Share of road spending [c, t] Dependent variable Population share [c, 2009]
(1) (2) (3) (4)
Aligned county [c] x devolution [t] -0.79*** -0.71*** -0.70*** -0.50** (0.226) (0.189) (0.181) (0.232) Observations 287 287 287 287 R-squared 0.017 0.027 0.027 0.037 County and year fixed effects Yes Yes Yes Yes (Population, area, urbanization rate) x trend No Yes Yes Yes (Formal employment) x trend No No Yes Yes (Main highway, border, dist. Nairobi) x trend No No No Yes
Notes: OLS regressions using the author’s constructed panel data of road expenditure for 47 counties for the seven fiscal years from 2010/11 to 2016/17. Road spending data for the 47 counties was converted to conform to the 1963 district boundaries (41 districts), as in Burgess et al. (2015), for a total of 287 observations. Aligned county [c] is a binary variable equal to 1 if county c is ethnically aligned to the president (Kikuyu). Devolution [t] is a binary variable equal to 1 for the fiscal years 2013/14 to 2016/17. Columns 2-4 sequentially add controls interacted with time trends. First, Column 2 adds three demographic controls: (i) county population (2009), (ii) area in square km (area of 41 districts is used), and (iii) urbanization rate (2009). Column 3 adds a control for economic activity: total formal sector employment by county (2009). Column 4 adds three controls for economic geography: (i) a binary variable equal to 1 if a county is on the Mombasa-Nairobi-Kampala highway, (ii) a binary variable equal to 1 if a county is bordering Uganda or Tanzania, and (iii) the distance of the county (from the Euclidean centroid) to Nairobi (km). Robust standard errors clustered at the county level in parentheses. See Appendix 1 for descriptions and sources of key variables.
* significant at 10%; ** significant at 5%; *** significant at 1%.
The coefficient on the interaction term, 𝛿, is negative and significant, and is robust to the
inclusion of controls throughout all specifications. The magnitude on the coefficient of interest
varies from -0.50 to -0.79. Taking the lower bound in Column 4, the estimated coefficient of -0.50
baseline year in the early 1960s to construct their controls, I use data from the Socio-Economic Atlas of Kenya, which codes data from Kenya’s 2009 census (around my baseline year) by county and sub-location.

DV410 Page 16 of 35 91345
implies that, on average, 𝑟𝑜𝑎𝑑𝑐𝑡 was reduced by about half in ethnically aligned counties after the
implementation of devolution.17
In essence, these findings support the notion that devolution, in a context of ethnic
favouritism, results in an ‘ethnic equality’ dividend – above and beyond the ‘ethnic equality’ dividend
found in Burgess et al. (2015) for periods of democracy (though highly centralised democracy).
Put another way, the analysis presented here indicates that devolution in Kenya has, in effect,
deepened democracy as proponents assert by further constraining the president’s capacity to engage
in ethnic favouritism. The evidence suggests that devolution altered state structure, brought
government institutions ‘closer to the people’ and away from the ethnically biased hands of the
president, and, in so doing, helped bring about a more equitable distribution of public resources
as was the proclaimed goal of the 2010 Constitution.18 These significant results are even more
striking considering that Kenya is still in the relatively early stages of devolution’s implementation
and considering the widespread reports of attempts by the national government to delay
transferring powers to the county governments (or to recentralise some county functions entirely)
(Hassan, forthcoming).
Moreover, the fact that road spending made up 18 percent (or roughly one-fifth) of the
total development budget for the national government in the last fiscal year of the study period
(2016/17), implies that devolution’s ability to foster a more equitable distribution of such a
consequential sum of government resources lends further significance to the above findings
(Kinuthia, 2018).
4.2 Robustness Checks
4.2.1 Placebo Test
To test the key identification assumption of parallel trends more formally, placebo
regressions are conducted. As mentioned, the most significant identification concern is that our
regression coefficients capture a particular pre-existing trend correlated with our main explanatory
variable that occurs regardless of state structure (centralised vs. decentralised). To ensure this is
17 This is in line with the graphical representation in Figure 1, as the road spending shares in aligned counties sharply decreased from above 1.5 pre-devolution, to around 1 for the duration of the post-devolution period. 18 The main mechanism through which devolution affects road spending is presumed to be increased institutional constraints on the president. While a thorough exploration of potential mechanisms is beyond the scope of this study, this mechanism is most plausible due to the fact that the objective formula that is now used in transferring revenue to the counties (see footnote 5) is not subject to presidential manipulation (a sharp change from the previously centralised and subjective/discretionary road spending powers of the presidency pre-devolution). This is supported by key informant interviews (Kinuthia, Interview).

DV410 Page 17 of 35 91345
not the case, placebo tests are run to check if ethnic alignment to the president explains patterns
of road spending before devolution took place (2005-2011). This is a useful check, as the president
(Kibaki) remained constant throughout this pre-devolution period. Therefore, given ethnic
alignment does not change and state structure does not change from 2005-2011 we should not see
that our main explanatory variable explains the pattern of road spending throughout this period.
Table 3 presents the results of this placebo test for the preceding 7-year period in which devolution
did not take place (2005-2011).
Table 3: Placebo Test Regression Results
Dependent Variable: 𝑟𝑜𝑎𝑑𝑐𝑡, 2005-11 (1) (2) (3) (4)
Aligned county [c] x devolution [t] -0.50 -0.29 -0.38 -0.24 (1.285) (1.353) (1.354) (1.488) Observations 287 287 287 287 R-squared 0.019 0.033 0.042 0.067 County and year fixed effects Yes Yes Yes Yes (Population, area, urbanization rate) x trend No Yes Yes Yes (Formal employment) x trend No No Yes Yes (Main highway, border, dist. Nairobi) x trend No No No Yes
Notes: OLS regressions using Burgess et al. (2015)’s panel data on road expenditure for seven fiscal years preceding the implementation of devolution (from 2004/05 to 2010/11). Refer to the notes from Table 2 for descriptions of the main explanatory variable and the controls. Robust standard errors clustered at the county level in parentheses. See Appendix 1 for descriptions and sources of key variables. * significant at 10%; ** significant at 5%; *** significant at 1%.
The placebo regressions show that the estimated coefficients are insignificant throughout
all specifications, as expected. The general pattern to note is that we see significant and robust
coefficients for the period when devolution actually took place (2011-2017; see Table 2), and
insignificant results for the period preceding devolution (2005-2011; see Table 3). Combined with
the graphical analysis in Figure 1 such results strongly support the claim that the estimated
coefficients in Table 2 are unlikely to be caused by pre-existing trends in road spending (𝑟𝑜𝑎𝑑𝑐𝑡).
4.2.2 The 2013 Election, the New National Government, and Cabinet Formation
Another potential concern is that the estimates could be biased as a result of
contemporaneous changes in other areas (Angrist & Pischke, 2009). The most prominent change
that occurred contemporaneously to devolution in March, 2013 was the election of a new national
government. This could result in spurious estimates because if the new president or his new cabinet

DV410 Page 18 of 35 91345
differ significantly from their predecessors – and it is this difference (not devolution) that is driving
the results – then the estimates in Table 2 will be biased. To investigate this, I examine both the
two individual presidents themselves as well as their respective cabinets.
As mentioned, the newly elected president, Uhuru Kenyatta, is an ethnic Kikuyu (like
Kibaki) and was Deputy Prime Minister and Finance Minister under President Kibaki. A review
of contemporaneous media sources in the run up to the 2013 elections reveals that Kibaki’s party,
the Party of National Unity (PNU), signed a coalition agreement with Kenyatta’s newly formed
party, The National Alliance (TNA), six months before the 2013 elections took place (Daily Nation,
2012; The Star, 2012). The coalition agreement stipulated that PNU would not nominate a
presidential candidate to run in the election, and instead would support the candidacy of Kenyatta.
The facts that Kenyatta hails from the same ethnic group as Kibaki, that he held key ministerial
positions in Kibaki’s cabinet, and that he had signed a formal coalition agreement with the
outgoing president’s political party all strongly suggest that Kenyatta’s victory would be more of a
continuity in national policy than a sharp discontinuity of the type that could be driving the
observed significant differences in road spending before and after 2013. Still, there is a possibility
that the new cabinet brought in by the incoming president could be biasing the estimates.
To rule this out, I look at whether there are any significant differences in terms of ethnic
representation between the cabinet of Kibaki’s second term, and the cabinet formed by Uhuru
Kenyatta upon his ascension to the presidency. If Kenyatta’s new cabinet is significantly more
representative, this (instead of devolution) could explain the more equitable road spending we
observe post-2013.
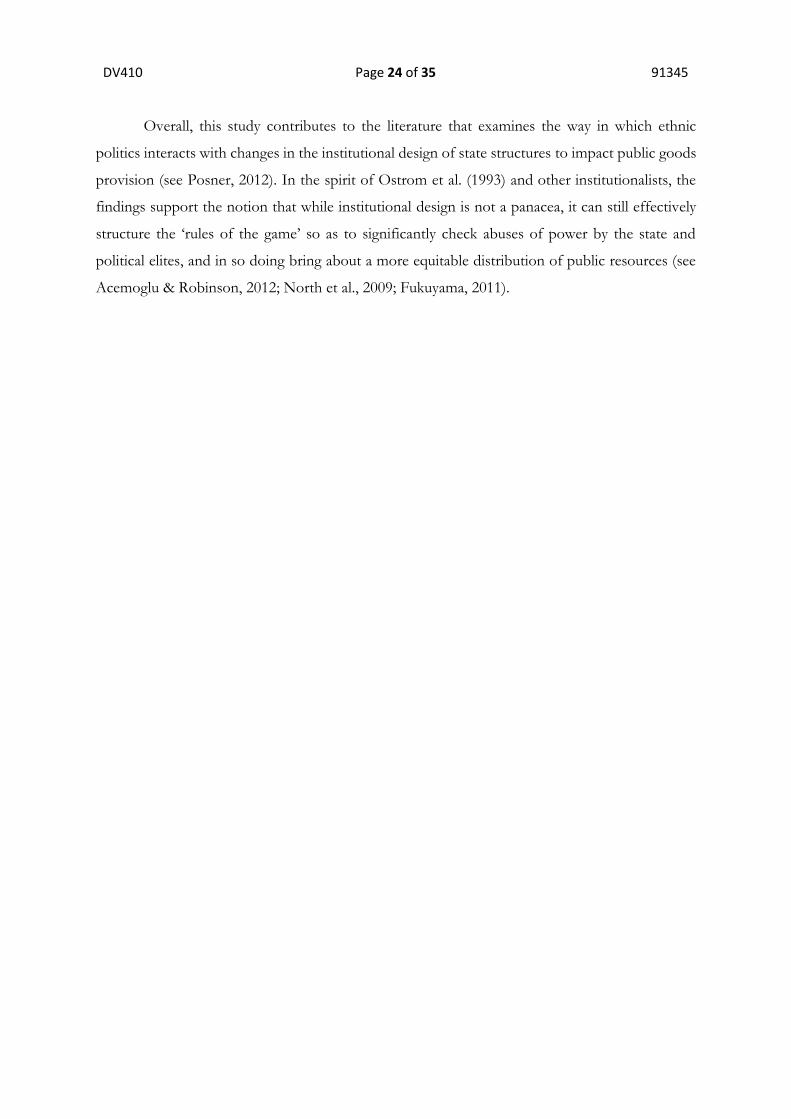
Figure 2 shows the ethnic composition of Kibaki’s cabinet formed in 2008 and compares
this to the ethnic make-up of Kenyatta’s cabinet formed in 2013 upon assuming office. The cabinet
index is constructed in much the same way as the outcome variable, 𝑟𝑜𝑎𝑑𝑐𝑡: the share of ethnic
group e in cabinet c is divided by that ethnic group e’s share of the total population in 2009. The
intuition is also similar, with a value of 1 implying proportional representation, and a value above
(below) 1 implying ethnic representation that is above (below) that ethnicity’s share of the total
population.
A formal comparison of means test between the cabinet index of the 2008 and 2013
cabinets is conducted – dropping the ‘Non-African’ outlier.19 The test results show that the means
19 Kenyatta appointed one Arab to his cabinet (Najib Balala, Cabinet Secretary for Tourism), despite Arabs making up less than 1 percent of the Kenyan population.

DV410 Page 19 of 35 91345
of the respective cabinet indices are not significantly different from each other (results not shown).
What is striking to note in Figure 2 is that the Kikuyu share remains essentially constant between
the two cabinets and extremely close to 1 (the proportional share), indicating that both Kikuyu
presidents refrained from stocking their key ministerial positions with coethnics.20
Figure 2: Comparing Cabinet Ethnic Composition
Source: The 2008 cabinet index was obtained from Burgess et al.’s online appendices and adapted with 2009 population figures (instead of their original 1962 population figures). The 2013 cabinet ethnic composition was obtained via Opalo (2013), and the cabinet index was then constructed by the author.
It is also possible that the particular minister in charge of transport/infrastructure was
Kikuyu under Kibaki and non-Kikuyu under Kenyatta, and this change could explain the differing
patterns in road spending observed before and after 2013 (instead of devolution). An examination
of the different transport/infrastructure ministers shows that throughout the study period the
ethnicity of the minister has remained Kikuyu: Amos Kimunya (2010-2013), Michael Kamau
(2013-2015), and James Wainaina Macharia (2015-present).21
20 This is in line with Francois, Rainer, and Trebbi (2015) who analyse the cabinet formation of 15 African countries and find that presidents appoint ethnically representative cabinets to guard against ‘revolutions from outsiders’ and ‘coups from insiders’. 21 The ethnicity of Kamau and Macharia was ascertained via Opalo (2013). The ethnicity of Kimunya was ascertained via Wrong (2009), p. 242.
0
1
2
3
4
5
6
Cab
inet
Eth
nic
Rep
rese
nta
tio
n I
nd
ex
Cabinet Ethnic Composition: 2008 vs. 2013
Kibaki Cabinet Index (2008) Kenyatta Cabinet Index (2013)

DV410 Page 20 of 35 91345
Overall, the above discussion illustrates that Kenyatta can be considered more of a
continuation of Kibaki’s policies than a sharp break from them, that the ethnic representation in
both Kibaki’s and Kenyatta’s cabinets was statistically the same, and that the particular minister
leading the transport/infrastructure department remained Kikuyu throughout the entire study
period. Still, despite these facts, the nature of real-world empirical analysis is such that a true
counterfactual cannot be observed, and thus it cannot be formally tested that Kenyatta’s new
regime is simply less prone to ethnic favouritism than Kibaki’s. Yet, the preceding analysis is
nonetheless reassuring as it reduces the likelihood that contemporaneous changes in the national
government are driving the changes in road spending.
4.2.3 Other Robustness Checks
An additional concern is that road spending was simply diverted away from counties that
had particularly developed road networks, and towards more underdeveloped counties where
larger marginal gains could be had (and this would have happened regardless of devolution). If the
former counties were predominantly Kikuyu-majority counties, and the latter were predominantly
non-Kikuyu counties, this could be biasing our estimates. To check that this type of pattern is not
driving our results I repeat the same regression specifications as reported in Table 2, but drop the
top five counties in terms of kilometres of paved road (weighted by population) (see Kinuthia,
2018). The results are broadly consistent with the results found in our main regressions in Table
2, with the coefficient on the explanatory variable of interest remaining negative and significant
throughout all specifications (results presented in Appendix 2). Such results lend confidence to the
robustness of the main findings.
5. Limitations and Avenues for Future Research
There are several potential concerns pertaining to the above analyses worth delineating
here. Chief among these concerns is whether the results reported in Section 4 can be interpreted
causally. The quasi-experimental design, the placebo tests and robustness checks presented, and
the addition of several variables that control for potentially omitted confounding factors, all
strengthen the case for a causal interpretation. Still, such a causal interpretation relies on the
internal validity of the difference-in-differences method employed. Namely, the key identification
assumption of parallel road spending trends between the treatment (aligned) counties and quasi-
control (non-aligned) counties before devolution must be satisfied. While this cannot be directly
tested, this assumption is plausibly met given the graphical analysis in Section 3.3 and the placebo

DV410 Page 21 of 35 91345
tests run in Section 4.2.1. However, a key threat to internal validity still remains: contemporaneous
changes in the national government brought about by the 2013 elections. While the discussion in
Section 4.2.2 is reassuring in that it provides suggestive evidence that changes in the national
government were not driving the observed changes in road spending, again, this cannot be formally
tested. Thus, results must be interpreted with these caveats in mind.
Second, measurement error is also a potential concern. In particular, the use of a binary
variable for 𝑎𝑙𝑖𝑔𝑛𝑒𝑑𝑐 (an ethnic dummy) in lieu of a continuous variable may bias the estimated
coefficients. As Appendix 3 lays out, data restrictions were such that a continuous variable for the
ethnic composition of each of the new 47 counties could not be ascertained. Relatedly, the recent
research of Dickens (2018) has used more nuanced ‘ethno-linguistic similarity’ measures as
opposed to more black-and-white ethnicity measures and is thus able to find evidence of not just
coethnic favouritism but also non-coethnic favouritism (towards allied or within-coalition ethnic
groups). An interesting task for future research would be to examine if the main findings of this
study remain robust to these different measures of ethnicity.
Third, this study constructed the outcome variable, 𝑟𝑜𝑎𝑑𝑐𝑡, by totalling all road spending
at both the county and national levels regardless as to whether that road spending went towards
the construction of new roads or towards the maintenance of existing roads. Thus, a limitation of
this study is that it cannot disentangle whether these different types of road spending are impacted
differently by devolution. Theoretically, one may plausibly posit that spending on new roads may
be relatively more susceptible to ethnic patronage as new road construction is more visible to
voters than the upkeep of existing roads. Testing this hypothesis is left to future research. In
addition, a related limitation is that this study only examines the effect of devolution on one public
good (roads). As mentioned in Section 2.3, roads are relatively more visible and attributable to a
particular branch of government than other devolved public goods (e.g., health services). Harding
(2015) shows how the varying levels of visibility/attribution that particular public goods possess
may affect their levels of provision by politicians. Therefore, an important line of inquiry for future
research is to examine whether the main findings in this study carry over to several other devolved
public goods.
Fourth, the external validity of the main findings is open to debate. While this study’s focus
on decentralisation reforms in one country – Kenya – confers advantages in terms of internal
validity, there is an obvious trade-off in the extent to which the findings from this one country can
be generalised to other countries. Still, it can be argued that Kenya is relatively more representative

DV410 Page 22 of 35 91345
of the ‘average’ country in SSA than others that have undergone decentralisation reforms, and thus
is a better country from which to generalise results.22
Fifth, another limitation of this study is that a thorough exploration of possible
mechanisms underlying the observed results is beyond its scope. As noted in Section 4.1 (see
footnote 18), suggestive evidence (as well as key informant interviews) points to the most plausible
mechanism being that the new Constitution effectively tied the hands of the president as it
devolved 15 percent of national revenue down to 47 new county governments via an objective
formula, which is not subject to presidential manipulation (see footnote 5). However, this
mechanism is not formally tested and others could be at play. For example, subnational
mechanisms like county electoral competition or the level of ethnic diversity in a particular county
could be potential mechanisms through which devolution affects road spending (and could
potentially produce heterogeneous effects).23 Also beyond the scope of this study is an
investigation into whether devolution has simply transferred ethnic patronage from the national-
to the county-level and thus could perhaps end up marginalizing ethnic minorities within counties,
as some scholars suggest (see D’Arcy & Cornell, 2016). An examination of the mechanisms at play,
of possible heterogeneous effects, as well as the question of ethnic patronage merely being
transferred to the county-level are all worthy directions for future research.
6. Conclusion and Policy Implications
The conventional wisdom asserts that changes to formal state institutions in the African
context often fail to effectively constrain SSA’s powerful, ‘imperial’ presidents, as it is precisely
these political elites who are involved in both the design and implementation of such institutional
reforms (Hassan, forthcoming). Given that these ‘big man’ presidents have an incentive to subvert
any decentralisation of their power, it follows that the literature is largely pessimistic about the
extent to which devolving formal state structures can bring about the theorized benefits of
decentralisation – such as more equitable public goods provision – in practice (see Dickovick,
2014; Erk, 2014; Suberu, 2009).
22 The other decentralised countries (federations or quasi-federations) in contemporary SSA are Nigeria (which has by far the largest population in SSA), Sudan (its largely Arab north is not the norm on the sub-continent), Ethiopia (which has never experienced colonisation), Comoros (a small, island nation), and South Africa (which endured the unique historical experience of apartheid). 23 See Boone (2003) and Faguet (2012) on how subnational dynamics can produce heterogeneous effects under decentralised state structures.

DV410 Page 23 of 35 91345
On the whole, the main findings of this study go against this conventional pessimism in
the literature: I find formal institutions matter in the distribution of public goods in the African
context. The institutional reforms first promulgated in Kenya’s 2010 Constitution and
implemented in 2013 initiated what the World Bank called, “among the most rapid and ambitious
devolution processes going on in the world,” (World Bank, 2014: p. viii). This decentralisation of
state structure resulted in significantly more equitable road spending in Kenya, thus achieving one
of the main objectives of the 2010 Constitution. Moreover, the magnitudes are non-trivial with the
lower-bound estimate implying that, after devolution, the outcome measure of road spending was
reduced by half in counties ethnically aligned to the president (relative to non-aligned counties),
bringing the road spending share of both aligned and non-aligned counties significantly closer to
1 (the proportional share). This ‘ethnic equality’ dividend brought about by decentralising political
and fiscal power away from the president towards subnational governments is above and beyond the
dividend found in Burgess et al. (2015) for democratic (but centralised) periods. While there are
limitations to this study that suggest an agenda for future research (Section 5), the fact that the
findings remain consistently significant to the inclusion of many control variables and across
several robustness checks lends further confidence to the results.
These results have several policy implications. First, in the Kenyan context, given the early
success of decentralisation and the relatively nascent stage of the reforms, efforts should be made
to further strengthen subnational state capacity. One key way in which donors can help bolster
county capacity is through a stipulation in the Constitution that allows donors to make transfers
directly to county governments, thus bypassing multiple tiers at the national-level (see GoK, 2012:
138). Second, and more broadly, the findings suggest that when implementing development
projects in multi-ethnic countries, if donors favour those countries with more devolved state
structures, donor funds are likely to be allocated more equitably. This is particularly pertinent for
those donors who do not place as many restrictions on their investments relative to multilaterals
like the World Bank or IMF (see, for example, Dreher et al. (2016), who find that Chinese aid is
significantly more likely to be used for ethnic patronage by African leaders, while World Bank aid
is not). More specific to the particular public good examined in this study (roads), China’s Belt and
Road Initiative (BRI) – a gargantuan, decades-long, multi-trillion-dollar infrastructure investment
initiative – is set to make vast in-roads into the sub-continent’s infrastructure sectors in the coming
years (The Economist, 2018). Given the staggering levels of planned investment, the findings of this
study suggest that those countries with more devolved institutions will be better placed to avoid
large sums of money being misallocated due to centralised ethnic patronage.
DV410 Page 24 of 35 91345
Overall, this study contributes to the literature that examines the way in which ethnic
politics interacts with changes in the institutional design of state structures to impact public goods
provision (see Posner, 2012). In the spirit of Ostrom et al. (1993) and other institutionalists, the
findings support the notion that while institutional design is not a panacea, it can still effectively
structure the ‘rules of the game’ so as to significantly check abuses of power by the state and
political elites, and in so doing bring about a more equitable distribution of public resources (see
Acemoglu & Robinson, 2012; North et al., 2009; Fukuyama, 2011).

DV410 Page 25 of 35 91345
References
Acemoglu, D., Johnson, S. & Robinson, J., 2001. The Colonial Origins of Comparative Development: An Empirical Investigation. American Economic Review, 91(5), pp. 1369-1401.
Acemoglu, D., Reed, T. & Robinson, J., 2014. Chiefs: Economic Development and Elite Control of Civil Society in Sierra Leone. Journal of Political Economy, 122(2), pp. 319-368.
Acemoglu, D. & Robinson, J., 2012. Why Nations Fail: The Origins of Power, Prosperity, and Poverty. New York: Random House.
Alesina, A., Michalopoulos, S. & Papaioannou, E., 2016. Ethnic Inequality. Journal of Political Economy, 124(2), pp. 428-88.
Angrist, J. & Pischke, J.-S., 2009. Mostly Harmless Econometrics: An Empiricist's Companion. Princeton: Princeton University Press.
Atkin, D. & Donaldson, D., 2015. Who's Getting Globalised? The Size and Implications of Intra-National Trade Costs. NBER Working Paper No. 21439.
Baldwin, K. & Huber, J., 2010. Economics versus Cultural Differences: Forms of Ethnic Diversity and Public Goods Provision. American Poltical Science Review, 104(4), pp. 644-62.
Barkan, J. & Chege, M., 1989. Decentralising the State: District Focus and the Politics of Reallocation in Kenya. Journal of Modern African Studies, 27(3), pp. 431-453.
Bates, R., 1981. Markets and the State in Tropical Africa. Berkeley: University of California Press.
Bates, R., 1989. Beyond the Miracle of the Market: The Political Economy of Agrarian Development in Kenya. Cambridge University Press.
Bayart, J., 1993. The State in Africa: The Politics of the Belly. London: Longman.
Bayart, J., Ellis, S. & Hibou, B., 1993. The Criminalisation of the State: Regime Politics in Comparative Perspective. Bloomington: Indiana University Press.
Boone, C., 2003. Political Topographies of the African State: Territorial Authority and Institutional Choice. Cambridge: Cambridge University Press.
Boone, C., 2017. Sons of the Soil Conflict in Africa: Institutional Determinants of Ethnic Conflict Over Land. World Development, Volume 96, pp. 276-293.
Brancati, D., 2009. Peace by Design: Managing Intrastate Conflict through Decentralization. Cambridge: Cambridge University Press.
Brosio, G., 2000. Decentralization in Africa, Washington, DC: IMF.
Burbidge, D., 2018. Demoncracy versus Diversity: Ethnic Representation in Devolved Kenya, Oxford: University of Oxford.

DV410 Page 26 of 35 91345
Burgess, R. et al., 2015. The Value of Democracy: Evidence from Road Building in Kenya. American Economic Review, pp. 105(6): 1817-1851.
Careaga, M. & Weingast, B., 2003. Fiscal Federalism, Good Governance, and Economic Growth in Mexico. In: D. Rodrik, ed. In Search of Prosperity: Analytic Narratives on Economic Growth. Princeton: Princeton University Press, pp. 399-435.
Chabal, P. & Daloz, J., 1999. Africa Works: Disorder as Political Instrument. Bloomington: Indiana University Press.
Cheeseman, N., Lynch, G. & Willis, J., 2016. Decentralization in Kenya: The Governance of Governors. Journal of Modern African Studies, 54(1), pp. 1-35.
Daily Nation, 2012. 4 parties strike pact to support Uhuru in polls. 8 August.
Dalgaard, C., Kaarsen, N., Olsson, O. & Selaya, P., 2018. Roman Roads to Prosperity: Persistence and Non-Persistence of Public Goods Provision. CEPR Discussion Paper No. DP12745.
D'Arcy, M. & Cornell, A., 2016. Devolution and Corruption in Kenya: Everyone's Turn to Eat?. African Affairs, pp. 246-273.
Dickens, A., 2018. Ethnolinguistic Favouritism in African Politics. American Economic Journal: Applied Economics, 10(3), pp. 370-402.
Dickovick, T., 2014. Federalism in Africa: Origins, Operation and (In)Significance. Regional & Federal Studies, 24(5), pp. 553-570.
Donaldson, D., Jinhage, A. & Verhoogen, E., 2017. Beyond Borders: Making Transport Work for African Trade, London: International Growth Centre.
Dreher, A. et al., 2016. Aid on Demand: African Leaders and the Geography of China's Foreign Assistance. AidData.
Elischer, S., 2010. Political Parties, Elections and Ethnicity in Kenya. In: D. Branch, N. Cheeseman & L. Gardner, eds. Our Turn to Eat: Politics in Kenya Since 1950. Berlin: Munster: Lit, pp. 199-220.
Enikolopov, R. & Zhuravskaya, E., 2007. Decentralisation and Political Institutions. Journal of Public Economics, Volume 91, pp. 2261-2290.
Erdmann, G. & Engel, U., 2007. Neopatrimonialism Reconsidered: Critical Review and Elaboration of an Elusive Concept. Commonwealth & Comparative Politics, 45(1), pp. 95-119.
Erk, J., 2014. Federalism and Decentralization in Sub-Saharan Africa: Five Patterns of Evolution. Regional & Federal Studies, 25(5), pp. 535-552.
Faguet, J., 2012. Decentralization and Popular Democracy: Governance from Below in Bolivia. Ann Arbor: University of Michigan Press.

DV410 Page 27 of 35 91345
Falleti, T., 2010. Decentralization and Subnational Politics in Latin America. Cambridge :Cambridge University Press.
Franck, R. & Rainer, I., 2012. Does the Leader's Ethnicity Matter? Ethnic Favouritism, Education, and Health in Sub-Saharan Africa. American Political Science Review, 106(2), pp. 294-325.
Francois, P., Rainer, I. & Trebbi, F., 2015. How is Power Shared in Africa?. Econometrica, 83(2), pp. 465-503.
Fukuyama, F., 2011. Origins of Political Order: From Prehuman Times to the French Revolution. New York: Farrar, Straus, and Giroux.
Government of Kenya, 2010. Constitution of Kenya, Nairobi: Government of Kenya.
Government of Kenya, 2012. Public Finance Management Act, Nairobi: Government of Kenya.
Hassan, M., 2015. Continuity Despite Change: Kenya's Constitution and Executive Power. Democratization, 22(4), pp. 587-609.
Hassan, M., 2016. A State of Change: District Creation in Kenya After the Beginning of Multi-Party Elections. Political Research Quarterly, 69(3), pp. 510-521.
Hassan, M., 2017. The Strategic Shuffle: Ethnic Geography, the Internal Security Apparatus, and Elections in Kenya. American Journal of Political Science, 61(2), pp. 382-395.
Hassan, M., forthcoming. Decentralization and Democratization. In: Handbook of Democratization in Africa.
Herbst, J., 2000. States and Power in Africa. Princeton: Princeton University Press.
Hodler, R. & Raschky, P., 2014. Regional Favouritism. Quarterly Journal of Economics, pp. 995-1033.
Horowitz, D. P., 1985. Ethnic Groups in Conflict. Berkeley: University of California Press.
Huntington, S., 1991. The Third Wave: Democratisation in the Late Twentieth Century. s.l.:University of Oklahoma Press.
Jerven, M., 2013. Poor Numbers: How We Are Misled by African Development Statistics and What to Do About It. Ithica: Cornell University Press.
Jones, C., 2011. Intermediate Goods and Weak Links in the Theory of Economic Development. American Economic Journal: Macroeconomics, 3(2), pp. 1-28.
Kinuthia, J., 2018. Kenya: How Equitable Was the Distribution of National Roads and Water Projects in 2016/17?, Nairobi: International Budget Partnership.
Kramer, E. & Posner, D., 2016. Ethnic Favouritism in Education in Kenya. Quarterly Journal of Political Science, 11(1), pp. 1-58.
Kroth, V., Larcinese, V. & Wehner, J., 2016. A Better Life for All? Democratization and Electrification in Post-Apartheid South Africa. Journal of Politics, 78(3), pp. 774-791.

DV410 Page 28 of 35 91345
Lugard, F., 1922. The Dual Mandate in British Tropical Africa. London: Blackwood.
Mamdani, M., 1996. Citizen and Subject: Contemporary African and the Legacy of Late Colonialism. Princeton: Princeton University Press.
Manor, J., 1999. The Political Economy of Democratic Decentralization, Washington, DC: World Bank.
Marx, B., Stoker, T. & Suri, T., 2017. There Is No Free House: Ethnic Patronage in a Kenyan Slum, Cambridge: MIT Department of Economics.
Michalopolous, S. & Papaioannou, E., 2013. Pre-Colonial Ethnic Institutions and Contemporary African Development. Econometrica, 81(1), pp. 113-52.
Miguel, E. & Gugerty, M., 2005. Ethnic Diversity, Social Sanctions, and Public Goods in Kenya. Journal of Public Economics, Volume 89, pp. 2325-2368.
Ndegwa, S., 2002. Decentralization in Africa: A Stocktaking Survey, Washington, DC: World Bank.
North, D., Wallis, J. & Weingast, B., 2009. Violence and Social Orders: A Conceptual Framework for Interpreting Recorded Human History. Cambridge: Cambridge University Press.
Oates, W., 2005. Toward A Second-Generation Theory of Fiscal Federalism. International Tax and Public Finance, Volume 12, pp. 349-373.
Opalo, K., 2013. A look into Kenyatta's new cabinet. [Online] Available at: https://kenopalo.com/2013/04/25/a-look-into-kenyattas-new-cabinet/ [Accessed 20 July 2018].
Ostrom, E., Schroeder, L. & Wynne, S., 1993. Institutional Incentives and Sustainable Development: Infrastructure Policies in Perspective. Boulder: Westview Press.
Parsons, T., 2012. Being Kikuyu in Meru: Challenging the Tribal Geography of Colonial Kenya. Journal of African History, Volume 53, pp. 65-86.
Posner, D., 2007. Regime Change and Ethnic Cleavages in Africa. Comparative Political Studies, 40(11), pp. 1302-1327.
Posner, D., 2012. Institutions and Ethnic Politics in Africa. Cambridge: Cambridge University Press.
Qian, Y., 2003. How Reform Worked in China. In: D. Rodrik, ed. In Search of Prosperity: Analytic Narratives on Economic Growth. Princeton: Princeton University Press, pp. 297-333.
Riedl, R. & Dickovick, J., 2013. Party Systems and Decentralization in Africa. Studies in Comparative International Development, Volume 49.
Roeder, P., 2010. Ethnofederalism and the mismanagement of conflicting nationalism. In: The Paradox of Federalism: Does Self-Rule Accommodate or Exacerbate Ethnic Divisions?. Oxford: Oxford University Press, pp. 13-30.

DV410 Page 29 of 35 91345
Rondinelli, D., Cheema, G. & Nellis, J., 1983. Decentralization in Developing Countries: A Review of Recent Experience, Washington, DC: World Bank.
Scherrer, C., 2008. Prevention of Violent Conflict by Structural Accomodation. In: Encyclopedia of Violence, Peace, and Conflict (Second Edition). pp. 1725-1781.
Seabright, P., 1996. Accountability and Decentralisation in Government: An Incomplete Contracts Model. European Economic Review, 40(1), pp. 61-89.
Smoke, P., 2001. Fiscal Decentralization in Developing Countries: A Review of Current Concepts and Practice , Geneva: United Nations Research Institute for Social Development.
Stokes, S., Dunning, T., Nazareno, M. & Brusco, V., 2013. Brokers, Voters, and Clientelism: The Puzzle of Distributive Politics. New York: Cambridge University Press.
Suberu, R., 2009. Federalism in Africa: The Nigerian Experience in Comparative Perspective. Ethnopolitics, 8(1), pp. 67-86.
The Economist, 2018. Gateway to the Globe. July/August, pp. 13-16.
The Star, 2012. PNU and TNA to sign poll pact tomorrow. 10 October.
Tiebout, C., 1956. A Pure Theory of Local Expenditure. Journal of Political Economy, 64(5), pp. 416-424.
Transition Authority, 2015. Costing of Government Functions, Nairobi: Government of Kenya.
Treisman, D., 2007. The Architecture of Government: Rethinking Political Decentralization. New York: Cambridge University Press.
van de Walle, N., 2001. African Economies and the Politics of Permanent Crisis, 1979-1999. Cambridge: Cambridge University Press.
Waller, R., 1993. Acceptees & Aliens: Kikuyu Settlement in Maasailand. In: Being Maasai: Ethnicity & Identity in East Africa. London: James Curry.
Wallis, J. & Oates, W., 1988. Decentralization in the Public Sector: An Empirical Study of State and Local Government. In: Fiscal Federalism Quantitative Studies. Chicago: University of Chicago Press.
Were, G., 1967. A History of the Abaluyia of Western Kenya. Nairobi: East African Publishing House.
Wiesmann, U., Kiteme, B. & Mwangi, Z., 2016. Socio-Economic Atlas of Kenya: Depicting the National Population Census by County and Sub-Location, Nairobi: KNBS.
World Bank, 1994. World Development Rerport: Infrastructure for Development, Washington, DC: World Bank.
World Bank, 1999. Beyond the Center: Decentralizing the State, Washington, DC: World Bank.

DV410 Page 30 of 35 91345
World Bank, 2004. World Development Report 2004: Making Services Work for Poor People, Washington, DC: World Bank.
World Bank, 2014. Accountable Devolution Program: Insights from the Governance Partnership Facility in Kenya, Washington, DC: World Bank.
Wrong, M., 2009. It's Our Turn to Eat: The Story of a Kenyan Whistleblower. London: Fourth Estate.
Young, C., 1994. The African Colonial State in Comparative Perspective. New Haven: Yale University Press.
Appendix 1: Data Sources and Description of Key Variables
Description Source
Main Dependent Variable
Share of Road Expenditure [c,t]/ Population Share [c, 2009]
Share of road spending (out of the total national road budget) of county c in year t divided by that county c’s population share (out of the total national population) in 2009.
Expenditure: Development Estimates of Kenya (2010/11 to 2016/17), Medium Term Expenditure Framework (MTEF) Budget Reports (2010/11 to 2020/21); Population: Socio-Economic Atlas of Kenya. See Wiesmann et al. (2016).

DV410 Page 31 of 35 91345
Main Regressors
(a) Aligned County [c,t] Takes a value of 1 if county c is coethnic to the president in year t.
Aligned: Socio-Economic Atlas of Kenya. See Wiesmann et al. (2016).
(b) Devolution [t] Takes a value of 1 if year t is equal to or after the fiscal year 2013/14.
Devolution: Timeline from Burbidge (2018).
Control Variables *Note: All control variables are interacted with a linear time trend so they are not purged by the inclusion of fixed effects.
(a) Population [c, 2009] x trend Population of county c in 2009.
Population: Socio-Economic Atlas of Kenya (derived from the 2009 Kenyan census). See Wiesmann et al. (2016).
(b) Area [c] x trend Area in square kilometres of county c.
Area: Burgess et al. (2015). See online appendices.
(c) Urbanization Rate [c, 2009] x trend Percentage of the population in county c living in urban areas in 2009. (includes ‘core urban’ and ‘peri-urban’ residents within towns having at least 2,000 inhabitants).
Urbanization Rate: Kenya County Fact Sheets published by Kenya’s Commission on Revenue Allocation.
(e) Total Employment in the Formal Sector [c,2009] x trend
Total formal sector employment in county c in 2009.
Formal Sector Employment: Socio-Economic Atlas of Kenya. See Weismann et al. (2016).
(g) Mombasa-Nairobi-Kampala Corridor [c] x trend
Takes a value of 1 if county c is located on the Mombasa-Nairobi-Kampala Corridor.
Burgess et al. (2015). See online appendices.
(h) Border county [c] x trend Takes a value of 1 if county c is bordering Uganda or Tanzania.
Burgess et al. (2015). See online appendices.
(i) Euclidean Distance (km) to Nairobi [c] x trend
County c’s centroid Euclidian distance to Nairobi in kilometres.
Burgess et al. (2015). See online appendices.

DV410 Page 32 of 35 91345
Appendix 2: Other Robustness Checks
The table below reports regression results where I replicate the specifications presented in
Table 2, but the top five counties in terms of kilometres of paved road built (weighted by
population) are dropped from the analysis. Results remain negative and significant throughout all
specifications (broadly conforming to the results in Table 2).
Regression Results to Robustness Check
Share of road spending [c, t] Dependent variable Population share [c, 2009]
(1) (2) (3) (4)
Aligned county [c] x devolution [t] -0.57*** -0.40** -0.49*** -0.40**
(0.201) (0.164) (0.177) (0.183)
Observations 252 252 252 252
R-squared 0.010 0.022 0.023 0.031
County and year fixed effects Yes Yes Yes Yes
(Population, area, urbanization rate) x trend No Yes Yes Yes
(Formal employment) x trend No No Yes Yes
(Main highway, border, dist. Nairobi) x trend No No No Yes
Notes: Refer to the notes from Table 2 for descriptions of the main explanatory variable and the controls. Robust standard errors clustered at the county level in parentheses. The top five counties in terms of kilometres of paved road built (weighted by population) are ascertained from Kinuthia (2018). See Appendix 1 for descriptions and sources of key variables. * significant at 10%; ** significant at 5%; *** significant at 1%.
Appendix 3: County Ethnic Composition, 2009
The below table is adapted from the Socio-Economic Atlas of Kenya (Weismann et al., 2016).
Note that only the share of the largest ethnic group was provided. Population shares of smaller
ethnic groups within each county are not included in the Atlas. This was the main factor that
necessitated utilizing a binary variable for 𝑎𝑙𝑖𝑔𝑛𝑒𝑑𝑐 as opposed to a continuous variable (that would
denote the percentage share of Kikuyu out of every county’s total population). Further county-level
data collection is needed to verify that the findings of this paper are robust to using a continuous
variable for 𝑎𝑙𝑖𝑔𝑛𝑒𝑑𝑐 .
It should be noted that the last census in Kenya was in 2009, and the next census is due to
take place in 2019 (the first census following devolution, and thus the first to contain county-level
data). With this new census data, a continuous ethnic variable at the county-level could be
constructed. Thus, this is left to future research.

DV410 Page 33 of 35 91345
County Largest Ethnic
Community
Share of Largest Ethnic
Community in County
Population
Second Largest Ethnic
Community
Third Largest Ethnic
Community
Baringo Kalenjin 92.2% Kikuyu Luhya
Bomet Kalenjin 95.7% Kikuyu Maasai
Bungoma Luhya 82.9% Kalenjin Teso
Busia Luhya 57.2% Teso Luo
Elgeyo Marakwet Kalenjin 92.6% Luhya Others
Embu Embu 50.4% Mbeere Kamba
Garissa Somali 79.6% Others Kamba
Homa Bay Luo 87.5% Basuba Kisii
Isiolo Borana 37% Somali Samburu
Kajiado Maasi 44.5% Maasai Kamba
Kakamega Luhya 92.4% Luo Kikuyu
Kericho Kalenjin 87.5% Kisii Luo
Kiambu Kikuyu 80.9% Kamba Luhya
Kilifi Miji Kenda 86.5% Kamba Swahili
Kirinyaga Kikuyu 95.2% Kamba Embu
Kisii Kisii 96.5% Luo N/A
Kisumu Luo 88.9% Luhya Kalenjin
Kitui Kamba 96.6% Tharaka Kikuyu
Kwale Miji Kenda 82.7% Kamba Luhya
Laikipia Kikuyu 63% Maasai Kalenjin
Lamu Swahili 30.2% Kikuyu Mijikenda
Machakos Kamba 91% Kikuyu Luhya
Makueni Kamba 98.1% Kikuyu Luhya
Mandera Somali 97.6% Gabra Swahili
Marsabit Gabra 28.7% Borana Rendille
Meru Meru 93.7% Kikuyu Tharaka
Migori Luo 60.2% Kuria Luhya
Mombasa Miji Kenda 30.1% Kamba Luo
Muranga Kikuyu 94% Luhya Kamba
Nairobi Kikuyu 29.4% Kamba Luo
Nakuru Kikuyu 52.4% Kalenjin Luhya
Nandi Kalenjin 77.4% Luhya Luo
Narok Maasai 51.4% Kalenjin Kikuyu
Nyamira Kisii 97.2% Luo N/A
Nyandarua Kikuyu 96.3% Luhya Kisii
Nyeri Kikuyu 94% Meru N/A

DV410 Page 34 of 35 91345
Samburu Samburu 78.8% Turkana Kikuyu
Siaya Luo 94.8% Luhya Kalenjin
Taita Taveta Taita 63.3% Kamba Taveta
Tana River Pokomo 27.5% Orma Wardei
Tharaka Nithi Meru 54.8% Tharaka Turkana
Trans Nzoia Luhya 52% Kalenjin Kikuyu
Turkana Turkana 94.3% Others Luhya
Uasin Gishu Kalenjin 58.1% Luhya Kikuyu
Vihiga Luhya 95.5% Luo Kalenjin
Wajir Somali 98.7% Gabra N/A
West Pokot Kalenjin 95.1% Luhya Turkana
Source: See Socio-Economic Atlas of Kenya (Weismann et al., 2016).
Appendix 4: The Public Spending Priorities of Kenyan Citizens
Figure A.1 – The Public Spending Priorities of Kenyan Citizens (Devolved Functions)
Source: Afrobarometer, Round 6. N = 2220. Respondents were asked, “If the government of this country could increase its spending, which of the following areas do you think should be the top priority for additional investment?” Respondents were allowed to list their first and second priorities. Both first and second priorities were combined to ascertain the cumulative frequency of responses reported above (in %). Note: only when first and/or second priorities listed devolved functions are they included. For a graphical depiction of all responses, see Figure A.2 below.
0%
5%
10%
15%
20%
25%
30%
35%
Infrastructure Healthcare Agric. Development Water/Sanitation
Fre
qu
en
cy o
f R
esp
on
ses
(%)
Kenyan Public Spending PrioritiesSelf-Reported Responses from Afrobarometer Survey
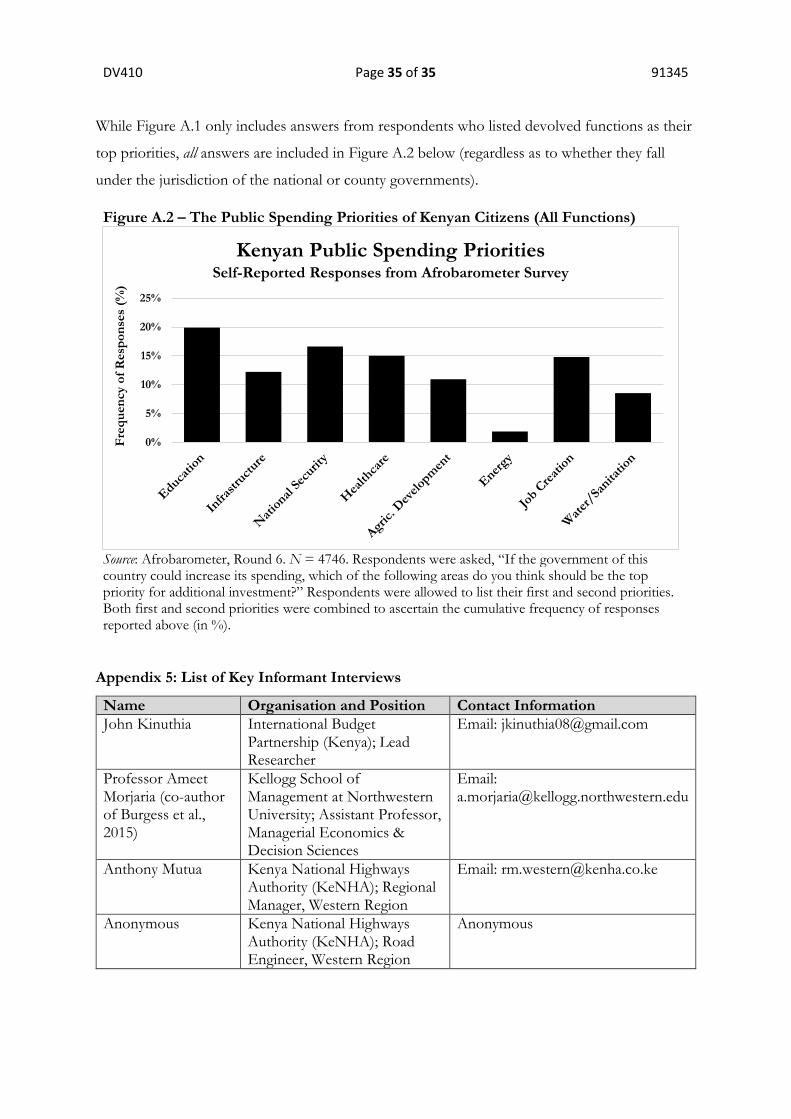
DV410 Page 35 of 35 91345
While Figure A.1 only includes answers from respondents who listed devolved functions as their
top priorities, all answers are included in Figure A.2 below (regardless as to whether they fall
under the jurisdiction of the national or county governments).
Figure A.2 – The Public Spending Priorities of Kenyan Citizens (All Functions)
Source: Afrobarometer, Round 6. N = 4746. Respondents were asked, “If the government of this country could increase its spending, which of the following areas do you think should be the top priority for additional investment?” Respondents were allowed to list their first and second priorities. Both first and second priorities were combined to ascertain the cumulative frequency of responses reported above (in %).
Appendix 5: List of Key Informant Interviews
Name Organisation and Position Contact Information
John Kinuthia International Budget Partnership (Kenya); Lead Researcher
Email: [email protected]
Professor Ameet Morjaria (co-author of Burgess et al., 2015)
Kellogg School of Management at Northwestern University; Assistant Professor, Managerial Economics & Decision Sciences
Email: [email protected]
Anthony Mutua Kenya National Highways Authority (KeNHA); Regional Manager, Western Region
Email: [email protected]
Anonymous Kenya National Highways Authority (KeNHA); Road Engineer, Western Region
Anonymous
0%
5%
10%
15%
20%
25%
Fre
qu
en
cy o
f R
esp
on
ses
(%)
Kenyan Public Spending PrioritiesSelf-Reported Responses from Afrobarometer Survey