private sector house condition survey 2014 hotspot areas
TRANSCRIPT
PRIVATE SECTOR HOUSE CONDITION
SURVEY 2014
HOTSPOT AREAS
REPORT OF SURVEY
Prepared on behalf of
Sunderland City Council
David Adamson & Partners Ltd.
October 2014
Ref: E2420

David Adamson & Partners Ltd. Page | 1
PRIVATE SECTOR HOUSE CONDITION SURVEY 2014
TABLE OF CONTENTS
SUMMARY OF MAIN FINDINGS
ACKNOWLEDGEMENTS
1.0 SURVEY BACKGROUND AND METHODOLOGY ............................................................... 10
Chapter 1: Introduction and Background to the Study ..................................................... 11
Chapter 2: Survey Method and Response ....................................................................... 12
Chapter 3: The Measurement of Housing Conditions ...................................................... 14
Chapter 4: Survey Analysis and Reporting Framework ................................................... 16
2.0 A PROFILE OF THE PRIVATE HOUSING SECTOR ........................................................... 17
Chapter 5: The Characteristics and Distribution of Private Sector Housing .................... 18
Chapter 6: The Characteristics and Distribution of Private Sector Households ............... 23
3.0 PRIVATE SECTOR HOUSING CONDITIONS - AN OVERVIEW AND NATIONAL
PERSPECTIVE ...................................................................................................................... 31
Chapter 7: Housing Conditions 2014 - An Overview ........................................................ 32
Chapter 8: Housing Conditions 2014 - National Context ................................................. 34
4.0 PRIVATE SECTOR HOUSING CONDITIONS 2014 ............................................................. 35
Chapter 9: HHSRS Category 1 Hazards .......................................................................... 36
Chapter 10: Housing Disrepair ........................................................................................... 41
Chapter 11: Housing Amenities and Facilities .................................................................... 48
Chapter 12: Home Energy Efficiency ................................................................................. 51
Chapter 13: Decent Homes Overall Performance .............................................................. 57
Chapter 14: Non-Decent Homes - Investment Needs ........................................................ 60
Chapter 15: Decent Places - Environment Conditions ....................................................... 62
5.0 HOUSING CONDITIONS AND HOUSEHOLD CIRCUMSTANCES ..................................... 66
Chapter 16: Housing Conditions and Household Circumstances ...................................... 67
Chapter 17: Fuel Poverty ................................................................................................... 69
Chapter 18: Housing and Health ........................................................................................ 74
Chapter 19: Household Attitudes to Housing and Local Areas .......................................... 82
6.0 SECTORAL REVIEW ............................................................................................................ 86
Chapter 20: Comparative Conditions - Owner Occupied and Private Rented
Sectors ............................................................................................................ 87
Chapter 21: Owner occupiers in Non-decent Homes ......................................................... 89

David Adamson & Partners Ltd. Page | 2
PRIVATE SECTOR HOUSE CONDITION SURVEY 2014
Chapter 22: The Private Rented Sector ............................................................................. 94
7.0 CONCLUSIONS .................................................................................................................... 95
Chapter 23: Conclusions .................................................................................................... 96
LIST OF TABLES
LIST OF FIGURES
APPENDICES Appendix A: The Interpretation of Statistical Data
Appendix B: Sampling Errors
Appendix C: Survey Questionnaire
Appendix D: The Decent Homes Standard
Appendix E: Glossary of Terms

David Adamson & Partners Ltd. Page | 3
PRIVATE SECTOR HOUSE CONDITION SURVEY 2014
SUMMARY OF MAIN FINDINGS
1.0 BACKGROUND
1.1 David Adamson & Partners Ltd. was commissioned by Sunderland City Council to complete
a review of housing and household conditions across the private housing sector within five
identified hotspot areas. The study provides a benchmark for private sector housing locally
against national housing conditions and provides information for the review and further
development of private sector housing strategies.
1.2 The 2014 study has involved a comprehensive survey programme across a sample of 527
dwellings representing 5.9% of all private dwellings in the hotspot areas. Survey
investigation has included physical housing conditions (HHSRS and Decent Homes), energy
efficiency (RdSAP) and the circumstances and attitudes of occupying households.
Household response to and cooperation with the survey programme was high with fewer
than 5% of private sector households refusing to take part.
1.3 The size and structure of the sample were designed to provide a hierarchy of reporting
across the hotspot areas with detailed reporting available across the areas and by main
tenure groups.
2.0 KEY FINDINGS: HOUSING STOCK AND HOUSEHOLDS
2.1 Collectively, the five hotspot areas contain a private sector housing stock of 8,981 dwellings
occupied by 7,749 households and a population of 17,315 persons.
2.2 Private sector housing in the hotspot areas varies from the national profile, showing higher
concentrations of older housing significantly higher rates of private-rental. In these areas,
6,364 dwellings (70.9%) were constructed pre-1919 compared to 22.2% of private housing
nationally; 700 dwellings (7.8%) were constructed post-1980 compared to 22.6% of private
housing nationally. The proportion of flats in the hotspot areas is below the national
average, whilst 15.2% of private sector dwellings in England are flats the equivalent figure
for the hotspot areas is 9.1%.
2.3 Owner occupation represents the largest form of private sector tenure – 4,944 dwellings
(55.1%) but rates of private rental are significantly greater than nationally. In 2014, 3,343
dwellings in the hotspot areas are privately rented representing 37.2% of private sector
housing stock compared to 21.8% during 2012 nationally.

David Adamson & Partners Ltd. Page | 4
PRIVATE SECTOR HOUSE CONDITION SURVEY 2014
SUNDERLAND HOTSPOTS 2014 ENGLAND 2012
HOUSING TENURE dwellings % % Owner occupied 4,944 55.1 78.2 Private rented 3,343 37.2 21.8 Unobtainable 694 7.7 -
2.4 Highest rates of private rental are found in Eden Vale (46.8%) and Millfield/ Pallion (37.6%).
2.5 Household demographic and social characteristics vary by tenure reflecting a younger, more
mobile private rented sector and an older, residentially established owner occupied sector.
13.5% of private rented households are headed by a person aged less than 25 years, 34.1%
of owner occupied households are headed by a person aged 65 years and over. Household
type distributions reflect the demographic differences between tenures. 24.8% of private
rented households comprise a single person aged less than 60 years; 45.2% of owner
occupied households contain at least one individual aged 60 or over.
2.6 4,424 heads of household (57.1%) are in full or part-time employment, 366 heads of
household (4.7%) are registered unemployed and 2,046 heads of household (26.4%) are
economically retired. Median household income is estimated at £24,700 compared to a
current UK average of £33,000.
2.7 2,126 households (27.4%) are in receipt of means-tested or disability related benefits and
are economically vulnerable; 1,636 households (21.1%) are on low incomes. There is a
significant degree of overlap between these groups, such that 869 households are both
classified as economically vulnerable and also as on low income.
2.8 Household economic circumstances are significantly worse in the private rented sector:
KEY FACTS: 9.9% of heads of household in the private rented sector are unemployed compared to 1.5% of owner occupied households; Median household income within the private rented sector is estimated at £19,240 compared to £27,300 in the owner occupied sector; 41.5% of private rented households are on low incomes compared to 8.2% of owner occupied households.
David Adamson & Partners Ltd. Page | 5
PRIVATE SECTOR HOUSE CONDITION SURVEY 2014
3.0 KEY FINDINGS- HOUSING CONDITIONS 2013
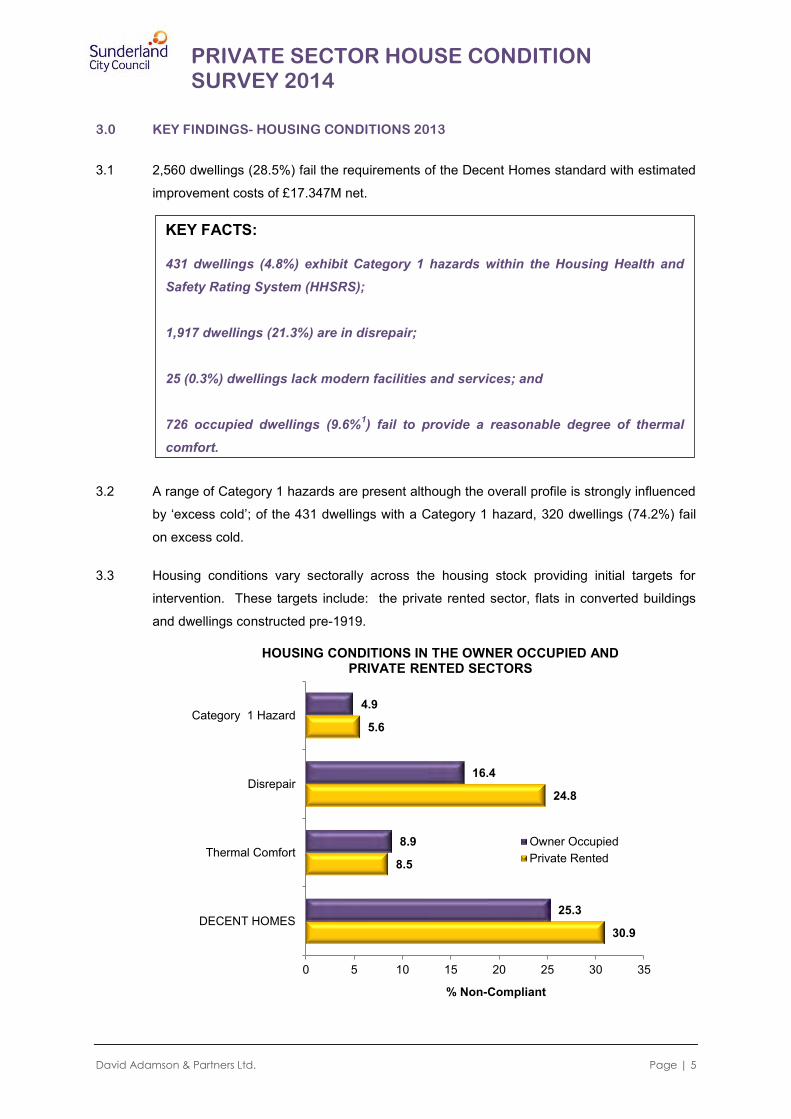
3.1 2,560 dwellings (28.5%) fail the requirements of the Decent Homes standard with estimated
improvement costs of £17.347M net.
3.2 A range of Category 1 hazards are present although the overall profile is strongly influenced
by ‘excess cold’; of the 431 dwellings with a Category 1 hazard, 320 dwellings (74.2%) fail
on excess cold.
3.3 Housing conditions vary sectorally across the housing stock providing initial targets for
intervention. These targets include: the private rented sector, flats in converted buildings
and dwellings constructed pre-1919.
30.9
8.5
24.8
5.6
25.3
8.9
16.4
4.9
0 5 10 15 20 25 30 35
DECENT HOMES
Thermal Comfort
Disrepair
Category 1 Hazard
% Non-Compliant
HOUSING CONDITIONS IN THE OWNER OCCUPIED AND PRIVATE RENTED SECTORS
Owner OccupiedPrivate Rented
KEY FACTS: 431 dwellings (4.8%) exhibit Category 1 hazards within the Housing Health and Safety Rating System (HHSRS);
1,917 dwellings (21.3%) are in disrepair;
25 (0.3%) dwellings lack modern facilities and services; and 726 occupied dwellings (9.6%1) fail to provide a reasonable degree of thermal comfort.
David Adamson & Partners Ltd. Page | 6
PRIVATE SECTOR HOUSE CONDITION SURVEY 2014
3.4 Geographically, conditions are significantly worse in the hotspot areas of Southwick (46.4%
non-decent) and Coalfield Collection / Easington Lane (35.3%).
4. KEY FINDINGS - HOUSING AND HOUSEHOLD ISSUES
4.1 Poor housing conditions are compounded by the socio-economic characteristics of private
sector households. As such, poor housing conditions are over-represented in economically
and socially disadvantaged households including the elderly, the economically vulnerable
and those on low incomes.
4.2 The private housing sector contains 2,126 vulnerable households. Currently 1,449
vulnerable households (68.2%) live in decent homes. This figure remains below the
Government’s previous PSA Target 7 guidelines for 2011 (70%) and 2021 (75%).
4.4 640 households in the hotspot areas of Sunderland (8.3%) are estimated to be in fuel
poverty. The relationship between fuel poverty and household economic circumstances is
both obvious and well documented. Demographically, fuel poverty in the hotspot areas
impacts most strongly on both younger and older households. Rates of fuel poverty are
above the average for households living in the private rented sector and in pre-1919
terraced housing. Geographically the highest rates of fuel poverty are recorded in Eden
Vale and Southwick.
4.5 1,764 households in the hotspot areas (22.8%) indicated that at least one household
member was affected by a long-term illness or disability. The most common complaints
were related to heart/circulatory problems, mobility impairment or physical disability, and
respiratory illness.
4.6 Long-term illnesses and disability place significant pressure on local Health Service
resources. 89% of affected households had made health service contact in the past year
with predominant contact through GP and hospital outpatient services.
4.7 481 households (6.2%) thought that their current housing conditions impacted negatively on
their family’s health. Among those perceiving a negative effect 235 households (48.8%) live
in non-decent homes. Overall 10.4 per cent of households living in non-decent homes
perceive a negative impact on family health. This compares with 4.5% of households living
in decent homes.

David Adamson & Partners Ltd. Page | 7
PRIVATE SECTOR HOUSE CONDITION SURVEY 2014
4.8 Linking national data on savings to the NHS from removing Category 1 hazards1 with local
data on the costs of removing the hazards provides an estimate of the annual NHS savings
through one-off intervention to address Category 1 hazards of £0.025M.
4.9 While housing conditions are significantly worse for households living in the private rented
sector owner occupiers are not unaffected. 1,243 owner occupied households (26.2%) live
in homes which are non-decent with total outstanding improvements of £7.279M. 345
households within this sector are economically vulnerable, 343 households while not
economically vulnerable are elderly.
4.10 Economic factors will influence the ability of owner occupiers to improve their homes but
other factors will also impact. 97.6% of owner occupiers in non-decent housing are satisfied
with their current home; only 2.4% expressed direct dissatisfaction. Against this
background, 712 owner occupiers in non-decent homes (57.3%) have completed no major
repairs/improvements in the last 5 years; 995 households (80%) have no intentions to carry
out future repairs/improvements in the next 5 years.
4.11 Just over half of owner occupied households have no existing mortgage/financial
commitments against their home. Taking into account existing mortgage holdings and local
property values equity potential of £339.986 million exists within the owner occupied sector.
The central issue locally is not the existence of owner occupied equity but the release of this
equity for home improvement/repair. Among owner occupiers in non-decent housing 18.4%
of households stated that they would re-mortgage for home improvements, 24.3% are
interested in Council interest free loans.
4.12 Tenant attitudes to private rented accommodation are on balance positive they are however
less positive than for owner occupiers. 256 private rented tenants (8.5%) were dissatisfied
with their current accommodation compared to 2.3% of owner occupiers.
5. KEY FINDINGS - STRATEGY DIRECTIONS
5.1 The 2014 survey provides a comprehensive base of housing and household information to
review the effectiveness of existing housing strategies and to determine future strategy
directions. Key directions identified include:
Continued intervention in the private rented sector including landlord
encouragement for home improvement and energy efficiency.
Continued support for vulnerable households in non-decent homes across all tenure sectors.
1 ‘Quantifying the economic cost of unhealthy housing – a case study from England’, 2011, S. Nichol et al. For full explanation see section 19.11 of full report.
David Adamson & Partners Ltd. Page | 8
PRIVATE SECTOR HOUSE CONDITION SURVEY 2014
Encouragement of owner occupied home improvement through increased awareness of condition issues and possible use of loan support.
Exploitation of energy funding streams including Green Deal and ECO funding within a comprehensive fuel poverty strategy.
More detailed examination of health service partnerships for housing intervention.

David Adamson & Partners Ltd. Page | 9
PRIVATE SECTOR HOUSE CONDITION SURVEY 2014
ACKNOWLEDGEMENTS
David Adamson & Partners Ltd. wishes to thank the residents of Sunderland City Council without
whose cooperation this survey would not have been possible. We would also like to thank
Sunderland City Council staff for their support and assistance throughout the project.

David Adamson & Partners Ltd. Page |10
SECTION 1:
SURVEY BACKGROUND AND METHODOLOGY
Chapter 1: Introduction and Background to the Study
Chapter 2: Survey Method and Response
Chapter 3: The Measurement of Housing Conditions
Chapter 4: Survey Analysis and Reporting Framework

David Adamson & Partners Ltd. Page |11
SURVEY BACKGROUND AND METHODOLOGY
1.0 INTRODUCTION AND BACKGROUND TO THE STUDY
1.1 This report presents the findings of a comprehensive survey of housing conditions across
five specific locations within the private housing sector in the Sunderland City Council area.
These areas form part of the overall survey covering the whole of the Council area, but are
considered separately here. The survey has been completed by David Adamson & Partners
Ltd. on behalf of Sunderland City Council.
1.2 Information from the survey will inform the continued review and development of private
sector housing strategies within the specific locations, and along with the overall position will
update existing Council information derived from a previous survey programme completed in
2006 and reported in 2007. The 2014 survey creates an important new benchmark for the
refinement and further development of private sector housing strategies.
1.3 This report provides a detailed overview of survey findings. In seven main sections the
report examines:
Section 1: Survey Background and Methodology;
Section 2: A Profile of the Private Housing Sector;
Section 3: Private Sector Housing Conditions - An Overview;
Section 4: Private Sector Housing Conditions 2013;
Section 5: Housing Conditions and Household Circumstances;
Section 6: Sectoral Review; and
Section 7: Conclusions. Survey analyses are supported by technical appendices including the survey questionnaire,
advice on sampling error, guidance on the interpretation of statistical data, and key survey
definitions/housing standards. Data from the survey programme has also been provided
electronically for further use by the Council.
1.4 The views expressed in this report are those of the consultants and do not necessarily
reflect the official views of Sunderland City Council.
David Adamson & Partners Ltd. Page |12
SURVEY BACKGROUND AND METHODOLOGY
2.0 SURVEY METHOD AND RESPONSE
2.1 The Government requires that private sector housing conditions are known and understood
on an on-going basis and duly acted upon. The Housing Act 2004 states that ‘a local
authority must keep the housing conditions in their area under review with a view to
identifying any action that may need to be taken by them.’ Good practice dictates that
private sector house condition surveys are conducted every five years and no longer than
every seven years.
2.2 The last survey of private sector housing was conducted by Sunderland City Council in 2006
and reported in 2007. The Council is aware that there has been substantial change in the
condition and use of the private sector housing stock since then. As a result the Council
requires up-to-date information to develop private sector housing strategies and to prioritise
housing support and investment to areas/individuals in greatest need.
2.3 The objectives for the house condition survey were clearly defined by Sunderland City
Council. Information from the survey should:
Identify the extent to which the Council may need to exercise its duties and powers in relation to the Housing Act 2004, including the Housing, Health and Safety Rating System (HHSRS), houses in multiple occupation, non-decent homes, empty homes and area renewal work in relation to both private rented and owner occupied tenures, but particularly in the private rented sector.
Enable the Council to develop and refine its approach to tackling fuel poverty and the gathering of data relating to baseline SAP ratings.
Enable the Council to make more informed decisions about the targeting of housing resources and to determine spending priorities. This will include assessing the extent to which households in the private sector may be able to access loans to undertake the necessary renovation/s in line with the Regulatory Reform Order.
Provide a socio-economic profile of households living in the private sector, including identifying the number of vulnerable people who live in non-decent accommodation and the key relationships between stock conditions, fuel poverty and other forms of need (including older persons and people with disabilities).
The findings of the survey should be set in the context of national or regional data where
possible.
2.4 A sample size of 500 dwellings was agreed with the Council representing 5.6% of a total
private sector housing stock of 8,981 dwellings within the specified hotspot areas. Survey

David Adamson & Partners Ltd. Page |13
SURVEY BACKGROUND AND METHODOLOGY
investigation has included physical housing conditions (Decent Homes, HHSRS), energy
efficiency and the circumstances and attitudes of occupying households. The sample of
dwellings for the survey was selected using a stratified sample design based on
geographical distributions. Sample sizes were derived to provide a minimum coverage of 50
in the smaller areas, table 1 illustrates the sample sizes targeted and obtained in each area.
TABLE 1: SAMPLE STRUCTURE
HOTSPOT HOUSING
STOCK TARGET SAMPLE
ACHIEVED SAMPLE
dwgs dwgs dwgs Coalfield Collection/ Easington Lane 2384 100 102 Eden Vale 2645 150 158 Millfield Pallion 2643 150 141 New Silksworth Cottages 752 50 51 Southwick 557 50 69 ALL STRATA 8981 500 527
2.5 To achieve the target sample of 500 surveys a sample of 1,000 addresses was issued
representing an expected access rate of 50%. From the issued sample, refusals were
received from only 44 households representing a refusal rate of 4.4%. The completed
sample of 527 surveys permits analysis across the main private sector tenure groups (owner
occupied and private rented) and an analysis of findings at hotspot area level.
2.6 Sample data has been grossed-up statistically to represent total private sector housing
stock. Grossing also adjusts for the disproportionate sample sizes across the hotspot
framework and for differential access and response rates. Issues on the interpretation of
grossed statistical data are outlined in Appendix A while sampling errors associated with
survey data are presented in Appendix B.
2.7 The survey generates a wide range of information on the condition of housing and on the
circumstances and attitudes of its residents. Copies of the survey questionnaire are
attached at Appendix C. The physical survey inspection has included general housing
condition/repair, the Decent Homes Standard, housing health and safety rating system and
energy efficiency. Household interviews have included information on the socio economic
circumstances of households, housing support needs with regard to illness/disability,
household attitudes to housing and local community issues and owner occupied interest in
equity release and improvement loan support.

David Adamson & Partners Ltd. Page |14
SURVEY BACKGROUND AND METHODOLOGY
3. THE MEASUREMENT OF HOUSING CONDITIONS
3.1 The measurement of housing conditions has been conducted within the decent homes
framework. The Government’s housing objective is to ensure that everyone has the
opportunity of a decent home and so promote social cohesion, wellbeing and self-
dependence. A decent home is one that satisfies all of the following four criteria:
It meets the current statutory minimum standard for housing;
It is in a reasonable state of repair;
It has reasonably modern facilities and services; and
It provides a reasonable degree of thermal comfort.
A full definition of this standard is attached in Appendix D.
3.2 MINIMUM STATUTORY STANDARDS. The Housing Act 2004 (Chapter 34) introduced a
system for assessing housing conditions and enforcing housing standards. This system
which replaced the former test of fitness for human habitation (Section 604, Housing Act
1985) operates by reference to the existence of category 1 or category 2 hazards in
residential premises as assessed within the Housing Health and Safety Rating System
(HHSRS - Version 2). For the purposes of the current survey the presence of category 1
hazards has been assumed to represent statutory failure. These are hazards falling within
HHSRS bands A, B or C and accruing hazard scores of 1,000 points or more.
3.3 DISREPAIR. Many homes while not exhibiting Category 1 hazards may present evidence of
disrepair which can threaten the structural integrity of the building, its wind and
weatherproofing and the health and safety of the occupants. Identification of such homes
provides an important indicator of housing stock ‘at risk’ of future physical deterioration.
Definitions of disrepair have varied nationally over time. For the purposes of this survey,
homes in disrepair are defined as those failing to meet decent homes repair criteria. A home
is in disrepair under this definition if:
One or more key building components are old and because of their condition need replacement or major repair;
Two or more secondary building components are old, and because of their condition need replacement or major repair.
A full definition of building components, life expectancies and condition defects under the
decent homes standard is included in Appendix D.

David Adamson & Partners Ltd. Page |15
SURVEY BACKGROUND AND METHODOLOGY
3.4 ENERGY EFFICIENCY. Information on home energy efficiency was collected against the
thermal comfort requirements of the decent homes standard and also subjected to an energy
efficiency audit within the RDSAP framework. Decent homes thermal comfort requirements
are outlined fully in Appendix D. Key indicators used from the energy efficiency audit include:
SAP rating (Standard Assessment Procedure);
Carbon dioxide emissions (CO2);
Energy costs; and
Energy efficiency rating (EER).
A full definition of these indicators is included in Appendix E - glossary of terms.
3.5 REPAIR AND IMPROVEMENT COSTS. Automated schedules of rates have been applied to
condition data generated by the survey to assess potential investment needs within the
private sector. Key cost outputs include:
a) Patch Repair: Cost to address visible disrepair. Costs are based on a patch and mend approach, using like-for-like materials and with no guarantee of medium to long-term building integrity.
b) Comprehensive Repair: Patch repair costs together with any additional works required to ensure building integrity and sound condition over a 10 year period.
c) Thirty Year Life Cycle: Patch repair costs together with full building life cycle replacement costs over a typical 30 year planning period.
d) Category 1 hazards: Costs to address Category 1 hazards within the HHSRS.
e) Decent Homes: Costs to improve non-Decent homes.
Survey costs are at first quarter 2014 and are presented net of fees, preliminaries,
contingencies and VAT.

David Adamson & Partners Ltd. Page |16
SURVEY BACKGROUND AND METHODOLOGY
4. SURVEY ANALYSIS AND REPORTING FRAMEWORK
4.1 The sample size of 527 completed surveys provides a hierarchy of reporting across the
hotspot areas including:
a) Detailed survey reporting across the five hotspot areas; and b) Detailed survey reporting within each of the main private sector tenure groups:
owner occupied/private rented.

David Adamson & Partners Ltd. Page |17
SECTION 2:
A PROFILE OF THE PRIVATE HOUSING SECTOR
Chapter 5: The Characteristics and Distribution of Private Sector Housing
Chapter 6: The Characteristics and Distribution of Private Sector Households

David Adamson & Partners Ltd. Page |18
A PROFILE OF THE PRIVATE HOUSING SECTOR
5. THE CHARACTERISTICS AND DISTRIBUTION OF PRIVATE SECTOR HOUSING
HOUSING OCCUPANCY
5.1 The hotspot areas comprise a total private sector housing stock of 8,981 dwellings. At the
time of survey, 7,547 dwellings (84.0%) were occupied; the remaining 1,435 dwellings
(16.0%) were vacant. The majority of vacant dwellings – 1,301 dwellings (14.5% of all
dwellings) are transitional in nature and could return to full occupancy in the short term. The
remaining 134 vacant dwellings (1.5%) are long-term vacant having been unoccupied for
over 6 months. Vacancy rates are significantly above normal housing market turnover
expectations; during 2012 the average vacancy rate (all vacants) for private sector housing
across England was 4.7% (English Housing Survey, Headline Report 2012-13, CLG). 8,723
dwellings (97.1%) are designed for single occupation, the remaining 258 dwellings (3.3%)
are currently designed for, but not necessarily in, multiple occupation.
HOUSING AGE
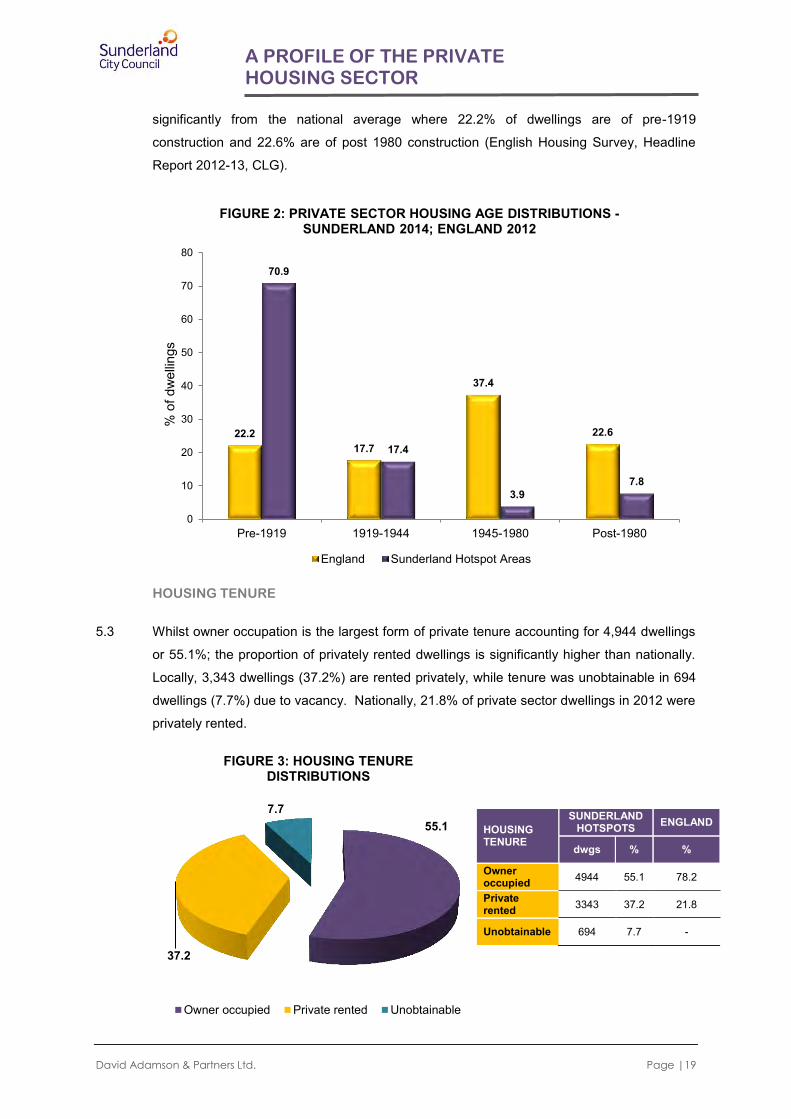
5.2 The age of a home is strongly associated with its condition and energy performance. The
oldest homes (pre-1919) generally perform less well in these respects than newer homes.
The private sector housing stock within the hotspot locations in Sunderland is predominately
of pre-1945 construction. 6,364 dwellings (70.9%) were constructed pre-1919 and a further
1,566 dwellings (17.4%) were constructed between 1919 and 1944. Approximately 350
private sector dwellings in the hotspots were built between 1945 and 1981, since when a
further 700 dwellings have been built. Private sector housing stock in these areas differs
Occupied: 7,547 dwgs, (84%)
Vacant: 1,435 dwgs, (16%)
FIGURE 1: HOUSING OCCUPANCY
VACANCY STATUS (1,435 dwellings) Vacant - For Sale/Rent - 813 dwgs
Vacant - Modernisation - 488 dwgs
Vacant - Other Long Term - 134 dwgs
David Adamson & Partners Ltd. Page |19
A PROFILE OF THE PRIVATE HOUSING SECTOR
significantly from the national average where 22.2% of dwellings are of pre-1919
construction and 22.6% are of post 1980 construction (English Housing Survey, Headline
Report 2012-13, CLG).
HOUSING TENURE
5.3 Whilst owner occupation is the largest form of private tenure accounting for 4,944 dwellings
or 55.1%; the proportion of privately rented dwellings is significantly higher than nationally.
Locally, 3,343 dwellings (37.2%) are rented privately, while tenure was unobtainable in 694
dwellings (7.7%) due to vacancy. Nationally, 21.8% of private sector dwellings in 2012 were
privately rented.
22.2 17.7
37.4
22.6
70.9
17.4
3.9 7.8
0
10
20
30
40
50
60
70
80
Pre-1919 1919-1944 1945-1980 Post-1980
% o
f dw
ellin
gs
FIGURE 2: PRIVATE SECTOR HOUSING AGE DISTRIBUTIONS - SUNDERLAND 2014; ENGLAND 2012
England Sunderland Hotspot Areas
HOUSING TENURE
SUNDERLAND HOTSPOTS ENGLAND
dwgs % %
Owner occupied 4944 55.1 78.2
Private rented 3343 37.2 21.8
Unobtainable 694 7.7 -
55.1
37.2
7.7
FIGURE 3: HOUSING TENURE DISTRIBUTIONS
Owner occupied Private rented Unobtainable

David Adamson & Partners Ltd. Page |20
A PROFILE OF THE PRIVATE HOUSING SECTOR
BUILDING/DWELLING TYPE
5.4 Houses and bungalows comprise 8,163 dwellings (90.9%) with the remaining 818 dwellings
(9.1%) in flats. Houses and bungalows are primarily terraced (95.3%) with only limited
numbers of semi-detached and detached properties; flats are split between purpose-built
and converted buildings.
5.5 The distribution of building types within the hotspot areas differ significantly from the national
distribution, with significantly more terraced houses and bungalows and fewer semi-
detached and detached houses.
HOUSING CHARACTERISTICS BY TENURE VARIATIONS
5.6 Housing characteristics differ slightly between the main tenure groups with flats particularly
associated with the private rented sector. 676 private rented dwellings (20.2%) are flats
compared to 1.8% of owner occupied dwellings.
BUILDING TYPES
SUNDERLAND HOTSPOTS
ENGLAND 2012
dwgs % %
Terraced House 5662 63.0 27.9
Semi-Detached House 252 2.8 27.7
Detached House 82 0.9 20.7
Bungalows 2167 24.1 8.5
Purpose Built Flat 381 4.2 10.9
Converted Flat 437 4.9 4.3 86.6
3.2
1.1 4.2 4.9
FIGURE 4: BUILDING TYPES
Terraced House/Bungalow Semi-Det House/Bungalow
Detached House/Bungalow Purpose Built Flat
Converted Flat
David Adamson & Partners Ltd. Page |21
A PROFILE OF THE PRIVATE HOUSING SECTOR
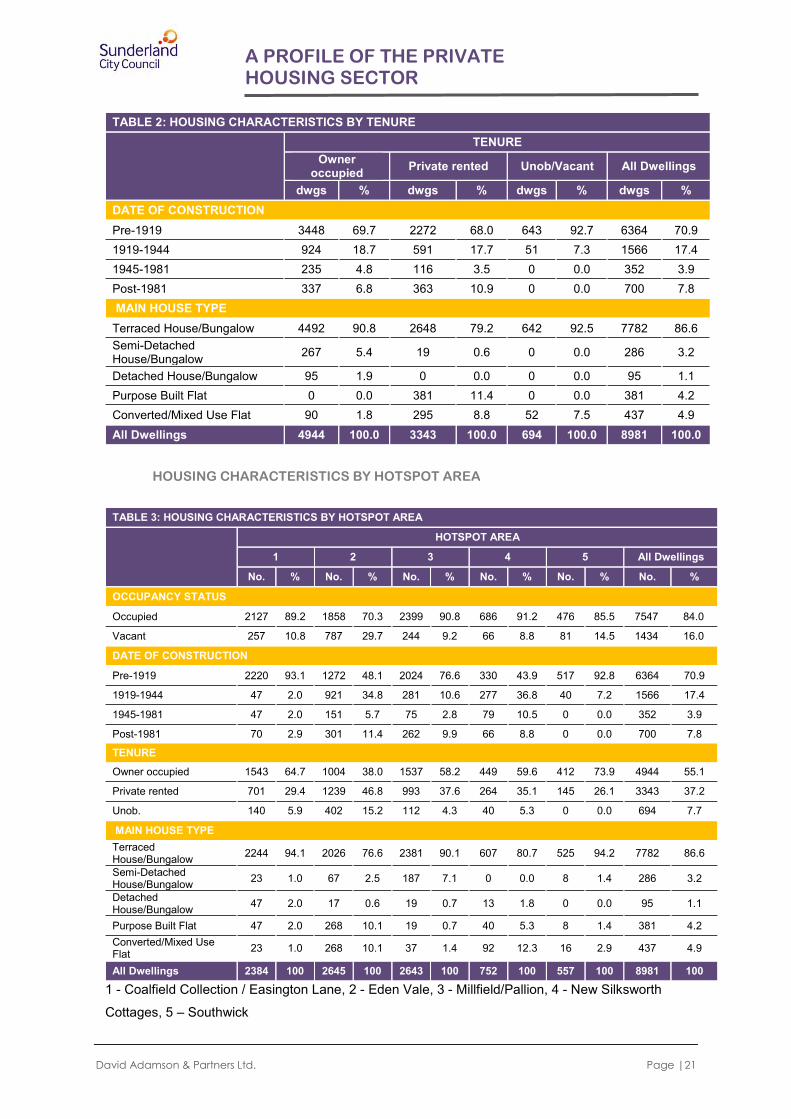
TABLE 2: HOUSING CHARACTERISTICS BY TENURE
TENURE Owner
occupied Private rented Unob/Vacant All Dwellings
dwgs % dwgs % dwgs % dwgs % DATE OF CONSTRUCTION Pre-1919 3448 69.7 2272 68.0 643 92.7 6364 70.9 1919-1944 924 18.7 591 17.7 51 7.3 1566 17.4 1945-1981 235 4.8 116 3.5 0 0.0 352 3.9 Post-1981 337 6.8 363 10.9 0 0.0 700 7.8 MAIN HOUSE TYPE Terraced House/Bungalow 4492 90.8 2648 79.2 642 92.5 7782 86.6 Semi-Detached House/Bungalow 267 5.4 19 0.6 0 0.0 286 3.2
Detached House/Bungalow 95 1.9 0 0.0 0 0.0 95 1.1 Purpose Built Flat 0 0.0 381 11.4 0 0.0 381 4.2 Converted/Mixed Use Flat 90 1.8 295 8.8 52 7.5 437 4.9 All Dwellings 4944 100.0 3343 100.0 694 100.0 8981 100.0
HOUSING CHARACTERISTICS BY HOTSPOT AREA
TABLE 3: HOUSING CHARACTERISTICS BY HOTSPOT AREA
HOTSPOT AREA
1 2 3 4 5 All Dwellings
No. % No. % No. % No. % No. % No. %
OCCUPANCY STATUS
Occupied 2127 89.2 1858 70.3 2399 90.8 686 91.2 476 85.5 7547 84.0
Vacant 257 10.8 787 29.7 244 9.2 66 8.8 81 14.5 1434 16.0
DATE OF CONSTRUCTION
Pre-1919 2220 93.1 1272 48.1 2024 76.6 330 43.9 517 92.8 6364 70.9
1919-1944 47 2.0 921 34.8 281 10.6 277 36.8 40 7.2 1566 17.4
1945-1981 47 2.0 151 5.7 75 2.8 79 10.5 0 0.0 352 3.9
Post-1981 70 2.9 301 11.4 262 9.9 66 8.8 0 0.0 700 7.8
TENURE
Owner occupied 1543 64.7 1004 38.0 1537 58.2 449 59.6 412 73.9 4944 55.1
Private rented 701 29.4 1239 46.8 993 37.6 264 35.1 145 26.1 3343 37.2
Unob. 140 5.9 402 15.2 112 4.3 40 5.3 0 0.0 694 7.7
MAIN HOUSE TYPE Terraced House/Bungalow 2244 94.1 2026 76.6 2381 90.1 607 80.7 525 94.2 7782 86.6
Semi-Detached House/Bungalow 23 1.0 67 2.5 187 7.1 0 0.0 8 1.4 286 3.2
Detached House/Bungalow 47 2.0 17 0.6 19 0.7 13 1.8 0 0.0 95 1.1
Purpose Built Flat 47 2.0 268 10.1 19 0.7 40 5.3 8 1.4 381 4.2 Converted/Mixed Use Flat 23 1.0 268 10.1 37 1.4 92 12.3 16 2.9 437 4.9
All Dwellings 2384 100 2645 100 2643 100 752 100 557 100 8981 100
1 - Coalfield Collection / Easington Lane, 2 - Eden Vale, 3 - Millfield/Pallion, 4 - New Silksworth
Cottages, 5 – Southwick

David Adamson & Partners Ltd. Page |22
A PROFILE OF THE PRIVATE HOUSING SECTOR
5.7 The five hotspot areas vary with reference to the housing characteristics of private sector
dwellings within each. Whilst approximately 10% of dwellings in New Silksworth Cottages,
Coalfield Collection/ Easington Lane and Millfield/ Pallion are vacant, the rate increases to
almost 30% in Eden Vale. The vacant dwellings in Eden Vale account for over half of all the
empty private sector properties in the hotspot areas.
5.8 Over 90% of dwellings in Coalfield Collection/ Easington Lane and Southwick are of pre-
1919 construction compared to just less than 50% in Eden Vale and New Silksworth
Cottages. All five areas exhibit larger private rented sectors than the national average; there
are however significant differences amongst the areas, with 26.1% of dwellings in Southwick
privately rented whilst in Eden Vale the rate is 46.8%.

David Adamson & Partners Ltd. Page |23
A PROFILE OF THE PRIVATE HOUSING SECTOR
6. THE CHARACTERISTICS AND DISTRIBUTION
OF PRIVATE SECTOR HOUSEHOLDS
HOUSEHOLDS AND POPULATION
6.1 The occupied housing stock of 7,547 dwellings contains 7,749 households and a household
population of 17,315 persons. Private sector households are predominantly small in size.
2,225 households (28.7%) are single person in size; an additional 3,191 households
(41.2%) contain two persons. Average household size is estimated at 2.2 persons.
HOUSEHOLD DEMOGRAPHICS
6.2 Private sector households exhibit a broad demographic profile. 1,925 households (24.8%)
are headed by a person aged 65 years and over; 1,860 households (24.1%) are headed by
a person aged less than 35 years. Household type distributions are also mixed – 1,096
households (14.1%) contain one person aged over 59; 1,129 households (14.6%) comprise
a single person aged under 60 years. Married or cohabiting couples with or without children
comprise 4,367 households (56.3%).
0.4
3
10.8
14.6
41.2
28.7
0 10 20 30 40 50
Six+ Persons - 127 hholds
Five Persons - 235 hholds
Four Persons - 837 hholds
Three Persons - 1133 hholds
Two Persons - 3191 hholds
One Person - 2225 hholds
% of households
FIGURE 5: HOUSEHOLD SIZE

David Adamson & Partners Ltd. Page |24
A PROFILE OF THE PRIVATE HOUSING SECTOR
TABLE 4: PRIVATE SECTOR HOUSEHOLDS BY AGE OF HOH AND HOUSEHOLD TYPE AGE OF HEAD OF HOUSEHOLD
HHOLDS % HOUSEHOLD TYPE HHOLDS %
Under 25 years 407 5.3 One person under 60 1129 14.6 25-34 years 1453 18.8 One person aged 60 or over 1096 14.1
35-44 years 1202 15.5 Lone (grand)parent with dependent child(ren) 710 9.2
45-54 years 1629 21.0 Other multi-person household 447 5.8 55-64 years 1133 14.6 Couple no dependent children 3039 39.2 65 years and over 1925 24.8 Couple with dependent children 1328 17.1
ETHNICITY
6.3 7,092 households (91.5%) are of white British, Irish or other white origin. 8.5% of the
hotspot’s private sector households are of Black and Minority Ethnic origin, estimated at 657
households. The largest groupings are of Asian origin (297 households), however the
actual number of cases interviewed (18 of Asian origin) is insufficient to provide any reliable
analysis by ethnicity.
HOUSEHOLD OCCUPANCY
6.4 Linking dwelling size (number of bedrooms) to household demographics through the
Bedroom Standard provides indicators of household occupancy. 302 households (3.9%)
have insufficient bedrooms to meet family needs and are overcrowded; 1,792 households
(23.1%) have bedrooms equal to their needs; 5,656 households (72.9%) have bedrooms
available above their family needs and are in under-occupation.
3.9
23.1
41.7
31.2
FIGURE 6: HOUSEHOLD OCCUPANCY
Overcrowded - 302 hholds Bedrooms Equal Needs - 1,792 hholds
Under-occupied 1 bedroom - 3,235 hholds Under-occupied 2+ bedrooms - 2,421 hholds

David Adamson & Partners Ltd. Page |25
A PROFILE OF THE PRIVATE HOUSING SECTOR
6.5 Households within the private rented sector are less likely to be under-occupying their
properties; 80.7% of owner occupied households have bedrooms beyond their requirement
whilst the comparable figure for private rented households is 60.8%.
6.6 Lone parent families and married/co-habiting couples with dependent children account for
over 86% of households living in over-crowded conditions, with rates of over-crowding of
13.1% and 12.7% respectively.
RESIDENTIAL MOBILITY
6.7 Patterns of residential mobility within the hotspot area reflect a distinction between a volatile
and highly mobile private rented sector and a stable and established owner occupied sector.
3,490 owner occupied households (73.5%) have been resident in their current dwelling over
10 years compared to 249 private rented households (8.2%). In contrast, 1,847 private
rented households (61.5%) have been resident in their current dwelling under 2 years. Only
148 owner occupied households (3.1%) definitely intend to move within the next 12 months
compared to 317 private rented households (10.6%).
4
15.3
41.3 39.4
3.7
35.5
42.4
18.4
0
5
10
15
20
25
30
35
40
45
Over-crowded Bedrooms equal Need Under-occupied (1surplus bedroom)
Under-occupied (2+surplus bedroom)
% o
f h
ou
seh
old
s
FIGURE 7: OVER-CROWDING AND TENURE
Owner occupied Private rented

David Adamson & Partners Ltd. Page |26
A PROFILE OF THE PRIVATE HOUSING SECTOR
TABLE 5: RESIDENTIAL MOBILITY
LENGTH OF RESIDENCE Hholds % INTENTION TO MOVE Hholds %
Under 1 year 1151 14.8 No 6408 82.9
1 - 2 years 936 12.1 Don’t Know 407 5.3
3 - 5 years 917 11.8 Yes - Possibly 451 5.8
6 - 10 years 1007 13.0 Yes - Definitely 464 6.0
11 - 20 years 1074 13.1
Over 20 years 2725 35.2
6.8 Relationships between residential mobility and tenure give rise to a concentrated pattern of
recent movement within the hotspot areas focussed on areas of high private rental. The
distribution of households that have been in their current accommodation less than 2 years
is illustrated in Figure 8.
SOCIO-DEMOGRAPHIC VARIATIONS BY TENURE AND OCCUPANCY
6.9 Demographic and social characteristics vary by tenure reflecting a younger, more mobile
private rented sector against an older owner occupied sector. In 13.5% of private rented
households the head of household is aged less than 25 years; 34.1% of owner occupied
households have a head of household aged 65 years and over. Household type
distributions reflect the demographic differences between tenures. 24.8% of private rented
10.3
14.9
25
26.9
33.4
43.2
0 10 20 30 40 50
Southwick
Coalfield Collection/ Easington Lane
Millfield/ Pallion
HOTSPOT AVERAGE
New Silksworth Cottages
Eden Vale
% of households
FIGURE 8: DISTRIBUTION OF HOUSEHOLDS RESIDENT FOR LESS THAN 2 YEARS

David Adamson & Partners Ltd. Page |27
A PROFILE OF THE PRIVATE HOUSING SECTOR
households are single person households aged less than 60 years; 45.2% of owner
occupied households contain at least one individual aged 60 or over.
HOUSEHOLD ECONOMIC CHARACTERISTICS
6.10 4,424 heads of household (57.1%) are in full or part-time employment; 366 heads of
household (4.7%) are registered unemployed and 2,046 heads of household (26.4%) are
economically retired.
10.6
8.2
61.5
15.1
11.9
24.8
10.3
13.5
3.1
73.5
5.1
5.4
45.2
8.1
34.1
0
0 20 40 60 80
Intend to Move in Next Year
Resident Over 10 years
Resident Under 2 years
Lone Parent Household
At least one individual aged 60 or over
Single Person Hhold aged under 60 years
HOH Aged 65 years and over
HOH Aged under 25 years
% of households
FIGURE 9: SOCIO-DEMOGRAPHIC VARIATIONS BY TENURE
Owner occupied Private rented

David Adamson & Partners Ltd. Page |28
A PROFILE OF THE PRIVATE HOUSING SECTOR
6.11 2,126 households (27.4%) are in receipt of means-tested or disability related benefit and are
economically vulnerable; 1,636 households (21.1%) are on low incomes according to
national definitions (Households Below Average Income, An analysis of the income
distribution 1994/95 – 2011/12, Department for Work and Pensions). Median household
income in the private sector is estimated at £24,700 compared to a current UK average of
£33,000. Economic circumstances vary significantly between the owner occupied and
private rented sectors. Although rates of head of household employment are similar, private
rented sector households exhibit higher levels of economic disadvantage:
9.9% of heads of household in the private rented sector are unemployed compared to 1.5% of owner occupied households;
34.6% of private rented households are economically vulnerable compared to 22.9% of owner occupied households; and
41.5% of private rented households are on low incomes compared to 8.2% of owner occupied households.
Median household income within the private rented sector is estimated at £19,240
compared to £27,300 in the owner occupied sector.
6.1
1.4
4.3
26.4
4.7
57.1
0 20 40 60
Student
Looking After Home
Permanently Sick/Disabled
Retired
Unemployed
Full/Part Time Work
% of households
FIGURE 10: ECONOMIC STATUS OF HEAD OF HOUSEHOLD

David Adamson & Partners Ltd. Page |29
A PROFILE OF THE PRIVATE HOUSING SECTOR
6.12 The distribution of economically vulnerable and low income households across the hotspot
areas, while in part influenced by the distribution of private rented housing, is impacted on
by household type where lone parent families and younger single person households are
particularly affected.
41.5
34.6
8.6
9.9
59.1
8.2
22.9
37.7
1.5
55.8
0 10 20 30 40 50 60 70
Low Income
Economically Vulnerable
Retired HOH
Unemployed HOH
Employed HOH
% of households
FIGURE 11: ECONOMIC VARIATIONS BY TENURE
Owner occupied Private rented

David Adamson & Partners Ltd. Page |30
A PROFILE OF THE PRIVATE HOUSING SECTOR
6.13 The highest concentrations of economically vulnerable households are found in Coalfield
Collection / Easington Lane, Millfield/Pallion and New Silksworth Cottages hotspot areas. Low
income households are over represented in Millfield/Pallion and Eden Vale.
TABLE 6: VULNERABLE AND LOW INCOME HOUSEHOLDS BY HOTSPOT AREA
HOTSPOT AREA VULNERABLE LOW INCOME TOTAL
HHOLDS % HHOLDS % HHOLDS Coalfield Collection / Easington Lane 782 36.8 293 13.8 2127
Eden Vale 258 12.5 497 24.1 2061 Millfield/Pallion 750 31.3 675 28.1 2399 New Silksworth Cottages 188 27.5 81 11.8 686 Southwick 148 31.0 90 19.0 476 HOUSEHOLDS 2126 27.4 1636 21.1 7749
18.5
15.5
59.7
25.1
19.9
59.2
27.2
8.3
53.3
33.5
19.5
25.1
.0 20.0 40.0 60.0 80.0
Couple with dependent children
Couple with no dependent children
Lone parent family
Other multi person hh
Single person < 60yrs
Single person 60+ yrs
% of households
FIGURE 12: PERCENTAGE OF HOUSEHOLD TYPE VULNERABLE, ON LOW INCOME
Low Income Vulnerable
David Adamson & Partners Ltd. Page |31
SECTION 3:
PRIVATE SECTOR HOUSING CONDITIONS -
AN OVERVIEW AND NATIONAL PERSPECTIVE
Chapter 7: Housing Conditions 2014 - An Overview
Chapter 8: Housing Conditions 2014 - National Context

David Adamson & Partners Ltd. Page |32
PRIVATE SECTOR HOUSING CONDITIONS - AN OVERVIEW AND NATIONAL PERSPECTIVE
7. HOUSING CONDITIONS 2014 - AN OVERVIEW
7.1 Housing conditions within the private housing sector have been measured against the
Decent Homes Standard. A Decent Home is one that satisfies all of the following four
criteria:
It meets the current minimum standard for housing in England (HHSRS);
It is in a reasonable state of repair;
It has reasonably modern facilities and services; and
It provides a reasonable degree of thermal comfort. 7.2 6,421 dwellings (71.5%) meet the requirements of the Decent Homes Standard and can be
regarded as satisfactory. The remaining 2,560 dwellings (28.5%) fail the requirements of
the Decent Homes Standard and are non-decent. Within the Decent Homes Standard itself
the following pattern of failure emerges:
431 dwellings (4.8%) exhibit Category 1 hazards within the Housing Health and Safety Rating System (HHSRS);
1,917 dwellings (21.3%) are in disrepair;
25 (0.3%) dwellings lack modern facilities and services; and
726 occupied dwellings (9.6%1) fail to provide a reasonable degree of thermal comfort.
The majority of non-decent dwellings (2,100 dwellings, 82%) are defective on one matter of
the Decent Homes Standard; the remaining 460 non-decent dwellings (18%) exhibit multiple
defects.
7.3 Costs to achieve decent homes within the private housing sector are estimated at £17.347M
averaging £6,776 per non-decent home.
1 Compliance with the Decent Homes Standard thermal comfort requirements is only measured only in relation
to occupied dwellings.

David Adamson & Partners Ltd. Page |33
PRIVATE SECTOR HOUSING CONDITIONS - AN OVERVIEW AND NATIONAL PERSPECTIVE
FIGURE 13: DWELLING PERFORMANCE AGAINST THE DECENT HOMES STANDARD
71.5%
28.5%
Decent: 6,421 dwgs Non-decent: 2,560 dwgs
28.5
9.6
0.3
21.3
4.8
0 5 10 15 20 25 30
Non Decent
Energy Efficiency
Facilities and Services
Disrepair
Category 1 Hazards
% of dwellings

David Adamson & Partners Ltd. Page |34
PRIVATE SECTOR HOUSING CONDITIONS - AN OVERVIEW AND NATIONAL PERSPECTIVE
8. HOUSING CONDITIONS 2014 - NATIONAL CONTEXT
8.1 Information available from the English Housing Survey 2012/13 enables housing conditions
in the hotspot areas to be placed in a national context. Housing conditions locally with
regard to the Decent Homes Standard are worse than the national average. Locally, 28.5%
of private sector housing fails the Decent Homes Standard compared to 23.1% of private
sector housing nationally (2012). Category 1 hazard failures within the standard are lower
than the national average but levels of disrepair are significantly higher.
28.5
23.1
0
5
10
15
20
25
30
SUNDERLAND HOTSPOTS ENGLAND
% N
on-D
ecen
t
FIGURE 14: NON-DECENT HOMES - SUNDERLAND 2014; ENGLAND 2012
9.6
0.3
21.3
4.8
8.1
1.5
5.0
14.8
0 5 10 15 20 25
Thermal Comfort
Modern Facilities
Disrepair
Category 1 Hazard
% Non-compliant
DECENT HOMES CRITERIA
England
Sunderland Hotspots

David Adamson & Partners Ltd. Page |35
SECTION 4:
PRIVATE SECTOR HOUSING CONDITIONS 2014
Chapter 9: HHSRS Category 1 Hazards
Chapter 10: Housing Disrepair
Chapter 11: Housing Amenities and Facilities
Chapter 12: Home Energy Efficiency
Chapter 13: Decent Homes Overall Performance
Chapter 14: Non-Decent Homes - Investment Needs
Chapter 15: Decent Places - Environmental Conditions
David Adamson & Partners Ltd. Page |36
PRIVATE SECTOR HOUSING CONDITIONS 2014
9. HHSRS CATEGORY 1 HAZARDS
HOUSING HEALTH AND SAFETY RATING SYSTEM
9.1 The Housing Health and Safety Rating System (HHSRS) is the current approach to the
evaluation of the potential risks to health and safety from any deficiencies identified in
homes. The HHSRS, although not in itself a statutory standard, was introduced as a
replacement for the Housing Fitness Standard (Housing Act 1985, Section 604 as
amended).
9.2 Assessment of hazards is a two-stage process, addressing first the likelihood of an
occurrence and secondly the range of probable harm outcomes. These two factors are
combined using a standard prescribed method to give a score in respect of each hazard.
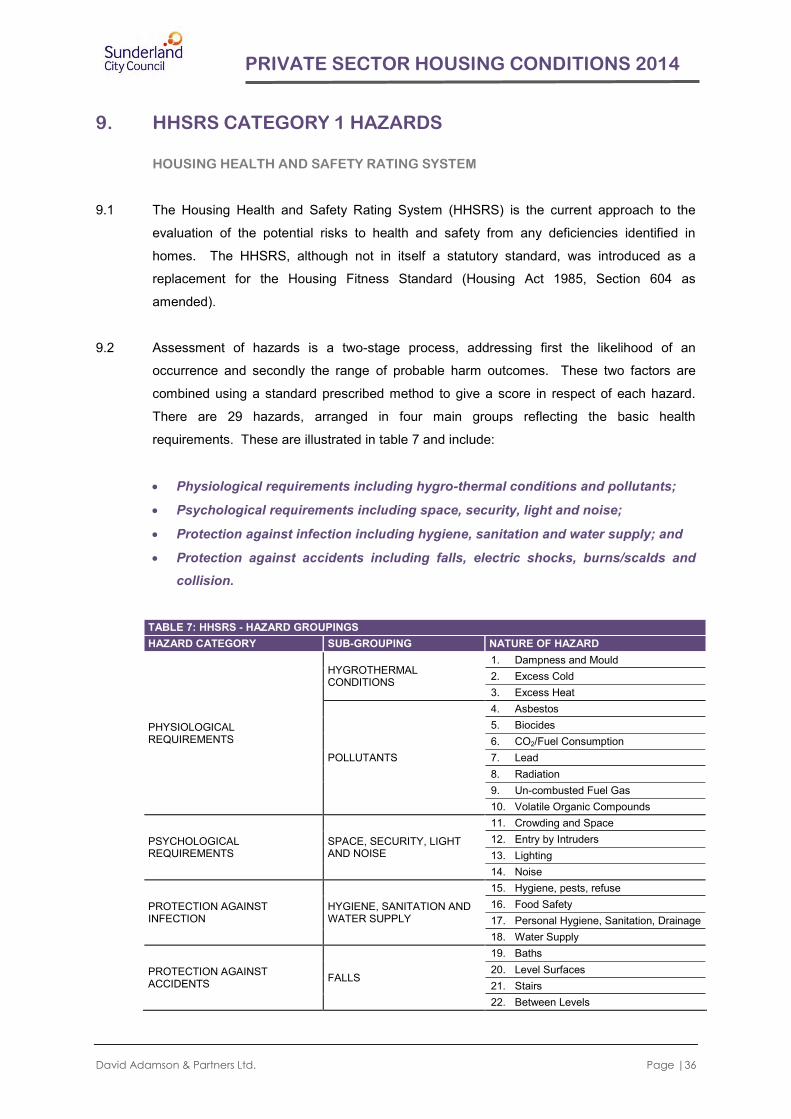
There are 29 hazards, arranged in four main groups reflecting the basic health
requirements. These are illustrated in table 7 and include:
Physiological requirements including hygro-thermal conditions and pollutants;
Psychological requirements including space, security, light and noise;
Protection against infection including hygiene, sanitation and water supply; and
Protection against accidents including falls, electric shocks, burns/scalds and collision.
TABLE 7: HHSRS - HAZARD GROUPINGS HAZARD CATEGORY SUB-GROUPING NATURE OF HAZARD
PHYSIOLOGICAL REQUIREMENTS
HYGROTHERMAL CONDITIONS
1. Dampness and Mould 2. Excess Cold 3. Excess Heat
POLLUTANTS
4. Asbestos 5. Biocides 6. CO2/Fuel Consumption 7. Lead 8. Radiation 9. Un-combusted Fuel Gas 10. Volatile Organic Compounds
PSYCHOLOGICAL REQUIREMENTS
SPACE, SECURITY, LIGHT AND NOISE
11. Crowding and Space 12. Entry by Intruders 13. Lighting 14. Noise
PROTECTION AGAINST INFECTION
HYGIENE, SANITATION AND WATER SUPPLY
15. Hygiene, pests, refuse 16. Food Safety 17. Personal Hygiene, Sanitation, Drainage 18. Water Supply
PROTECTION AGAINST ACCIDENTS FALLS
19. Baths 20. Level Surfaces 21. Stairs 22. Between Levels

David Adamson & Partners Ltd. Page |37
PRIVATE SECTOR HOUSING CONDITIONS 2014
TABLE 7: HHSRS - HAZARD GROUPINGS HAZARD CATEGORY SUB-GROUPING NATURE OF HAZARD
SHOCKS, FIRES, BURNS, SCALDS
23. Electrical Hazards 24. Fire 25. Flames, Hot Surfaces
COLLISIONS, CUTS AND STRAINS
26. Collision, Entrapment 27. Explosions 28. Position of Amenities 29. Structural Collapse
9.3 Hazard scores are banded to reflect the relative severity of hazards and their potential
outcomes. There are ten hazard bands ranging from Band ‘J’ (9 points or less) the safest,
to Band ‘A’ (5,000 points or more) the most dangerous. Hazards can be grouped within
these bandings as Category 1 and Category 2. A Category 1 hazard will fall within Bands
‘A’, ‘B’ or ‘C’ i.e. 1,000 points or more.
TABLE 8: HAZARD BANDINGS AND HAZARD CATEGORISATION HAZARD SCORE RANGE Points…. HAZARD BAND HAZARD CATEGORY
5000 or more A
CATEGORY 1 2000 - 4999 B
1000 - 1999 C
500 - 999 D
CATEGORY 2
200 - 499 E
100 - 199 F
50 - 99 G
20 - 49 H
10 - 19 I
9 or less J
9.4 The Housing Act 2004 puts local authorities under a general duty to take appropriate action
in relation to a Category 1 hazard. Such action can include:
Improvement Notice (Section 11, Housing Act 2004);
Prohibition Order (Section 20, Housing Act 2004);
Hazard Awareness Notice (Section 28, Housing Act 2004);
Emergency Remedial Action (Section 40, Housing Act 2004);
Emergency Prohibition Order (Section 43, Housing Act 2004);
Demolition Order (Section 265, Housing Act 1985); and
Clearance Area Declaration (Section 289, Housing Act 1985).
Similar powers exist to deal with Category 2 hazards but at the discretion of the local
authority. Emergency measures cannot however be used, nor can clearance area or

David Adamson & Partners Ltd. Page |38
PRIVATE SECTOR HOUSING CONDITIONS 2014
demolition powers. The presence of Category 1 hazards is integrated within the decent
homes standard and forms the main focus for our analyses.
CATEGORY 1 HAZARDS
9.5 431 dwellings (4.8%) exhibit Category 1 hazards within the HHSRS and as a result fail the
requirements of the Decent Homes Standard. Rates of Category 1 hazard failure are below
the national average.
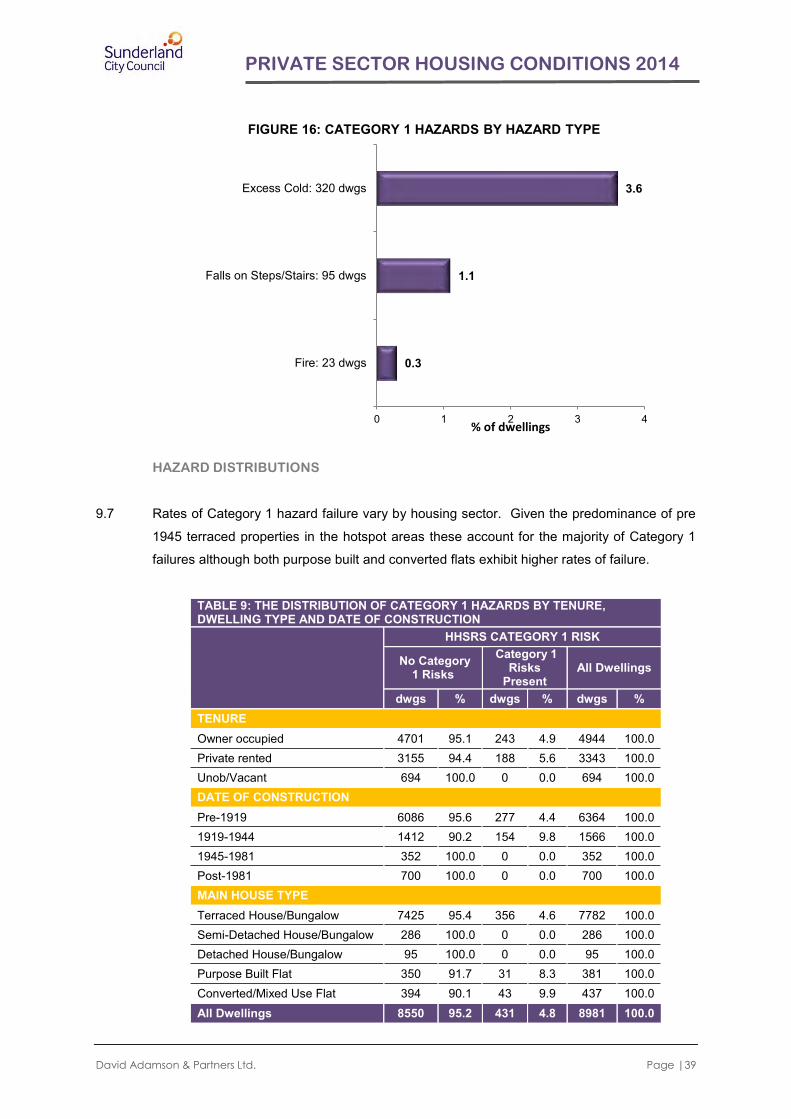
9.6 A range of Category 1 hazards is present although the overall profile is strongly influenced
by excess cold with 320 dwellings (3.6%) exhibiting this particular Category 1 hazard.
Defects on excess cold are both heating and insulation driven:
195 dwellings (60.9%) experiencing Category 1 hazards on excess cold are heated by either electric storage heaters, gas room heaters or pre 1988 boilers; and
18% experiencing Category 1 hazards on excess cold are single glazed. Properties experiencing Category 1 hazards on excess cold have an average SAP Rating of
51 compared to an average SAP Rating for all dwellings of 62.
95.2%
4.8%
FIGURE 15: CATEGORY 1 HAZARD FAILURE
No Category 1 Hazrds: 8,550 dwgs
Category 1 Hazards Present: 431 dwgs
David Adamson & Partners Ltd. Page |39
PRIVATE SECTOR HOUSING CONDITIONS 2014
HAZARD DISTRIBUTIONS
9.7 Rates of Category 1 hazard failure vary by housing sector. Given the predominance of pre
1945 terraced properties in the hotspot areas these account for the majority of Category 1
failures although both purpose built and converted flats exhibit higher rates of failure.
TABLE 9: THE DISTRIBUTION OF CATEGORY 1 HAZARDS BY TENURE, DWELLING TYPE AND DATE OF CONSTRUCTION
HHSRS CATEGORY 1 RISK
No Category 1 Risks
Category 1 Risks
Present All Dwellings
dwgs % dwgs % dwgs % TENURE Owner occupied 4701 95.1 243 4.9 4944 100.0 Private rented 3155 94.4 188 5.6 3343 100.0 Unob/Vacant 694 100.0 0 0.0 694 100.0 DATE OF CONSTRUCTION Pre-1919 6086 95.6 277 4.4 6364 100.0 1919-1944 1412 90.2 154 9.8 1566 100.0 1945-1981 352 100.0 0 0.0 352 100.0 Post-1981 700 100.0 0 0.0 700 100.0 MAIN HOUSE TYPE Terraced House/Bungalow 7425 95.4 356 4.6 7782 100.0 Semi-Detached House/Bungalow 286 100.0 0 0.0 286 100.0 Detached House/Bungalow 95 100.0 0 0.0 95 100.0 Purpose Built Flat 350 91.7 31 8.3 381 100.0 Converted/Mixed Use Flat 394 90.1 43 9.9 437 100.0 All Dwellings 8550 95.2 431 4.8 8981 100.0
0.3
1.1
3.6
0 1 2 3 4
Fire: 23 dwgs
Falls on Steps/Stairs: 95 dwgs
Excess Cold: 320 dwgs
% of dwellings
FIGURE 16: CATEGORY 1 HAZARDS BY HAZARD TYPE

David Adamson & Partners Ltd. Page |40
PRIVATE SECTOR HOUSING CONDITIONS 2014
9.8 By hotspot area, the percentage of dwellings exhibiting a Category 1 hazard varies between
2% in Coalfields Collection/ Easington Lane to 15.8% in New Silksworth Cottages. Given the
small number of actual cases of Category 1 hazards (29 in total) it is not reliable to
breakdown the types of Category 1 hazard by area.
CATEGORY 1 HAZARD IMPROVEMENT COSTS
9.9 Costs to address Category 1 hazards alone within the defective housing stock are estimated
at £1,063,060 net, averaging £2,467 per defective dwelling. Individual costs range from
£1,000 to £4,300 per dwelling. Costs are net of VAT, fees and preliminaries. Costs to
complete outstanding repairs in addition to HHSRS improvements within the 431 properties
increases the repair /improvement bill to £3.969M, averaging £9,211 per dwelling.
2.0
2.5
5.7
8.7
15.8
.0 2.0 4.0 6.0 8.0 10.0 12.0 14.0 16.0 18.0
Coalfield Collection / Easington Lane
Eden Vale
Millfield/Pallion
Southwick
New Silksworth Cottages
% of dwellings with Category 1 hazard
FIGURE 17: PRESENCE OF CATEGORY 1 HAZARD BY HOTSPOT
David Adamson & Partners Ltd. Page |41
PRIVATE SECTOR HOUSING CONDITIONS 2014
10. HOUSING DISREPAIR
DECENT HOMES REPAIR STANDARD
10.1 To meet the decent homes standard, dwellings are required to be in a reasonable state of
repair. Dwellings which fail to meet this criterion are those where either:
One or more of the key building components are old and because of their condition, need replacing or major repair; or
Two or more of the other building components are old and, because of their condition need replacing or major repair.
Key building components are those which are essential to the future integrity of the home
and its continued occupancy. These include:
External walls;
Roof structure and covering;
Windows and doors;
Chimneys;
Central heating boilers;
Gas fires;
Storage heaters; and
Electrics.
Full details of the standard of repair required within the Decent Homes Standard are
attached as Appendix D.
DECENT HOMES REPAIR COMPLIANCE
10.2 Overall, 1,917 dwellings (21.3%) fail the repair requirements of the Decent Homes Standard.
Repair failures are recorded against both primary and secondary building elements. Rates
of disrepair are above the national average and these properties are at risk of future
deterioration. While dwelling disrepair is symptomatic of the natural deterioration of building
elements over time it is also reflective of household activity within the housing market;
namely housing transactions and home improvement. Both of these factors are known to
have been depressed within the recent economic climate.

David Adamson & Partners Ltd. Page |42
PRIVATE SECTOR HOUSING CONDITIONS 2014
10.3 Elemental repair defects in those dwellings failing the repair requirements of the Decent
Homes Standard are illustrated in tables 10 and 11 with regard to primary and secondary
building elements. External repairs are dominated by works to roofs and associated
elements and windows and doors. Internally, repair needs are related to the age of
electrical systems and ceiling finishes.
TABLE 10: DWELLINGS DEFECTIVE ON DECENT HOMES REPAIR - PRIMARY BUILDING ELEMENT PERFORMANCE
PRIMARY BUILDING ELEMENT
DECENT HOMES CONDITION ALL DWELLINGS DEFECTIVE ON
REPAIR COMPLIANT NON-COMPLIANT
dwgs % dwgs % dwgs
Roof Structure 1886 98.4 31 1.6 1917
Roof Cover 1259 65.7 658 34.3 1917
Chimney Stacks 1588 82.8 330 17.2 1917
External Wall Finish 1703 88.8 214 11.2 1917
External Pointing 1801 93.9 116 6.1 1917
Lintols 1872 97.6 45 2.4 1917
External Wall Structure 1891 98.6 26 1.4 1917
Windows 1482 77.3 435 22.7 1917
Doors 1541 80.4 376 19.6 1917
Electrics 1829 95.4 88 4.6 1917
Heating 1909 99.6 8 0.4 1917
10.4 Over half (406 households) of owner occupiers in properties exhibiting disrepair have
completed major improvements or repairs over the last five years. However the majority of
91.4%
8.6%
FIGURE 18: DECENT HOMES REPAIR PERFORMANCE
Compliant: 7,064 dwgs Non-Compliant: 1,917 dwgs

David Adamson & Partners Ltd. Page |43
PRIVATE SECTOR HOUSING CONDITIONS 2014
these improvements relate to the installation of energy efficiency measures (337
households) or new amenities /extension (315 households). Only 150 owner occupiers
have rewired their property or installed new windows and doors, and approximately 200
households have carried out any external repairs over the 5 years. For many dwellings the
age of these elements is now the driving force for failing the Decent Homes Standard.
TABLE 11: DWELLINGS DEFECTIVE ON DECENT HOMES REPAIR - SECONDARY BUILDING ELEMENT PERFORMANCE
SECONDARY BUILDING ELEMENT
DECENT HOMES CONDITION ALL DWELLINGS DEFECTIVE ON
REPAIR COMPLIANT NON-COMPLIANT
dwgs % dwgs % dwgs
Flashings 952 49.7 965 50.3 1917
Rainwear 1268 66.2 649 33.8 1917
Underground Drainage 1891 98.6 26 1.4 1917
Internal Floor Structure 1917 100.0 0 0.0 1917
Internal Floor Finishes 1917 100.0 0 0.0 1917
Internal Wall Structure 1901 99.1 17 0.9 1917
Internal Wall Finishes 1892 98.7 25 1.3 1917
Internal Ceiling Finishes 1849 96.4 68 3.6 1917
Internal Doors 1917 100.0 0 0.0 1917
Fireplaces/Flues 1917 100.0 0 0.0 1917
Internal Balustrades 1917 100.0 0 0.0 1917
Plumbing 1917 100.0 0 0.0 1917
Kitchens 1909 99.6 8 0.4 1917
Bathrooms 1901 99.2 16 0.8 1917
DISREPAIR BY SECTOR
10.5 As might be expected, disrepair is strongly related to dwelling age with rates of disrepair
significantly higher within the pre-1919 housing stock. This age bias translates across the
main house types and tenure groups resulting in higher rates of disrepair within the private
rented and for converted flats.

David Adamson & Partners Ltd. Page |44
PRIVATE SECTOR HOUSING CONDITIONS 2014
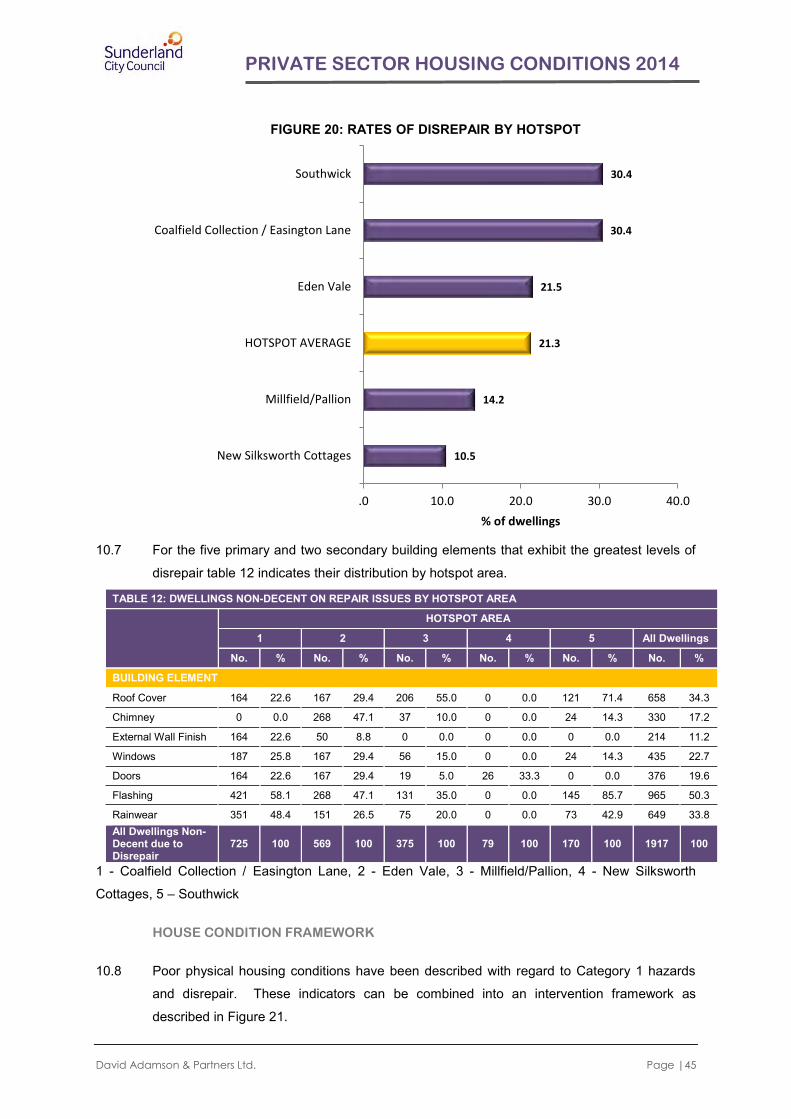
10.6 Patterns of Decent Homes repair failure at hotspot area level mirror the distribution of older
terraced properties with the highest rates of failure recorded in Southwick and Coalfield
Collection / Easington Lane.
38.2
6.5
24.5
8.7
21.6
8.1
19.9
9.6
25.8
24.8
16.4
0 10 20 30 40 50
Converted/Mixed Use Flat
Purpose Built Flat
Detached House/Bungalow
Semi-detached House/Bungalow
Terraced House/Bungalow
Post-1981
1945-1981
1919-1944
Pre-1919
Private rented
Owner occupied
% non-compliant
FIGURE 19: DECENT HOMES REPAIR PERFORMANCE BY TENURE, DWELLING AGE AND DWELLING TYPE
TENURE
DATE OF CONSTRUCTION
BUILDING TYPE
David Adamson & Partners Ltd. Page |45
PRIVATE SECTOR HOUSING CONDITIONS 2014
10.7 For the five primary and two secondary building elements that exhibit the greatest levels of
disrepair table 12 indicates their distribution by hotspot area.
TABLE 12: DWELLINGS NON-DECENT ON REPAIR ISSUES BY HOTSPOT AREA
HOTSPOT AREA
1 2 3 4 5 All Dwellings
No. % No. % No. % No. % No. % No. %
BUILDING ELEMENT
Roof Cover 164 22.6 167 29.4 206 55.0 0 0.0 121 71.4 658 34.3
Chimney 0 0.0 268 47.1 37 10.0 0 0.0 24 14.3 330 17.2
External Wall Finish 164 22.6 50 8.8 0 0.0 0 0.0 0 0.0 214 11.2
Windows 187 25.8 167 29.4 56 15.0 0 0.0 24 14.3 435 22.7
Doors 164 22.6 167 29.4 19 5.0 26 33.3 0 0.0 376 19.6
Flashing 421 58.1 268 47.1 131 35.0 0 0.0 145 85.7 965 50.3
Rainwear 351 48.4 151 26.5 75 20.0 0 0.0 73 42.9 649 33.8 All Dwellings Non-Decent due to Disrepair
725 100 569 100 375 100 79 100 170 100 1917 100
1 - Coalfield Collection / Easington Lane, 2 - Eden Vale, 3 - Millfield/Pallion, 4 - New Silksworth
Cottages, 5 – Southwick
HOUSE CONDITION FRAMEWORK
10.8 Poor physical housing conditions have been described with regard to Category 1 hazards
and disrepair. These indicators can be combined into an intervention framework as
described in Figure 21.
10.5
14.2
21.3
21.5
30.4
30.4
.0 10.0 20.0 30.0 40.0
New Silksworth Cottages
Millfield/Pallion
HOTSPOT AVERAGE
Eden Vale
Coalfield Collection / Easington Lane
Southwick
% of dwellings
FIGURE 20: RATES OF DISREPAIR BY HOTSPOT

David Adamson & Partners Ltd. Page |46
PRIVATE SECTOR HOUSING CONDITIONS 2014
FIGURE 21: PHYSICAL CONDITION INTERVENTION FRAMEWORK
Category A: Above average Category 1 hazard failure but below average disrepair.
Immediate intervention signalled.
Category B: Above average combined condition defects signalling immediate
intervention on Category 1 hazards and preventative action on disrepair.
Category C: Above average disrepair but low Category 1 hazard failure. Preventative
action on disrepair to mitigate future deterioration.
Category D: Low risk with below average rates of disrepair and Category 1 hazards.
10.9 Millfield/ Pallion and New Silkswoth Cottages hotspot areas fall into Category A; exhibiting
above average rates of Category 1 hazard failure but lower than average rates of disrepair.
The area of Southwick is the only hotspot area to fall into Category B exhibiting high
combined condition failures on both Category 1 hazards and disrepair. The remaining
areas; Coalfield Collection/ Easington Lane and Eden Vale fall within Category C, exhibiting
below average rates of Category 1 hazard failure but are at risk of future deterioration
through disrepair.
A.
HIGH CATEGORY 1 HAZARD
ONLY
B.
COMBINED CONDITION DEFECTS
D.
LOW RISK
C.
HIGH DISREPAIR
ONLY
CATEGORY 1 HAZARD FAILURE
Above
Average
Below Average
DISREPAIR Below Above Average Average

David Adamson & Partners Ltd. Page |47
PRIVATE SECTOR HOUSING CONDITIONS 2014
FIGURE 22: HOTSPOT AREA CLASSIFICATION OF INTERVENTION POTENTIAL
A. MILLFIELD/ PALLION NEW SILKSWORTH COTTAGES
B. SOUTHWICK
D.
C. COALFIELD COLLECTION/ EASINGTON LANE EDEN VALE
CATEGORY 1 HAZARD FAILURE
Above
Average
Below Average
DISREPAIR Below Above Average Average
David Adamson & Partners Ltd. Page |48
PRIVATE SECTOR HOUSING CONDITIONS 2014
11. HOUSING AMENITIES AND FACILITIES
AMENITIES & FACILITIES
11.1 The survey has examined the amenities and facilities offered by private sector housing in
the five hotspot areas in Sunderland. Three areas have been examined, including:
a) The amenity/modern facilities requirements of the Decent Homes Standard; b) Home security arrangements; and c) Dwelling adaptation.
DECENT HOMES
11.2 For a dwelling to comply with the Decent Homes Standard it must possess reasonably
modern amenities. A dwelling is considered not to meet this criterion if it lacks three or more
of the following facilities:
A kitchen which is 20 years old or less;
A kitchen with adequate space and layout;
A bathroom which is 30 years old or less;
An appropriately located bathroom and WC;
Adequate sound insulation; and/or
Adequate size and layout of common entrance areas for flats.
11.3 Kitchen and bathroom amenities exhibit a modern age profile within the private housing
sector. 8,187 dwellings (91.2%) offer kitchens under 20 years old, 8,548 dwellings (95.2%)
offer bathrooms under 30 years old. Linked to this modern age profile, additional amenity
defects are recorded in fewer than 2% of the housing stock:
25 dwellings (0.3%) offer inadequate space and layout in the kitchen;
94 dwellings (1.1%) offer an unsatisfactory bathroom location or an unsatisfactory WC location; and
8 dwellings (0.1%) have inadequate size and layout of common entrance areas for flats.
In addition to amenities no defects were recorded on noise. To fail the Decent Homes
Standard a dwelling must be deficient on three or more amenity requirements. This results
in very low levels of failure (only 25 dwellings) within the standard.

David Adamson & Partners Ltd. Page |49
PRIVATE SECTOR HOUSING CONDITIONS 2014
HOME SECURITY
11.4 Rising public awareness of and media exposure to crime have placed an increasing
emphasis on home security. Core security measures within the home can be assumed to
include secure access door locking and window locking to ground floor windows and to
upper floor windows where appropriate. Core security measures are present in 8,795
dwellings (97.9%) but absent in 186 dwellings (2.1%).
11.5 8,474 dwellings (94.4%) have internal smoke alarms fitted; 507 dwellings (5.6%) have no
internal smoke alarm provision.
DWELLING ADAPTATION
11.6 Levels of adaptation for special needs within the housing stock are relatively low - 552
adapted dwellings (6.2%). Where adaptations are present the most common relate to
adapted bathroom/WC amenities, chair/stair lift and level/ramped access. Relationships
between dwelling adaptation, household illness and special needs are examined in Chapter
18 of this report.
97.9%
2.1%
FIGURE 23: CORE HOME SECURITY MEASURES
Core Measures Present: 8,795 dwgs Core Measures Absent: 186 dwgs

David Adamson & Partners Ltd. Page |50
PRIVATE SECTOR HOUSING CONDITIONS 2014
FIGURE 24: ADAPTATIONS PRESENT
93.8%
6.2%
A. THE PRESENCE OF ADAPTATIONS
No Adaptations
Adaptations Present
10.7
12.7
20.5
23.4
24.7
36.2
49.7
0.0 20.0 40.0 60.0
Ground Floor Bedroom/Bathroom:59 dwgs
Level/Ramped Access: 70 dwgs
Adapted Kitchen: 113 dwgs
Adapted Bathroom/WC: 129 dwgs
Chair/Stairlift/Hoist: 137 dwgs
Wheelchair Accessible WC: 200dwgs
Repositioned electrical controls: 274dwgs
% of adapted dwellings
B. TYPES OF ADAPTATION

David Adamson & Partners Ltd. Page |51
PRIVATE SECTOR HOUSING CONDITIONS 2014
12. HOME ENERGY EFFICIENCY
HOME ENERGY INFORMATION
12.1 Information on home energy efficiency was collected within the RDSAP framework in
addition to the assessment of thermal comfort performance within the Decent Homes
Standard.
12.2 Key indicators used from the energy efficiency audit include:
SAP Rating (Standard Assessment Procedure);
Carbon Dioxide Emissions (CO2);
Energy Costs; and
Energy Efficiency Rating (EER).
The SAP Rating is based on each dwelling’s energy costs per square metre and is
calculated using a simplified form of the Standard Assessment Procedure. The energy
costs take into account the costs of space and water heating, ventilation and lighting, less
any cost savings from energy generation technologies. The rating is expressed on a scale
of 1 - 100 where a dwelling with a rating of 1 has poor energy efficiency (high costs) and a
dwelling with a rating of 100 represents a completely energy efficient dwelling (zero net
energy costs per year).
Carbon Dioxide (CO2) emissions are derived from space heating, water heating, ventilation,
lighting, less any emissions saved by energy generation and are measured in tonnes per
year.
Energy costs represent the total energy cost from space heating, water heating, ventilation
and lighting, less the costs saved by energy generation as derived from SAP calculations
and assumptions. Costs are expressed in £’s per year using constant prices based on
average fuel prices. Energy costs for each dwelling are based on a standard occupancy
and a standard heating regime, thereby allowing dwellings to be compared.
The Energy Efficiency Rating (EER) is presented in bands from A - G for an Energy
Performance Certificate, where a band A rating represents low energy costs (the most
efficient band) and a band G rating represents high energy costs (the least efficient band).
The break points in SAP used for the EER bands are:
Band A: 92-100 Band B: 81-91 Band C: 69-80

David Adamson & Partners Ltd. Page |52
PRIVATE SECTOR HOUSING CONDITIONS 2014
Band D: 55-68 Band E: 39-54 Band F: 21-38 Band G: 1-20
ENERGY EFFICIENCY PERFORMANCE
12.3 The current SAP Rating for occupied private sector housing in the hotspots areas of
Sunderland is measured at 62, significantly above the national average of 57 for all private
housing in England (English Housing Survey 2012 - 2013). Average CO2 emissions total
3.846 tonnes per annum again significantly better than the national average of 5.9 tonnes
for all private housing in England. Average annual energy costs are estimated at £921.47
per annum giving a total private sector household energy bill for the hotspot areas of
£6.954M per annum. The lower quartile SAP Rating for private housing in the hotspot areas
is 56; 50 private dwellings (0.7%) have a SAP Rating of under 35.
12.4 The proportion of private dwellings in the lowest EER bands (E and G) is significantly below
the national average. 22.6% of private dwellings in the hotspot areas of Sunderland (1,702
dwellings) fall within EER bands E, F and G compared to 34.3% of private dwellings
nationally.
8 25 118
600
2231
3086
1378
100
0
500
1000
1500
2000
2500
3000
3500
<=10 > 20, <=30>30, <= 40 >40, <=50 >50, <=60 >60, <=70 >70, <=80 >80, <=90
Dw
ellin
gs
FIGURE 25: SAP RATING DISTRIBUTION

David Adamson & Partners Ltd. Page |53
PRIVATE SECTOR HOUSING CONDITIONS 2014
TABLE 13: ENERGY EFFICIENCY RATINGS (EER) SUNDERLAND HOTSPOTS AND ENGLAND
EER BANDING SUNDERLAND 2014 ENGLAND 2012
dwgs % % Band A & B (SAP 81 - 100) 0 0.0 0.6 Band C (SAP 69 - 80) 1956 26.0 14.2 Band D (SAP 55 - 68) 3889 51.5 51.0 Band E (SAP 39 - 54) 1599 21.2 27.3 Band F (SAP 21 - 38) 95 1.3 5.5 Band G (SAP 1 - 20) 8 0.1 1.5
12.5 Sectoral variations in EER’s are limited. Geographically the highest concentrations of low
rated dwellings are located in Southwick.
ENERGY EFFICIENCY ATTRIBUTES
12.6 Underlying the energy efficiency of private sector housing the following attributes apply:
114 dwellings (1.5%) contain loft insulation levels below 100mm. 588 dwellings (7.8%) offer loft insulation to 100mm, 1,104 dwellings (14.6%) to 150mm, and 5,373 dwellings (71.2%) to 200mm or above. In 367 dwellings (4.9%) loft insulation is not appropriate due to other uses over. Loft insulation provision in the hotspot areas is better than the national average. Nationally, 50.4% of private sector housing has loft insulation of 150mm or above. Locally, 85.8% of private housing meets this target.
14.4
19.2
22.0
22.6
22.8
61.0
0.0 20.0 40.0 60.0 80.0
Eden Vale
New Silksworth Cottages
Coalfield Collection / Easington Lane
HOTSPOT AVERAGE
Millfield/Pallion
Southwick
% of dwellings
FIGURE 26: DWELLINGS IN EER BANDS E, F AND G BY HOTSPOT AREA

David Adamson & Partners Ltd. Page |54
PRIVATE SECTOR HOUSING CONDITIONS 2014
7,372 dwellings (97.7%) offer some form of double glazing, the majority of which is whole house. Levels of double glazing in the hotspot areas are above the national average for all tenure housing in England (78.8% - 2012).
7,245 dwellings (96%) offer full central heating with an additional 102 dwellings (1.3%) offering partial heating systems. 200 dwellings (2.6%) lack central heating.
DECENT HOMES THERMAL COMFORT
12.7 To meet the requirements of the Decent Homes Standard dwellings must offer efficient
heating and effective insulation. 726 occupied dwellings (9.6%) fail to meet the
requirements. Variations in thermal comfort performance reflect higher rates of failure in the
private rented sector and in the flatted housing market. Energy efficiency performance
locally is slightly worse than the national average.
TABLE 14: DECENT HOMES THERMAL COMFORT PERFORMANCE BY TENURE, DATE OF CONSTRUCTION AND HOUSE TYPE
DECENT HOMES THERMAL COMFORT
Compliant Non-Compliant All Dwellings dwgs % dwgs % dwgs %
TENURE Owner occupied 4273 90.6 442 9.4 4715 100.0 Private rented 2524 89.9 285 10.1 2808 100.0 Unob/Vacant 23 100.0 0 0.0 23 100.0
96.1%
1.3% 2.6%
FIGURE 27: CENTRAL HEATING PROVISION
Full CH: 7,245 dwgs
Partial CH: 102 dwgs
No CH: 200 dwgs

David Adamson & Partners Ltd. Page |55
PRIVATE SECTOR HOUSING CONDITIONS 2014
TABLE 14: DECENT HOMES THERMAL COMFORT PERFORMANCE BY TENURE, DATE OF CONSTRUCTION AND HOUSE TYPE
DECENT HOMES THERMAL COMFORT
Compliant Non-Compliant All Dwellings dwgs % dwgs % dwgs %
DATE OF CONSTRUCTION Pre-1919 4644 88.9 580 11.1 5224 100.0 1919-1944 1246 94.3 75 5.7 1321 100.0 1945-1981 333 94.7 19 5.3 352 100.0 Post-1981 597 92.0 52 8.0 650 100.0 MAIN HOUSE TYPE Terraced House/Bungalow 5988 90.4 639 9.6 6627 100.0 Semi-Detached House/Bungalow 267 100.0 0 0.0 267 100.0
Detached House/Bungalow 95 100.0 0 0.0 95 100.0 Purpose Built Flat 264 85.8 44 14.2 307 100.0 Converted/Mixed Use Flat 207 82.7 43 17.3 250 100.0 All Dwellings 6821 90.4 726 9.6 7547 100.0
12.8 Geographically, patterns of thermal comfort failure reveal higher levels of failure in
Southwick and New Silksworth Cottages. Properties failing Decent Homes thermal comfort
requirements have an average SAP rating of 45 compared to 64 for dwellings compliant with
the Standard. 89.6% of non-compliant dwellings are in EER bands E, F, G compared to
15.6% of compliant dwellings. Non-compliant dwellings offer significantly lower levels of
central heating, a higher dependency on electricity as a primary heating fuel, and lower
levels of insulation.

David Adamson & Partners Ltd. Page |56
PRIVATE SECTOR HOUSING CONDITIONS 2014
36.0
86.4
13.8
72.5
89.6
75.0
97.0
1.1
98.5
15.6
0.0 20.0 40.0 60.0 80.0 100.0 120.0
Loft Insulation 200mm+
Mains Gas Heating
Single Glazing
Full Central Heating
EER Band E, F, G
% of dwellings
FIGURE 28: DECENT HOMES THERMAL COMFORT AND ENERGY ATTRIBUTES
Compliant
Non-compliant

David Adamson & Partners Ltd. Page |57
PRIVATE SECTOR HOUSING CONDITIONS 2014
13. DECENT HOMES OVERALL PERFORMANCE
OVERALL PERFORMANCE
13.1 Rates of non-decency in the hotspot areas of Sunderland are above the national average.
Overall, 6,421 dwellings meet the requirements of the Decent Homes Standard and are
decent. These represent 71.5% of all private dwellings in the hotspot areas of Sunderland.
2,560 dwellings fail to meet the requirements of the Decent Homes Standard and are non-
decent. This represents 28.5% of the total private sector housing in these areas. The
majority of non-decent dwellings (2,100 dwellings, 82%) are defective on one matter of the
Decent Homes Standard; the remaining 460 non-decent dwellings (18%) exhibit multiple
defects.
FIGURE 29: OVERALL PERFORMANCE ON THE DECENT HOMES STANDARD
13.2 The pattern of category failure within the standard is illustrated in table 15. Defects on the
Decent Homes Standard are dominated by ‘Disrepair Only’ – 1,571 dwellings (61.4%) and
71.5%
28.5%
A. DECENT HOMES STANDARD Base = All Dwellings
Decent: 6,421 dwgs
Non-decent: 2,560 dwgs
82.0%
14.9% 3.1%
B. DEFECTIVE MATTERS Base = 2,560 non-decent dwellings
One Defective Matter: 2,100 dwgs
Two Defective Matters: 381 dwgs
Three Defective Matters: 79 dwgs

David Adamson & Partners Ltd. Page |58
PRIVATE SECTOR HOUSING CONDITIONS 2014
‘Thermal Comfort Only’ - 368 dwellings (14.4%). Multiple defects on the Standard are
typically associated with a combination of disrepair and thermal comfort.
TABLE 15: NON-DECENT DWELLINGS - DEFECT CLASSIFICATION
DECENT HOMES DEFECT
CLASSIFICATION dwgs %
HHSRS only 161 6.3 Disrepair only 1571 61.4 Energy only 368 14.4 HHSRS and disrepair 94 3.7 HHSRS and energy 97 3.8 Disrepair and amenity 8 0.3 Disrepair and energy 182 7.1 HHSRS, disrepair and energy 62 2.4 HHSRS, amenity and energy 17 0.7
ALL DWELLINGS NON-DECENT 2560 100.0
SECTORAL VARIATIONS
13.3 Variations in decent homes performance reflect significantly higher rates of failure for:
The private rented sector : 30.9%;
Converted flats : 45%;
Southwick and Coalfield Collection / Easington Lane : 46.4% and 35.3% respectively; and
Dwellings constructed pre-1919 : 33.5%.
TABLE 16: DECENT HOMES COMPLIANCY BY TENURE, DATE OF CONSTRUCTION AND HOUSE TYPE
DECENT HOMES STANDARD
Compliant Non-compliant All Dwellings dwgs % dwgs % dwgs %
TENURE Owner occupied 3694 74.7 1251 25.3 4944 100.0 Private rented 2311 69.1 1032 30.9 3343 100.0 Unobtainable 416 60.0 278 40.0 694 100.0 DATE OF CONSTRUCTION Pre-1919 4235 66.5 2129 33.5 6364 100.0 1919-1944 1316 84.0 250 16.0 1566 100.0 1945-1981 263 74.7 89 25.3 352 100.0 Post 1981 607 86.8 92 13.2 700 100.0 MAIN HOUSE TYPE Terraced House/Bungalow 5550 71.3 2231 28.7 7782 100.0 Semi-Detached House/Bungalow 261 91.3 25 8.7 286 100.0

David Adamson & Partners Ltd. Page |59
PRIVATE SECTOR HOUSING CONDITIONS 2014
TABLE 16: DECENT HOMES COMPLIANCY BY TENURE, DATE OF CONSTRUCTION AND HOUSE TYPE
DECENT HOMES STANDARD
Compliant Non-compliant All Dwellings dwgs % dwgs % dwgs %
Detached House/Bungalow 72 75.5 23 24.5 95 100.0 Purpose Built Flat 297 78.0 84 22.0 381 100.0 Converted/Mixed Use Flat 240 55.0 197 45.0 437 100.0 ALL DWELLINGS 6421 71.5 2560 28.5 8981 100.0
22.7
24.1
28.5
29.8
35.3
46.4
.0 5.0 10.0 15.0 20.0 25.0 30.0 35.0 40.0 45.0 50.0
Millfield/Pallion
Eden Vale
HOTSPOT AVERAGE
New Silksworth Cottages
Coalfield Collection / Easington Lane
Southwick
% of dwellings
FIGURE 30: DECENT HOMES NON-COMPLIANCY BY HOTSPOT AREA
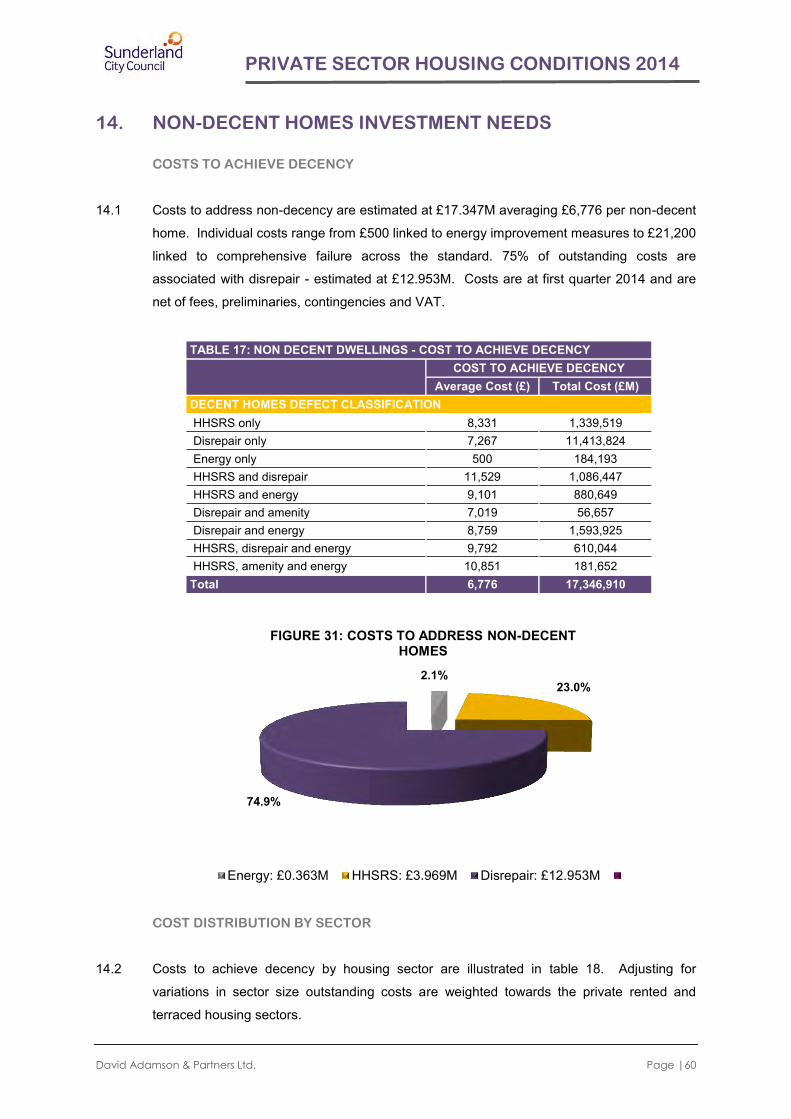
David Adamson & Partners Ltd. Page |60
PRIVATE SECTOR HOUSING CONDITIONS 2014
14. NON-DECENT HOMES INVESTMENT NEEDS
COSTS TO ACHIEVE DECENCY
14.1 Costs to address non-decency are estimated at £17.347M averaging £6,776 per non-decent
home. Individual costs range from £500 linked to energy improvement measures to £21,200
linked to comprehensive failure across the standard. 75% of outstanding costs are
associated with disrepair - estimated at £12.953M. Costs are at first quarter 2014 and are
net of fees, preliminaries, contingencies and VAT.
TABLE 17: NON DECENT DWELLINGS - COST TO ACHIEVE DECENCY
COST TO ACHIEVE DECENCY
Average Cost (£) Total Cost (£M) DECENT HOMES DEFECT CLASSIFICATION HHSRS only 8,331 1,339,519 Disrepair only 7,267 11,413,824 Energy only 500 184,193 HHSRS and disrepair 11,529 1,086,447 HHSRS and energy 9,101 880,649 Disrepair and amenity 7,019 56,657 Disrepair and energy 8,759 1,593,925 HHSRS, disrepair and energy 9,792 610,044 HHSRS, amenity and energy 10,851 181,652 Total 6,776 17,346,910
COST DISTRIBUTION BY SECTOR
14.2 Costs to achieve decency by housing sector are illustrated in table 18. Adjusting for
variations in sector size outstanding costs are weighted towards the private rented and
terraced housing sectors.
2.1% 23.0%
74.9%
FIGURE 31: COSTS TO ADDRESS NON-DECENT HOMES
Energy: £0.363M HHSRS: £3.969M Disrepair: £12.953M

David Adamson & Partners Ltd. Page |61
PRIVATE SECTOR HOUSING CONDITIONS 2014
TABLE 18: COSTS TO ACHIEVE DECENCY BY HOUSING SECTOR
Non-decent Dwellings Cost to Achieve Decency
dwgs Row % Average Total Col %
£ £M % TENURE Owner occupied 1251 25.3 5,793 7,245,027 41.8 Private rented 1032 30.9 7,635 7,877,322 45.4 Unobtainable 278 40.0 8,013 2,224,561 12.8 MAIN HOUSE TYPE Terraced House/Bungalow 2231 28.7 6,858 15,303,179 88.2 Semi-Det. House/Bungalow 25 8.7 5,676 140,826 0.8 Detached House/Bungalow 23 24.5 4,491 104,959 0.6 Purpose-Built Flat 84 22.0 5,734 479,795 2.8 Converted Flat 197 45.0 6,699 1,318,150 7.6 DATE OF CONSTRUCTION Pre-1919 2129 33.5 6,744 14,357,117 82.8 1919-1944 250 16.0 9,904 2,475,737 14.3 1945-1981 89 25.3 3,290 292,115 1.7 Post-1981 92 13.2 2,404 221,940 1.3 HOTSPOT AREA Coalfield Collection / Easington Lane 841 35.3 6,930 5,830,993 32.9 Eden Vale 636 24.1 7,937 5,049,164 24.8 Millfield/Pallion 600 22.7 5,343 3,205,142 23.4 New Silksworth Cottages 224 29.8 8,111 1,819,058 8.8 Southwick 258 46.4 5,584 1,442,554 10.1 ALL SECTORS 2560 28.5 6,776 17,346,910 100.0

David Adamson & Partners Ltd. Page |62
PRIVATE SECTOR HOUSING CONDITIONS 2014
15. DECENT PLACES - ENVIRONMENTAL CONDITIONS
DECENT PLACES AND LIVEABILITY
15.1 Environmental conditions and liveability problems were based on the professional
assessment by surveyors of problems in the immediate vicinity of the home. In all, 16
environmental issues were assessed individually but also grouped together into 3 categories
related to:
UPKEEP - The upkeep, management or misuse of private and public space and
buildings. Specifically, the presence of: scruffy or neglected
buildings, poor condition housing, graffiti, scruffy gardens or
landscaping; rubbish or dumping, vandalism, dog excrement and the
nuisance from street parking.
UTILISATION - Abandonment or non-residential use of property. Specifically: vacant
sites, vacant or boarded-up buildings and intrusive industry.
TRAFFIC - Road traffic and other forms of transport. Specifically the presence
of: intrusive main roads and motorways, railway or aircraft noise,
heavy traffic and poor ambient air quality.
ENVIRONMENTAL ISSUES
15.2 Environmental issues are apparent but are generally of minor impact. Major impact
problems were identified against only 10 indicators, with 5 affecting less than 2% of
dwellings. The most notable major issues relate to;
Heavy Traffic : 1,485 dwellings (16.6%);
Street Parking : 846 dwellings (9.4%);
Dog Fouling : 588 dwellings (6.5%); and
Neglected Buildings : 376 dwellings (4.2%

David Adamson & Partners Ltd. Page |63
PRIVATE SECTOR HOUSING CONDITIONS 2014
LIVEABILITY
15.3 Overall, 2,766 dwellings (30.8%) are located in residential environments experiencing
liveability problems that are a major problem. Problems with upkeep affect 1,374 dwellings
(15.3%), traffic problems affect 1,737 dwellings (19.3%) and utilisation issues affect 161
dwellings (1.8%).
90.8
91.5
92.1
88.7
91.5
93.1
90.8
87.5
67.7
94.5
54.9
79.8
83.7
69.5
60.7
68.9
0% 20% 40% 60% 80% 100%
Graffiti
Vandalism
Railway/Aircraft Noise
Non-conforming Uses
Air Quality
Intrusive Industry
Vacant Sites
Vacant Buildings
Condition of Dwellings
Motorway Intrusion
Litter & Rubbish
Unkempt Gardens
Neglected Buildings
Dog Fouling
Street Parking
Heavy Traffic
% affected
FIGURE 32: ENVIRONMENTAL ISSUES
Not a Problem Minor Problem Major Problem

David Adamson & Partners Ltd. Page |64
PRIVATE SECTOR HOUSING CONDITIONS 2014
15.4 Environmental problems are more noted in areas of older properties; 36.3% of pre-1919
dwellings are adversely affected by local environmental problems compared to 7.1% of post
1981 dwellings. A relationship would also appear to exist between environmental conditions
and housing conditions. 897 non-decent homes are located in areas affected by
environmental problems (35%); in comparison 29.1% of decent homes are similarly
affected.
1.8
19.3
15.3
30.8
0 10 20 30 40
Utilisation
Traffic
Upkeep
Overall Liveability
% of dwellings affected
FIGURE 33: LIVEABILITY PROBLEMS
70.9 65.0
29.1 35.0
0%
10%
20%
30%
40%
50%
60%
70%
80%
90%
100%
Decent Non-decent
FIGURE 34: ENVIRONMENTAL CONDITIONS AND HOUSING CONDITIONS
Environmental Problems No Environmental Problems

David Adamson & Partners Ltd. Page |65
PRIVATE SECTOR HOUSING CONDITIONS 2014
15.5 Geographically, environmental problems are dominated by two hotspot areas, namely New
Silksworth Cottages and Coalfield Collection / Easington Lane. Within Coalfield Collection /
Easington Lane heavy traffic is the issue most frequently cited as a major problem, whilst in
New Silksworth Cottages a range of issues exist including street parking, dog fouling,
neglected buildings and gardens, litter, the condition of dwellings and heavy traffic.
TABLE 19: DWELLINGS AFFECTED BY MAJOR ENVIRONMENTAL ISSUES IN COALFIELD COLLECTION/ EASINGTON LANE & NEW SILKSWORTH COTTAGES
COALFIELD COLLECTION/
EASINGTON LANE NEW SILKSWORTH
COTTAGES
Dwgs % Dwgs %
ENVIRONMENTAL ISSUE Litter & Rubbish 47 2.0 224 29.8 Unkempt Gardens 0 0.0 290 38.6 Neglected Buildings 23 1.0 303 40.4 Dog Fouling 210 8.8 369 49.1 Condition of Dwellings 47 2.0 172 22.8 Nuisance From Street Parking 210 8.8 396 52.6 Heavy Traffic 1239 52.0 158 21.4 Intrusion From Motorways 234 9.8 0 0.0 Vacant Sites 47 2.0 0 0.0 Vacant Buildings 70 2.9 13 1.8 TOTAL DWELLINGS 2384 100.0 752 100.0
2.9
3.8
11.3
30.8
72.5
82.5
.0 10.0 20.0 30.0 40.0 50.0 60.0 70.0 80.0 90.0
Southwick
Eden Vale
Millfield/Pallion
HOTSPOT AVERAGE
Coalfield Collection / Easington Lane
New Silksworth Cottages
% of dwellings
FIGURE 35: ENVIRONMENTAL PROBLEMS BY HOTSPOT AREA

David Adamson & Partners Ltd. Page |66
SECTION 5:
HOUSING CONDITIONS AND HOUSEHOLD CIRCUMSTANCES
Chapter 16: Housing Conditions and Household Circumstances
Chapter 17: Fuel Poverty
Chapter 18: Housing and Health
Chapter 19: Household Attitudes to Housing and Local Areas
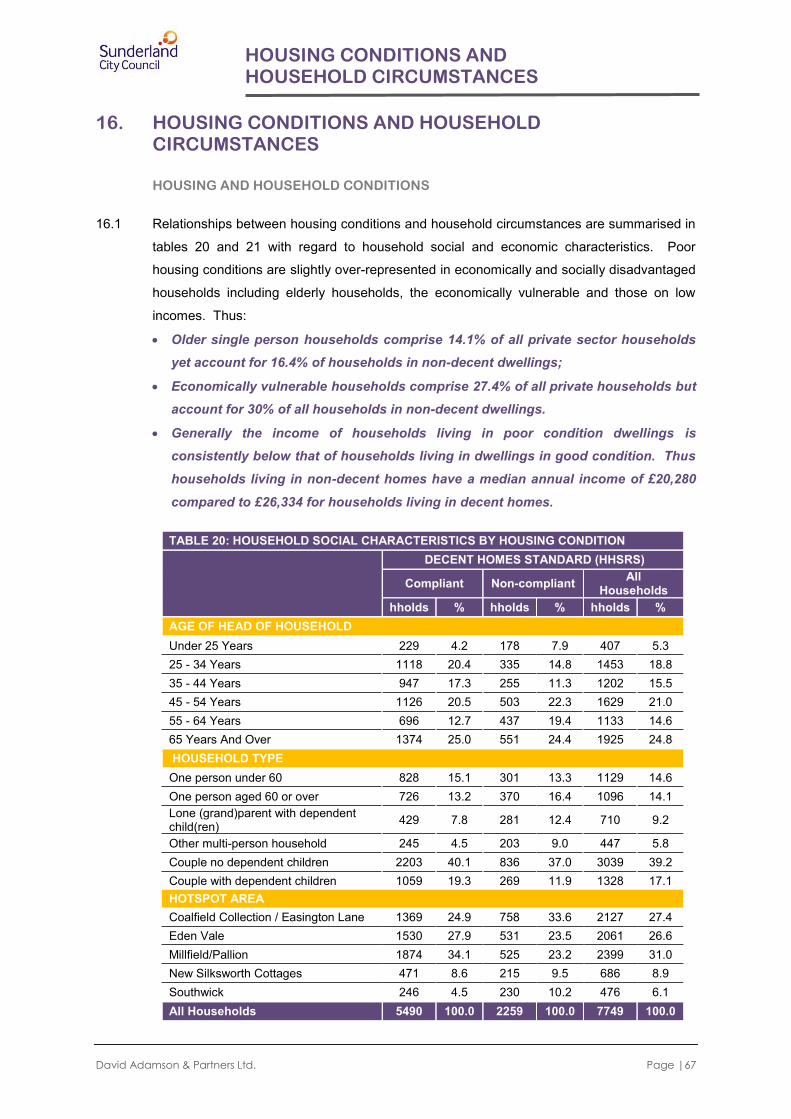
David Adamson & Partners Ltd. Page |67
HOUSING CONDITIONS AND HOUSEHOLD CIRCUMSTANCES
16. HOUSING CONDITIONS AND HOUSEHOLD CIRCUMSTANCES
HOUSING AND HOUSEHOLD CONDITIONS
16.1 Relationships between housing conditions and household circumstances are summarised in
tables 20 and 21 with regard to household social and economic characteristics. Poor
housing conditions are slightly over-represented in economically and socially disadvantaged
households including elderly households, the economically vulnerable and those on low
incomes. Thus:
Older single person households comprise 14.1% of all private sector households yet account for 16.4% of households in non-decent dwellings;
Economically vulnerable households comprise 27.4% of all private households but account for 30% of all households in non-decent dwellings.
Generally the income of households living in poor condition dwellings is consistently below that of households living in dwellings in good condition. Thus households living in non-decent homes have a median annual income of £20,280
compared to £26,334 for households living in decent homes.
TABLE 20: HOUSEHOLD SOCIAL CHARACTERISTICS BY HOUSING CONDITION
DECENT HOMES STANDARD (HHSRS)
Compliant Non-compliant All Households
hholds % hholds % hholds % AGE OF HEAD OF HOUSEHOLD Under 25 Years 229 4.2 178 7.9 407 5.3 25 - 34 Years 1118 20.4 335 14.8 1453 18.8 35 - 44 Years 947 17.3 255 11.3 1202 15.5 45 - 54 Years 1126 20.5 503 22.3 1629 21.0 55 - 64 Years 696 12.7 437 19.4 1133 14.6 65 Years And Over 1374 25.0 551 24.4 1925 24.8 HOUSEHOLD TYPE One person under 60 828 15.1 301 13.3 1129 14.6 One person aged 60 or over 726 13.2 370 16.4 1096 14.1 Lone (grand)parent with dependent child(ren) 429 7.8 281 12.4 710 9.2
Other multi-person household 245 4.5 203 9.0 447 5.8 Couple no dependent children 2203 40.1 836 37.0 3039 39.2 Couple with dependent children 1059 19.3 269 11.9 1328 17.1 HOTSPOT AREA Coalfield Collection / Easington Lane 1369 24.9 758 33.6 2127 27.4 Eden Vale 1530 27.9 531 23.5 2061 26.6 Millfield/Pallion 1874 34.1 525 23.2 2399 31.0 New Silksworth Cottages 471 8.6 215 9.5 686 8.9 Southwick 246 4.5 230 10.2 476 6.1 All Households 5490 100.0 2259 100.0 7749 100.0
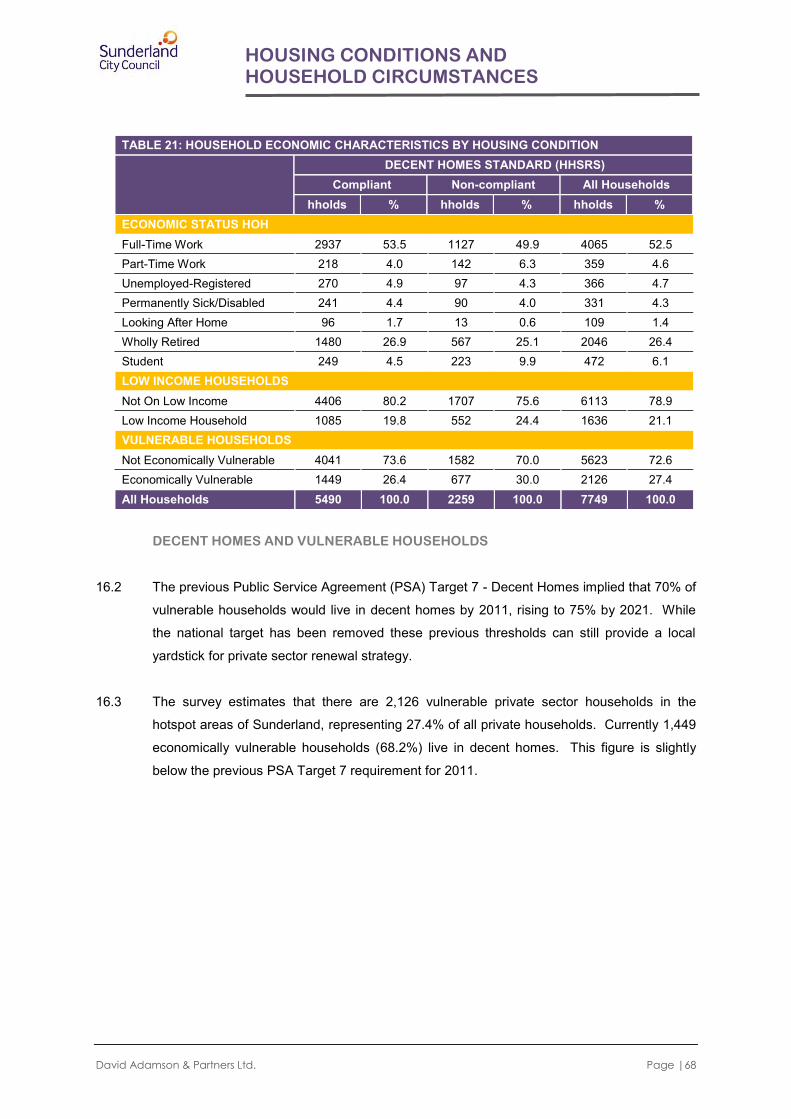
David Adamson & Partners Ltd. Page |68
HOUSING CONDITIONS AND HOUSEHOLD CIRCUMSTANCES
TABLE 21: HOUSEHOLD ECONOMIC CHARACTERISTICS BY HOUSING CONDITION
DECENT HOMES STANDARD (HHSRS)
Compliant Non-compliant All Households hholds % hholds % hholds %
ECONOMIC STATUS HOH Full-Time Work 2937 53.5 1127 49.9 4065 52.5 Part-Time Work 218 4.0 142 6.3 359 4.6 Unemployed-Registered 270 4.9 97 4.3 366 4.7 Permanently Sick/Disabled 241 4.4 90 4.0 331 4.3 Looking After Home 96 1.7 13 0.6 109 1.4 Wholly Retired 1480 26.9 567 25.1 2046 26.4 Student 249 4.5 223 9.9 472 6.1 LOW INCOME HOUSEHOLDS Not On Low Income 4406 80.2 1707 75.6 6113 78.9 Low Income Household 1085 19.8 552 24.4 1636 21.1 VULNERABLE HOUSEHOLDS Not Economically Vulnerable 4041 73.6 1582 70.0 5623 72.6 Economically Vulnerable 1449 26.4 677 30.0 2126 27.4 All Households 5490 100.0 2259 100.0 7749 100.0
DECENT HOMES AND VULNERABLE HOUSEHOLDS
16.2 The previous Public Service Agreement (PSA) Target 7 - Decent Homes implied that 70% of
vulnerable households would live in decent homes by 2011, rising to 75% by 2021. While
the national target has been removed these previous thresholds can still provide a local
yardstick for private sector renewal strategy.
16.3 The survey estimates that there are 2,126 vulnerable private sector households in the
hotspot areas of Sunderland, representing 27.4% of all private households. Currently 1,449
economically vulnerable households (68.2%) live in decent homes. This figure is slightly
below the previous PSA Target 7 requirement for 2011.

David Adamson & Partners Ltd. Page |69
HOUSING CONDITIONS AND HOUSEHOLD CIRCUMSTANCES
17. FUEL POVERTY
FUEL POVERTY CALCULATION
17.1 Fuel poverty is dependent upon, and calculated using two factors:
a) Household circumstances (income) and ability to pay for domestic fuel; and b) The cost of domestic energy as reflected in underlying fuel tariffs and the energy
efficiency of individual properties.
Using these factors, fuel poverty calculation within this report has been based on the new
Department of Energy and Climate Change (DECC) Low Income High Costs (LIHC)
definition. Under this definition a household is considered to be fuel poor where:
They have required fuel costs that are above average; and
Were they to spend that amount, they would be left with a residual income below the official poverty line.
FUEL POVERTY LEVELS
17.2 The median annual fuel cost for households in the five hotspots is estimated at £848. 640
private sector households (8.3%) in these areas are estimated to have both low incomes
and high fuel costs and are in fuel poverty. Levels of fuel poverty locally are below the
average for private sector households in England; 11% in 2012.
HOUSEHOLDS AFFECTED
17.3 Demographically, fuel poverty impacts most strongly on economically vulnerable
households. The elderly and youngest households are particularly affected as well as
households were the head of household is unemployed.
17.4 The median annual income for households in fuel poverty is estimated at £10,920 compared
to £26,334 for households not in fuel poverty.
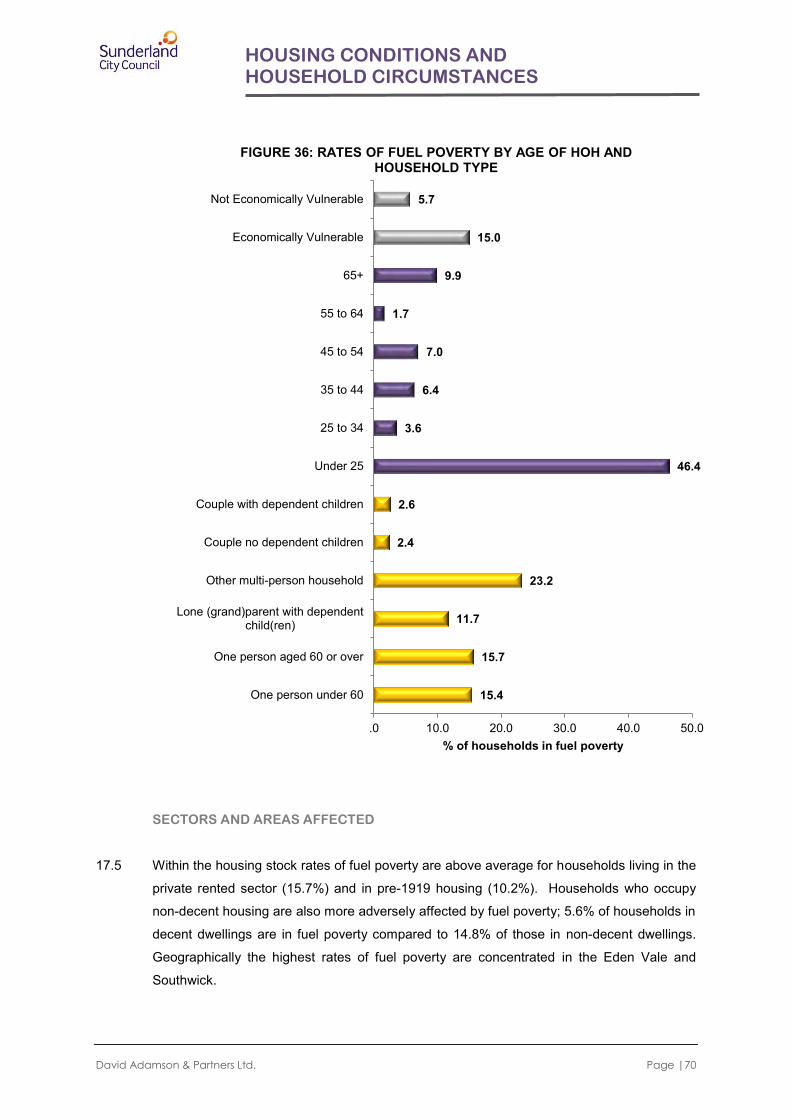
David Adamson & Partners Ltd. Page |70
HOUSING CONDITIONS AND HOUSEHOLD CIRCUMSTANCES
SECTORS AND AREAS AFFECTED
17.5 Within the housing stock rates of fuel poverty are above average for households living in the
private rented sector (15.7%) and in pre-1919 housing (10.2%). Households who occupy
non-decent housing are also more adversely affected by fuel poverty; 5.6% of households in
decent dwellings are in fuel poverty compared to 14.8% of those in non-decent dwellings.
Geographically the highest rates of fuel poverty are concentrated in the Eden Vale and
Southwick.
15.4
15.7
11.7
23.2
2.4
2.6
46.4
3.6
6.4
7.0
1.7
9.9
15.0
5.7
.0 10.0 20.0 30.0 40.0 50.0
One person under 60
One person aged 60 or over
Lone (grand)parent with dependentchild(ren)
Other multi-person household
Couple no dependent children
Couple with dependent children
Under 25
25 to 34
35 to 44
45 to 54
55 to 64
65+
Economically Vulnerable
Not Economically Vulnerable
% of households in fuel poverty
FIGURE 36: RATES OF FUEL POVERTY BY AGE OF HOH AND HOUSEHOLD TYPE

David Adamson & Partners Ltd. Page |71
HOUSING CONDITIONS AND HOUSEHOLD CIRCUMSTANCES
FUEL PAYMENTS AND FUEL USE
17.6 In addition to annual fuel costs residents were asked about their methods for fuel payment
and their attitudes to and use of home heating. Households pay different prices for fuel, with
the best tariffs for gas and electricity available for customers who shop around for on-line
tariffs and pay by direct debit. Such tariffs are often out of reach for some households and
particularly those on low incomes and/or benefits. The most common methods of fuel
payment are by budget account (4,558 households – 58.8%) and quarterly bill (1,491
households – 19.2%). A significant proportion of households do however use other
payment methods with these payment methods reflecting the highest tariffs. 726
households (9.4%) use payment books, 1,311 households (16.9%) use power cards and
453 households (5.8%) use fuel direct. Households may use more than one method to pay
for their fuel and therefore the sum of the individual payment methods is greater than 100.
2.0
2.3
7.8
8.3
13.8
15.8
.0 5.0 10.0 15.0 20.0
New Silksworth Cottages
Coalfield Collection / Easington Lane
Millfield/Pallion
HOTSPOT AVERAGE
Southwick
Eden Vale
% of households
FIGURE 37: FUEL POVERTY BY HOTSPOT AREA

David Adamson & Partners Ltd. Page |72
HOUSING CONDITIONS AND HOUSEHOLD CIRCUMSTANCES
17.7 Households were asked how easy or difficult it was to meet the cost of heating their home to
a comfortable level in winter, and what level of heating they could comfortably achieve.
3,401 households (43.9%) found it quite easy to heat their home; a further 2,692 households
(34.7%) could just afford it. 1,656 households (21.4%) experience difficulty in heating their
home. Not surprisingly, households in fuel poverty experience the greatest difficulty in
heating their home. Just over three quarters of households in fuel poverty experience
difficulty heating their home during winter compared to 16.5% of households not in fuel
poverty.
17.8 High fuel costs and financial restrictions often lead to a reduction in heating within the home
through selective heating of some rooms. 4,478 households (57.8%) stated that they
heated all rooms in the winter; 1,808 households (23.3%) heated most rooms while 1,329
households (17.2%) heated only some rooms or one room. Selective heating is more
common among younger and older households and for those households experiencing fuel
poverty; almost 60% of households in fuel poverty heat only some or one room only during
the winter and less than a fifth heat all their rooms in winter.
FUEL POVERTY FACTORS
17.9 While energy efficiency variations exist for dwellings occupied by households in fuel poverty
and not in fuel poverty differentials are quite small. In this respect dwellings occupied by
households in fuel poverty have an average SAP Rating of 55 compared to 63 for
households not in fuel poverty. While energy efficiency improvements will impact positively
on energy costs the greatest driver for fuel poverty in Sunderland is household income.
5.8
16.9
9.4
58.8
19.2
0 20 40 60 80
Fuel Direct: 453 hholds
Power Cards: 1,311 hholds
Payment Book: 726 hholds
Budget Account: 4,558 hholds
Quarterly Bill: 1,491 hholds
% of households
FIGURE 38: FUEL PAYMENT METHODS
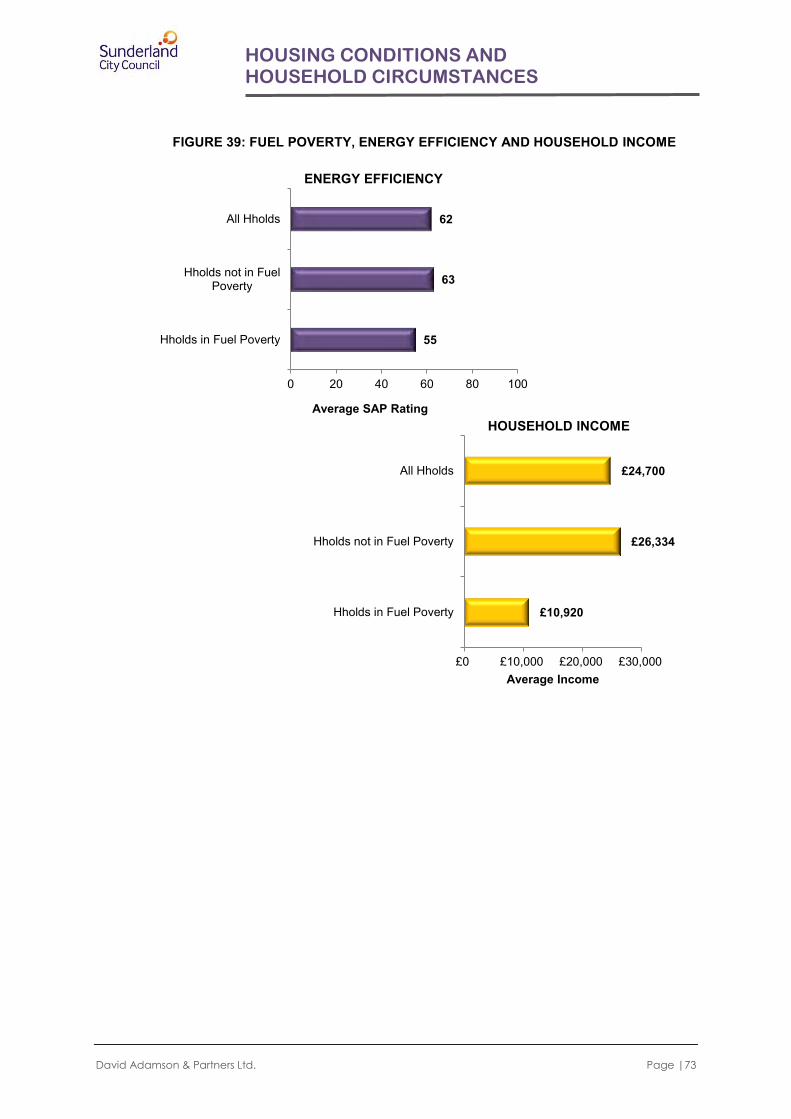
David Adamson & Partners Ltd. Page |73
HOUSING CONDITIONS AND HOUSEHOLD CIRCUMSTANCES
FIGURE 39: FUEL POVERTY, ENERGY EFFICIENCY AND HOUSEHOLD INCOME
55
63
62
0 20 40 60 80 100
Hholds in Fuel Poverty
Hholds not in FuelPoverty
All Hholds
Average SAP Rating
ENERGY EFFICIENCY
£10,920
£26,334
£24,700
£0 £10,000 £20,000 £30,000
Hholds in Fuel Poverty
Hholds not in Fuel Poverty
All Hholds
Average Income
HOUSEHOLD INCOME

David Adamson & Partners Ltd. Page |74
HOUSING CONDITIONS AND HOUSEHOLD CIRCUMSTANCES
18. HOUSING AND HEALTH
18.1 There is a substantial body of research into the relationship between poor housing and poor
health and a growing national interest in the cost of unhealthy housing to society and the
potential health cost benefit of housing interventions. The current survey, in addition to
quantifying current levels of unhealthy housing in the hotspot areas of Sunderland through
measurement of the Housing Health and Safety Rating System, has examined a range of
related household health issues. These have included:
The presence of long-term illness/disability, its impact on normal dwelling
occupation and its impact on health service resources; and
The incidence of accidents within the home and their impact on health service resources.
Using national case study data published for England2 we have also attempted to quantify
the economic cost of unhealthy housing in the areas of interest.
LONG-TERM ILLNESS AND DISABILITY
18.2 1,764 households in the hotspot areas (22.8%) indicated that at least one household
member was affected by a long-term illness or disability. Illness/disability is strongly age-
related. 839 households affected by illness/disability (47.6%) have a head of household
aged 65 years and over, a further 334 households affected (18.9%) have a head of
household aged 55 - 64 years.
18.3 Households affected by a long-term illness/disability were asked for the nature of that
illness/disability. The most common complaints relate to:
Heart/Circulatory Problems: 790 households – 44.8%;
Mobility impairment/physical disability: 789 households – 44.7%;
Other physical disability: 602 households – 34.1% and
Respiratory Illness: 557 households – 31.6%
For many households either one individual suffers several illness/disabilities or the
household contains more than one person with an illness/disability. Consequently the
number of individual complaints is in excess of the number of households affected.
2 Quantifying the economic cost of unhealthy housing - a case study from England 2011. Simon Nicol, Mike Roys, Maggie Davidson, David Ormandy, Peter Ambrose.
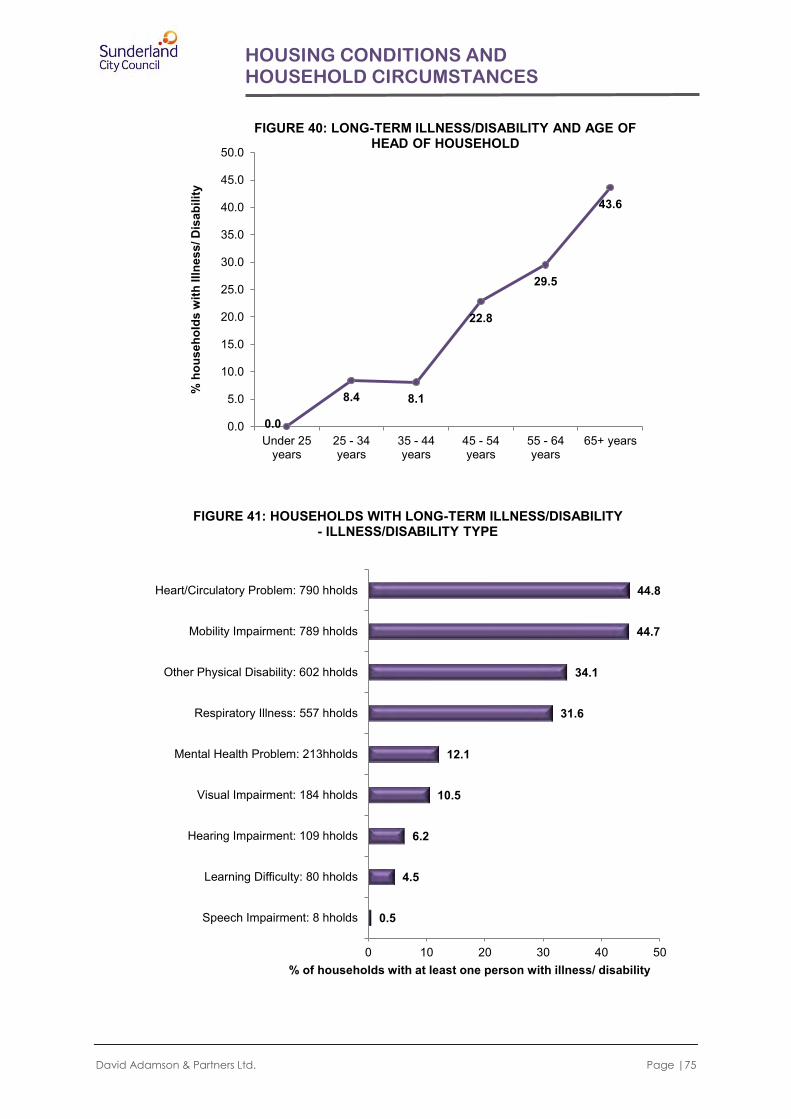
David Adamson & Partners Ltd. Page |75
HOUSING CONDITIONS AND HOUSEHOLD CIRCUMSTANCES
0.0
8.4 8.1
22.8
29.5
43.6
0.0
5.0
10.0
15.0
20.0
25.0
30.0
35.0
40.0
45.0
50.0
Under 25years
25 - 34years
35 - 44years
45 - 54years
55 - 64years
65+ years
% h
ouse
hold
s w
ith Il
lnes
s/ D
isab
ility
FIGURE 40: LONG-TERM ILLNESS/DISABILITY AND AGE OF HEAD OF HOUSEHOLD
0.5
4.5
6.2
10.5
12.1
31.6
34.1
44.7
44.8
0 10 20 30 40 50
Speech Impairment: 8 hholds
Learning Difficulty: 80 hholds
Hearing Impairment: 109 hholds
Visual Impairment: 184 hholds
Mental Health Problem: 213hholds
Respiratory Illness: 557 hholds
Other Physical Disability: 602 hholds
Mobility Impairment: 789 hholds
Heart/Circulatory Problem: 790 hholds
% of households with at least one person with illness/ disability
FIGURE 41: HOUSEHOLDS WITH LONG-TERM ILLNESS/DISABILITY - ILLNESS/DISABILITY TYPE

David Adamson & Partners Ltd. Page |76
HOUSING CONDITIONS AND HOUSEHOLD CIRCUMSTANCES
18.4 Households experiencing illness/disability were asked if this had resulted in the use of
health service resources during the past year. Health service contact in the past year is
significant among households experiencing illness/disability.
TABLE 22: HOUSEHOLDS WITH ILLNESS/DISABILITY - HEALTH SERVICE ACTION WITHIN PAST YEAR
No Yes All Households with
Illness/ Disability hholds % hholds % hholds %
Consult GP Through Surgery Visit 473 26.8 1290 73.2 1764 100.0
Consult GP Through Home Visit 1333 75.6 430 24.4 1764 100.0 Consult NHS Direct 1670 94.7 94 5.3 1764 100.0 Attend Hospital Accident/Emergency 1531 86.8 232 13.2 1764 100.0
Attend Hospital As Outpatient 889 50.4 874 49.6 1764 100.0 Attend Hospital As Inpatient 1319 74.8 444 25.2 1764 100.0
1,290 households containing at least one individual with an illness/disability (73.2%) have
made a surgery visit to their GP, 430 households (24.4%) have arranged a home visit from
their GP, and 874 households (49.6%) have attended hospital as an outpatient. Only 189
(10.7%) households with at least one individual with a long-term illness or disability have
had no contact with a health service provider over the previous year.
MOBILITY AND ADAPTATION
18.5 Of the 1,764 households affected by a long-term illness or disability, 857 households
(48.2%) stated that they had a mobility problem within their dwelling. Normal use and
occupation of the dwelling was unaffected for the remaining 906 households (51.4%).
Among households where mobility is affected the most common problems relate to climbing
stairs and to using bathroom amenities.
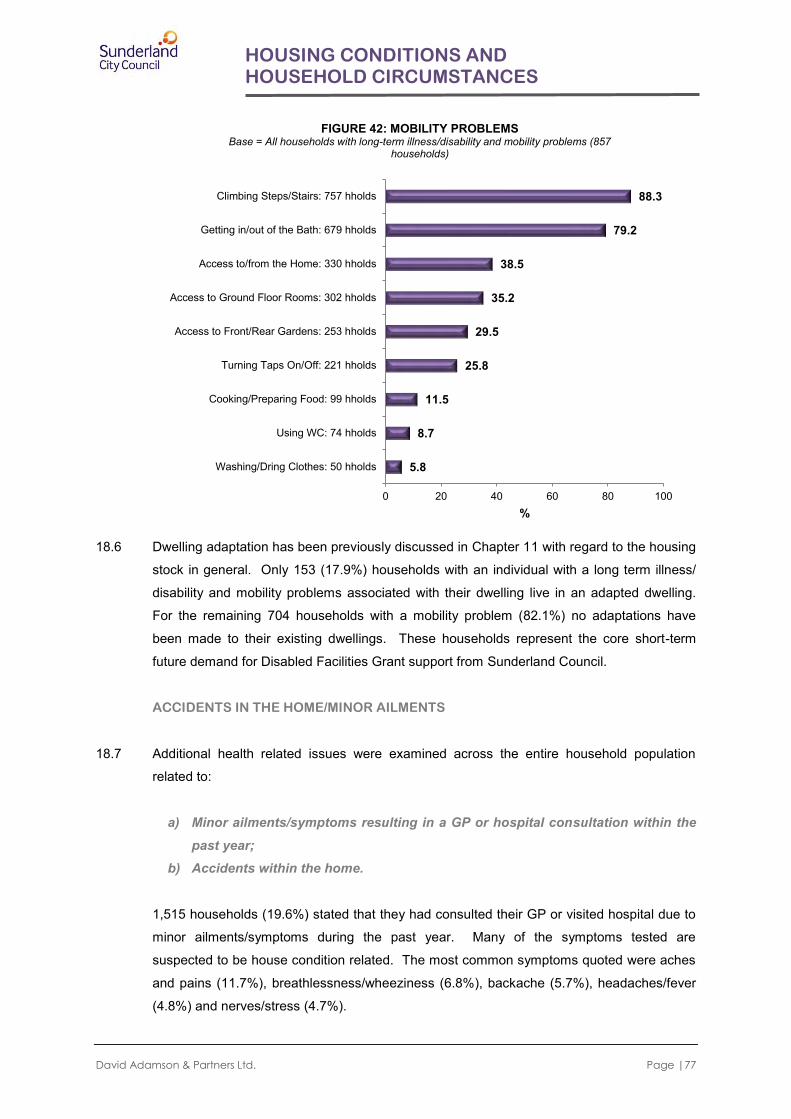
David Adamson & Partners Ltd. Page |77
HOUSING CONDITIONS AND HOUSEHOLD CIRCUMSTANCES
18.6 Dwelling adaptation has been previously discussed in Chapter 11 with regard to the housing
stock in general. Only 153 (17.9%) households with an individual with a long term illness/
disability and mobility problems associated with their dwelling live in an adapted dwelling.
For the remaining 704 households with a mobility problem (82.1%) no adaptations have
been made to their existing dwellings. These households represent the core short-term
future demand for Disabled Facilities Grant support from Sunderland Council.
ACCIDENTS IN THE HOME/MINOR AILMENTS
18.7 Additional health related issues were examined across the entire household population
related to:
a) Minor ailments/symptoms resulting in a GP or hospital consultation within the past year;
b) Accidents within the home.
1,515 households (19.6%) stated that they had consulted their GP or visited hospital due to
minor ailments/symptoms during the past year. Many of the symptoms tested are
suspected to be house condition related. The most common symptoms quoted were aches
and pains (11.7%), breathlessness/wheeziness (6.8%), backache (5.7%), headaches/fever
(4.8%) and nerves/stress (4.7%).
5.8
8.7
11.5
25.8
29.5
35.2
38.5
79.2
88.3
0 20 40 60 80 100
Washing/Dring Clothes: 50 hholds
Using WC: 74 hholds
Cooking/Preparing Food: 99 hholds
Turning Taps On/Off: 221 hholds
Access to Front/Rear Gardens: 253 hholds
Access to Ground Floor Rooms: 302 hholds
Access to/from the Home: 330 hholds
Getting in/out of the Bath: 679 hholds
Climbing Steps/Stairs: 757 hholds
%
FIGURE 42: MOBILITY PROBLEMS Base = All households with long-term illness/disability and mobility problems (857
households)

David Adamson & Partners Ltd. Page |78
HOUSING CONDITIONS AND HOUSEHOLD CIRCUMSTANCES
Households most affected by minor ailments/symptoms are primarily those containing at
least one individual aged 60 or over.
18.8 The risk of accidents in the home, including falls/shocks, burns, fires, scalds and
collisions/cuts/strains, is measured within the HHSRS and has been reported previously in
Chapter 10 of the report. Households were asked if any member had an accident in the
home during the past year. Only 396 households (5.1%) stated that a household member
had been affected with over three quarters related to a trip or fall. In the vast majority of the
dwellings these households reside in a dwelling that exhibits a Category 2 hazard related to
falls.
HOUSEHOLD VIEWS ON HOUSING AND HEALTH
18.9 Households were asked for their views on whether the design/condition of their home
affected the health and well-being of their family. 4,975 households (64.2%) perceived no
effect through condition with a further 1,965 households (25.4%) perceiving a positive effect
through good quality/condition housing. 481 households (6.2%) thought that their current
housing conditions impacted negatively on their family’s health, the remaining 328 did not
know if there was an impact.
18.10 On a scale of 0 (not at all) to 10 (completely) respondents were asked to score the following
statements;
Overall, how satisfied are you with your life nowadays?;
0.9
1.0
2.2
2.5
4.7
4.8
5.7
6.8
11.7
19.6
0 5 10 15 20 25
Diarrhoea: 69 hholds
Vomiting: 80 hholds
Fainting: 444 hholds
Blocked Nose: 191 hholds
Nerves/Stress: 364 hholds
Headaches/Fever: 369 hholds
Backache: 444 hholds
Breathlessness/Wheeziness: 530 hholds
Aches and Pains: 904 hholds
Any Symptom: 1,515 hholds
% of households
FIGURE 43: HOUSEHOLDS AFFECTED BY MINOR AILMENT/SYMPTOM RESULTING IN GP CONSULTATION OR HOSPITAL VISIT IN LAST YEAR

David Adamson & Partners Ltd. Page |79
HOUSING CONDITIONS AND HOUSEHOLD CIRCUMSTANCES
Overall, to what extent do you feel that the things you do in your life are worthwhile?;
Overall, how happy did you feel yesterday?; and
Overall, how anxious did you feel yesterday?
Figures 44 to 47 illustrate the range of responses to these questions.
3.4 .9 1.7
8.7
11.9
19.9
29.0
11.5 12.9
1 2 3 4 5 6 7 8 9 10.0
5.0
10.0
15.0
20.0
25.0
30.0
35.0
Perc
ent o
f Hou
seho
lds
FIGURE 44: HOW SATISFIED ARE YOU WITH YOUR LIFE NOWADAYS?
Not at all Completely
2.4 1.1 1.7
10.7 11.9
21.2
25.7
12.7 12.7
1 2 3 4 5 6 7 8 9 10.0
5.0
10.0
15.0
20.0
25.0
30.0
Perc
ent o
f Hou
seho
lds
FIGURE 45: TO WHAT EXTENT DO YOU FEEL THAT THE THINGS YOU DO ARE WORTHWHILE?
Not at all Completely

David Adamson & Partners Ltd. Page |80
HOUSING CONDITIONS AND HOUSEHOLD CIRCUMSTANCES
THE ECONOMICS OF HOUSING INTERVENTION
18.11 Recent research in England has examined and quantified the costs, and benefits to the NHS
of reducing HHSRS Category 1 hazards to an acceptable level :- ‘Quantifying the economic
cost of unhealthy housing - a case study from England’, 2011, Simon Nichol, Mike Roys,
.3 .3 2.2 1.5 2.2
9.9
13.7
18.1
26.9
11.5 13.4
0 1 2 3 4 5 6 7 8 9 10.0
5.0
10.0
15.0
20.0
25.0
30.0Pe
rcen
t of H
ouse
hold
s
FIGURE 46: HOW HAPPY DID YOU FEEL YESTERDAY?
Not at all Completely
20.3
9.5
17.1
4.3
6.3 7.5
3.3
6.7
10.0
6.1
9.0
0 1 2 3 4 5 6 7 8 9 10.0
5.0
10.0
15.0
20.0
25.0
Perc
ent o
f Hou
seho
lds
FIGURE 47: HOW ANXIOUS DID YOU FEEL YESTERDAY?
Not at all Completely
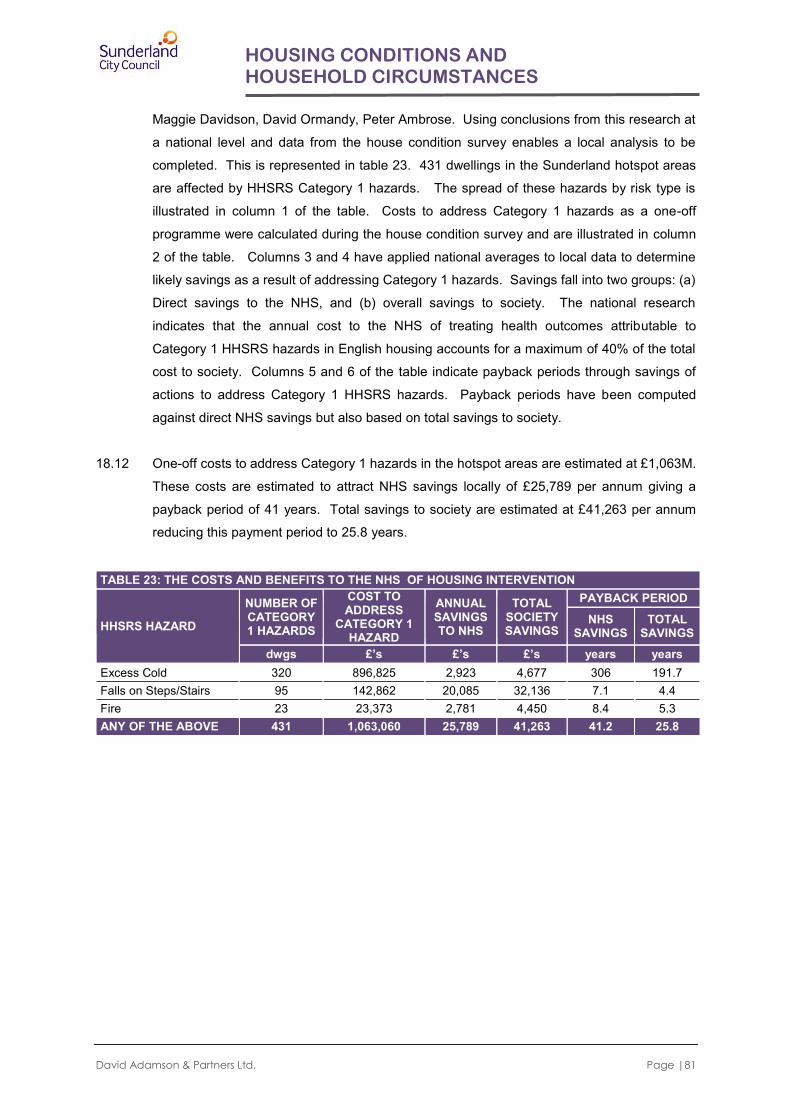
David Adamson & Partners Ltd. Page |81
HOUSING CONDITIONS AND HOUSEHOLD CIRCUMSTANCES
Maggie Davidson, David Ormandy, Peter Ambrose. Using conclusions from this research at
a national level and data from the house condition survey enables a local analysis to be
completed. This is represented in table 23. 431 dwellings in the Sunderland hotspot areas
are affected by HHSRS Category 1 hazards. The spread of these hazards by risk type is
illustrated in column 1 of the table. Costs to address Category 1 hazards as a one-off
programme were calculated during the house condition survey and are illustrated in column
2 of the table. Columns 3 and 4 have applied national averages to local data to determine
likely savings as a result of addressing Category 1 hazards. Savings fall into two groups: (a)
Direct savings to the NHS, and (b) overall savings to society. The national research
indicates that the annual cost to the NHS of treating health outcomes attributable to
Category 1 HHSRS hazards in English housing accounts for a maximum of 40% of the total
cost to society. Columns 5 and 6 of the table indicate payback periods through savings of
actions to address Category 1 HHSRS hazards. Payback periods have been computed
against direct NHS savings but also based on total savings to society.
18.12 One-off costs to address Category 1 hazards in the hotspot areas are estimated at £1,063M.
These costs are estimated to attract NHS savings locally of £25,789 per annum giving a
payback period of 41 years. Total savings to society are estimated at £41,263 per annum
reducing this payment period to 25.8 years.
TABLE 23: THE COSTS AND BENEFITS TO THE NHS OF HOUSING INTERVENTION
HHSRS HAZARD
NUMBER OF CATEGORY 1 HAZARDS
COST TO ADDRESS
CATEGORY 1 HAZARD
ANNUAL SAVINGS TO NHS
TOTAL SOCIETY SAVINGS
PAYBACK PERIOD
NHS SAVINGS
TOTAL SAVINGS
dwgs £’s £’s £’s years years Excess Cold 320 896,825 2,923 4,677 306 191.7 Falls on Steps/Stairs 95 142,862 20,085 32,136 7.1 4.4 Fire 23 23,373 2,781 4,450 8.4 5.3 ANY OF THE ABOVE 431 1,063,060 25,789 41,263 41.2 25.8

David Adamson & Partners Ltd. Page |82
HOUSING CONDITIONS AND HOUSEHOLD CIRCUMSTANCES
19. HOUSEHOLD ATTITUDES TO HOUSING AND LOCAL AREAS
19.1 Balancing surveyors’ views on housing and environmental conditions previously reported,
household views were assessed with regard to:
Satisfaction with housing circumstances;
Satisfaction with the local area;
Attitudes to area trends; and
Problems within their local area, including perceptions of local safety. HOUSING SATISFACTION
19.2 Housing satisfaction levels are good. 6,004 households (77.5%) are very satisfied with their
current accommodation, 1,364 households (17.6%) are fairly satisfied. Only, 364
households (4.7%) expressed direct dissatisfaction with their home.
19.3 Slight variations in housing dissatisfaction are evident between housing sectors and
geographically across the hotspot areas. Dissatisfaction with current housing is above
average in the private rented sector, and for households resident in flats. While the majority
of households living in non-decent homes remain satisfied with their current
accommodation, levels of dissatisfaction are higher than for households living in decent
homes:
256 households living in private rented accommodation are dissatisfied with their current accommodation representing 8.5% of all households renting privately and
77.5%
17.6% 3.5% 1.2% 0.2%
FIGURE 48: HOUSEHOLD SATISFACTION WITH CURRENT HOUSING
Very Satisfied Quite Satisfied Fairly DissatisfiedVery Dissatidfied Don't Know
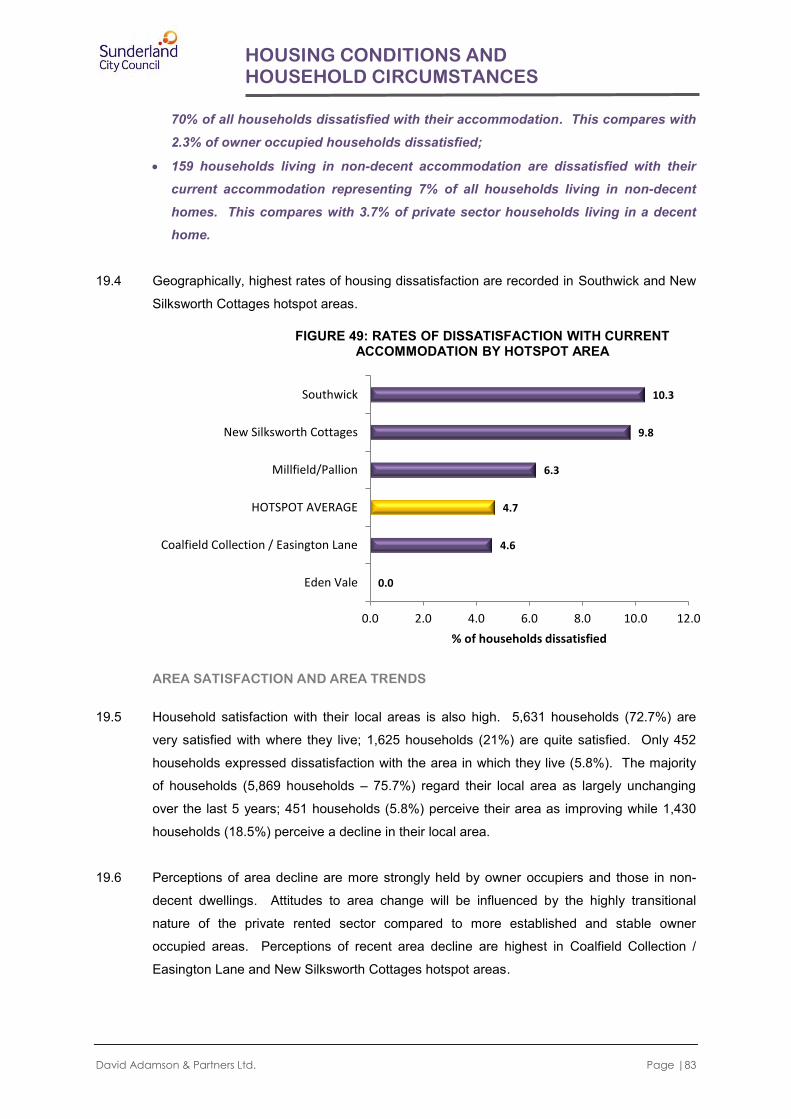
David Adamson & Partners Ltd. Page |83
HOUSING CONDITIONS AND HOUSEHOLD CIRCUMSTANCES
70% of all households dissatisfied with their accommodation. This compares with 2.3% of owner occupied households dissatisfied;
159 households living in non-decent accommodation are dissatisfied with their current accommodation representing 7% of all households living in non-decent homes. This compares with 3.7% of private sector households living in a decent home.
19.4 Geographically, highest rates of housing dissatisfaction are recorded in Southwick and New
Silksworth Cottages hotspot areas.
AREA SATISFACTION AND AREA TRENDS
19.5 Household satisfaction with their local areas is also high. 5,631 households (72.7%) are
very satisfied with where they live; 1,625 households (21%) are quite satisfied. Only 452
households expressed dissatisfaction with the area in which they live (5.8%). The majority
of households (5,869 households – 75.7%) regard their local area as largely unchanging
over the last 5 years; 451 households (5.8%) perceive their area as improving while 1,430
households (18.5%) perceive a decline in their local area.
19.6 Perceptions of area decline are more strongly held by owner occupiers and those in non-
decent dwellings. Attitudes to area change will be influenced by the highly transitional
nature of the private rented sector compared to more established and stable owner
occupied areas. Perceptions of recent area decline are highest in Coalfield Collection /
Easington Lane and New Silksworth Cottages hotspot areas.
0.0
4.6
4.7
6.3
9.8
10.3
0.0 2.0 4.0 6.0 8.0 10.0 12.0
Eden Vale
Coalfield Collection / Easington Lane
HOTSPOT AVERAGE
Millfield/Pallion
New Silksworth Cottages
Southwick
% of households dissatisfied
FIGURE 49: RATES OF DISSATISFACTION WITH CURRENT ACCOMMODATION BY HOTSPOT AREA

David Adamson & Partners Ltd. Page |84
HOUSING CONDITIONS AND HOUSEHOLD CIRCUMSTANCES
AREA PROBLEMS
19.7 In addition to general area attitudes, households were prompted to comment on a range of
issues which might represent problems within their areas. Key issues emerging as
important include dog fouling, litter/fly tipping and public drinking.
26.4
21.6
17.2
12.5
10.3
15.3
26.1
23.4
10.6
18.5
.0 5.0 10.0 15.0 20.0 25.0 30.0
Coalfield Collection / Easington Lane
New Silksworth Cottages
Millfield/Pallion
Eden Vale
Southwick
Decent
Non-decent
Owner occupied
Private rent
HOTSPOT AVERAGE
% of households perceiving area declined
FIGURE 50: PERCEPTION OF RECENT DECLINE BY HOTSPOT AREA
TENURE
HOTSPOT AREA
DECENT HOME

David Adamson & Partners Ltd. Page |85
HOUSING CONDITIONS AND HOUSEHOLD CIRCUMSTANCES
0 5 10 15 20 25
Racial Harrassment
Personal Asault/Theft
Graffiti
Empty Properties
Unsocial Behaviour
Car Crime
Youth Annoyance
Drug Abuse/Dealing
Traffic Noise
Public Drinking
Property Crime
Litter/Fly Tipping
Dog Fouling
% of households
FIGURE 51: PERCEPTIONS OF NEIGHBOURHOOD ISSUES
Minor Problem
Major Problem
David Adamson & Partners Ltd. Page |86
SECTION 6:
SECTORAL REVIEW
Chapter 20: Comparative Conditions – Owner Occupied and
Private Rented Sectors
Chapter 21: Owner occupiers in Non-decent Homes
Chapter 22: The Private Rented Sector

David Adamson & Partners Ltd. Page |87
SECTORAL REVIEW
20. COMPARATIVE CONDITIONS - OWNER OCCUPIED AND PRIVATE RENTED SECTORS
20.1 Comparisons between the main private sector tenures have been made throughout this
report but are summarised for ease of reference in Figures 52 and 53 with regard to both
physical condition and household indicators.
PHYSICAL HOUSING CONDITIONS
20.2 Housing conditions are consistently worse for private rented housing in the hotspot areas of
Sunderland on most indicators of housing condition. Overall, 1,032 private rented dwellings
fail the Decent Homes Standard representing 30.9% of all private rented dwellings. In
comparison, 25.3% of owner occupied homes fail the Decent Homes Standard. The private
rented sector accounts for 37.2% of all private dwellings in the hotspot areas yet accounts
for 40.3% of all dwellings non-decent.
30.9
8.5
24.8
5.6
25.3
8.9
16.4
4.9
0 5 10 15 20 25 30 35
DECENT HOMES
Thermal Comfort
Disrepair
Category 1Hazard
% Non-Compliant
FIGURE 52: HOUSING CONDITIONS IN THE OWNER OCCUPIED AND PRIVATE RENTED SECTORS
Owner Occupied
Private Rented
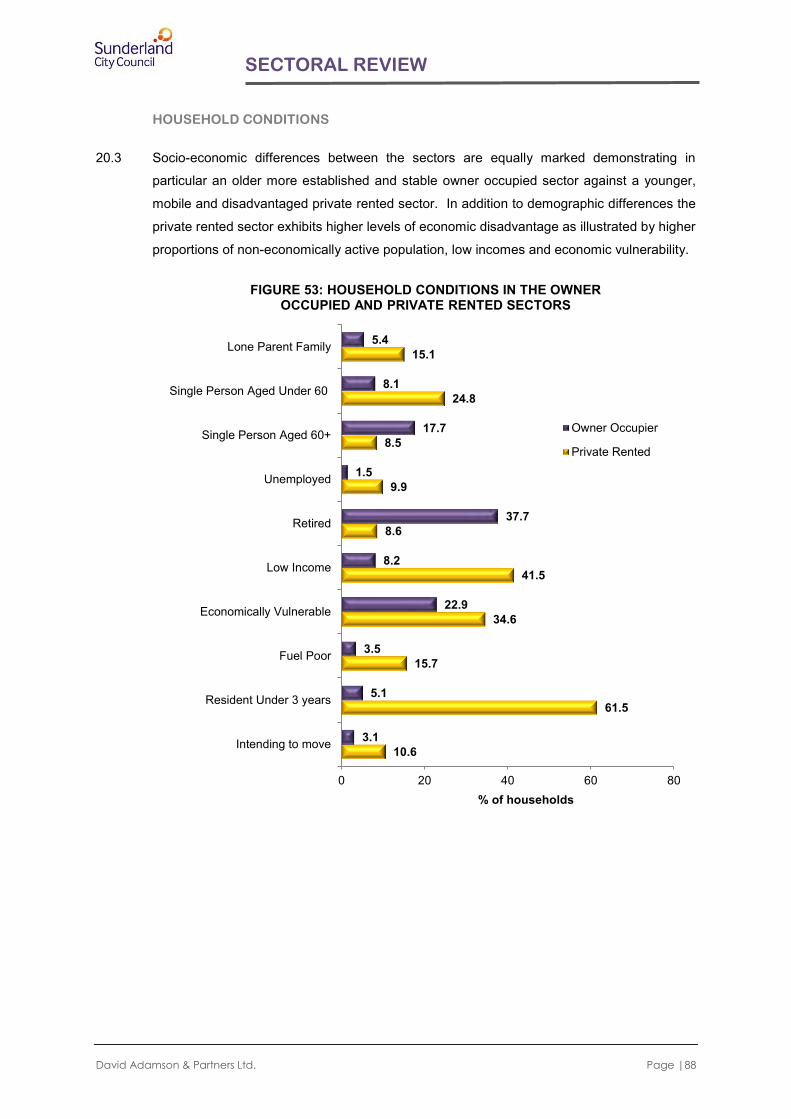
David Adamson & Partners Ltd. Page |88
SECTORAL REVIEW
HOUSEHOLD CONDITIONS
20.3 Socio-economic differences between the sectors are equally marked demonstrating in
particular an older more established and stable owner occupied sector against a younger,
mobile and disadvantaged private rented sector. In addition to demographic differences the
private rented sector exhibits higher levels of economic disadvantage as illustrated by higher
proportions of non-economically active population, low incomes and economic vulnerability.
10.6
61.5
15.7
34.6
41.5
8.6
9.9
8.5
24.8
15.1
3.1
5.1
3.5
22.9
8.2
37.7
1.5
17.7
8.1
5.4
0 20 40 60 80
Intending to move
Resident Under 3 years
Fuel Poor
Economically Vulnerable
Low Income
Retired
Unemployed
Single Person Aged 60+
Single Person Aged Under 60
Lone Parent Family
% of households
FIGURE 53: HOUSEHOLD CONDITIONS IN THE OWNER OCCUPIED AND PRIVATE RENTED SECTORS
Owner Occupier
Private Rented

David Adamson & Partners Ltd. Page |89
SECTORAL REVIEW
21. OWNER OCCUPIERS IN NON DECENT HOMES 21.1 Owner occupied households were the focus of additional analyses during the house condition
survey. Areas of special interest have included:
a) Relationships between house condition and economic/social circumstances guiding intervention and support strategies within the sector;
b) Past improvement histories and improvement intentions; and c) Attitudes to the funding of repairs/improvements including methods of payment
and interest in Council loans or equity release. A desktop valuation of private sector housing has also been completed providing indications of equity potential when linked with information on mortgage holdings.
INTERVENTION FRAMEWORK
21.2 A potential framework for intervention within the owner occupied sector is illustrated in Figure
54. Three main targets for support have been identified within this framework including:
Economically Vulnerable households;
Elderly households; non Economically Vulnerable; and
Families with Children; non Economically Vulnerable. 21.3 1,243 owner occupied households (26.2%) live in homes which are non-decent with total
outstanding expenditure on decent homes improvements of £7.279M. 345 households
within this sector are economically vulnerable representing 27.8% of the total. Estimated
improvement expenditure for these households is £2.206M.

David Adamson & Partners Ltd. Page |90
SECTORAL REVIEW
FIGURE 54: OWNER OCCUPIED INTERVENTION FRAMEWORK
Base = Owner occupied households in non-decent homes
OWNER-OCCUPIED HOUSEHOLDS
CATEGORY 1: ECONOMICALLY
VULNERABLE
CATEGORY 2: ELDERLY - NON ECONOMICALLY
VULNERABLE
CATEGORY 3: HOUSEHOLDS WITH
CHILDREN - NON ECONOMICALLY
VULNERABLE
CATEGORY 4: REMAINING OWNER
OCCUPIED HOUSEHOLDS
NON DECENT
INVESTMENT REQUIRED
: 1,243 h/holds (100.0%)
: £7.279M (100.0%)
: 345 h/holds (27.8%)
: £2.206M (30.3%)
: 343 h/holds (27.6%)
: £2.018M (27.7%)
: 205 h/holds (16.5%)
: £1.261M (17.3%)
: 350 h/holds (28.2%)
: £1.794M (24.6%)
NON DECENT
INVESTMENT REQUIRED
NON DECENT
INVESTMENT REQUIRED
NON DECENT
INVESTMENT REQUIRED
NON DECENT
INVESTMENT REQUIRED

David Adamson & Partners Ltd. Page |91
SECTORAL REVIEW
Among owner occupied households living in non-decent conditions; 343 households (27.6%)
are elderly in composition but not economically vulnerable and 205 households (16.5%)
contain children. These households are not economically vulnerable by definition but may be
under pressure financially to improve and maintain their homes. Outstanding expenditure
against these groups to achieve the decent homes standard is estimated at £3.279M.
OWNER OCCUPIED ATTITUDES AND BEHAVIOUR
21.4 While economic factors will influence the ability of owner occupiers to improve and repair their
homes, other factors will also impact. Housing satisfaction levels have been reported as high
and these are retained among owner occupiers in non-decent housing. 1,013 owner
occupiers living in non-decent housing (81.5%) are very satisfied with their current home; an
additional 200 households (16.1%) are quite satisfied. Only 30 owner occupiers in non-decent
homes (2.4%) expressed direct dissatisfaction with their current accommodation.
21.5 Against these attitudes to housing, previous and projected home improvement activity levels
among owner occupiers remain mixed. 712 owner occupiers in non-decent homes (57.3%)
have completed no major repairs/improvements in the last 5 years, 995 households (80%)
have no definite intentions to carry out major repairs/improvements, within the next 5 years.
21.6 Equity release remains a Government recommendation to achieve an increase in owner
occupied funding for home improvement. The availability of equity and its use by owner
occupiers is dependent upon three key factors:
a) The value of owner occupied housing assets; b) Existing owner occupied mortgage holdings; and c) Owner occupied attitudes to the use of available equity for home improvement
purposes.
21.7 During the survey owner occupiers were asked for information on their current mortgage
position. In support of this information a desktop valuation of private occupied homes was
completed from Land Registry sources. Property values less existing mortgage holdings
provides an indicator of equity potential.
21.8 2,231 owner occupied households (47%) have existing mortgage or financial commitments
against their home. The remaining 2,513 households (53%) have no mortgage or financial
commitments. Among households with a mortgage, the average size of this mortgage is
estimated at £32,786 per household giving total mortgage holdings of £73 million.

David Adamson & Partners Ltd. Page |92
SECTORAL REVIEW
TABLE 24: OWNER OCCUPIED MORTGAGE HOLDINGS OUTSTANDING MORTGAGE HOUSEHOLDS % £’s… No Mortgage Commitment 2513 53.0 4000 434 9.1 10000 267 5.6 22500 598 12.6 37500 236 5.0 52500 246 5.2 67500 284 6.0 82500 153 3.2 130000 13 0.3 ALL HOUSEHOLDS 4744 100.0
21.9 Average owner occupied property prices have been estimated from Land Registry sources
producing a valuation of owner occupied housing of £413.115 million. Compared with
mortgage holdings this provides an equity potential of £339.986 million.
Given the significant difference between property values and mortgage holdings, equity
potential exists across all areas and sub-sectors of the owner occupied housing market.
21.10 Equity potential exhibits a strong relationship to household age and household type. In this
respect equity levels increase significantly with age and are higher for elderly households as
opposed to younger single person and family households.
413.115
73.130
339.986
0
50
100
150
200
250
300
350
400
450
Property Valuation Mortgage Holdings Equity Potential
£'s
Bill
ion
FIGURE 55: MORTGAGE, VALUATION AND EQUITY

David Adamson & Partners Ltd. Page |93
SECTORAL REVIEW
21.11 A central issue locally is not the undoubted existence of owner occupied property equity but
the release of this equity for home improvement/repair activity. Households were
questioned on their attitudes to such release. 836 households (18%) stated that they would
re-mortgage their dwelling for home improvements. A slightly larger number of households
– 892 households (19.2%) - were interested in repayable interest free loans provided by the
Council. Among owner occupied households living in non-decent homes 18.4% stated that
they would re-mortgage for home improvements, 24.3% are interested in Council interest
free loans.
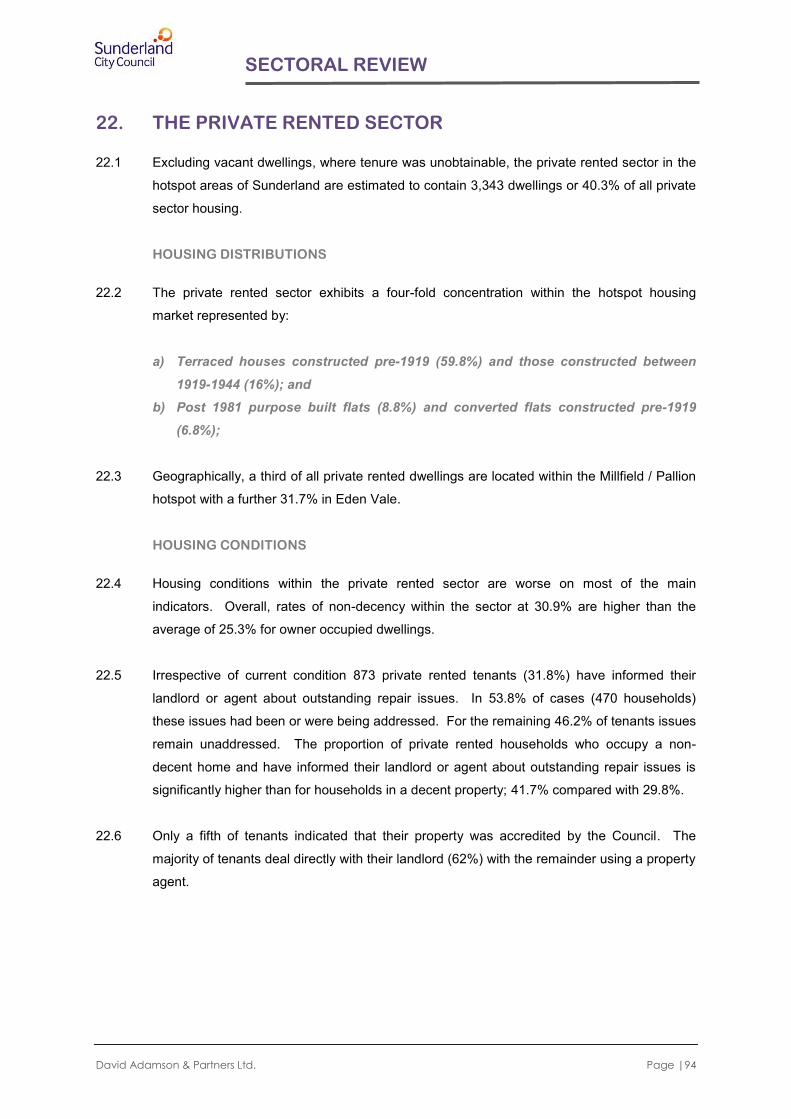
David Adamson & Partners Ltd. Page |94
SECTORAL REVIEW
22. THE PRIVATE RENTED SECTOR 22.1 Excluding vacant dwellings, where tenure was unobtainable, the private rented sector in the
hotspot areas of Sunderland are estimated to contain 3,343 dwellings or 40.3% of all private
sector housing.
HOUSING DISTRIBUTIONS
22.2 The private rented sector exhibits a four-fold concentration within the hotspot housing
market represented by:
a) Terraced houses constructed pre-1919 (59.8%) and those constructed between 1919-1944 (16%); and
b) Post 1981 purpose built flats (8.8%) and converted flats constructed pre-1919 (6.8%);
22.3 Geographically, a third of all private rented dwellings are located within the Millfield / Pallion
hotspot with a further 31.7% in Eden Vale.
HOUSING CONDITIONS
22.4 Housing conditions within the private rented sector are worse on most of the main
indicators. Overall, rates of non-decency within the sector at 30.9% are higher than the
average of 25.3% for owner occupied dwellings.
22.5 Irrespective of current condition 873 private rented tenants (31.8%) have informed their
landlord or agent about outstanding repair issues. In 53.8% of cases (470 households)
these issues had been or were being addressed. For the remaining 46.2% of tenants issues
remain unaddressed. The proportion of private rented households who occupy a non-
decent home and have informed their landlord or agent about outstanding repair issues is
significantly higher than for households in a decent property; 41.7% compared with 29.8%.
22.6 Only a fifth of tenants indicated that their property was accredited by the Council. The
majority of tenants deal directly with their landlord (62%) with the remainder using a property
agent.

David Adamson & Partners Ltd. Page |95
SECTION 7:
CONCLUSIONS
Chapter 23: Conclusions

David Adamson & Partners Ltd. Page |96
CONCLUSIONS
23. CONCLUSIONS
23.1 This report has presented the findings of a comprehensive survey of housing and household
conditions in five hotspot areas within Sunderland. The survey provides an important
benchmark for the refinement and further development of private sector housing strategies
within these localities.
23.2 The survey has been conducted across a private sector housing stock of 8,981 dwellings
containing 7,749 households and a household population of 17,315 persons. Private rented
dwellings comprise 37.2% of the hotspot’s private sector housing stock; significantly above
the national average.
23.3 Significant issues require addressing in the private housing sector. 2,560 dwellings (28.5%)
fail the requirements of the Decent Homes Standard with estimated improvement costs of
£17.347M net. Within the Decent Homes Standard:
431 dwellings (4.8%) exhibit Category 1 hazards within the Housing Health and Rating System (HHSRS);
1,917 dwellings (21.3%) are in disrepair and at risk of future deterioration; and
726 occupied dwellings (9.6%) fail to provide a reasonable degree of thermal comfort.
23.4 Poor housing conditions vary across the housing stock and also geographically across the
hotspot areas indicating an initial intervention framework:
The private rented sector – 1,032 dwellings non-decent (30.9%);
Flats in converted buildings - 197 dwellings non-decent (45%); and
Dwellings constructed pre-1919 – 2,129 dwellings non-decent (33.5%).
Geographically, highest rates of decent homes failure are recorded for the hotspot areas of
Southwick and Coalfield Collection/ Easington Lane. The most serious condition problems
related to combined above average Category 1 Hazard failure and disrepair are found in
Southwick.
23.5 Physical housing conditions are compounded by the social and economic circumstances of
private sector households. Poor housing conditions are over-represented in economically
and socially disadvantaged households including elderly households, the economically
vulnerable and those on low incomes. 2,126 private sector households are economically
vulnerable representing 27.4% of all private sector households. 1,449 economically

David Adamson & Partners Ltd. Page |97
CONCLUSIONS
vulnerable households (68.2%) live in decent homes - a figure below previous PSA Target 7
requirements for 2011 and 2021.
23.6 640 households in the hotspot areas (8.3%) are in fuel poverty. Fuel poverty impacts most
strongly on younger and older households and economically vulnerable households.
23.7 22.8% of private sector households in the hotspot areas have at least one household
member affected by a long-term illness or disability with the most common complaints
related to heart/circulatory problems, a physical disability or mobility impairment and
respiratory illness. The impact of illness/disability on local health resources is considerable
– 1,290 households with an illness/disability (73.2%) have made a surgery visit to their GP,
a further 430 households (24.4%) have arranged a home visit from their GP and 874
households (49.6%) have attended hospital as an outpatient. Using evidence from national
research, one-off intervention to address Category 1 Hazards will attract annual NHS
savings of £0.025M and annual total savings to society of £0.041M.
23.8 1,243 owner occupied households (26.2%) live in homes which are non-decent. 345
households within this sector are economically vulnerable representing 27.8% of the total.
57.3% of owner occupiers in non-decent homes have completed no major
repairs/improvements in the last 5 years and 80% have no intention to carry out future major
repairs/improvements within the next 5 years. Just over 50% of owner occupiers have no
mortgage or financial commitments against their homes and equity levels are high across
the sector. 18.4% of owner occupiers living in non-decent homes would re-mortgage for
home improvements, 24.3% are interested in Council interest free loans.
23.9 Conditions within the private rented sector remain the most problematic. Overall, rates of
non-decency within this sector at 30.9% are higher than the average of 25.3% for owner
occupied dwellings.

David Adamson & Partners Ltd. Page |98
LIST OF TABLES AND FIGURES

David Adamson & Partners Ltd. Page |99
LIST OF TABLES
Table 1: Sample Structure ......................................................................................................... 13
Table 2: Housing Characteristics by Tenure ............................................................................. 21
Table 3: Housing Characteristics by Hotspot Area.................................................................... 21
Table 4: Private Sector Households by Age of HOH and Household Type .............................. 24
Table 5: Residential Stability ..................................................................................................... 26
Table 6: Vulnerable and Low Income Households by Hotspot Area ......................................... 30
Table 7: HHSRS – Hazard Groupings ....................................................................................... 36
Table 8: Hazard Bandings and Hazard Categorisation ............................................................. 37
Table 9: The Distribution of Category 1 Hazards by Tenure, Dwelling Type and Date
of Construction ............................................................................................................ 39
Table 10: Dwellings Defective on Decent Homes Repair – Primary Building Element
Performance ................................................................................................................ 42
Table 11: Dwellings Defective on Decent Homes Repair – Secondary Building Element
Performance ................................................................................................................ 43
Table 12: Dwellings Non-Decent on Repair Issues by Hotspot Area .......................................... 45
Table 13: Energy Efficiency Ratings (EER) Sunderland Hotspots and England ........................ 53
Table 14: Decent Homes Thermal Comfort Performance by Tenure, Date of
Construction and House Type ..................................................................................... 54
Table 15: Non-Decent Dwellings – Defect Classification ............................................................ 58
Table 16: Decent Homes Compliance by Tenure, Date of Construction and House
Type ............................................................................................................................. 58
Table 17: Non-Decent Dwellings – Cost to Achieve Decency .................................................... 60
Table 18: Costs to Achieve Decency by Housing Sector ............................................................ 61
Table 19: Dwellings Affected by Major Environmental Issues in Coalfield Collection/
Easington Lane & New Silksworth Cottages ............................................................... 65
Table 20: Household Social Characteristics by Housing Condition ............................................ 67
Table 21: Household Economic Characteristics by Housing Condition ...................................... 68
Table 22: Households with Illness/Disability – Health Service Action within Past Year.............. 76
Table 23: The Costs and Benefits to the NHS of Housing Intervention ...................................... 81
Table 24: Owner Occupied Mortgage Holdings .......................................................................... 92

David Adamson & Partners Ltd. Page |100
LIST OF FIGURES
Figure 1: Housing Occupancy .................................................................................................... 18
Figure 2: Private Sector Housing Age Distributions – Sunderland 2014; England 2012 ........... 19
Figure 3: Housing Tenure Distributions ...................................................................................... 19
Figure 4: Building Types ............................................................................................................. 20
Figure 5: Household Size ........................................................................................................... 23
Figure 6: Household Occupancy ................................................................................................ 24
Figure 7: Over-crowding and Tenure .......................................................................................... 25
Figure 8: Distribution of Households Resident for Less Than 2 Years ...................................... 26
Figure 9: Socio-Demographic Variations by Tenure .................................................................. 27
Figure 10: Economic Status of Head of Household ..................................................................... 28
Figure 11: Economic Variations by Tenure .................................................................................. 29
Figure 12: Percentage of Household Type Vulnerable, on Low Income ...................................... 30
Figure 13: Dwelling Performance Against the Decent Homes Standard ..................................... 33
Figure 14: Non-Decent Homes – Sunderland 2014; England 2012 ............................................. 34
Figure 15: Category 1 Hazard Failure .......................................................................................... 38
Figure 16: Category 1 Hazards by Hazard Type .......................................................................... 39
Figure 17: Presence of Category 1 Hazards by Hotspot ............................................................. 40
Figure 18: Decent Homes Repair Performance ........................................................................... 42
Figure 19: Decent Homes Repair Performance by Tenure, Dwelling Age and Dwelling Type .... 44
Figure 20: Rates of Disrepair by Hotspot ..................................................................................... 45
Figure 21: Physical Condition Intervention Framework ................................................................ 46
Figure 22: Hotspot Area Classification of Intervention Potential .................................................. 47
Figure 23: Core Home Security Measures ................................................................................... 49
Figure 24: Adaptations Present .................................................................................................... 50
Figure 25: SAP Rating Distribution ............................................................................................... 52
Figure 26: Dwellings in EER Bands ‘E’, ‘F’ and ‘G’ by Hotspot Area ........................................... 53
Figure 27: Central Heating Provision ............................................................................................ 54
Figure 28: Decent Homes Thermal Comfort and Energy Attributes ............................................. 56
Figure 29: Overall Performance on the Decent Homes Standard ................................................ 57
Figure 30: Decent Homes Non-Compliancy by Hotspot Area ...................................................... 59
Figure 31: Costs to Address the Non-Decent Homes .................................................................. 60
Figure 32: Environmental Issues .................................................................................................. 63
Figure 33: Liveability Problems..................................................................................................... 64
Figure 34: Environmental Conditions and Housing Conditions .................................................... 64
Figure 35: Environmental Problems by Hotspot Area .................................................................. 65
Figure 36: Rates of Fuel Poverty by Age of HOH and Household Type ...................................... 70
Figure 37: Fuel Poverty by Hotspot Area ..................................................................................... 71

David Adamson & Partners Ltd. Page |101
Figure 38: Fuel Payment Methods ............................................................................................... 72
Figure 39: Fuel Poverty, Energy Efficiency and Household Income ............................................ 73
Figure 40: Long-term Illness/Disability and Age of Head of Household ....................................... 75
Figure 41: Households with Long-term Illness/Disability - Illness/Disability Type ........................ 75
Figure 42: Mobility Problems ........................................................................................................ 77
Figure 43: Households Affected by Minor Ailment/Symptom Resulting in GP Consultation or
Hospital Visit in the Last Year ..................................................................................... 78
Figure 44: How Satisfied Are You With Your Life Nowadays? ..................................................... 79
Figure 45: To What Extent Do You Feel That The Things You Do Are Worthwhile? ................... 79
Figure 46: How Happy Did You Feel Yesterday? ......................................................................... 80
Figure 47: How Anxious Did You Feel Yesterday? ...................................................................... 80
Figure 48: Household Satisfaction with Current Housing ............................................................. 82
Figure 49: Rates of Dissatisfaction with Current Accommodation by Hotspot Area .................... 83
Figure 50: Perception of Recent Decline by Hotspot Area ........................................................... 84
Figure 51: Perceptions of Neighbourhood Issues ........................................................................ 85
Figure 52: Housing Conditions in the Owner Occupied and Private Rented Sectors .................. 87
Figure 53: Household Conditions in the Owner Occupied and Private Rented Sectors .............. 88
Figure 54: Owner Occupied Intervention Framework ................................................................... 90
Figure 55: Mortgage, Valuation and Equity .................................................................................. 92
David Adamson & Partners Ltd.
APPENDICES
APPENDICES
Appendix A: The Interpretation of Statistical Data
Appendix B: Sampling Errors
Appendix C: Survey Questionnaire
Appendix D: The Decent Homes Standard
Appendix E: Glossary of Terms

David Adamson & Partners Ltd.
APPENDICES
APPENDIX A: THE INTERPRETATION OF STATISTICAL DATA Survey data is based on sample survey investigation and the application of statistical grossing
procedures to replicate housing stock totals. Interpretation of survey data must be conducted against
this background and particularly with regard to the following constraints:
a) Data estimates are midpoint estimates within a range of sampling error. Sampling
errors are discussed in Appendix B but are dependent on two factors - the sample size employed and the number or percentage of dwellings exhibiting the attribute in question.
b) Data estimates are subject to rounding errors associated with statistical grossing. Table totals will therefore not necessarily remain consistent throughout the report but will normally vary by under 1%.
c) Survey returns from large-scale sample surveys invariably contain elements of missing data. These may be due to surveyor error, differential access within dwellings or individual elements which are not present in all dwellings. Consistently across the survey, missing data has been kept to a minimum and represents fewer than 2% of returns.

David Adamson & Partners Ltd.
APPENDICES
APPENDIX B: SAMPLING ERRORS NON-TECHNICAL SUMMARY
In a sample survey part of the population is sampled in order to provide information which can be
generalised to the population as a whole. While this provides a cost effective way of obtaining
information, the consequence is a loss of precision in the estimates. The estimated values derived
from the survey may differ from the “true” value for the population for two primary reasons.
Sampling Error This results from the fact that the survey observes only a selection of the population. If a different
sample had been drawn the survey would be likely to have produced a different estimate. Sampling
errors get smaller as the sample size increases.
These errors result from biases in the survey design or in the response to the survey, for example
because certain types of dwelling or household may prove more difficult to obtain information for.
After analysing response to the survey, the results have been weighted to take account of the main
sources of response bias.
Sampling Error Calculation
Statistical techniques provide a means of estimating the size of the sampling errors associated with a
survey. This Appendix estimates the sampling errors of measures derived from the physical house
condition survey and from the social survey for households. The formulae enable the standard error
of estimates derived from the survey to be calculated. For any estimate derived from the survey there
is a 95% chance that the “true” value lies within plus/minus twice (strictly 1.96 times) the standard
error.
For example, the survey estimates that 28.5% of housing stock is non-decent. The standard error for
this value is estimated to be + 3.9%. This means that there is a 95% chance of the value lying in the
range 24.6% – 32.4%. In terms of numbers this means that of the total housing stock of 8,981
dwellings, the number of dwellings which are non-decent is likely to be between 2,210 and 2,910.
However our best estimate is 2,560 dwellings.
The simplest type of survey design is simple random sampling. This involves drawing the sample at
random with every member of the population having an equal probability of being included in the
sample. The standard error of an estimated proportion derived from a simple random sample can be
calculated approximately as:

David Adamson & Partners Ltd.
APPENDICES
Where: p = the estimated proportion
n = the sample size on which the proportion is based
The actual survey design used a sample based upon disproportionate stratification whereby sample
sizes were varied across the area framework. To estimate the sampling error in a complex design
such as this, the basic method is to estimate the extent to which the design increases or decreases
the sampling error relative to a sample of the same size drawn using simple random sampling. This is
measured using the design effect (deff), which is calculated as:
As approximate estimate of the standard error of a proportion based on the complex design can then
be obtained by multiplying the standard error assuming simple random sampling had been used
(equation i above) by the square root of the design effect.
The formula for calculating the standard error for proportions of dwellings or households from the
survey is given below:
Where: pi = the estimated proportion with the characteristics in stratum i
ni = the number of households/dwellings sampled in stratum i
Ni = the total number of households/dwellings existing in stratum i
N = the total number of households/dwellings
The impact of the survey design on the sampling errors of estimates is generally fairly small.
To avoid the complex calculation of the design effect in every case, it is suggested that in most cases
a multiplier of 1.05 be applied to the standard error calculated assuming simple random sampling (see
equation i).
deff(p) =
Estimated variance (S.E.2) of p with complex design
Estimated variance of p based on simple random sample
p (I – p)
n
S.E. (p) srs =
(equation i)
(equation ii) S.E. (p) =
1
N2
N2
(ni – I)
P i (1 - pi )

David Adamson & Partners Ltd.
APPENDICES
APPENDIX C: SURVEY QUESTIONNAIRE

© David Adamson & Partners Ltd. Private Sector House Condition Survey 2014
Page | 1
SUNDERLAND CITY COUNCIL
A. SURVEY RECORD
ADDRESS: VISITS 1 2 3 DWELLING REF:
TIME
DATE SURVEYOR NO:
SURVEYORS SIGNATURE:
A1. Status of address? address
untraceable 6
demolished/derelict
5
converted to non-
residential 4
major works underway
3
non permanent
dwelling 2
effective permanent
dwelling 1
A2. Extent of survey?
no survey 4
external survey only 3
full survey only
2
full survey/ interview
1
A3. Is the dwelling occupied or vacant?
vacant- other long-term 7
vacant- derelict
6
vacant-closed/
bricked up 5
vacant- other
temporary 4
vacant- repairs/mod-ernisation 3
vacant for sale/rent
2
occupied
1
A4. Dwelling tenure?
unob 9
rsl/excluded
4
tied/rent free
3
private rented
2
owner occupied
1
A5. Is the dwelling in multiple Occupation?
Yes 2
No
1
B. DWELLING CHARACTERISTICS
B1. Dwelling type? house/ mixed use
7
non-res with flats
6
flat in converted building 5
purpose built flat
4
maisonette
3
bungalow
2
house
1
B1a. Dwelling configuration?
detached 4
semi- detached
3
end terrace
2
mid terrace
1
B1b. Dwelling construction type?
park home 3
non-traditional
2
traditional
1
B1c. If Flat : Storey level of flat? Specify level - Ground 0
n/a 99
specify no: …………….
B2. Date of construction? post-1981 1975-1981
5
1965-1974 4
1945-1964 3
1919-1944
2
pre-1919
1
B3. Number of habitable floors to dwelling?
n/a 99
specify no: …………….
B4. External wall construction?
unob.
9
other
6
timber frame
5
solid 9”+
4
cavity 11”+ 3
cavity 9-11”
2
solid 9”
1
B5. Predominant building material?
other 6
wood/ timber 5
stone
4
concrete
3
block
2
brick
1
B6. Principal wall finish?
other 5
tiles
4
timber
3
render/dash
2
self finish
1
B7. Main roof form?
mixed 3
flat
2
pitched
1
B8. Roof covering?
unob. 9
other
6
felt or asphalt
5
artificial slate
4
clay tile
3
concrete tile
2
natural slate
1
B9. Flashings?
unob. 9
none
5
other
4
cement fillet 3
zinc
2
lead
1
B10. Chimneys?
unob. 9
none
6
other
5
stone
4
concrete
3
brick/ block render
2
brick pointed
1
B11. Rainwear?
unob. 9
mixed
7
other
6
asbestos
5
cast iron
4
steel
3
aluminium
2
Upvc
1
B12. Predominant window material?
other 6
Upvc
5
metal with thermal
break 4
metal no thermal
break 3
hardwood
2
softwood
1
B13. Dwelling entrance door material?
metal 7
hardwood glazed
6
hardwood complete
5
upvc glazed
4
upvc complete
3
softwood glazed
2
softwood complete
1
B14. Does the dwelling front directly onto the street?
no 2
yes
1

© David Adamson & Partners Ltd. Private Sector House Condition Survey 2014
Page | 2
C. EXTERNAL REPAIR/RENEWAL
VIEWPOINT 1 VIEWPOINT 2
WHAT REPAIRS ARE REQUIRED TO THE FOLLOWING ELEMENTS?
REPAIR – Viewpoint 1 front only – 1 front & side – A2 unob. - 9
REPAIR – Viewpoint 2 back only – 1 back & side – B” unob. - 9
PERIOD Replacement period for whole element
C1. Roof structure
C2. Roof covering
REPAIR
1- No repair 2. Localised disrepair 1- 5% 3. Minor disrepair 6-25% 4. Medium disrepair 26-60% 5. Major disrepair 61-80% 6. Renew 81-100% 8. na 9. Unob./does not exist
C3. Chimney stacks
C4. Flashings
C5. Rainwear – gutters & downpipes
C6. External wall finish
C7. External wall pointing
C8. Lintols REPLACEMENT PERIOD
1. Urgent / immediate 2. Inside 5 years 3. 6-10 years 4. 11-15 years 5. 16-20 years 6. 21-25 years
7. 26-30 years 8. Over 30 years 9. Unob./does not exist
C9. External wall structure
C10. Windows
C11. Doors
C12. Underground drainage
C13. Fences/walls/gates
C14. Paths/paved areas
C15. Outbuildings
C16. Evidence of structural failure
a) Foundation failure
no 2
yes
1
e) Wall-tie failure
no
2
yes
1
b) Roof sag
no 2
yes
1
f) Chimney failure
no
2
yes
1
c) Roof spread
no 2
yes
1
g) Lintol failure
no
2
yes
1
d) Wall bulge
no 2
yes
1
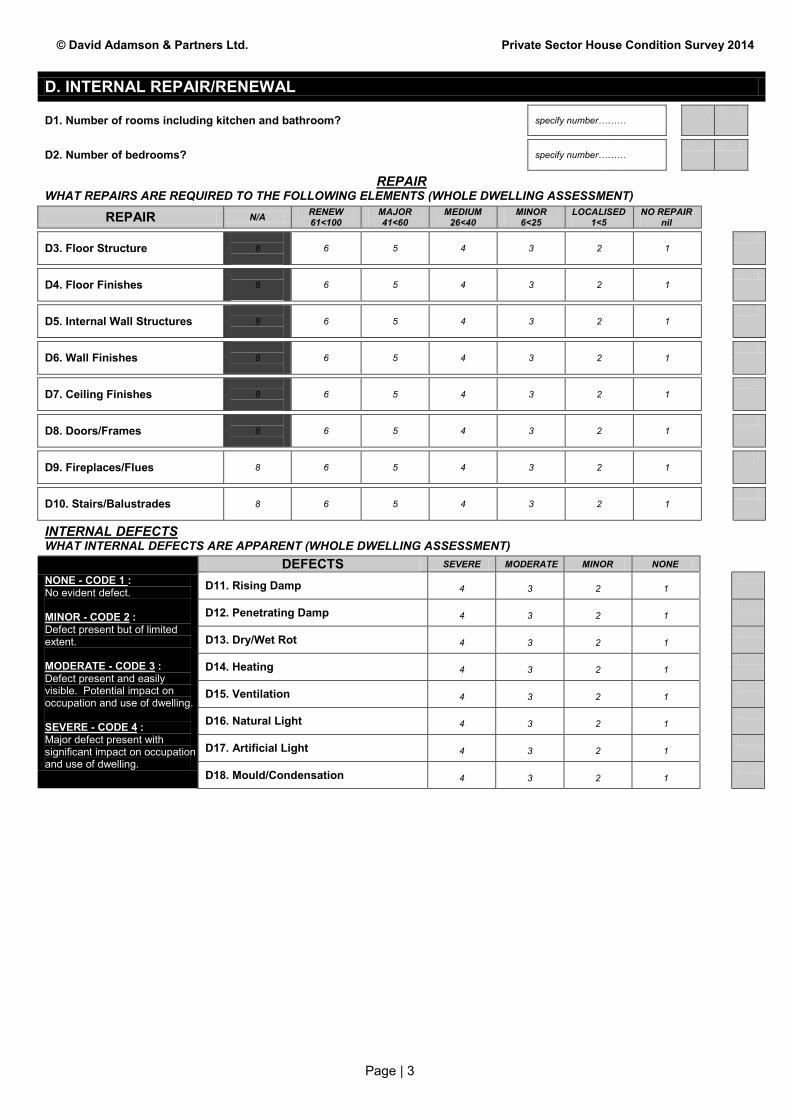
© David Adamson & Partners Ltd. Private Sector House Condition Survey 2014
Page | 3
D. INTERNAL REPAIR/RENEWAL
D1. Number of rooms including kitchen and bathroom? specify number………
D2. Number of bedrooms? specify number………
REPAIR WHAT REPAIRS ARE REQUIRED TO THE FOLLOWING ELEMENTS (WHOLE DWELLING ASSESSMENT)
REPAIR N/A RENEW 61<100
MAJOR 41<60
MEDIUM 26<40
MINOR 6<25
LOCALISED 1<5
NO REPAIR nil
D3. Floor Structure 8
6
5
4
3
2
1
D4. Floor Finishes 8
6
5
4
3
2
1
D5. Internal Wall Structures 8
6
5
4
3
2
1
D6. Wall Finishes 8
6
5
4
3
2
1
D7. Ceiling Finishes 8
6
5
4
3
2
1
D8. Doors/Frames 8
6
5
4
3
2
1
D9. Fireplaces/Flues 8
6
5
4
3
2
1
D10. Stairs/Balustrades 8
6
5
4
3
2
1
INTERNAL DEFECTS WHAT INTERNAL DEFECTS ARE APPARENT (WHOLE DWELLING ASSESSMENT)
NONE - CODE 1 : No evident defect. MINOR - CODE 2 : Defect present but of limited extent. MODERATE - CODE 3 : Defect present and easily visible. Potential impact on occupation and use of dwelling. SEVERE - CODE 4 : Major defect present with significant impact on occupation and use of dwelling.
DEFECTS SEVERE MODERATE MINOR NONE
D11. Rising Damp 4
3
2
1
D12. Penetrating Damp 4
3
2
1
D13. Dry/Wet Rot 4
3
2
1
D14. Heating 4
3
2
1
D15. Ventilation 4
3
2
1
D16. Natural Light 4
3
2
1
D17. Artificial Light 4
3
2
1
D18. Mould/Condensation 4
3
2
1

© David Adamson & Partners Ltd. Private Sector House Condition Survey 2014
Page | 4
E. AMENITIES AND SERVICES
E1. Does the dwelling possess the following…?
(a) Standard Amenities
no 3
yes - shared use
2
yes – exclusive
use 1
(b) Mains Gas Supply
no 2
yes
1
(c) Mains Water Supply
no 2
yes
1
(d) Mains Drainage
no 2
yes
1
E2. Does the dwelling possess central heating? no- none
3
yes - partial C.H.
2
yes - full C.H.
1
E3. Age of kitchen fittings? over 20 yrs
old 2
under 20 yrs old
1
E4. Kitchen space/layout?
inadequate 2
adequate
1
E5. Age of bathroom amenities? over 30 yrs
old 2
under 30 yrs old
1
E6. Bathroom location?
unsatisfactory 2
satisfactory
1
E7. W.C. location?
unsatisfactory 2
satisfactory
1
FLATS/MAISONETTES ONLY
E7a. Are common areas of adequate size?
n/a 8
unsatis.
2
satisfactory
1
E7b. Is layout of common areas satisfactory?
n/a 8
unsatis.
2
satisfactory
1
WHAT REPAIRS ARE REQUIRED TO THE FOLLOWING ELEMENTS AND WHAT REPLACEMENT PERIOD APPLIES? REPAIR
REPAIR N/A RENEW 61<100
MAJOR 41<60
MEDIUM 26<40
MINOR 6<25
LOCALISED 1<5
NO REPAIR nil
E8. Kitchen Fittings 6 5 4 3 2 1
E9. Bathroom Amenities 6 5 4 3 2 1
E10. Internal Plumbing 6 5 4 3 2 1
E11. Electrics 6 5 4 3 2 1
E12. Heating/Boilers/Appliances 6 5 4 3 2 1
E13. Heating Distribution 8 6 5 4 3 2 1
REPLACEMENT PERIOD REPLACEMENT PERIOD N/A OUTSIDE
30 YRS 26-30 YRS
21-25 YRS 16-20 YRS 11-15 YRS 6-10 YRS INSIDE
5 YRS
E14. Kitchen Fittings 4 3 2 1
E15. Bathroom Amenities 6 5 4 3 2 1
E16. Internal Plumbing 7 6 5 4 3 2 1
E17. Electrics 7 6 5 4 3 2 1
E18. Heating/Boiler/Appliances 3 2 1
E19. Heating Distribution 8 7 6 5 4 3 2 1
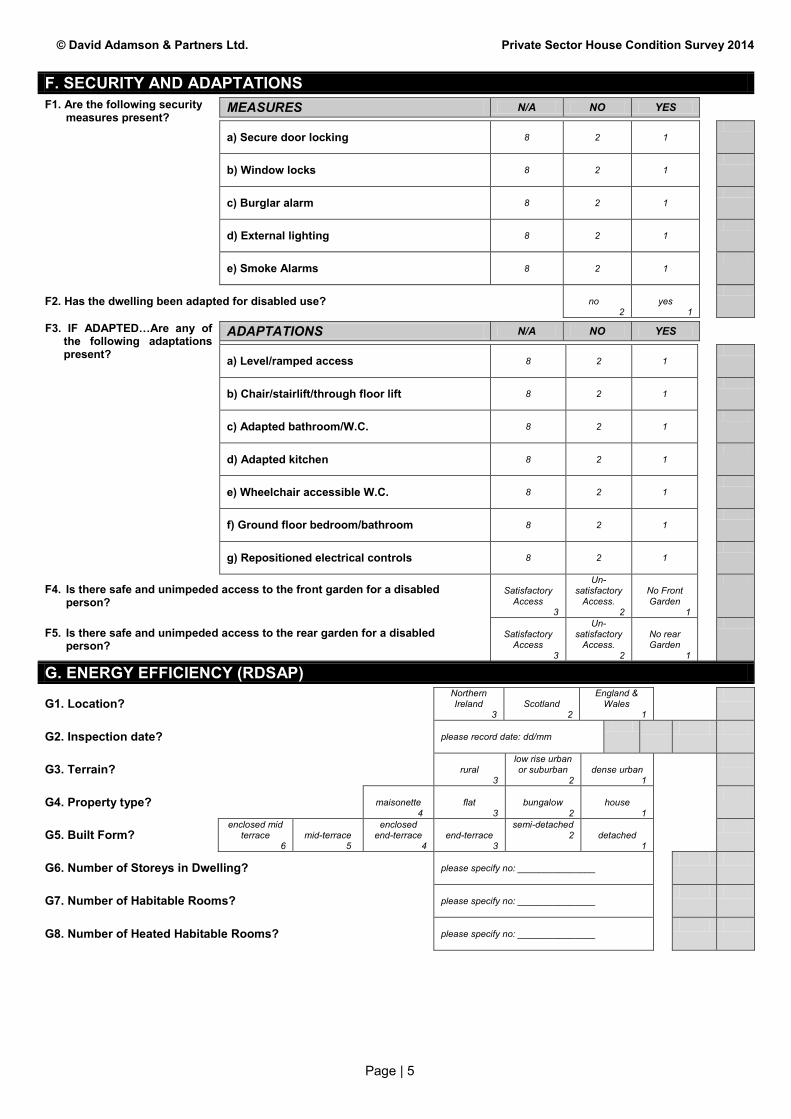
© David Adamson & Partners Ltd. Private Sector House Condition Survey 2014
Page | 5
F. SECURITY AND ADAPTATIONS
F1. Are the following security measures present?
MEASURES N/A NO YES
a) Secure door locking 8
2 1
b) Window locks 8
2 1
c) Burglar alarm 8
2 1
d) External lighting 8
2 1
e) Smoke Alarms 8
2 1
F2. Has the dwelling been adapted for disabled use?
no 2
yes
1
F3. IF ADAPTED…Are any of the following adaptations present?
ADAPTATIONS N/A NO YES
a) Level/ramped access 8
2 1
b) Chair/stairlift/through floor lift 8
2 1
c) Adapted bathroom/W.C. 8
2 1
d) Adapted kitchen 8
2 1
e) Wheelchair accessible W.C. 8
2 1
f) Ground floor bedroom/bathroom 8
2 1
g) Repositioned electrical controls 8
2 1
F4. Is there safe and unimpeded access to the front garden for a disabled person?
Satisfactory
Access 3
Un-satisfactory
Access. 2
No Front Garden
1
F5. Is there safe and unimpeded access to the rear garden for a disabled person?
Satisfactory
Access 3
Un-satisfactory
Access. 2
No rear Garden
1
G. ENERGY EFFICIENCY (RDSAP)
G1. Location? Northern Ireland
3
Scotland
2
England & Wales
1
G2. Inspection date? please record date: dd/mm
G3. Terrain?
rural 3
low rise urban or suburban
2
dense urban
1
G4. Property type?
maisonette 4
flat
3
bungalow
2
house
1
G5. Built Form? enclosed mid
terrace 6
mid-terrace 5
enclosed end-terrace
4
end-terrace
3
semi-detached 2
detached
1
G6. Number of Storeys in Dwelling? please specify no: _______________
G7. Number of Habitable Rooms? please specify no: _______________
G8. Number of Heated Habitable Rooms? please specify no: _______________
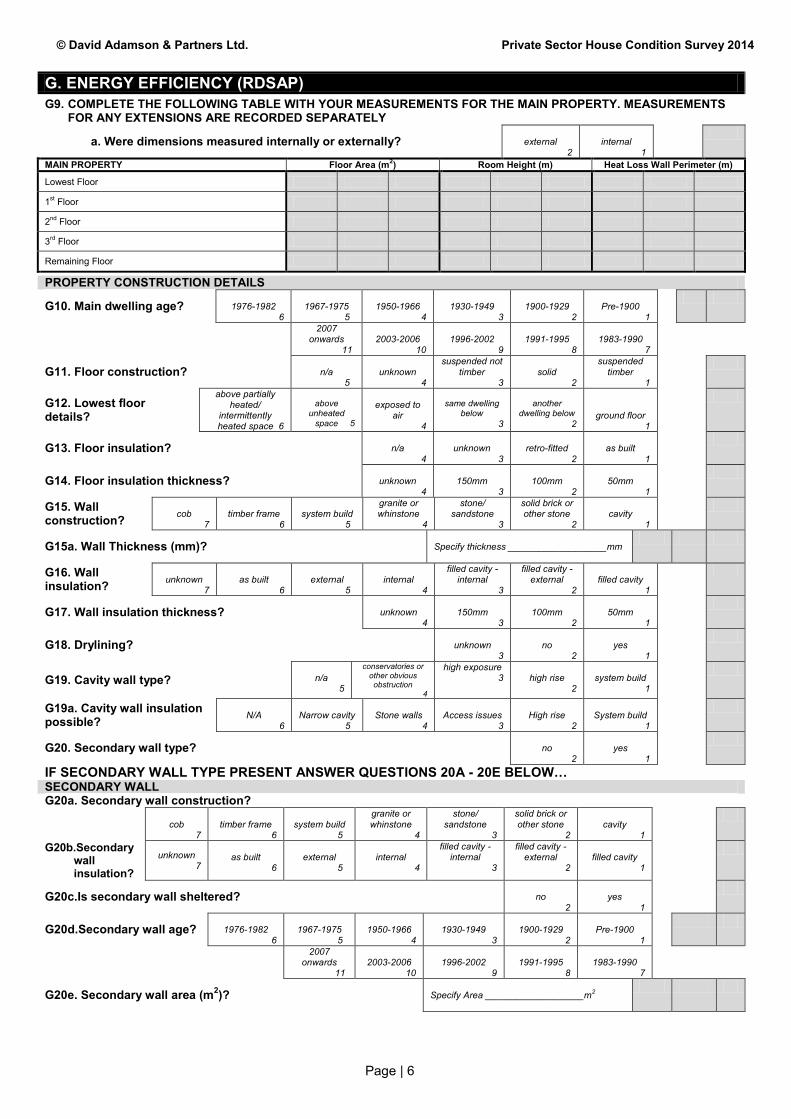
© David Adamson & Partners Ltd. Private Sector House Condition Survey 2014
Page | 6
G. ENERGY EFFICIENCY (RDSAP)
G9. COMPLETE THE FOLLOWING TABLE WITH YOUR MEASUREMENTS FOR THE MAIN PROPERTY. MEASUREMENTS FOR ANY EXTENSIONS ARE RECORDED SEPARATELY
a. Were dimensions measured internally or externally?
external 2
internal
1
MAIN PROPERTY Floor Area (m2) Room Height (m) Heat Loss Wall Perimeter (m)
Lowest Floor
1st Floor
2nd Floor
3rd Floor
Remaining Floor
PROPERTY CONSTRUCTION DETAILS
G10. Main dwelling age?
1976-1982 6
1967-1975 5
1950-1966
4
1930-1949
3
1900-1929
2
Pre-1900
1
2007
onwards 11
2003-2006
10
1996-2002
9
1991-1995
8
1983-1990
7
G11. Floor construction?
n/a 5
unknown
4
suspended not timber
3
solid
2
suspended timber
1
G12. Lowest floor details?
above partially heated/
intermittently heated space 6
above
unheated space 5
exposed to
air 4
same dwelling
below 3
another
dwelling below 2
ground floor 1
G13. Floor insulation?
n/a 4
unknown
3
retro-fitted
2
as built
1
G14. Floor insulation thickness?
unknown 4
150mm
3
100mm
2
50mm
1
G15. Wall construction?
cob
7
timber frame
6
system build 5
granite or whinstone
4
stone/ sandstone
3
solid brick or other stone
2
cavity
1
G15a. Wall Thickness (mm)? Specify thickness ___________________mm
G16. Wall insulation?
unknown
7
as built
6
external
5
internal
4
filled cavity - internal
3
filled cavity - external
2
filled cavity
1
G17. Wall insulation thickness?
unknown 4
150mm
3
100mm
2
50mm
1
G18. Drylining?
unknown 3
no
2
yes
1
G19. Cavity wall type?
n/a 5
conservatories or other obvious obstruction
4
high exposure 3
high rise
2
system build
1
G19a. Cavity wall insulation possible?
N/A
6
Narrow cavity 5
Stone walls
4
Access issues
3
High rise
2
System build
1
G20. Secondary wall type?
no 2
yes
1
IF SECONDARY WALL TYPE PRESENT ANSWER QUESTIONS 20A - 20E BELOW… SECONDARY WALL G20a. Secondary wall construction?
cob 7
timber frame
6
system build 5
granite or whinstone
4
stone/ sandstone
3
solid brick or other stone
2
cavity
1
G20b.Secondary wall insulation?
unknown 7
as built
6
external
5
internal
4
filled cavity - internal
3
filled cavity - external
2
filled cavity
1
G20c.Is secondary wall sheltered?
no 2
yes
1
G20d.Secondary wall age?
1976-1982 6
1967-1975 5
1950-1966
4
1930-1949
3
1900-1929
2
Pre-1900
1
2007
onwards 11
2003-2006
10
1996-2002
9
1991-1995
8
1983-1990
7
G20e. Secondary wall area (m2)? Specify Area ___________________m2

© David Adamson & Partners Ltd. Private Sector House Condition Survey 2014
Page | 7
G. ENERGY EFFICIENCY (RDSAP) ROOF CONSTRUCTION G21. Roof construction?
partially
heated space 7
other dwelling above
6
same dwelling above 5
pitched - thatched
4
pitched slates or tiles (no loft
access) 3
pitched slates or tiles (loft
access) 2
flat
1
G22. Roof insulation?
not applicable 6
unknown
5
none
4
flat roof insulation
3
rafters
2
joists
1
G23. Roof insulation thickness at joists?
150mm
6
100mm
5
75mm
4
50mm
3
25mm
2
12mm
1
300mm> 9
250mm
8
200mm
7
G24. Rafter insulation thickness?
unknown 4
150mm>
3
100mm
2
50mm
1
G25. Flat roof insulation?
unknown 4
150mm>
3
100mm
2
50mm
1
DOORS AND WINDOWS
G26. Number of Doors? Specify No. ___________________
G27. Number of Insulated Doors? Specify No. ___________________
G28. Insulated Door U-Value a. Door 1 Specify Value _________________
b. Door 2 Specify Value _________________
G29. Percentage draught-proofed? Specify _________________%
G30. Windows Area? much more than typical 5
much less than typical
4
more than typical
3
less than typical
2
typical
1
G31. Percentage Multiple Glazed i.e. double/triple glazed (0-100%) please specify %: _________________%
G32. Glazing Type?
don’t know 7
triple glazing
6
secondary glazing
5
DG - unknown date
4
DG during or post-2003
3
DG pre-2003
2
single
1
G33. If Windows Areas Much Larger/Smaller No. of Windows? please specify no: _______________
WHERE ONE OR MORE WINDOW IS MUCH LARGER OR MUCH SMALLER THAN TYPICAL PLEASE COMPLETE WINDOW GRID AT APPENDIX A FLATS AND MAISONETTES ONLY G34. Number of Floors in Block? please specify no: _______________
G35. Floor Level of Dwelling? (Ground = 0) please specify level : ____________
G36. Floor Level Details?
n/a 5
basement
4
top floor
3
mid-floor
2
ground floor
1
G37. Floor Exposure?
ground floor 5
above partially heated space
4
above unheated
space 3
above other dwg
2
fully exposed
1
G38. Heat-loss Corridor? heated corridor
3
unheated corridor
2
no corridor
1
G39. If unheated corridor - length of sheltered wall? please specify m: ________________
END OF FLATS/MAISONETTES SECTION - ALL FOLLOWING QUESTIONS TO BE ANSWERED VENTILATION AND HEATING
G40. Whole house mechanical ventilation?
yes 2
no
1
G41. If there is mechanical ventilation, what type?
n/a 8
extract only
2
balanced
1
G42. Space cooling system present?
yes 2
no
1
G43. Electricity meter type?
unknown 4
24 hour
3
dual
2
single
1
G44. Mains Gas available?
no 2
yes
1

© David Adamson & Partners Ltd. Private Sector House Condition Survey 2014
Page | 8
G. ENERGY EFFICIENCY (RDSAP) G45.Boiler Manufacturer:
G46. Model:
G47. Boiler ID:
G48. SEDBUK Ref:
G49. Main Heating System Type? INSERT MAIN HEATING SYSTEM CODE
G50. Main Heating System Fuel Type? INSERT MAIN HEATING SYSTEM FUEL CODE
G51. Heat emitter type? no radiators or
underfloor 5
Electric heating
4
an coil units
3
underfloor
2
radiators
1
G52. Main Heating Controls? INSERT MAIN HEATING CONTROLS CODE
G53. Additional heating controls? INSERT ADDITIONAL HEATING CONTROL CODE?
G54. Main Heating System Flue Type?
room sealed 2
open
1
G55. For Gas Boilers 1998 or later - ignition type? permanent pilot light
2
auto ignition
1
G56. For Gas Boilers 1998 or later - fan flued or not?
not fan flued 2
fan flued
1
G57. Secondary heating system type? INSERT SECONDARY HEATING SYSTEM CODE
G57a. Secondary Heating System Fuel Type? INSERT SECONDARY HEATING SYSTEM FUEL CODE
G57b. Water Heating System? INSERT WATER HEATING SYSTEM CODE
G57c. Water Heating System Fuel? INSERT WATER HEATING SYSTEM FUEL CODE
G58. Water cylinder size?
no access 5
large (> 170 litres)
4
medium (131 - 170 litres)
3
normal (90-130 litres)
2
no cylinder
1
G59. Water Cylinder Insulation Type?
no access 4
spray foam
3
jacket
2
none
1
G60. Water Cylinder Insulation Depth?
160mm 8
120mm
7
80mm
6
50mm
5
38mm
4
25mm
3
12mm
2
0mm
1
G60a. Water Cylinder Replacement Period? Year _____ Insert Individual Years 1-40 41 - Over 40 years 88 No Cylinder
G61. Immersion Type?
dual 3
single
2
none
1
G62. Cylinder Stat?
unknown 3
no
2
yes
1
ADDITIONAL INFORMATION
G63. Number of open fireplaces? please specify no: _______________
G64. Total no. of fixed lighting outlets? please specify no: _______________
G65. Low Energy Lighting - Total no. in fixed lighting outlets? please specify no: _______________
G66. Number of rooms with a bath or shower? Specify Number : ____________________
G67. Number of rooms with bath and mixer shower? Specify Number : ____________________
G68. Number of rooms with mixer shower and no bath? Specify Number : ____________________
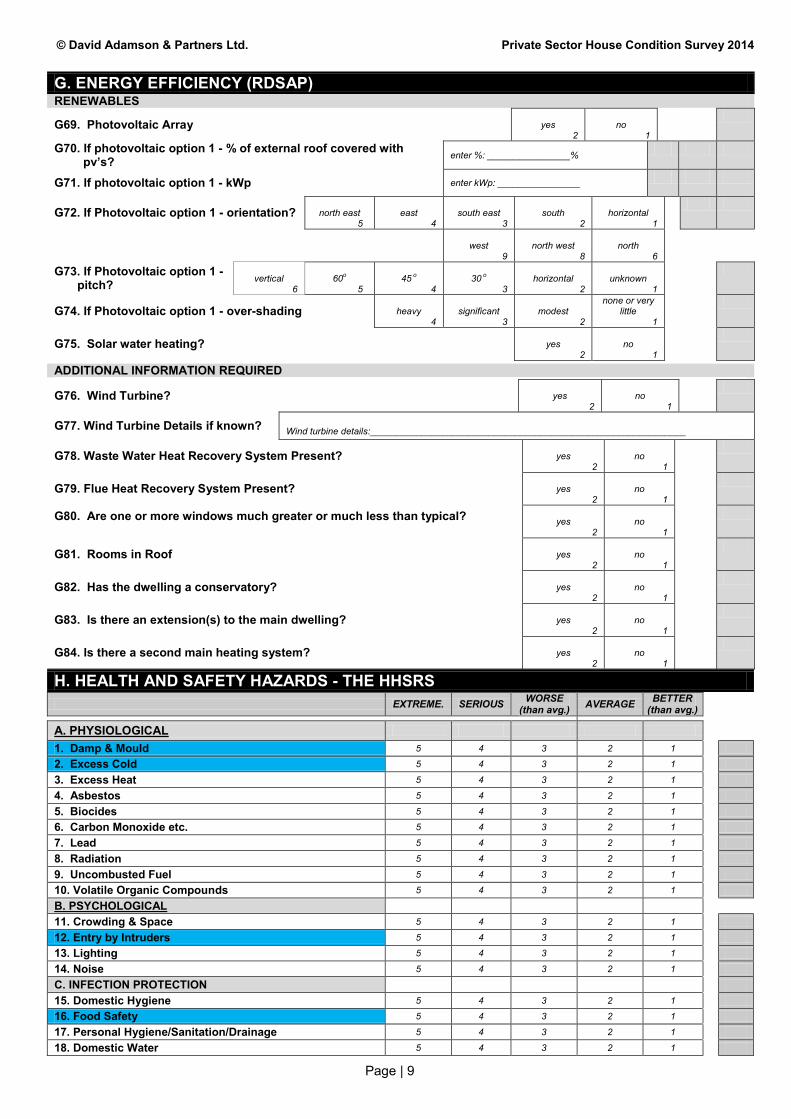
© David Adamson & Partners Ltd. Private Sector House Condition Survey 2014
Page | 9
G. ENERGY EFFICIENCY (RDSAP) RENEWABLES
G69. Photovoltaic Array
yes 2
no
1
G70. If photovoltaic option 1 - % of external roof covered with pv’s? enter %: ________________%
G71. If photovoltaic option 1 - kWp enter kWp: ________________
G72. If Photovoltaic option 1 - orientation?
north east 5
east
4
south east
3
south
2
horizontal
1
west 9
north west
8
north
6
G73. If Photovoltaic option 1 - pitch?
vertical
6
60o
5
45 o
4
30 o
3
horizontal
2
unknown
1
G74. If Photovoltaic option 1 - over-shading
heavy 4
significant
3
modest
2
none or very little
1
G75. Solar water heating?
yes 2
no
1
ADDITIONAL INFORMATION REQUIRED
G76. Wind Turbine?
yes 2
no
1
G77. Wind Turbine Details if known? Wind turbine details:_____________________________________________________________
G78. Waste Water Heat Recovery System Present?
yes 2
no
1
G79. Flue Heat Recovery System Present?
yes 2
no
1
G80. Are one or more windows much greater or much less than typical?
yes
2
no
1
G81. Rooms in Roof
yes 2
no
1
G82. Has the dwelling a conservatory?
yes 2
no
1
G83. Is there an extension(s) to the main dwelling?
yes 2
no
1
G84. Is there a second main heating system?
yes 2
no
1
H. HEALTH AND SAFETY HAZARDS - THE HHSRS EXTREME. SERIOUS WORSE
(than avg.) AVERAGE BETTER (than avg.)
A. PHYSIOLOGICAL
1. Damp & Mould 5 4 3 2 1
2. Excess Cold 5 4 3 2 1
3. Excess Heat 5 4 3 2 1
4. Asbestos 5 4 3 2 1
5. Biocides 5 4 3 2 1
6. Carbon Monoxide etc. 5 4 3 2 1
7. Lead 5 4 3 2 1
8. Radiation 5 4 3 2 1
9. Uncombusted Fuel 5 4 3 2 1
10. Volatile Organic Compounds 5 4 3 2 1
B. PSYCHOLOGICAL
11. Crowding & Space 5 4 3 2 1
12. Entry by Intruders 5 4 3 2 1
13. Lighting 5 4 3 2 1
14. Noise 5 4 3 2 1
C. INFECTION PROTECTION
15. Domestic Hygiene 5 4 3 2 1
16. Food Safety 5 4 3 2 1
17. Personal Hygiene/Sanitation/Drainage 5 4 3 2 1
18. Domestic Water 5 4 3 2 1
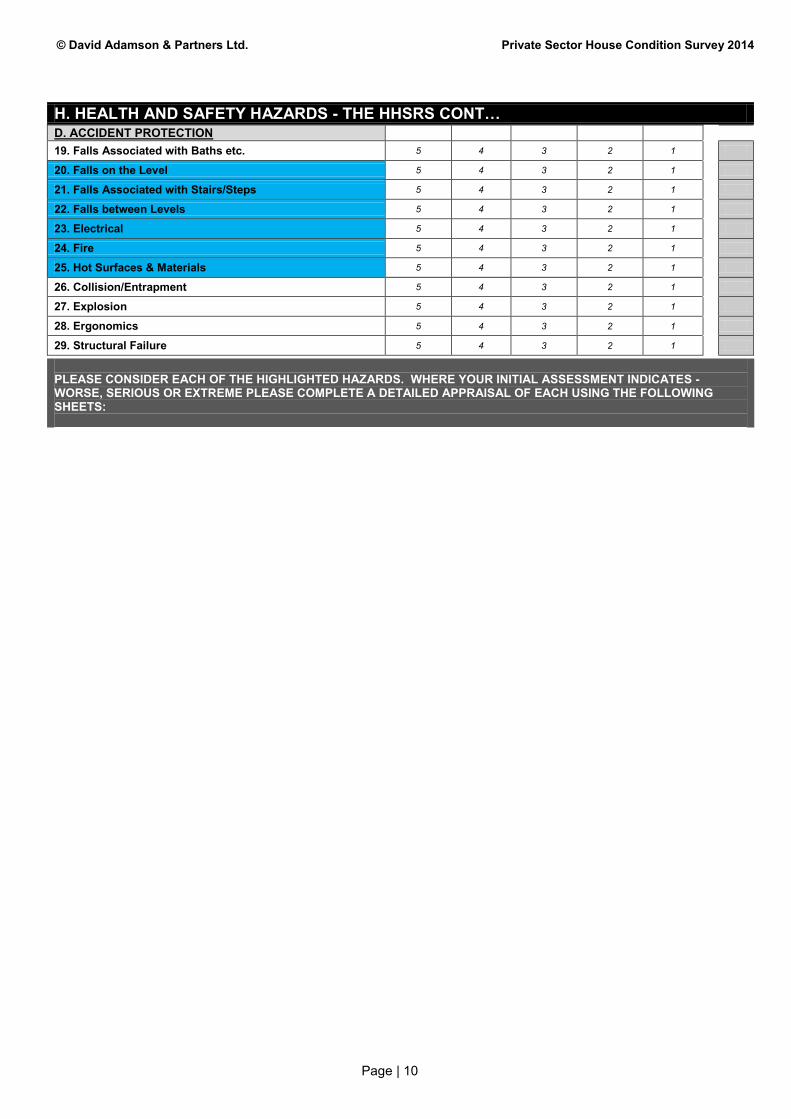
© David Adamson & Partners Ltd. Private Sector House Condition Survey 2014
Page | 10
H. HEALTH AND SAFETY HAZARDS - THE HHSRS CONT… D. ACCIDENT PROTECTION
19. Falls Associated with Baths etc. 5 4 3 2 1
20. Falls on the Level 5 4 3 2 1
21. Falls Associated with Stairs/Steps 5 4 3 2 1
22. Falls between Levels 5 4 3 2 1
23. Electrical 5 4 3 2 1
24. Fire 5 4 3 2 1
25. Hot Surfaces & Materials 5 4 3 2 1
26. Collision/Entrapment 5 4 3 2 1
27. Explosion 5 4 3 2 1
28. Ergonomics 5 4 3 2 1
29. Structural Failure 5 4 3 2 1
PLEASE CONSIDER EACH OF THE HIGHLIGHTED HAZARDS. WHERE YOUR INITIAL ASSESSMENT INDICATES - WORSE, SERIOUS OR EXTREME PLEASE COMPLETE A DETAILED APPRAISAL OF EACH USING THE FOLLOWING SHEETS:
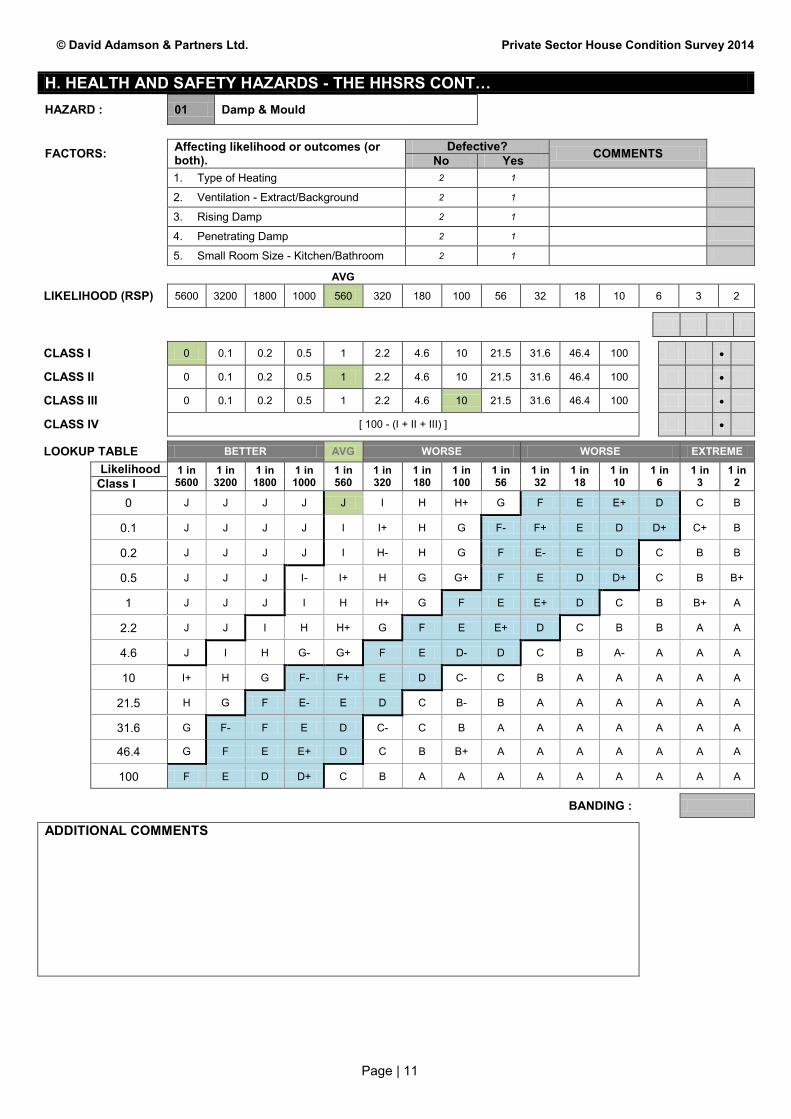
© David Adamson & Partners Ltd. Private Sector House Condition Survey 2014
Page | 11
H. HEALTH AND SAFETY HAZARDS - THE HHSRS CONT… HAZARD : 01 Damp & Mould
FACTORS: Affecting likelihood or outcomes (or both).
Defective? COMMENTS No Yes
1. Type of Heating 2 1
2. Ventilation - Extract/Background 2 1
3. Rising Damp 2 1
4. Penetrating Damp 2 1
5. Small Room Size - Kitchen/Bathroom 2 1
AVG
LIKELIHOOD (RSP) 5600 3200 1800 1000 560 320 180 100 56 32 18 10 6 3 2
CLASS I 0 0.1 0.2 0.5 1 2.2 4.6 10 21.5 31.6 46.4 100
CLASS II 0 0.1 0.2 0.5 1 2.2 4.6 10 21.5 31.6 46.4 100
CLASS III 0 0.1 0.2 0.5 1 2.2 4.6 10 21.5 31.6 46.4 100
CLASS IV [ 100 - (I + II + III) ]
LOOKUP TABLE BETTER AVG WORSE WORSE EXTREME
Likelihood 1 in 5600
1 in 3200
1 in 1800
1 in 1000
1 in 560
1 in 320
1 in 180
1 in 100
1 in 56
1 in 32
1 in 18
1 in 10
1 in 6
1 in 3
1 in 2 Class I
0 J J J J J I H H+ G F E E+ D C B
0.1 J J J J I I+ H G F- F+ E D D+ C+ B
0.2 J J J J I H- H G F E- E D C B B
0.5 J J J I- I+ H G G+ F E D D+ C B B+
1 J J J I H H+ G F E E+ D C B B+ A
2.2 J J I H H+ G F E E+ D C B B A A
4.6 J I H G- G+ F E D- D C B A- A A A
10 I+ H G F- F+ E D C- C B A A A A A
21.5 H G F E- E D C B- B A A A A A A
31.6 G F- F E D C- C B A A A A A A A
46.4 G F E E+ D C B B+ A A A A A A A
100 F E D D+ C B A A A A A A A A A
BANDING :
ADDITIONAL COMMENTS

© David Adamson & Partners Ltd. Private Sector House Condition Survey 2014
Page | 12
H. HEALTH AND SAFETY HAZARDS - THE HHSRS CONT… HAZARD : 02 Excess Cold
FACTORS: Affecting likelihood or outcomes (or both).
Defective? COMMENTS No Yes
1. Type of Heating 2 1
2. Insulation - Loft 2 1
3. Insulation - Walls/Cavity 2 1
4. Type of Glazing 2 1
5. Excessive Drafts 2 1
AVG
LIKELIHOOD (RSP) 5600 3200 1800 1000 560 320 180 100 56 32 18 10 6 3 2
CLASS I 0 0.1 0.2 0.5 1 2.2 4.6 10 21.5 31.6 46.4 100
CLASS II 0 0.1 0.2 0.5 1 2.2 4.6 10 21.5 31.6 46.4 100
CLASS III 0 0.1 0.2 0.5 1 2.2 4.6 10 21.5 31.6 46.4 100
CLASS IV [ 100 - (I + II + III) ]
LOOKUP TABLE BETTER AVG W S EXTREME
Likelihood 1 in 5600
1 in 3200
1 in 1800
1 in 1000
1 in 560
1 in 320
1 in 180
1 in 100
1 in 56
1 in 32
1 in 18
1 in 10
1 in 6
1 in 3 1 in 2 Class I
0 J J J I H- H G F E- E D C C+ B A
0.1 J J J I H H G F E E D C B- B A
0.2 J J J I H H G F E E D C B B+ A
0.5 J J J I H G- G F E D- D+ C B A A
1 J J I H- H G F+ E- E D C B- B A A
2.2 J I- I+ H G F- F E D C- C+ B A A A
4.6 I- I+ H G F- F+ E D C- C+ B A A A A
10 I+ H G F F+ E D C C+ B A A A A A
21.5 H G F E E D C B B A A A A A A
31.6 G F- F+ E D C- C+ B A A A A A A A
46.4 G F E E+ D C B B+ A A A A A A A
100 F E D C- C B A A A A A A A A A
BANDING :
ADDITIONAL COMMENTS

© David Adamson & Partners Ltd. Private Sector House Condition Survey 2014
Page | 13
H. HEALTH AND SAFETY HAZARDS - THE HHSRS CONT… HAZARD : 03 Excess Heat
Note: It has been estimated that bedrooms of around 5% of converted flats/HMO’s are immediately under the roof giving significantly larger temp rises during hot weather
FACTORS: Affecting likelihood or outcomes (or both). Defective? COMMENTS No Yes
1. Insulation - particularly attic flats 2 1
2. Orientation - South facing? 2 1
3. Ventilation - Provision/control 2 1
4. Heating - controllable 2 1
5. Windows - Security/noise issues 2 1
AVG
LIKELIHOOD (RSP) 5600 3200 1800 1000 560 320 180 100 56 32 18 10 6 3 2
CLASS I 0 0.1 0.2 0.5 1 2.2 4.6 10 21.5 31.6 46.4 100
CLASS II 0 0.1 0.2 0.5 1 2.2 4.6 10 21.5 31.6 46.4 100
CLASS III 0 0.1 0.2 0.5 1 2.2 4.6 10 21.5 31.6 46.4 100
CLASS IV [ 100 - (I + II + III) ]
LOOKUP TABLE AVG WORSE S EXTREME
Likelihood 1 in 5600
1 in 3200
1 in 1800
1 in 1000
1 in 560
1 in 320
1 in 180
1 in 100
1 in 56
1 in 32
1 in 18
1 in 10
1 in 6
1 in 3
1 in 2 Class I
0 J J J I H G- G+ F E D- D+ C B A A
0.1 J J I- I+ H G F- F+ E D C- C+ B A A
0.2 J J I- I+ H G F- F+ E D C- C+ B A A
0.5 J J I H- H G F E E D C B B A A
1 J J I H H+ G F E E+ D C B B A A
2.2 J I H- H G F E- E D C B- B A A A
4.6 I- I+ H G F F+ E D C C+ B A A A A
10 H- H G F E- E D C B- B A A A A A
21.5 H G F E E D C B B A A A A A A
31.6 G F- F+ E D C- C+ B A A A A A A A
46.4 G F E E+ D C B B+ A A A A A A A
100 F E D C C B A A A A A A A A A
BANDING :
ADDITIONAL COMMENTS
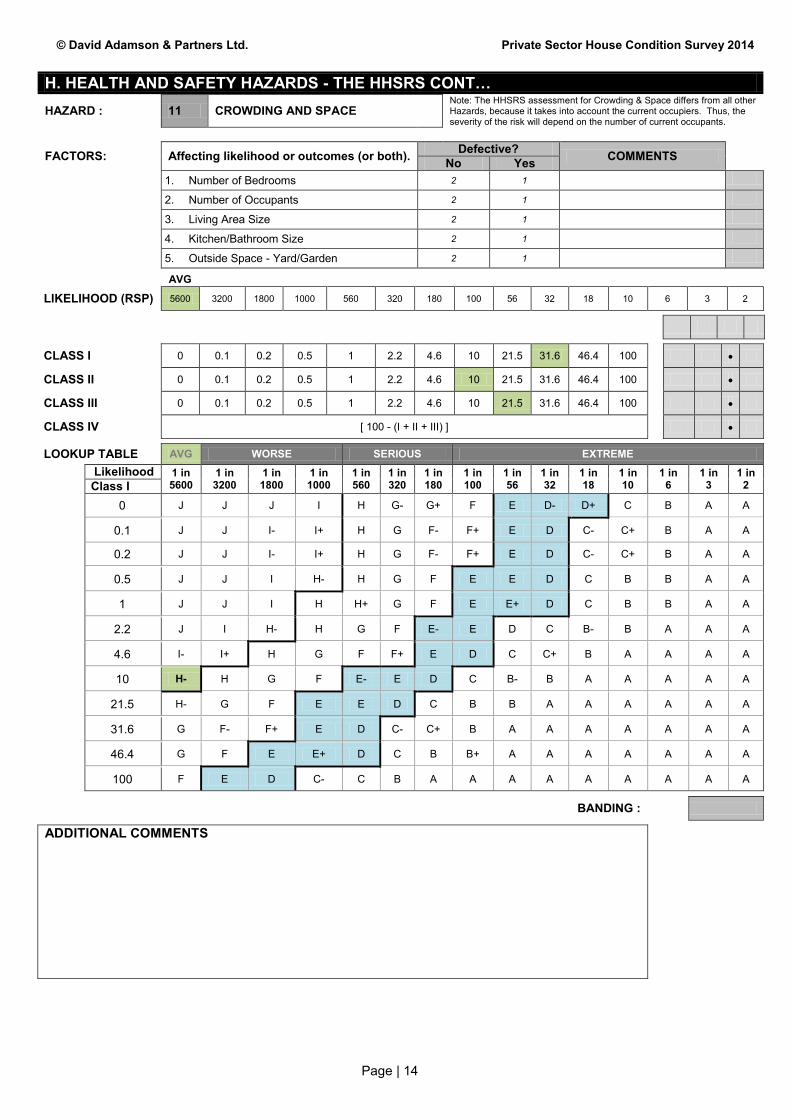
© David Adamson & Partners Ltd. Private Sector House Condition Survey 2014
Page | 14
H. HEALTH AND SAFETY HAZARDS - THE HHSRS CONT… HAZARD : 11 CROWDING AND SPACE
Note: The HHSRS assessment for Crowding & Space differs from all other Hazards, because it takes into account the current occupiers. Thus, the severity of the risk will depend on the number of current occupants.
FACTORS: Affecting likelihood or outcomes (or both). Defective? COMMENTS No Yes
1. Number of Bedrooms 2 1
2. Number of Occupants 2 1
3. Living Area Size 2 1
4. Kitchen/Bathroom Size 2 1
5. Outside Space - Yard/Garden 2 1
AVG
LIKELIHOOD (RSP) 5600 3200 1800 1000 560 320 180 100 56 32 18 10 6 3 2
CLASS I 0 0.1 0.2 0.5 1 2.2 4.6 10 21.5 31.6 46.4 100
CLASS II 0 0.1 0.2 0.5 1 2.2 4.6 10 21.5 31.6 46.4 100
CLASS III 0 0.1 0.2 0.5 1 2.2 4.6 10 21.5 31.6 46.4 100
CLASS IV [ 100 - (I + II + III) ]
LOOKUP TABLE AVG WORSE SERIOUS EXTREME
Likelihood 1 in 5600
1 in 3200
1 in 1800
1 in 1000
1 in 560
1 in 320
1 in 180
1 in 100
1 in 56
1 in 32
1 in 18
1 in 10
1 in 6
1 in 3
1 in 2 Class I
0 J J J I H G- G+ F E D- D+ C B A A
0.1 J J I- I+ H G F- F+ E D C- C+ B A A
0.2 J J I- I+ H G F- F+ E D C- C+ B A A
0.5 J J I H- H G F E E D C B B A A
1 J J I H H+ G F E E+ D C B B A A
2.2 J I H- H G F E- E D C B- B A A A
4.6 I- I+ H G F F+ E D C C+ B A A A A
10 H- H G F E- E D C B- B A A A A A
21.5 H- G F E E D C B B A A A A A A
31.6 G F- F+ E D C- C+ B A A A A A A A
46.4 G F E E+ D C B B+ A A A A A A A
100 F E D C- C B A A A A A A A A A
BANDING :
ADDITIONAL COMMENTS
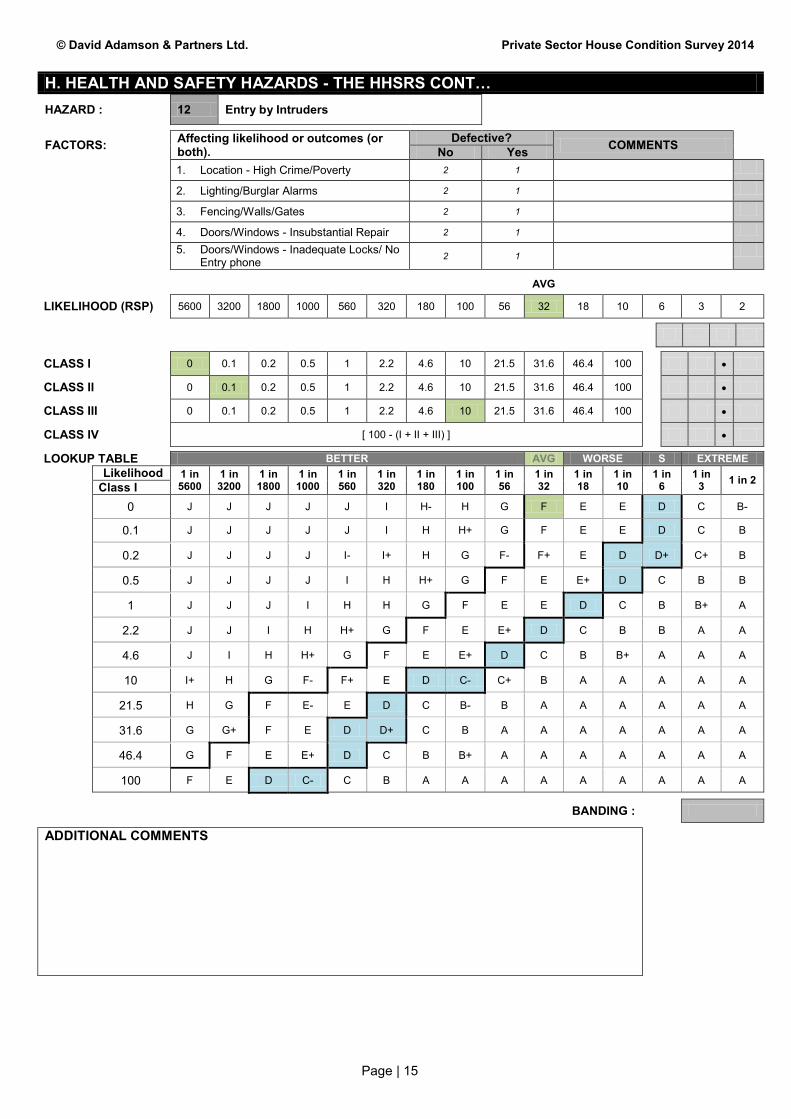
© David Adamson & Partners Ltd. Private Sector House Condition Survey 2014
Page | 15
H. HEALTH AND SAFETY HAZARDS - THE HHSRS CONT… HAZARD : 12 Entry by Intruders
FACTORS: Affecting likelihood or outcomes (or both).
Defective? COMMENTS No Yes
1. Location - High Crime/Poverty 2 1
2. Lighting/Burglar Alarms 2 1
3. Fencing/Walls/Gates 2 1
4. Doors/Windows - Insubstantial Repair 2 1
5. Doors/Windows - Inadequate Locks/ No Entry phone 2 1
AVG
LIKELIHOOD (RSP) 5600 3200 1800 1000 560 320 180 100 56 32 18 10 6 3 2
CLASS I 0 0.1 0.2 0.5 1 2.2 4.6 10 21.5 31.6 46.4 100
CLASS II 0 0.1 0.2 0.5 1 2.2 4.6 10 21.5 31.6 46.4 100
CLASS III 0 0.1 0.2 0.5 1 2.2 4.6 10 21.5 31.6 46.4 100
CLASS IV [ 100 - (I + II + III) ]
LOOKUP TABLE BETTER AVG WORSE S EXTREME
Likelihood 1 in 5600
1 in 3200
1 in 1800
1 in 1000
1 in 560
1 in 320
1 in 180
1 in 100
1 in 56
1 in 32
1 in 18
1 in 10
1 in 6
1 in 3 1 in 2 Class I
0 J J J J J I H- H G F E E D C B-
0.1 J J J J J I H H+ G F E E D C B
0.2 J J J J I- I+ H G F- F+ E D D+ C+ B
0.5 J J J J I H H+ G F E E+ D C B B
1 J J J I H H G F E E D C B B+ A
2.2 J J I H H+ G F E E+ D C B B A A
4.6 J I H H+ G F E E+ D C B B+ A A A
10 I+ H G F- F+ E D C- C+ B A A A A A
21.5 H G F E- E D C B- B A A A A A A
31.6 G G+ F E D D+ C B A A A A A A A
46.4 G F E E+ D C B B+ A A A A A A A
100 F E D C- C B A A A A A A A A A
BANDING :
ADDITIONAL COMMENTS

© David Adamson & Partners Ltd. Private Sector House Condition Survey 2014
Page | 16
H. HEALTH AND SAFETY HAZARDS - THE HHSRS CONT… HAZARD : 16 Food Safety
FACTORS: Affecting likelihood or outcomes (or both).
Defective? COMMENTS No Yes
1. Food Storage (adequate size?) 2 1
2. Kitchen Worktops 2 1
3. State of Repair 2 1
4. Safe Working Layout 2 1
5. Poorly sited cooker 2 1
AVG
LIKELIHOOD (RSP) 5600 3200 1800 1000 560 320 180 100 56 32 18 10 6 3 2
CLASS I 0 0.1 0.2 0.5 1 2.2 4.6 10 21.5 31.6 46.4 100
CLASS II 0 0.1 0.2 0.5 1 2.2 4.6 10 21.5 31.6 46.4 100
CLASS III 0 0.1 0.2 0.5 1 2.2 4.6 10 21.5 31.6 46.4 100
CLASS IV [ 100 - (I + II + III) ]
LOOKUP TABLE AVG WORSE SERIOUS EXTREME
Likelihood 1 in 5600
1 in 3200
1 in 1800
1 in 1000
1 in 560
1 in 320
1 in 180
1 in 100
1 in 56
1 in 32
1 in 18
1 in 10
1 in 6
1 in 3 1 in 2 Class I
0 J J J J I H G- G+ F E D- D+ C B B+
0.1 J J J I- I+ H G F- F+ E D C- C B A-
0.2 J J J I- H- H G F E- E D C C+ B A
0.5 J J J I H H+ G F E E D C B B+ A
1 J J I- I+ H G F F+ E D C C+ B A A
2.2 J J I H G G+ F E D D+ C B A- A A
4.6 J I H G G+ F E D D+ C B A A A A
10 I+ H G F F+ E D C C+ B A A A A A
21.5 H G F E E D C B B A A A A A A
31.6 G F- F+ E D C- C+ B A A A A A A A
46.4 G F E E+ D C B B+ A A A A A A A
100 F+ E D C- C+ B A A A A A A A A A
BANDING :
ADDITIONAL COMMENTS

© David Adamson & Partners Ltd. Private Sector House Condition Survey 2014
Page | 17
H. HEALTH AND SAFETY HAZARDS - THE HHSRS CONT… HAZARD : 20 Falls on the Level
FACTORS: Affecting likelihood or outcomes (or both).
Defective? COMMENTS No Yes
1. Uneven/Sloping Floor Surface 2 1
2. Trip Step/Projecting Threshold 2 1
3. Surface Water Standing 2 1
4. Poor/Inadequate Lighting 2 1
5. Disrepair 2 1
AVG Pre-1919
LIKELIHOOD (RSP) 5600 3200 1800 1000 560 320 180 100 56 32 18 10 6 3 2
CLASS I 0 0.1 0.2 0.5 1 2.2 4.6 10 21.5 31.6 46.4 100
CLASS II 0 0.1 0.2 0.5 1 2.2 4.6 10 21.5 31.6 46.4 100
CLASS III 0 0.1 0.2 0.5 1 2.2 4.6 10 21.5 31.6 46.4 100
CLASS IV [ 100 - (I + II + III) ]
LOOKUP TABLE BETTER AVG WORSE S EXTREME
Likelihood 1 in 5600
1 in 3200
1 in 1800
1 in 1000
1 in 560
1 in 320
1 in 180
1 in 100
1 in 56
1 in 32
1 in 18
1 in 10
1 in 6
1 in 3 1 in 2 Class I
0 J J I- H- H G F E- E D C B- B A A
0.1 J J I- H- H G F E- E D C B- B A A
0.2 J J I H- H G F E- E D C B- B A A
0.5 J J I H H G F E E D C B B A A
1 J J I H G- G+ F E D- D+ C B A- A A
2.2 J I H H G F E E D C B B A A A
4.6 I- H- H F F E- E D C B- B A A A A
10 H- H G F E- E D C B- B A A A A A
21.5 H G F E E D C B B A A A A A A
31.6 G F- F+ E D C- C+ B A A A A A A A
46.4 G F E E+ D C B B+ A A A A A A A
100 F E D C- C B A A A A A A A A A
BANDING :
ADDITIONAL COMMENTS
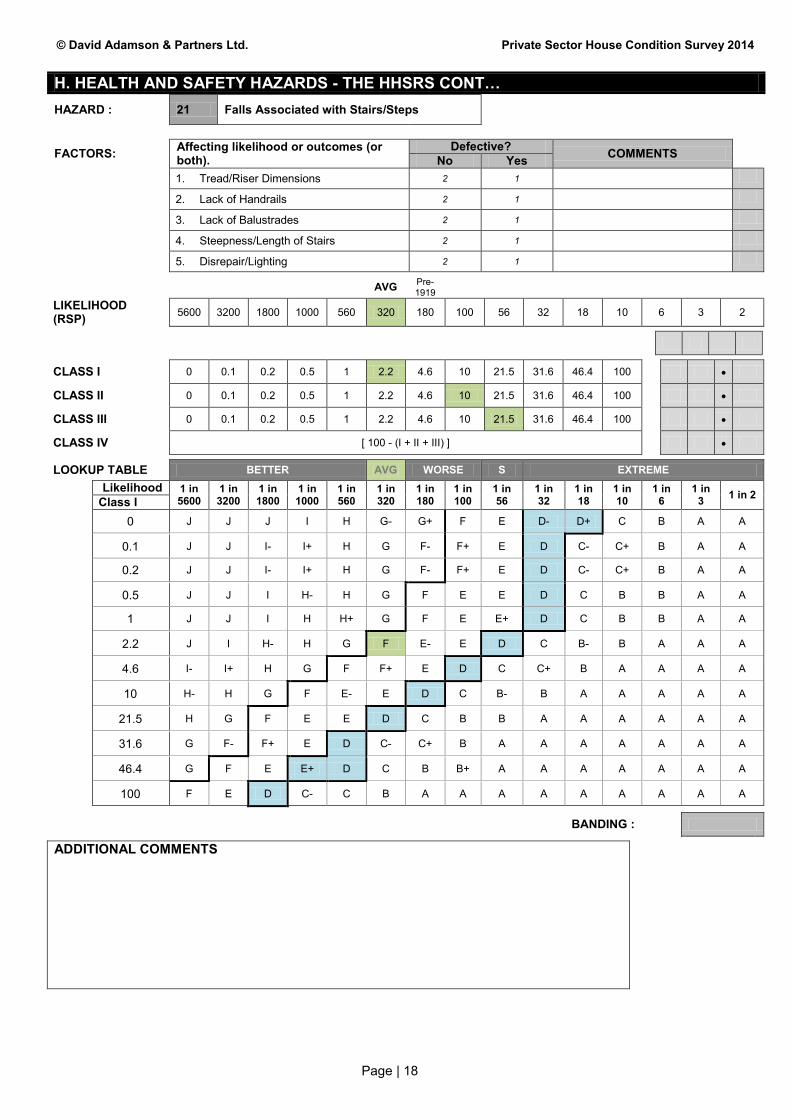
© David Adamson & Partners Ltd. Private Sector House Condition Survey 2014
Page | 18
H. HEALTH AND SAFETY HAZARDS - THE HHSRS CONT… HAZARD : 21 Falls Associated with Stairs/Steps
FACTORS: Affecting likelihood or outcomes (or both).
Defective? COMMENTS No Yes
1. Tread/Riser Dimensions 2 1
2. Lack of Handrails 2 1
3. Lack of Balustrades 2 1
4. Steepness/Length of Stairs 2 1
5. Disrepair/Lighting 2 1
AVG Pre-1919
LIKELIHOOD (RSP) 5600 3200 1800 1000 560 320 180 100 56 32 18 10 6 3 2
CLASS I 0 0.1 0.2 0.5 1 2.2 4.6 10 21.5 31.6 46.4 100
CLASS II 0 0.1 0.2 0.5 1 2.2 4.6 10 21.5 31.6 46.4 100
CLASS III 0 0.1 0.2 0.5 1 2.2 4.6 10 21.5 31.6 46.4 100
CLASS IV [ 100 - (I + II + III) ]
LOOKUP TABLE BETTER AVG WORSE S EXTREME
Likelihood 1 in 5600
1 in 3200
1 in 1800
1 in 1000
1 in 560
1 in 320
1 in 180
1 in 100
1 in 56
1 in 32
1 in 18
1 in 10
1 in 6
1 in 3 1 in 2 Class I
0 J J J I H G- G+ F E D- D+ C B A A
0.1 J J I- I+ H G F- F+ E D C- C+ B A A
0.2 J J I- I+ H G F- F+ E D C- C+ B A A
0.5 J J I H- H G F E E D C B B A A
1 J J I H H+ G F E E+ D C B B A A
2.2 J I H- H G F E- E D C B- B A A A
4.6 I- I+ H G F F+ E D C C+ B A A A A
10 H- H G F E- E D C B- B A A A A A
21.5 H G F E E D C B B A A A A A A
31.6 G F- F+ E D C- C+ B A A A A A A A
46.4 G F E E+ D C B B+ A A A A A A A
100 F E D C- C B A A A A A A A A A
BANDING :
ADDITIONAL COMMENTS

© David Adamson & Partners Ltd. Private Sector House Condition Survey 2014
Page | 19
H. HEALTH AND SAFETY HAZARDS - THE HHSRS CONT… HAZARD : 22 Falls between levels
FACTORS: Affecting likelihood or outcomes (or both).
Defective? COMMENTS No Yes
1. Lack of Safety Catches to Windows 2 1
2. Sill Height Less than 1m 2 1
3. Window Type 2 1
4. Guarding/Safety Glass 2 1
5. Disrepair 2 1
AVG
LIKELIHOOD (RSP) 5600 3200 1800 1000 560 320 180 100 56 32 18 10 6 3 2
CLASS I 0 0.1 0.2 0.5 1 2.2 4.6 10 21.5 31.6 46.4 100
CLASS II 0 0.1 0.2 0.5 1 2.2 4.6 10 21.5 31.6 46.4 100
CLASS III 0 0.1 0.2 0.5 1 2.2 4.6 10 21.5 31.6 46.4 100
CLASS IV [ 100 - (I + II + III) ]
LOOKUP TABLE BETTER AVG WORSE SERIOUS EXTREME
Likelihood 1 in 5600
1 in 3200
1 in 1800
1 in 1000
1 in 560
1 in 320
1 in 180
1 in 100
1 in 56
1 in 32
1 in 18
1 in 10
1 in 6
1 in 3 1 in 2 Class I
0 J J J J I- I+ H G F E E D C- B- B
0.1 J J J J I H- H G F E E D C B B
0.2 J J J J I H H G F E E D C B B
0.5 J J J I- I+ H G F F+ E D C C+ B A
1 J J J I H G- G F E D- D C B A- A
2.2 J J I H G- G F E D- D C B B+ A A
4.6 J I H G- G F E D- D C B A- A A A
10 I+ H G E- E+ E D C- C+ B A A A A A
21.5 H G F E E D C B B A A A A A A
31.6 G F- F E D C- C B A A A A A A A
46.4 G F E E+ D C B B+ A A A A A A A
100 F E D C- C B A A A A A A A A A
BANDING :
ADDITIONAL COMMENTS
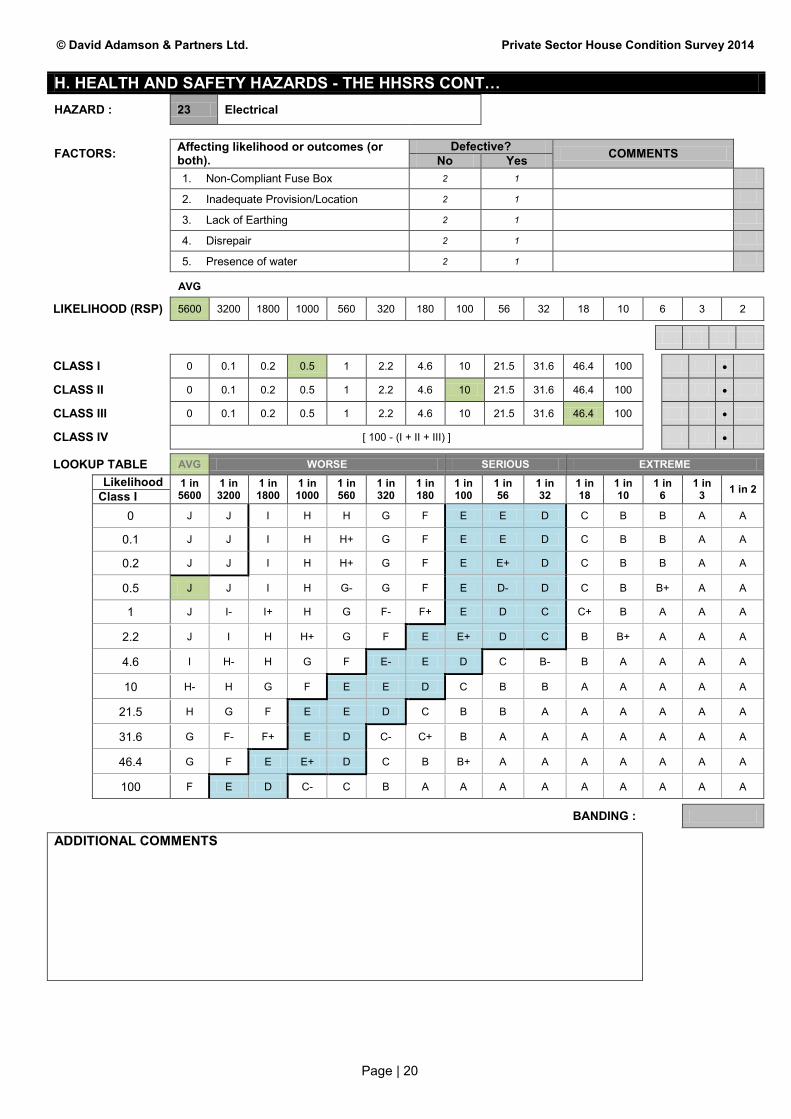
© David Adamson & Partners Ltd. Private Sector House Condition Survey 2014
Page | 20
H. HEALTH AND SAFETY HAZARDS - THE HHSRS CONT… HAZARD : 23 Electrical
FACTORS: Affecting likelihood or outcomes (or both).
Defective? COMMENTS No Yes
1. Non-Compliant Fuse Box 2 1
2. Inadequate Provision/Location 2 1
3. Lack of Earthing 2 1
4. Disrepair 2 1
5. Presence of water 2 1
AVG
LIKELIHOOD (RSP) 5600 3200 1800 1000 560 320 180 100 56 32 18 10 6 3 2
CLASS I 0 0.1 0.2 0.5 1 2.2 4.6 10 21.5 31.6 46.4 100
CLASS II 0 0.1 0.2 0.5 1 2.2 4.6 10 21.5 31.6 46.4 100
CLASS III 0 0.1 0.2 0.5 1 2.2 4.6 10 21.5 31.6 46.4 100
CLASS IV [ 100 - (I + II + III) ]
LOOKUP TABLE AVG WORSE SERIOUS EXTREME
Likelihood 1 in 5600
1 in 3200
1 in 1800
1 in 1000
1 in 560
1 in 320
1 in 180
1 in 100
1 in 56
1 in 32
1 in 18
1 in 10
1 in 6
1 in 3 1 in 2 Class I
0 J J I H H G F E E D C B B A A
0.1 J J I H H+ G F E E D C B B A A
0.2 J J I H H+ G F E E+ D C B B A A
0.5 J J I H G- G F E D- D C B B+ A A
1 J I- I+ H G F- F+ E D C C+ B A A A
2.2 J I H H+ G F E E+ D C B B+ A A A
4.6 I H- H G F E- E D C B- B A A A A
10 H- H G F E E D C B B A A A A A
21.5 H G F E E D C B B A A A A A A
31.6 G F- F+ E D C- C+ B A A A A A A A
46.4 G F E E+ D C B B+ A A A A A A A
100 F E D C- C B A A A A A A A A A
BANDING :
ADDITIONAL COMMENTS

© David Adamson & Partners Ltd. Private Sector House Condition Survey 2014
Page | 21
H. HEALTH AND SAFETY HAZARDS - THE HHSRS CONT… HAZARD : 24 Fire
FACTORS: Affecting likelihood or outcomes (or both).
Defective? COMMENTS No Yes
1. Lack of Smoke Detectors 2 1
2. Location of Cooker/Elec Sockets 2 1
3. Non-Fire Resistant Material 2 1
4. Means of Escape 2 1
5. Door Positions 2 1
AVG
LIKELIHOOD (RSP) 5600 3200 1800 1000 560 320 180 100 56 32 18 10 6 3 2
CLASS I 0 0.1 0.2 0.5 1 2.2 4.6 10 21.5 31.6 46.4 100
CLASS II 0 0.1 0.2 0.5 1 2.2 4.6 10 21.5 31.6 46.4 100
CLASS III 0 0.1 0.2 0.5 1 2.2 4.6 10 21.5 31.6 46.4 100
CLASS IV [ 100 - (I + II + III) ]
LOOKUP TABLE AVG WORSE SERIOUS EXTREME
Likelihood 1 in 5600
1 in 3200
1 in 1800
1 in 1000
1 in 560
1 in 320
1 in 180
1 in 100
1 in 56
1 in 32
1 in 18
1 in 10
1 in 6
1 in 3 1 in 2 Class I
0 J J J I H- H G F E E D C B- B A
0.1 J J J I H H G F E E D C B B A
0.2 J J J I H H G F E E D C B B+ A
0.5 J J J I H G- G+ F E D D+ C B A A
1 J J I H- H G F E E D C B B A A
2.2 J I- I+ H G F- F+ E D C C+ B A A A
4.6 I I+ H G F- F+ E D C- C+ B A A A A
10 H- H G F E- E D C B- B A A A A A
21.5 H G F E E D C B B A A A A A A
31.6 G F- F+ E D C- C+ B A A A A A A A
46.4 G F E E+ D C B B+ A A A A A A A
100 F E D C C B A A A A A A A A A
BANDING :
ADDITIONAL COMMENTS

© David Adamson & Partners Ltd. Private Sector House Condition Survey 2014
Page | 22
H. HEALTH AND SAFETY HAZARDS - THE HHSRS CONT… HAZARD : 25 Flames, Hot Surfaces
FACTORS: Affecting likelihood or outcomes (or both).
Defective? COMMENTS No Yes
1. Unguarded Open Flames 2 1
2. Unprotected pipework/hot surface 2 1
3. Location of Cooker 2 1
4. Defective HW Thermostat 2 1
5. Kitchen Layout 2 1
AVG
LIKELIHOOD (RSP) 5600 3200 1800 1000 560 320 180 100 56 32 18 10 6 3 2
CLASS I 0 0.1 0.2 0.5 1 2.2 4.6 10 21.5 31.6 46.4 100
CLASS II 0 0.1 0.2 0.5 1 2.2 4.6 10 21.5 31.6 46.4 100
CLASS III 0 0.1 0.2 0.5 1 2.2 4.6 10 21.5 31.6 46.4 100
CLASS IV [ 100 - (I + II + III) ]
LOOKUP TABLE BETTER AVG WORSE SERIOUS EXTREME
Likelihood 1 in 5600
1 in 3200
1 in 1800
1 in 1000
1 in 560
1 in 320
1 in 180
1 in 100
1 in 56
1 in 32
1 in 18
1 in 10
1 in 6
1 in 3
1 in 2 Class I
0 J J J J I H H+ G F E E D C B B
0.1 J J J J I H G- G F E D- D C B B+
0.2 J J J I- I+ H G F- F+ E D C- C B A-
0.5 J J J I H H G F E E D C B B A
1 J J I- I+ H G F- F+ E D C- C+ B A A
2.2 J J I H G- G+ F E D- D+ C B A- A A
4.6 J I H G- G+ F E D D+ C B A A A A
10 I+ H G F F+ E D C C+ B A A A A A
21.5 H G F E E D C B B A A A A A A
31.6 G F- F+ E D C- C+ B A A A A A A A
46.4 G F E E+ D C B B+ A A A A A A A
100 F E D C- C B A A A A A A A A A
BANDING :
ADDITIONAL COMMENTS

© David Adamson & Partners Ltd. Private Sector House Condition Survey 2014
Page | 23
I. ENVIRONMENTAL APPRAISAL I1. Are problems apparent in the
local area or neighbourhood…?
(Surveyor Assessment)
PROBLEMS NOT A PROBLEM MINOR MAJOR
a) Litter and Rubbish 1
2
3
b) Scruffy Gardens 1
2
3
c) Graffiti 1
2
3
d) Vandalism 1
2
3
e) Scruffy/Neglected Buildings 1
2
3
f) Dog Fouling 1
2
3
g) Condition of Dwellings 1
2
3
h) Nuisance from Street Parking 1
2
3
i) Ambient Air Quality 1
2
3
j) Heavy Traffic 1
2
3
k) Railway/Aircraft Noise 1
2
3
l) Intrusion from Motorways 1
2
3
m) Vacant Sites 1
2
3
n) Intrusive Industry 1
2
3
o) Non conforming Uses 1
2
3
p) Vacant/Boarded-up Buildings 1
2
3
I2. Visual quality of local environment? (Surveyor Assessment)
good
5
above average
4
average
3
below average
2
poor
1
J. HOUSEHOLD INFORMATION J1. How long has your household lived at this address?
unob. 9
over 20 years
6
11-20 yrs
5
6-10 yrs
4
3-5 yrs
3
1-2 yrs
2
under 1 yr
1
J2. Would you like to move within the next 12 months if you had a free choice?
yes –
definitely 4
yes - possible
3
don’t know
2
no
1
J3. How satisfied are you with your current accommodation?
don’t know 5
very dissatisfied
4
fairly dissatisfied
3
fairly satisfied
2
very satisfied
1
J4. How satisfied or otherwise are you with the area in which you live?
don’t know 5
very dissatisfied
4
quite dissatisfied
3
quite satisfied
2
very satisfied
1
J5. Over the past 5 years would you say your area has ……?
declined 3
improved
2
remained the same
1
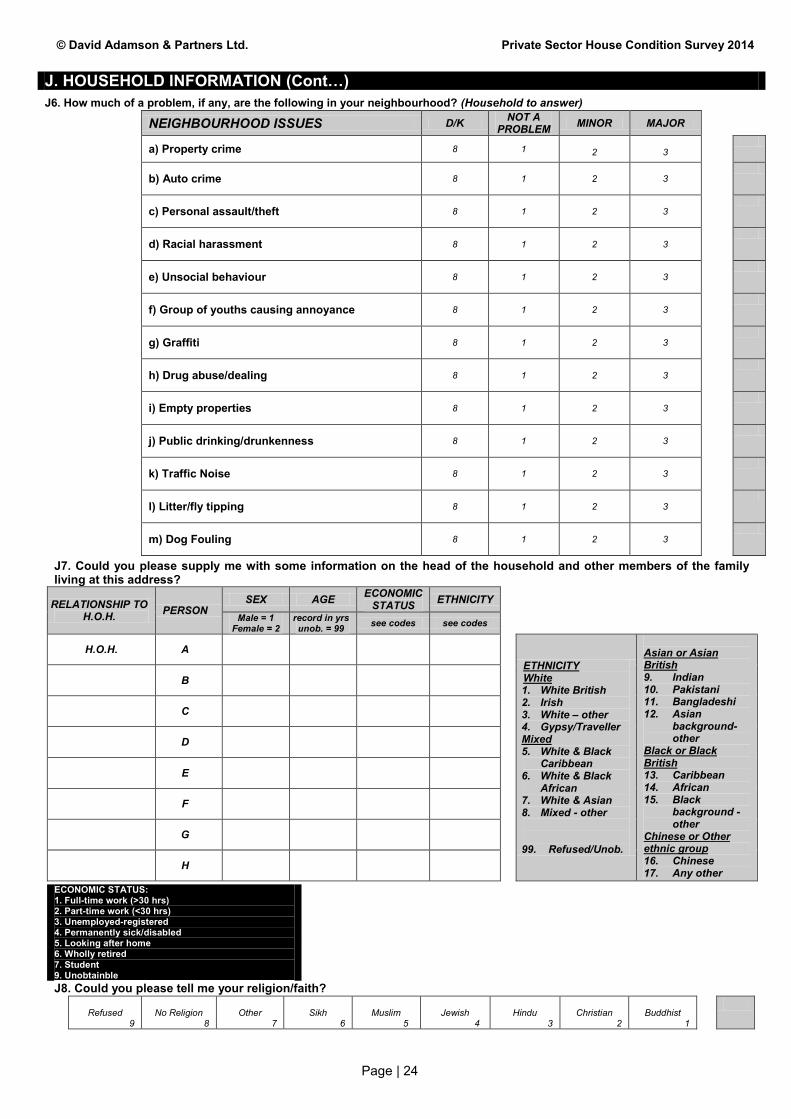
© David Adamson & Partners Ltd. Private Sector House Condition Survey 2014
Page | 24
J. HOUSEHOLD INFORMATION (Cont…)
J6. How much of a problem, if any, are the following in your neighbourhood? (Household to answer) NEIGHBOURHOOD ISSUES D/K NOT A
PROBLEM MINOR MAJOR
a) Property crime 8 1
2 3
b) Auto crime 8 1
2 3
c) Personal assault/theft 8 1
2 3
d) Racial harassment 8 1
2 3
e) Unsocial behaviour 8 1
2 3
f) Group of youths causing annoyance 8 1
2 3
g) Graffiti 8 1
2 3
h) Drug abuse/dealing 8 1
2 3
i) Empty properties 8 1
2 3
j) Public drinking/drunkenness 8 1
2 3
k) Traffic Noise 8 1
2 3
l) Litter/fly tipping 8 1
2 3
m) Dog Fouling 8 1
2 3
J7. Could you please supply me with some information on the head of the household and other members of the family living at this address?
RELATIONSHIP TO H.O.H. PERSON
SEX AGE ECONOMIC STATUS ETHNICITY
Male = 1
Female = 2 record in yrs unob. = 99 see codes see codes
H.O.H. A ETHNICITY White 1. White British 2. Irish 3. White – other 4. Gypsy/Traveller Mixed 5. White & Black
Caribbean 6. White & Black
African 7. White & Asian 8. Mixed - other 99. Refused/Unob.
Asian or Asian British 9. Indian 10. Pakistani 11. Bangladeshi 12. Asian
background-other
Black or Black British 13. Caribbean 14. African 15. Black
background -other
Chinese or Other ethnic group 16. Chinese 17. Any other
B
C
D
E
F
G
H o
ECONOMIC STATUS: 1. Full-time work (>30 hrs) 2. Part-time work (<30 hrs) 3. Unemployed-registered 4. Permanently sick/disabled 5. Looking after home 6. Wholly retired 7. Student 9. Unobtainble
.
J8. Could you please tell me your religion/faith?
Refused 9
No Religion
8
Other
7
Sikh
6
Muslim
5
Jewish
4
Hindu
3
Christian
2
Buddhist
1

© David Adamson & Partners Ltd. Private Sector House Condition Survey 2014
Page | 25
J. HOUSEHOLD INFORMATION (Cont…)
J9. Does anyone in the household suffer from a limiting long-term illness or disability?
yes 2
no
1
J10. IF YES, what illness/disability do they suffer from?
ILLNESS/DISABILITY N/A YES NO
a) Heart/circulatory problems e.g. angina/stroke 8 2 1
b) Respiratory illness e.g. asthma/bronchitis 8 2 1
c) Mobility impairment 8 2 1
d) Visual impairment 8 2 1
e) Hearing impairment 8 2 1
f) Speech impairment 8 2 1
g) Mental health problem 8 2 1
h) Learning difficulty/disability 8 2 1
i) Other physical disability 8 2 1
J11. IF YES, has your illness/disability caused you to do any of the following in the past year?
ACTION N/A YES NO
a) Consult GP through visit to surgery 8 2 1
b) Consult GP through home visit 8 2 1
c) Contact NHS Direct 8 2 1
d) Attend hospital accident/emergency 8 2 1
e) Attend hospital as outpatient 8 2 1
f) Attend hospital as inpatient 8 2 1
J12. During the past year have any of the following symptoms caused you or a member of your household to consult your GP or visit hospital?
SYMPTOM YES NO
a) Aches and pains 2 1
b) Nerves/stress 2 1
c) Vomiting 2 1
d) Diarrhoea 2 1
e) Blocked nose 2 1
f) Breathlessness/wheeziness 2 1
g) Backache 2 1
h) Fainting 2 1
i) Headaches/fever 2 1
J13. During the past year have you or any member of your household had an accident in the home?
yes
2
no
1
J13a. IF YES - Did this accident involve any of the following?
ACCIDENT N/A YES NO
a) Trip or fall 8 2 1
b) Electrical shock 8 2 1
c) Fire/explosion 8 2 1
d) Burns/scalds 8 2 1
e) Other 8 2 1

© David Adamson & Partners Ltd. Private Sector House Condition Survey 2014
Page | 26
J. HOUSEHOLD INFORMATION (Cont…) J13b. IF YES - Did you or any member of the household consult the GP or attend hospital?
ACTION N/A YES NO
a) Consulted GP 8 2 1
b) Attended hospital accident/emergency 8 2 1
c) Attended hospital as outpatient 8 2 1
d) Attended hospital as inpatient 8 2 1
J14. Do you or any members of your household have difficulties with any of the following?
ACTIVITY YES NO
a) Climbing steps/stairs 2 1
b) Getting in/out of bath 2 1
c) Turning taps on/off 2 1
d) Cooking/preparing food 2 1
e) Using WC 2 1
f) Washing/drying clothes 2 1
g) Access to/from the home 2 1
h) Access to ground floor rooms 2 1
i) Access to front or rear gardens 2 1
J15. Do you think the design and/or condition of your home affects the health and well-being of your family?
don’t know
4
yes - negatively
3
yes - positively
2
no - not really
1
J16. Do you have access to the internet?
no 2
yes
1
J17. Are you able to use a computer on the internet?
no 2
yes
1
J18. Have you ever switched your electricity and/or gas supplier?
don’t know 3
no
2
yes
1
J18a. IF YES: Was this within the last 12 months
n/a 8
don’t know
3
no
2
yes
1
J19. During the last month did you, your partner/spouse or other members of your household receive an income from any of these sources…?
SOURCE REFUSED/ D/K YES NO
a) No Source of Income 8 2 1
b) Earnings, wages, salary, bonuses 8 2 1
c) Income from self employment 8 2 1
d) Interest from savings/investments 8 2 1
e) Other income (maintenance payments, grants, rent) 8 2 1
f) Pension from employment 8 2 1
g) Retirement or widows pension 8 2 1
h) Income based jobseekers allowance 8 2 1
i) Working tax credit 8 2 1
j) Pension credit 8 2 1
k) Child tax credit 8 2 1
l) Income support 8 2 1
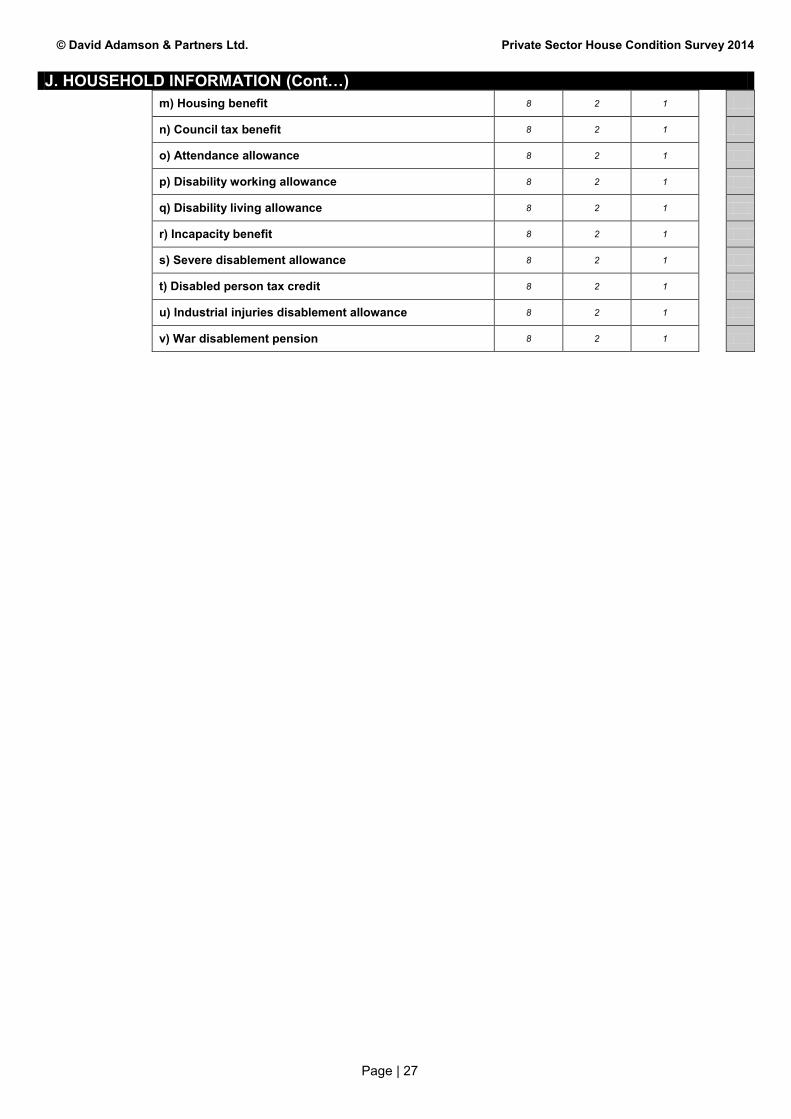
© David Adamson & Partners Ltd. Private Sector House Condition Survey 2014
Page | 27
J. HOUSEHOLD INFORMATION (Cont…) m) Housing benefit 8 2 1
n) Council tax benefit 8 2 1
o) Attendance allowance 8 2 1
p) Disability working allowance 8 2 1
q) Disability living allowance 8 2 1
r) Incapacity benefit 8 2 1
s) Severe disablement allowance 8 2 1
t) Disabled person tax credit 8 2 1
u) Industrial injuries disablement allowance 8 2 1
v) War disablement pension 8 2 1
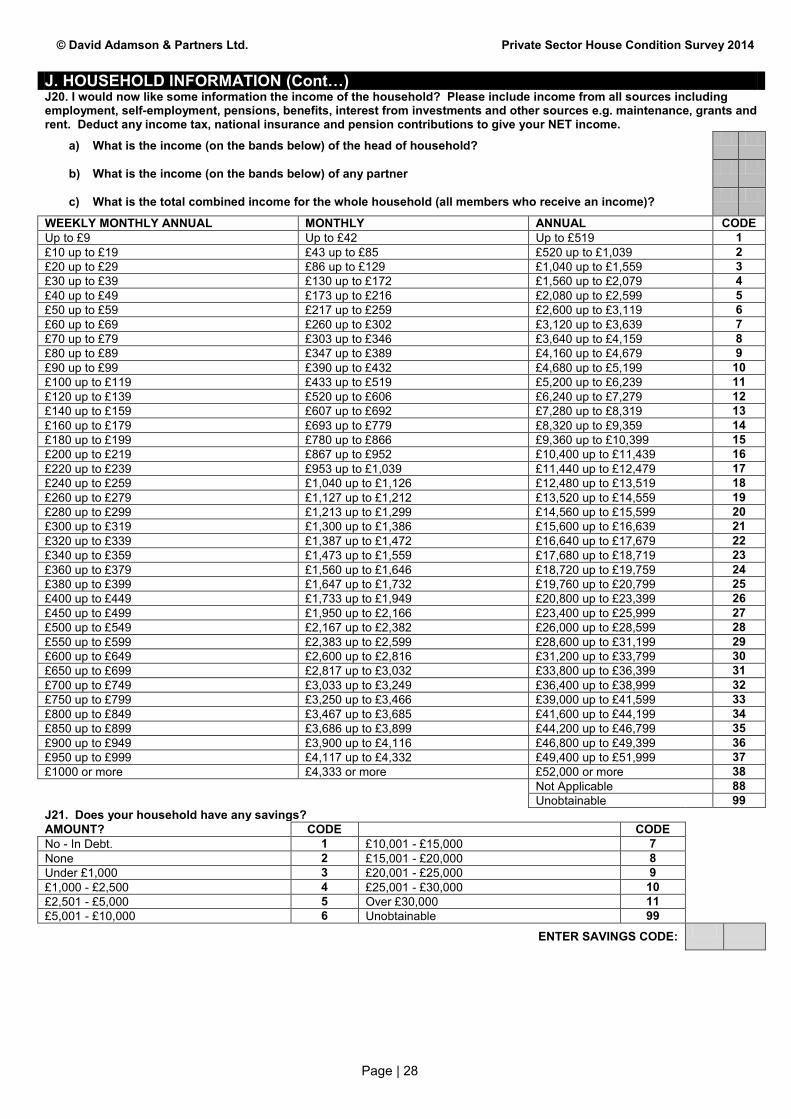
© David Adamson & Partners Ltd. Private Sector House Condition Survey 2014
Page | 28
J. HOUSEHOLD INFORMATION (Cont…) J20. I would now like some information the income of the household? Please include income from all sources including employment, self-employment, pensions, benefits, interest from investments and other sources e.g. maintenance, grants and rent. Deduct any income tax, national insurance and pension contributions to give your NET income.
a) What is the income (on the bands below) of the head of household?
b) What is the income (on the bands below) of any partner
c) What is the total combined income for the whole household (all members who receive an income)?
WEEKLY MONTHLY ANNUAL MONTHLY ANNUAL CODE Up to £9 Up to £42 Up to £519 1 £10 up to £19 £43 up to £85 £520 up to £1,039 2 £20 up to £29 £86 up to £129 £1,040 up to £1,559 3 £30 up to £39 £130 up to £172 £1,560 up to £2,079 4 £40 up to £49 £173 up to £216 £2,080 up to £2,599 5 £50 up to £59 £217 up to £259 £2,600 up to £3,119 6 £60 up to £69 £260 up to £302 £3,120 up to £3,639 7 £70 up to £79 £303 up to £346 £3,640 up to £4,159 8 £80 up to £89 £347 up to £389 £4,160 up to £4,679 9 £90 up to £99 £390 up to £432 £4,680 up to £5,199 10 £100 up to £119 £433 up to £519 £5,200 up to £6,239 11 £120 up to £139 £520 up to £606 £6,240 up to £7,279 12 £140 up to £159 £607 up to £692 £7,280 up to £8,319 13 £160 up to £179 £693 up to £779 £8,320 up to £9,359 14 £180 up to £199 £780 up to £866 £9,360 up to £10,399 15 £200 up to £219 £867 up to £952 £10,400 up to £11,439 16 £220 up to £239 £953 up to £1,039 £11,440 up to £12,479 17 £240 up to £259 £1,040 up to £1,126 £12,480 up to £13,519 18 £260 up to £279 £1,127 up to £1,212 £13,520 up to £14,559 19 £280 up to £299 £1,213 up to £1,299 £14,560 up to £15,599 20 £300 up to £319 £1,300 up to £1,386 £15,600 up to £16,639 21 £320 up to £339 £1,387 up to £1,472 £16,640 up to £17,679 22 £340 up to £359 £1,473 up to £1,559 £17,680 up to £18,719 23 £360 up to £379 £1,560 up to £1,646 £18,720 up to £19,759 24 £380 up to £399 £1,647 up to £1,732 £19,760 up to £20,799 25 £400 up to £449 £1,733 up to £1,949 £20,800 up to £23,399 26 £450 up to £499 £1,950 up to £2,166 £23,400 up to £25,999 27 £500 up to £549 £2,167 up to £2,382 £26,000 up to £28,599 28 £550 up to £599 £2,383 up to £2,599 £28,600 up to £31,199 29 £600 up to £649 £2,600 up to £2,816 £31,200 up to £33,799 30 £650 up to £699 £2,817 up to £3,032 £33,800 up to £36,399 31 £700 up to £749 £3,033 up to £3,249 £36,400 up to £38,999 32 £750 up to £799 £3,250 up to £3,466 £39,000 up to £41,599 33 £800 up to £849 £3,467 up to £3,685 £41,600 up to £44,199 34 £850 up to £899 £3,686 up to £3,899 £44,200 up to £46,799 35 £900 up to £949 £3,900 up to £4,116 £46,800 up to £49,399 36 £950 up to £999 £4,117 up to £4,332 £49,400 up to £51,999 37 £1000 or more £4,333 or more £52,000 or more 38 Not Applicable 88 Unobtainable 99 J21. Does your household have any savings? AMOUNT? CODE CODE No - In Debt. 1 £10,001 - £15,000 7 None 2 £15,001 - £20,000 8 Under £1,000 3 £20,001 - £25,000 9 £1,000 - £2,500 4 £25,001 - £30,000 10 £2,501 - £5,000 5 Over £30,000 11 £5,001 - £10,000 6 Unobtainable 99 ENTER SAVINGS CODE:
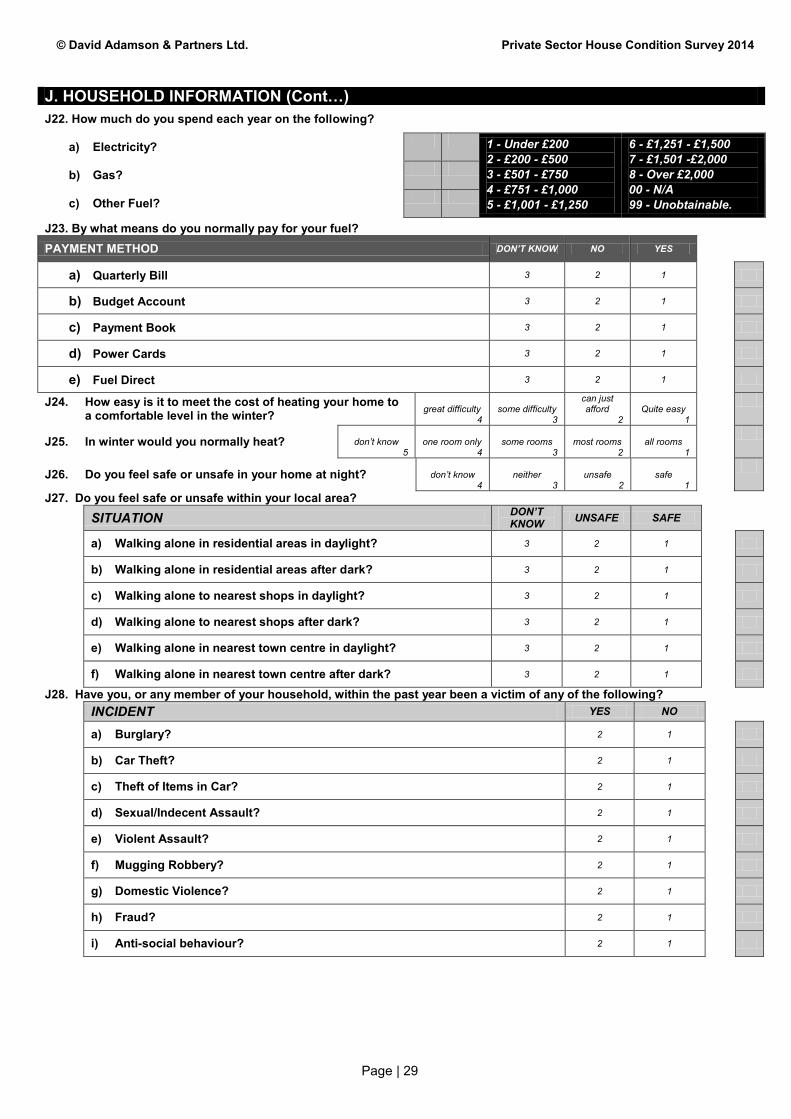
© David Adamson & Partners Ltd. Private Sector House Condition Survey 2014
Page | 29
J. HOUSEHOLD INFORMATION (Cont…) J22. How much do you spend each year on the following?
a) Electricity? 1 - Under £200 2 - £200 - £500 3 - £501 - £750 4 - £751 - £1,000 5 - £1,001 - £1,250
6 - £1,251 - £1,500 7 - £1,501 -£2,000 8 - Over £2,000 00 - N/A 99 - Unobtainable.
b) Gas?
c) Other Fuel?
J23. By what means do you normally pay for your fuel? PAYMENT METHOD DON’T KNOW NO YES
a) Quarterly Bill 3 2 1
b) Budget Account 3 2 1
c) Payment Book 3 2 1
d) Power Cards 3 2 1
e) Fuel Direct 3 2 1
J24. How easy is it to meet the cost of heating your home to a comfortable level in the winter?
great difficulty
4
some difficulty
3
can just afford
2
Quite easy
1
J25. In winter would you normally heat?
don’t know 5
one room only
4
some rooms
3
most rooms
2
all rooms
1
J26. Do you feel safe or unsafe in your home at night?
don’t know 4
neither
3
unsafe
2
safe
1
J27. Do you feel safe or unsafe within your local area? SITUATION DON’T
KNOW UNSAFE SAFE
a) Walking alone in residential areas in daylight? 3 2 1
b) Walking alone in residential areas after dark? 3 2 1
c) Walking alone to nearest shops in daylight? 3 2 1
d) Walking alone to nearest shops after dark? 3 2 1
e) Walking alone in nearest town centre in daylight? 3 2 1
f) Walking alone in nearest town centre after dark? 3 2 1
J28. Have you, or any member of your household, within the past year been a victim of any of the following? INCIDENT YES NO
a) Burglary? 2 1
b) Car Theft? 2 1
c) Theft of Items in Car? 2 1
d) Sexual/Indecent Assault? 2 1
e) Violent Assault? 2 1
f) Mugging Robbery? 2 1
g) Domestic Violence? 2 1
h) Fraud? 2 1
i) Anti-social behaviour? 2 1
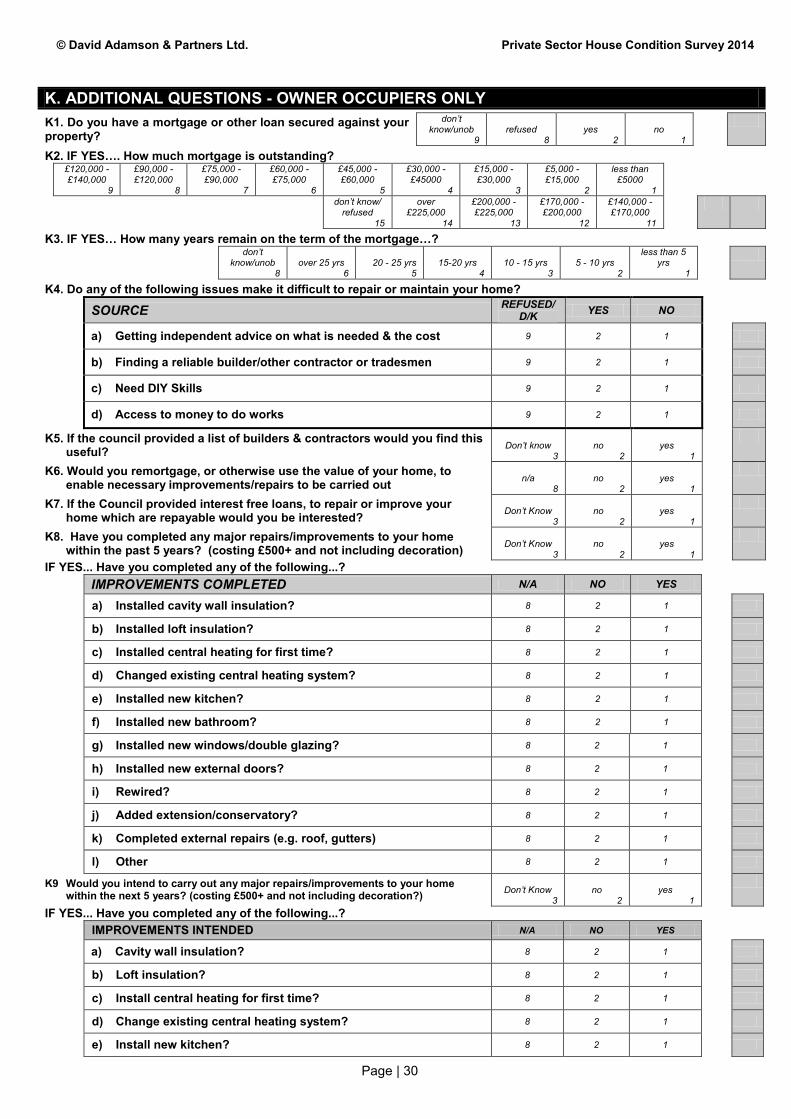
© David Adamson & Partners Ltd. Private Sector House Condition Survey 2014
Page | 30
K. ADDITIONAL QUESTIONS - OWNER OCCUPIERS ONLY
K1. Do you have a mortgage or other loan secured against your property?
don’t know/unob
9
refused
8
yes
2
no
1
K2. IF YES…. How much mortgage is outstanding? £120,000 -
£140,000 9
£90,000 - £120,000
8
£75,000 - £90,000
7
£60,000 - £75,000
6
£45,000 - £60,000
5
£30,000 - £45000
4
£15,000 - £30,000
3
£5,000 - £15,000
2
less than £5000
1
don’t know/ refused
15
over £225,000
14
£200,000 - £225,000
13
£170,000 - £200,000
12
£140,000 - £170,000
11
K3. IF YES… How many years remain on the term of the mortgage…?
don’t
know/unob 8
over 25 yrs
6
20 - 25 yrs
5
15-20 yrs
4
10 - 15 yrs
3
5 - 10 yrs
2
less than 5 yrs
1
K4. Do any of the following issues make it difficult to repair or maintain your home? SOURCE REFUSED/
D/K YES NO
a) Getting independent advice on what is needed & the cost 9 2 1
b) Finding a reliable builder/other contractor or tradesmen 9 2 1
c) Need DIY Skills 9 2 1
d) Access to money to do works 9 2 1
K5. If the council provided a list of builders & contractors would you find this useful?
Don’t know
3
no
2
yes
1
K6. Would you remortgage, or otherwise use the value of your home, to enable necessary improvements/repairs to be carried out
n/a
8
no
2
yes
1
K7. If the Council provided interest free loans, to repair or improve your home which are repayable would you be interested?
Don’t Know
3
no
2
yes
1
K8. Have you completed any major repairs/improvements to your home within the past 5 years? (costing £500+ and not including decoration)
Don’t Know
3
no
2
yes
1
IF YES... Have you completed any of the following...? IMPROVEMENTS COMPLETED N/A NO YES
a) Installed cavity wall insulation? 8 2 1
b) Installed loft insulation? 8 2 1
c) Installed central heating for first time? 8 2 1
d) Changed existing central heating system? 8 2 1
e) Installed new kitchen? 8 2 1
f) Installed new bathroom? 8 2 1
g) Installed new windows/double glazing? 8 2 1
h) Installed new external doors? 8 2 1
i) Rewired? 8 2 1
j) Added extension/conservatory? 8 2 1
k) Completed external repairs (e.g. roof, gutters) 8 2 1
l) Other 8 2 1
K9 Would you intend to carry out any major repairs/improvements to your home within the next 5 years? (costing £500+ and not including decoration?)
Don’t Know
3
no
2
yes
1
IF YES... Have you completed any of the following...? IMPROVEMENTS INTENDED N/A NO YES
a) Cavity wall insulation? 8 2 1
b) Loft insulation? 8 2 1
c) Install central heating for first time? 8 2 1
d) Change existing central heating system? 8 2 1
e) Install new kitchen? 8 2 1

© David Adamson & Partners Ltd. Private Sector House Condition Survey 2014
Page | 31
K. ADDITIONAL QUESTIONS - OWNER OCCUPIERS ONLY IMPROVEMENTS INTENDED N/A NO YES
f) Install new bathroom? 8 2 1
g) Install new windows/double glazing? 8 2 1
h) Install new external doors? 8 2 1
i) Rewire your property? 8 2 1
j) Add extension/conservatory? 8 2 1
k) Complete external repairs (e.g. roof, gutters) 8 2 1
L. ADDITIONAL QUESTIONS - PRIVATE TENANTS
L1. Is your property accredited by the Council? Don’t know
3
no
2
yes
1
L2. Do you deal with your landlord directly or through a property agent? Don’t know
3
Property agent
2
Landlord direct
1
L3. What is your weekly or monthly rent? (including housing benefit) Weekly? (£) 9999 - unob
Monthly? (£) 9999 - unob
L4. Have you informed your landlord or agent about any outstanding repair issues?
Don’t know
3
no
2
yes
1
L4a. IF YES: Are these issues being addressed?
n/a 8
no
2
yes
1
L5. Do you consider your home to be in a good state of repair?
Don’t know 4
no - poor
3
yes - quite good
2
Yes - very good
1
M. HOUSES IN MULTIPLE OCCUPATION
COMPLETE THIS SECTION FOR ALL DWELLINGS IN MULTIPLE OCCUPATION i.e. occupied by 2 or more unrelated persons
M1. Total number of persons resident at the address...?
n/a 99
specify no: …………….
M2. Total number of households (i.e. unrelated persons) resident at the address?
n/a
99
specify no: …………….
M3. Number of occupied storeys in the dwelling?
5 storey 5
4 storey
4
3 storey
8
2 storey
2
1 storey
1
M4. HMO Type?
hostel 5
shared house/flat
4
bedsit
8
Flat in converted
Blding 2
self-contained
flat 1
M5. Is the property licensable under the Housing Act 2004?
don’t know 3
no
2
yes
1
M6. Means of escape from fire? fire doors not
present 4
fire doors in poor
condition no self closers 3
fire doors seats and
self closers 2
fire doors with seals, closers and upgraded
partitions 1
M6a
Fire Detection
systems
No AFD or smoke detectors
Battery smoke detectors only
Afd in Moe only
Full AFD, with defects
Full working AFD
5 4 3 2 1
M6b. IF AFD PRESENT, WHETHER WORKING OR NOT: Does your landlord regularly test your fire alarm system?
don’t know
3
no
2
yes
1
M6c
Fire fighting equipment present YES No
1 2
M7 Emergency Lighting
Not Present
Defective Working
3 2 1
Amenities None Shared worse than 1:5
Shared up to 1:5 Exclusive use to most lets
Exclusive use to all lets
Present in flat (conversion)
M8 Kitchens 6 5 4 3 2 1

© David Adamson & Partners Ltd. Private Sector House Condition Survey 2014
Page | 32
M. HOUSES IN MULTIPLE OCCUPATION Amenities (continued)
None Shared worse than 1:5
Shared up to 1:5 Exclusive use to most lets
Exclusive use to all lets
Present in flat (conversion)
M9 Wash hand basins 6 5 4 3 2 1
M10 Baths/showers 6 5 4 3 2 1
M11 WC’s 6 5 4 3 2 1
M12
Condition of Amenities
Repair/replace over 50% of amenities
Repair/replace up to 50% of
amenities
Minor disrepair
Satisfactory
4 3 2 1
M13
Management Regulations
Very Poor
Poor Average Good Very Good
5 4 3 2 1
M14
State of disrepair
Unfit Urgent disrepair
Substantial disrepair
Minor disrepair
Satisfactory
5 4 3 2 1
M15 Fitness for Multi- occupation (amenities,
means of escape & other fire precautions)
Unfit amenities and fire
Unfit amenities Unfit fire
Fit amenities and fire
4 3 2 1
M16. Have the electrical installation(s) been tested by a competent person within the last 5 years
don’t know 8
no 2
yes 1
M17. Are there adequate Refuse Storage and Disposal Facilities
Poor
4
adequate
3
good
2
no facilities 1
M18. Are the following Certificates available? Certificate d/k No Yes a) Electrical Testing (IEE or Part P Building Regulations) 3 2 1
b) Fire Detection System 3 2 1
c) Emergency Lighting 3 2 1
d) Portable Appliance Testing 3 2 1
e) Fire Equipment Maintenance 3 2 1
f) CORGI Annual Gas Safety Certificate 3 2 1
g) OFTEC Annual Safety Certificate 3 2 1

David Adamson & Partners Ltd.
APPENDICES
APPENDIX D: THE DECENT HOMES STANDARD
D.1 This appendix gives a detailed definition of the decent homes standard and explains the four
criteria that a decent home is required to meet. These are:
it meets the current statutory minimum standard for housing;
it is in a reasonable state of repair;
it has reasonably modern facilities and services;
it provides a reasonable degree of thermal comfort.
D.2 The decent home definition provides a minimum standard. Landlords and owners doing work
on their properties may well find it appropriate to take the dwellings above this minimum
standard.
Criterion A: the dwelling meets the current statutory minimum standard for housing D.3 MINIMUM STATUTORY STANDARDS: The Housing Act 2004 (Chapter 34) introduces a new
system for assessing housing conditions and enforcing housing standards. The new system
which replaces the former test of fitness for human habitation (Section 604, Housing Act
1985) operates by reference to the existence of Category 1 or Category 2 hazards on
residential premises as assessed within the Housing Health and Safety Rating System
(HHSRS - Version 2). For the purposes of the current survey the presence of Category 1
hazards has been assumed to represent statutory failure. These are hazards falling within
HHSRS Bands A, B or C and accruing hazard scores in excess of 1000 points.
Criterion B: the dwelling is in a reasonable state of repair
D.4 A dwelling satisfies this criterion unless:
one or more key building components are old and, because of their condition,
need replacing or major repair; or
two or more other building components are old and, because of their
condition, need replacement or major repair.
BUILDING COMPONENTS D.5 Building components are the structural parts of a dwelling (eg wall structure, roof structure),
other external elements (eg roof covering, chimneys) and internal services and amenities (eg
kitchens, heating systems).
D.6 Key building components are those which, if in poor condition, could have an immediate
impact on the integrity of the building and cause further deterioration in other components.
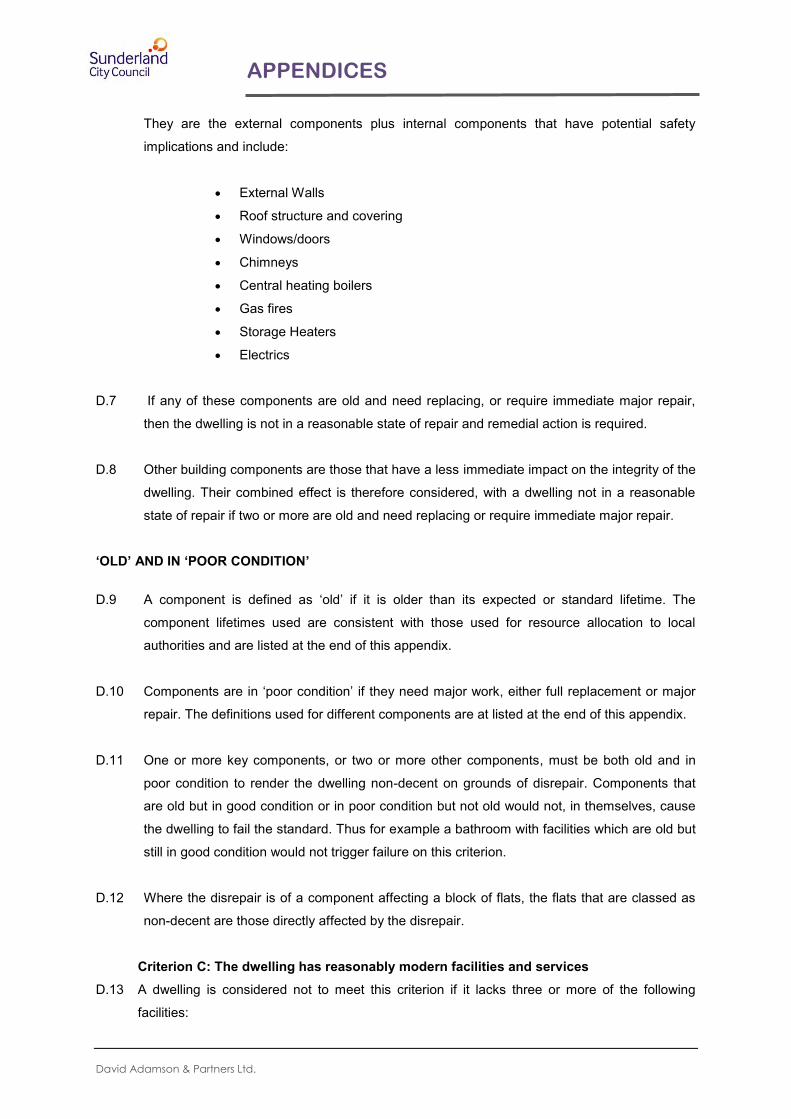
David Adamson & Partners Ltd.
APPENDICES
They are the external components plus internal components that have potential safety
implications and include:
External Walls
Roof structure and covering
Windows/doors
Chimneys
Central heating boilers
Gas fires
Storage Heaters
Electrics
D.7 If any of these components are old and need replacing, or require immediate major repair,
then the dwelling is not in a reasonable state of repair and remedial action is required.
D.8 Other building components are those that have a less immediate impact on the integrity of the
dwelling. Their combined effect is therefore considered, with a dwelling not in a reasonable
state of repair if two or more are old and need replacing or require immediate major repair.
‘OLD’ AND IN ‘POOR CONDITION’
D.9 A component is defined as ‘old’ if it is older than its expected or standard lifetime. The
component lifetimes used are consistent with those used for resource allocation to local
authorities and are listed at the end of this appendix.
D.10 Components are in ‘poor condition’ if they need major work, either full replacement or major
repair. The definitions used for different components are at listed at the end of this appendix.
D.11 One or more key components, or two or more other components, must be both old and in
poor condition to render the dwelling non-decent on grounds of disrepair. Components that
are old but in good condition or in poor condition but not old would not, in themselves, cause
the dwelling to fail the standard. Thus for example a bathroom with facilities which are old but
still in good condition would not trigger failure on this criterion.
D.12 Where the disrepair is of a component affecting a block of flats, the flats that are classed as
non-decent are those directly affected by the disrepair.
Criterion C: The dwelling has reasonably modern facilities and services D.13 A dwelling is considered not to meet this criterion if it lacks three or more of the following
facilities:

David Adamson & Partners Ltd.
APPENDICES
a kitchen which is 20 years old or less;
a kitchen with adequate space and layout;
a bathroom which is 30 years old or less;
an appropriately located bathroom and WC;
adequate sound insulation;
adequate size and layout of common entrance areas for blocks of flats.
D.14 The ages used to define the ‘modern’ kitchen and bathroom are less than those for the
disrepair criterion. This is to take account of the modernity of kitchens and bathrooms, as well
as their functionality and condition.
D.15 There is some flexibility inherent in this criterion, in that a dwelling has to fail on three criteria
before failure of the decent homes standard itself. Such a dwelling does not have to be fully
modernised for this criterion to be passed: it would be sufficient in many cases to deal with
only one or two of the facilities that are contributing to the failure.
D.16 These standards are used to calculate the national standard and have been measured in the
English House Condition Survey (EHCS) for many years. For example, in the EHCS:
a kitchen failing on adequate space and layout would be one that was too
small to contain all the required items (sink, cupboards, cooker space,
worktops etc) appropriate to the size of the dwelling;
an inappropriately located bathroom or WC is one where the main bathroom
or WC is located in a bedroom or accessed through a bedroom (unless the
bedroom is not used or the dwelling is for a single person). A dwelling would
also fail if the main WC is external or located on a different floor to the
nearest wash hand basin, or if a WC without a wash hand basin opens on to
a kitchen in an inappropriate area, for example next to the food preparation
area;
Decent homes – definition : inadequate insulation from external airborne noise would occur
where there are problems with, for example, traffic (rail, road or aeroplanes) or factory noise.
Reasonable insulation from these problems should be ensured through installation of double
glazing; inadequate size and layout of common entrance areas for blocks of flats would occur
where there is insufficient room to manoeuvre easily, for example where there are narrow
access ways with awkward corners and turnings, steep staircases, inadequate landings,
absence of handrails, low headroom etc.

David Adamson & Partners Ltd.
APPENDICES
Criterion D: the dwelling provides a reasonable degree of thermal comfort
D.17 The definition requires a dwelling to have both:
efficient heating; and
effective insulation.
D.18 Under this standard, efficient heating is defined as any gas or oil programmable central heating
or electric storage heaters/programmable solid fuel or LPG central heating or similarly efficient
heating systems. Heating sources which provide less energy efficient options fail the decent
home standard.
D.19 Because of the differences in efficiency between gas/oil heating systems and the other heating
systems listed, the level of insulation that is appropriate also differs:
For dwellings with gas/oil programmable heating, cavity wall insulation (if
there are cavity walls that can be insulated effectively) or at least 50mm loft
insulation (if there is loft space) is an effective package of insulation under
the minimum standard set by the Department of Health;
For dwellings heated by electric storage heaters/programmable solid fuel or
LPG central heating a higher specification of insulation is required to meet
the same standard: at least 200mm of loft insulation (if there is a loft) and
cavity wall insulation (if there are cavity walls that can be insulated
effectively).
Component lifetimes and definition of ‘in poor condition’ used in the national measurement of the
disrepair criterion
COMPONENT LIFETIMES
D.20 Table D.1 shows the predicted lifetimes of various key building components within the
disrepair criterion to assess whether the building components are ‘old’. These are used to
construct the national estimates of the number of dwellings that are decent and those that fail.
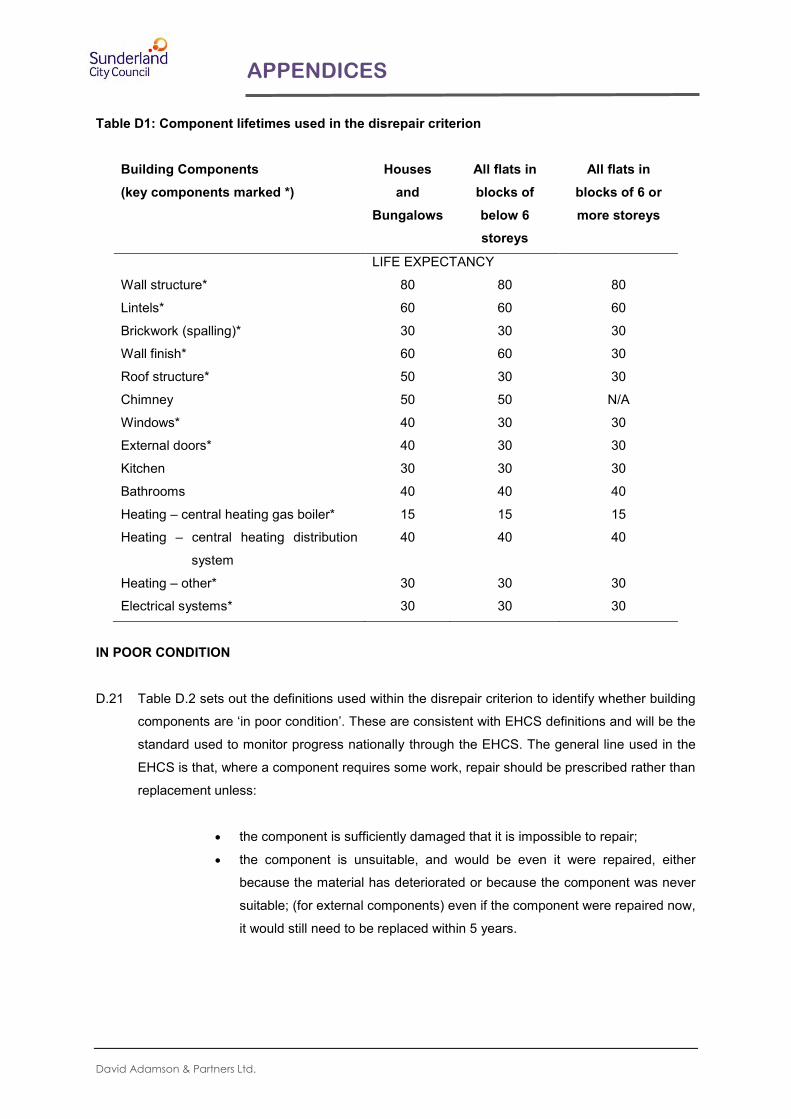
David Adamson & Partners Ltd.
APPENDICES
Table D1: Component lifetimes used in the disrepair criterion
Building Components (key components marked *)
Houses and
Bungalows
All flats in blocks of below 6 storeys
All flats in blocks of 6 or more storeys
LIFE EXPECTANCY
Wall structure* 80 80 80
Lintels* 60 60 60
Brickwork (spalling)* 30 30 30
Wall finish* 60 60 30
Roof structure* 50 30 30
Chimney 50 50 N/A
Windows* 40 30 30
External doors* 40 30 30
Kitchen 30 30 30
Bathrooms 40 40 40
Heating – central heating gas boiler* 15 15 15
Heating – central heating distribution
system 40 40 40
Heating – other* 30 30 30
Electrical systems* 30 30 30
IN POOR CONDITION
D.21 Table D.2 sets out the definitions used within the disrepair criterion to identify whether building
components are ‘in poor condition’. These are consistent with EHCS definitions and will be the
standard used to monitor progress nationally through the EHCS. The general line used in the
EHCS is that, where a component requires some work, repair should be prescribed rather than
replacement unless:
the component is sufficiently damaged that it is impossible to repair;
the component is unsuitable, and would be even it were repaired, either
because the material has deteriorated or because the component was never
suitable; (for external components) even if the component were repaired now,
it would still need to be replaced within 5 years.

David Adamson & Partners Ltd.
APPENDICES
Table D.2: Component Condition used in the disrepair criterion
Building Components (key components marked *)
Houses and Bungalows
Wall structure Replace 10% or more or repair 30% or more
Wall finish Replace/repoint/renew 50% or more
Chimneys 1 chimney needs partial rebuilding or more
Roof Structure Replace 10% or more to strengthen 30% or more
Roof Covering Replace or isolated repairs to 50% or more
Windows Replace at least one window or repair/replace sash or member to
at least two (excluding easing sashes, reglazing painting)
External doors Replace at least one
Kitchen Major repair or replace 3 or more items out of the 6 (cold water
drinking supply, hot water, sink, cooking provision, cupboards)
Bathroom Major repair or replace 2 or more items (bath, wash hand basin)
Electrical System Replace or major repair to system
Central Heating Boiler Replace or major repair
Central Heating
Distribution Replace or major repair
Storage Heating Replace or major repair

David Adamson & Partners Ltd.
APPENDICES
APPENDIX E:
GLOSSARY OF TERMS
AGE/CONSTRUCTION DATE OF DWELLING
The age of the dwelling refers to the date of construction of the oldest part of the building.
ADAPTATION
The installation of an aid or alternation to building design or amenity to assist normal dwelling use by
physically or mentally impaired persons.
BASIC AMENITIES
Dwellings lack basic amenities where they do not have all of the following:
kitchen sink;
bath or shower in a bathroom;
a wash hand basin;
hot and cold water to the above;
inside WC.
BEDROOM STANDARD
The bedroom standard is the same as that used by the General Household Survey, and is calculated
as follows:
a separate bedroom is allocated to each co-habiting couple, any other person
aged 21 or over,
each pair of young persons aged 10-20 of the same sex,
and each pair of children under 10 (regardless of sex);
unpaired young persons aged 10-20 are paired with a child under 10 of the
same sex or, if possible, allocated a separate bedroom;
any remaining unpaired children under 10 are also allocated a separate
bedroom.
The calculated standard for the household is then compared with the actual number of bedrooms
available for its sole use to indicate deficiencies or excesses. Bedrooms include bed-sitters, box
rooms and bedrooms which are identified as such by informants even though they may not be in use
as such.
David Adamson & Partners Ltd.
APPENDICES
CATEGORY 1 HAZARD
A hazard rating score within the HHSRS accruing in excess of 1000 points and falling into Hazard
Bands A, B or C.
DECENT HOMES A decent home is one that satisfies all of the following four criteria:
it meets the current statutory minimum standard for housing.
it is in a reasonable state of repair;
it has reasonably modern facilities and services;
it provides a reasonable degree of thermal comfort.
See Appendix E for further details.
DOUBLE GLAZING This covers factory made sealed window units only. It does not include windows with secondary
glazing or external doors with double or secondary glazing (other than double glazed patio doors
which count as 2 windows).
DWELLING
A dwelling is a self contained unit of accommodation where all rooms and facilities available for the
use of the occupants are behind a front door. For the most part a dwelling will contain one household,
but may contain none (vacant dwelling), or may contain more than one (HMO).
TYPE OF DWELLING
Dwellings are classified, on the basis of the surveyors’ inspection, into the following categories:
terraced house: a house forming part of a block where at least one house is attached to two or more
other houses;
semi-detached house: a house that is attached to one other house;
detached house: a house where none of the habitable structure is joined to another building (other
than garages, outhouses etc.);
bungalow: a house with all of the habitable accommodation is on one floor. This excludes chalet
bungalows and bungalows with habitable loft conversions, which are treated as houses;
purpose built flat, low rise: a flat in a purpose built block less than 6 storeys high. Includes cases
where there is only one flat with independent access in a building which is also used for non-domestic
purposes;
converted flat: a flat resulting from the conversion of a house or former non-residential building.
Includes buildings converted into a flat plus commercial premises (typically corner shops).

David Adamson & Partners Ltd.
APPENDICES
EMPLOYMENT STATUS OF HOH full time employment: working at least 30 hours per week as an employee or as self-employed. It
includes those on government-supported training schemes but excludes any unpaid work;
part-time employment: working less than 30 hours per week as an employee or as self-employed. It
excludes any unpaid work;
retired: fully retired from work i.e. no longer working, even part time. Includes those who have retired
early;
unemployed: includes those registered unemployed and those who are not registered but seeking
work;
other inactive: includes people who have a long term illness or disability and those looking after
family/home;
employed full or part time: as above.
HHSRS
The Housing Health and Safety Rating System (HHSRS) is the Government’s new approach to the
evaluation of the potential risks to health and safety from any deficiencies identified in dwellings. The
HHSRS, although not in itself a standard, has been introduced as a replacement for the Housing
Fitness Standard (Housing Act 1985, Section 604, as amended). Hazard scores are banded to reflect
the relative severity of hazards and their potential outcomes. There are ten hazard bands ranging
from Band J (9 points or less) the safest, to Band A (5000 points or more) the most dangerous. Using
the above bands hazards can be grouped as Category 1 or Category 2. A Category 1 hazard will fall
within Bands A, B and C (1000 points or more); a Category 2 hazard will fall within Bands D or higher
(under 1000 points). HMO
As defined in Section 254 Housing Act 2004, which relates predominantly to bedsits and shared
housing where there is some sharing of facilities by more than one household.
HOUSEHOLD
One person living alone or a group of people who have the address as their only or main residence
and who either share one meal a day or share a living room.
LONG TERM ILLNESS OR DISABILITY
Whether anybody in the household has a long-tern illness or disability. The respondent assesses this
and long-term is defined as anything that has troubled the person, or is likely to affect them, over a
period of time.

David Adamson & Partners Ltd.
APPENDICES
MEANS TESTED BENEFITS (IN RECEIPT OF)
Households where the HOH or partner receives Income Support, income-based Job Seekers
Allowance, Working Families Tax Credit, Disabled Persons Tax Credit or Housing Benefit. Note that
Council Tax Benefit is excluded from this definition.
SAP
The main measure of energy efficiency used in the report is the energy cost rating as determined by
the Government’s Standard Assessment Procedure (SAP). This is an index based on calculated
annual space and water heating costs for a standard heating regime and is expressed on a scale of 1
(highly energy inefficient) to 100 (highly energy efficient).
SECURE WINDOWS AND DOORS
Homes with secure windows and doors have both of the following:
main entrance door is solid or double glazed; the frame is strong; it has an
auto deadlock or standard Yale lock plus mortise lock;
all accessible windows (ground floor windows or upper floor windows in reach
of flat roofs) are double glazed, either with or without key locks.
TENURE
Two categories are used for most reporting purposes:
owner-occupied: includes all households who own their own homes outright or buying them with a
mortgage/loan. Includes intermediate ownership models;
private rented or private tenants: includes all households living in privately owned property which they
do not own. Includes households living rent free, or in tied homes. Includes un-registered housing
associations tenants.
VACANT DWELLINGS
The assessment of whether or not a dwelling was vacant was made at the time of the interviewer’s
visit. Clarification of vacancy was sought from neighbours. Two types of vacant property are used:
transitional vacancies: are those which, under normal market conditions, might be expected to
experience a relatively short period of vacancy before being bought or re-let;
problematic vacancies: are those which remain vacant for long periods or need work before they can
be re-occupied.
Dwellings vacant for up to 1 month are classified as transitional vacancies and those unoccupied for
at least 6 months are treated as problematic vacancies. Dwellings vacant for between 1 and 6 months
can be problematic or transitional depending on whether they are unfit for human habitation and
therefore require repair work prior to being re-occupied.

David Adamson & Partners Ltd.
APPENDICES
VULNERABLE HOUSEHOLDS
Households who are in receipt of the following benefits: Income Support; Income-based Job Seeker’s
Allowance; Housing Benefit; Council Tax Benefit; Working Families Tax Credit; Disabled Person’s Tax
Credit; Disability Living Allowance: Industrial Injuries Disablement Benefit; War Disablement Pension,
Attendance Allowance, Child Tax Credit, Working Tax Credit, Pension Credit.