private sector data for performance management - fhwa operations
TRANSCRIPT

Private Sector Data for Performance Management Final Report July 2011
QUALITY ASSURANCE STATEMENT The U.S. Department of Transportation provides high-quality information to serve Government, industry, and the public in a manner that promotes public understanding. Standards and policies are used to ensure and maximize the quality, objectivity, utility, and integrity of its information. U.S. DOT periodically reviews quality issues and adjusts its programs and processes to ensure continuous quality improvement.
Technical Report Documentation Page
1. Report No.
FHWA-HOP-11-029 2. Government Accession No.
3. Recipient's Catalog No.
4. Title and Subtitle
Private Sector Data for Performance Management – Final Report 5. Report Date
July 2011
6. Performing Organization Code
7. Author(s)
Shawn Turner (TTI), Kaveh Farokhi Sadabadi (UMD), Ali Haghani (UMD), Masoud Hamedi (UMD), Robert Brydia (TTI), Simon Santiago (Nossaman), and Ed Kussy (Nossaman)
8. Performing Organization Report No.
9. Performing Organization Name and Address
Battelle 505 King Avenue Columbus, OH 43201
10. Work Unit No. (TRAIS)
11. Contract or Grant No.
DTFH61-06-D-00007 – Task 600112-37
12. Sponsoring Agency Name and Address
U.S. Department of Transportation Federal Highway Administration 1200 New Jersey Avenue, S.E. Washington, DC 20590
13. Type of Report and Period Covered
14. Sponsoring Agency Code
15. Supplementary Notes
Rich Taylor, COTM 16. Abstract
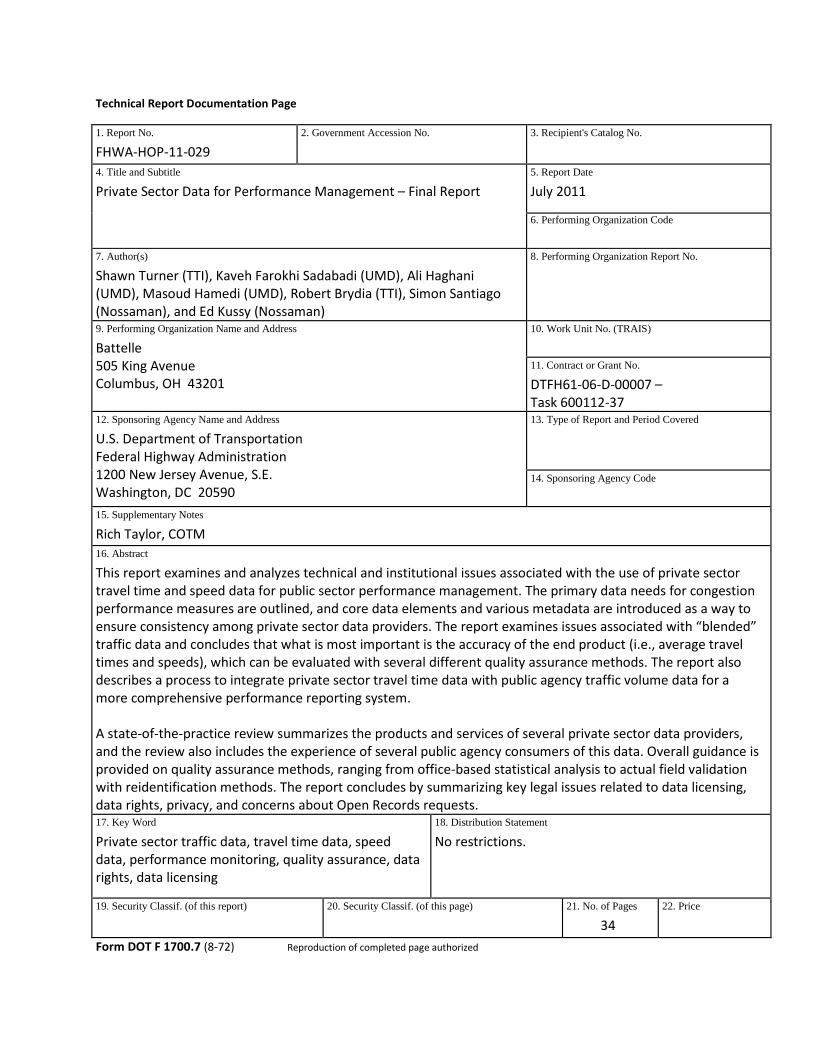
This report examines and analyzes technical and institutional issues associated with the use of private sector travel time and speed data for public sector performance management. The primary data needs for congestion performance measures are outlined, and core data elements and various metadata are introduced as a way to ensure consistency among private sector data providers. The report examines issues associated with “blended” traffic data and concludes that what is most important is the accuracy of the end product (i.e., average travel times and speeds), which can be evaluated with several different quality assurance methods. The report also describes a process to integrate private sector travel time data with public agency traffic volume data for a more comprehensive performance reporting system. A state-of-the-practice review summarizes the products and services of several private sector data providers, and the review also includes the experience of several public agency consumers of this data. Overall guidance is provided on quality assurance methods, ranging from office-based statistical analysis to actual field validation with reidentification methods. The report concludes by summarizing key legal issues related to data licensing, data rights, privacy, and concerns about Open Records requests. 17. Key Word
Private sector traffic data, travel time data, speed data, performance monitoring, quality assurance, data rights, data licensing
18. Distribution Statement
No restrictions.
19. Security Classif. (of this report)
20. Security Classif. (of this page)
21. No. of Pages
34 22. Price
Form DOT F 1700.7 (8-72) Reproduction of completed page authorized

This page intentionally left blank.
iii
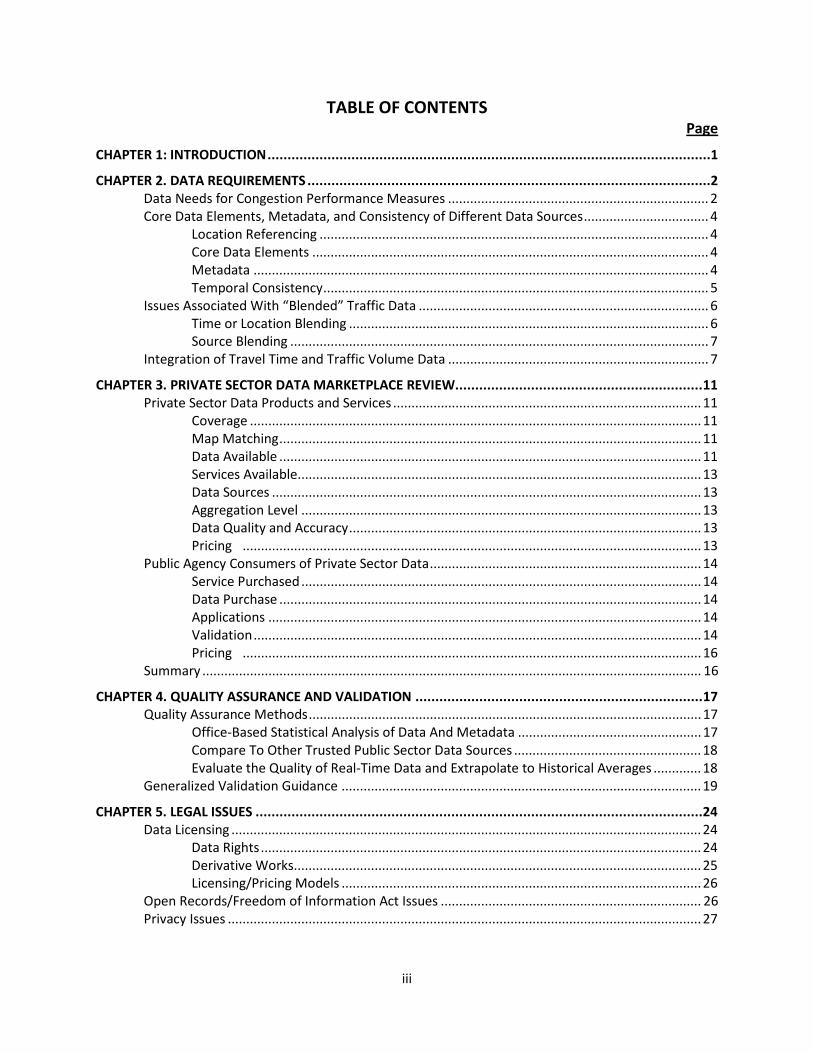
TABLE OF CONTENTS Page
CHAPTER 1: INTRODUCTION ...............................................................................................................1
CHAPTER 2. DATA REQUIREMENTS .....................................................................................................2 Data Needs for Congestion Performance Measures ....................................................................... 2 Core Data Elements, Metadata, and Consistency of Different Data Sources .................................. 4
Location Referencing .......................................................................................................... 4 Core Data Elements ............................................................................................................ 4 Metadata ............................................................................................................................ 4 Temporal Consistency ......................................................................................................... 5
Issues Associated With “Blended” Traffic Data ............................................................................... 6 Time or Location Blending .................................................................................................. 6 Source Blending .................................................................................................................. 7
Integration of Travel Time and Traffic Volume Data ....................................................................... 7
CHAPTER 3. PRIVATE SECTOR DATA MARKETPLACE REVIEW .............................................................. 11 Private Sector Data Products and Services .................................................................................... 11
Coverage ........................................................................................................................... 11 Map Matching ................................................................................................................... 11 Data Available ................................................................................................................... 11 Services Available .............................................................................................................. 13 Data Sources ..................................................................................................................... 13 Aggregation Level ............................................................................................................. 13 Data Quality and Accuracy ................................................................................................ 13 Pricing ............................................................................................................................. 13
Public Agency Consumers of Private Sector Data .......................................................................... 14 Service Purchased ............................................................................................................. 14 Data Purchase ................................................................................................................... 14 Applications ...................................................................................................................... 14 Validation .......................................................................................................................... 14 Pricing ............................................................................................................................. 16
Summary ........................................................................................................................................ 16
CHAPTER 4. QUALITY ASSURANCE AND VALIDATION ........................................................................ 17 Quality Assurance Methods ........................................................................................................... 17
Office-Based Statistical Analysis of Data And Metadata .................................................. 17 Compare To Other Trusted Public Sector Data Sources ................................................... 18 Evaluate the Quality of Real-Time Data and Extrapolate to Historical Averages ............. 18
Generalized Validation Guidance .................................................................................................. 19
CHAPTER 5. LEGAL ISSUES ................................................................................................................ 24 Data Licensing ................................................................................................................................ 24
Data Rights ........................................................................................................................ 24 Derivative Works ............................................................................................................... 25 Licensing/Pricing Models .................................................................................................. 26
Open Records/Freedom of Information Act Issues ....................................................................... 26 Privacy Issues ................................................................................................................................. 27

iv
LIST OF TABLES
Page
Table 1. Summary of Mobility Measures and Data Requirements for National Performance Monitoring Activities .................................................................................................................. 3
Table 2. Summary of Private Sector Data Products and Services .............................................................. 12 Table 3. Summary of Historical Data Consumer Survey Results ................................................................ 15 Table 4. Known Bluetooth Traffic Monitoring System Manufacturer Features in the US Market ............ 21
LIST OF FIGURES Figure 1. Schematic of Data Quality Extrapolation .................................................................................... 19

v
LIST OF ABBREVIATIONS AC alternating current
ATRI American Transportation Research Institute
DC direct current
DOT Department of Transportation
EPA Environmental Protection Agency
FC functional class
FHWA Federal Highway Administration
FOIA Freedom of Information Act
GIS geographic information system
GPS global positioning system
HPMS Highway Performance Monitoring System
ITIP Intelligent Transportation Infrastructure Program
ITS Intelligent Transportation System
MPH miles per hour
NTOC National Transportation Operations Coalition
TMC traffic message channel
TT travel time
TTI Texas Transportation Institute
USDOT United States Department of Transportation
UTC coordinated universal time
VMT vehicle-miles traveled

vi
This page intentionally left blank.
1
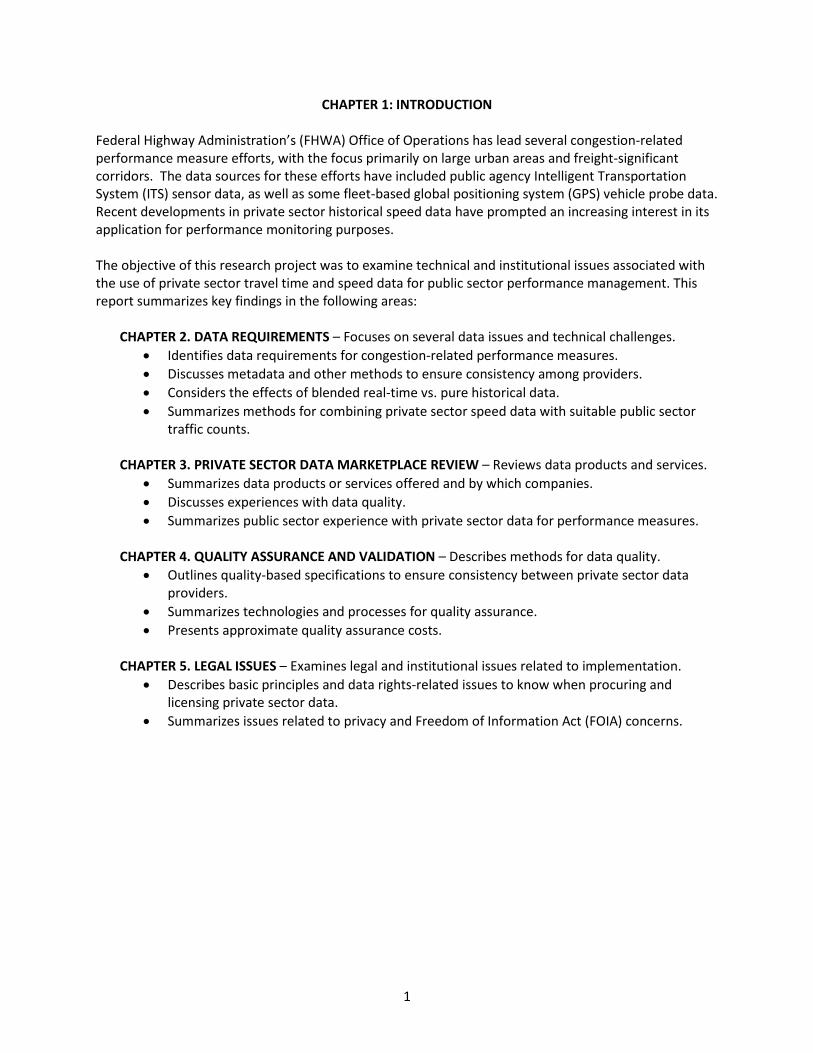
CHAPTER 1: INTRODUCTION Federal Highway Administration’s (FHWA) Office of Operations has lead several congestion-related performance measure efforts, with the focus primarily on large urban areas and freight-significant corridors. The data sources for these efforts have included public agency Intelligent Transportation System (ITS) sensor data, as well as some fleet-based global positioning system (GPS) vehicle probe data. Recent developments in private sector historical speed data have prompted an increasing interest in its application for performance monitoring purposes. The objective of this research project was to examine technical and institutional issues associated with the use of private sector travel time and speed data for public sector performance management. This report summarizes key findings in the following areas:
CHAPTER 2. DATA REQUIREMENTS – Focuses on several data issues and technical challenges. • Identifies data requirements for congestion-related performance measures. • Discusses metadata and other methods to ensure consistency among providers. • Considers the effects of blended real-time vs. pure historical data. • Summarizes methods for combining private sector speed data with suitable public sector
traffic counts.
CHAPTER 3. PRIVATE SECTOR DATA MARKETPLACE REVIEW – Reviews data products and services. • Summarizes data products or services offered and by which companies. • Discusses experiences with data quality. • Summarizes public sector experience with private sector data for performance measures.
CHAPTER 4. QUALITY ASSURANCE AND VALIDATION – Describes methods for data quality.
• Outlines quality-based specifications to ensure consistency between private sector data providers.
• Summarizes technologies and processes for quality assurance. • Presents approximate quality assurance costs.
CHAPTER 5. LEGAL ISSUES – Examines legal and institutional issues related to implementation.
• Describes basic principles and data rights-related issues to know when procuring and licensing private sector data.
• Summarizes issues related to privacy and Freedom of Information Act (FOIA) concerns.

2
CHAPTER 2. DATA REQUIREMENTS Data Needs for Congestion Performance Measures Several reports1,2,3
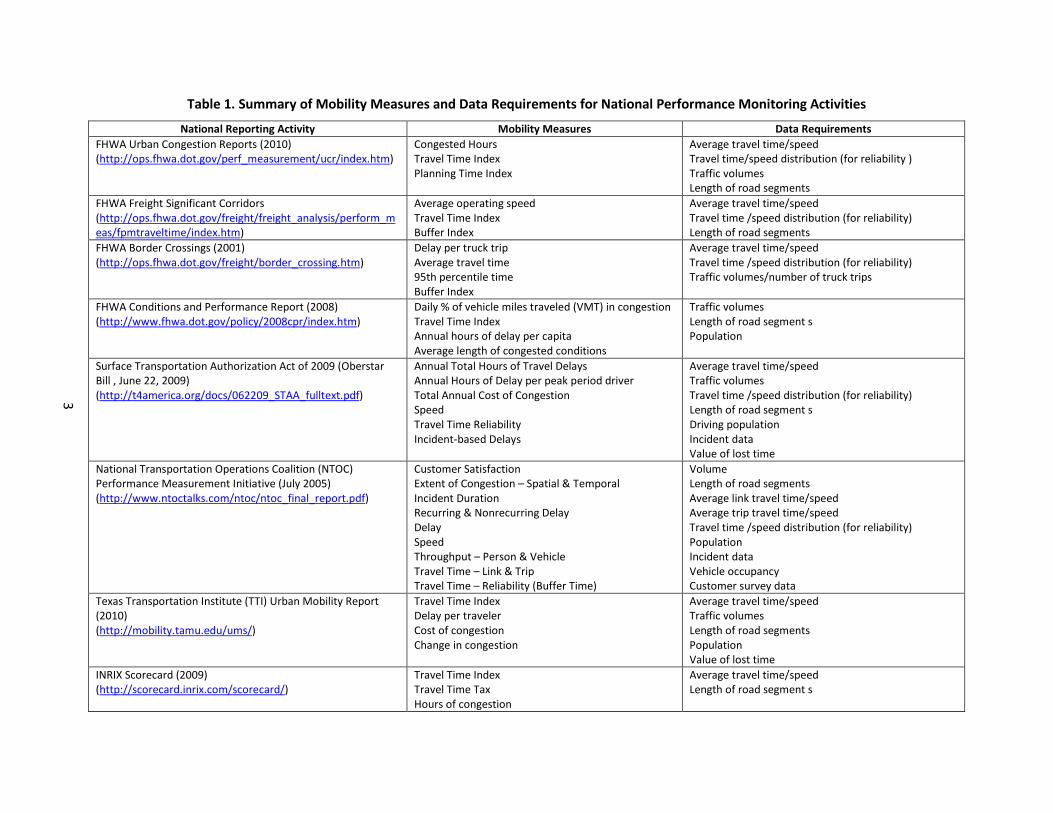
have cataloged numerous performance measures that could be used for congestion monitoring. Rather than reprint all of the tables from these reports, Table 1 documents the congestion performance measures that are currently being used or have been recommended in several major national performance monitoring activities.
Based on Table 1, there are three basic data requirements for congestion performance measures:
1. Average travel time and speed data are used in nearly all reviewed monitoring activities, with a preference for direct measurement when possible. In the one program activity where it is not used, traffic volumes are used to estimate travel time-based measures. Also, several program activities use day-to-day travel time/speed data distributions for travel reliability measures.
2. Traffic volumes are used in most monitoring activities to either calculate delay measures or for weighting purposes in averaging travel time/speed data across different roadways and time periods.
3. Length of road segments is used for several supporting calculations, including calculation of travel times from link speeds as well as in vehicle-miles or person-miles of travel.
There are other parameters (e.g., driving population, value of lost time, congestion thresholds, lane-miles, etc.) that may be necessary for certain performance measures, but these parameters have typically been derived or adapted from existing resources or datasets. Travel time/speed, traffic volumes, and road segment length are the three primary variables that are required for all roads being monitored. Until recently, these three data elements were not universally available on all roadways of interest, so sampling and estimation were used to develop a representative nationwide estimate. Currently, only planning-level traffic volumes (e.g., annual average daily traffic, AADT) are available on a national basis, whereas more detailed day-to-day traffic volumes would be preferred. The data requirements summarized thus far relate to monitoring. Performance management involves making decisions and/or taking actions based on performance results, and effective performance management actions cannot be undertaken without understanding why performance is improving or declining. For example, performance measures can tell you that congestion has increased within the past year, but to take action requires understanding WHY congestion increased. Was it increased traffic demand? Was it an increase in the number of incidents, or an increase in incident clearance times? Have the traffic management actions been effective at reducing congestion, and if not, why not? Effective performance management, then, requires other supporting data related to management actions and other external factors (like traffic growth or development).
1 Guide to Effective Freeway Performance Measurement, NCHRP Research Results Digest 312, http://onlinepubs.trb.org/onlinepubs/nchrp/nchrp_rrd_312.pdf, accessed June 27, 2011. 2 Guide to Effective Freeway Performance Measurement, NCHRP Web-Only Document 97, http://onlinepubs.trb.org/onlinepubs/nchrp/nchrp_w97.pdf, accessed June 27, 2011. 3 Performance Measures of Operational Effectiveness for Highway Segments and Systems, NCHRP Synthesis 311, http://onlinepubs.trb.org/onlinepubs/nchrp/nchrp_syn_311.pdf, accessed June 27, 2011.
3
Table 1. Summary of Mobility Measures and Data Requirements for National Performance Monitoring Activities
National Reporting Activity Mobility Measures Data Requirements FHWA Urban Congestion Reports (2010) (http://ops.fhwa.dot.gov/perf_measurement/ucr/index.htm)
Congested Hours Travel Time Index Planning Time Index
Average travel time/speed Travel time/speed distribution (for reliability ) Traffic volumes Length of road segments
FHWA Freight Significant Corridors (http://ops.fhwa.dot.gov/freight/freight_analysis/perform_meas/fpmtraveltime/index.htm)
Average operating speed Travel Time Index Buffer Index
Average travel time/speed Travel time /speed distribution (for reliability) Length of road segments
FHWA Border Crossings (2001) (http://ops.fhwa.dot.gov/freight/border_crossing.htm)
Delay per truck trip Average travel time 95th percentile time Buffer Index
Average travel time/speed Travel time /speed distribution (for reliability) Traffic volumes/number of truck trips
FHWA Conditions and Performance Report (2008) (http://www.fhwa.dot.gov/policy/2008cpr/index.htm)
Daily % of vehicle miles traveled (VMT) in congestion Travel Time Index Annual hours of delay per capita Average length of congested conditions
Traffic volumes Length of road segment s Population
Surface Transportation Authorization Act of 2009 (Oberstar Bill , June 22, 2009) (http://t4america.org/docs/062209_STAA_fulltext.pdf)
Annual Total Hours of Travel Delays Annual Hours of Delay per peak period driver Total Annual Cost of Congestion Speed Travel Time Reliability Incident-based Delays
Average travel time/speed Traffic volumes Travel time /speed distribution (for reliability) Length of road segment s Driving population Incident data Value of lost time
National Transportation Operations Coalition (NTOC) Performance Measurement Initiative (July 2005) (http://www.ntoctalks.com/ntoc/ntoc_final_report.pdf)
Customer Satisfaction Extent of Congestion – Spatial & Temporal Incident Duration Recurring & Nonrecurring Delay Delay Speed Throughput – Person & Vehicle Travel Time – Link & Trip Travel Time – Reliability (Buffer Time)
Volume Length of road segments Average link travel time/speed Average trip travel time/speed Travel time /speed distribution (for reliability) Population Incident data Vehicle occupancy Customer survey data
Texas Transportation Institute (TTI) Urban Mobility Report (2010) (http://mobility.tamu.edu/ums/)
Travel Time Index Delay per traveler Cost of congestion Change in congestion
Average travel time/speed Traffic volumes Length of road segments Population Value of lost time
INRIX Scorecard (2009) (http://scorecard.inrix.com/scorecard/)
Travel Time Index Travel Time Tax Hours of congestion
Average travel time/speed Length of road segment s
4
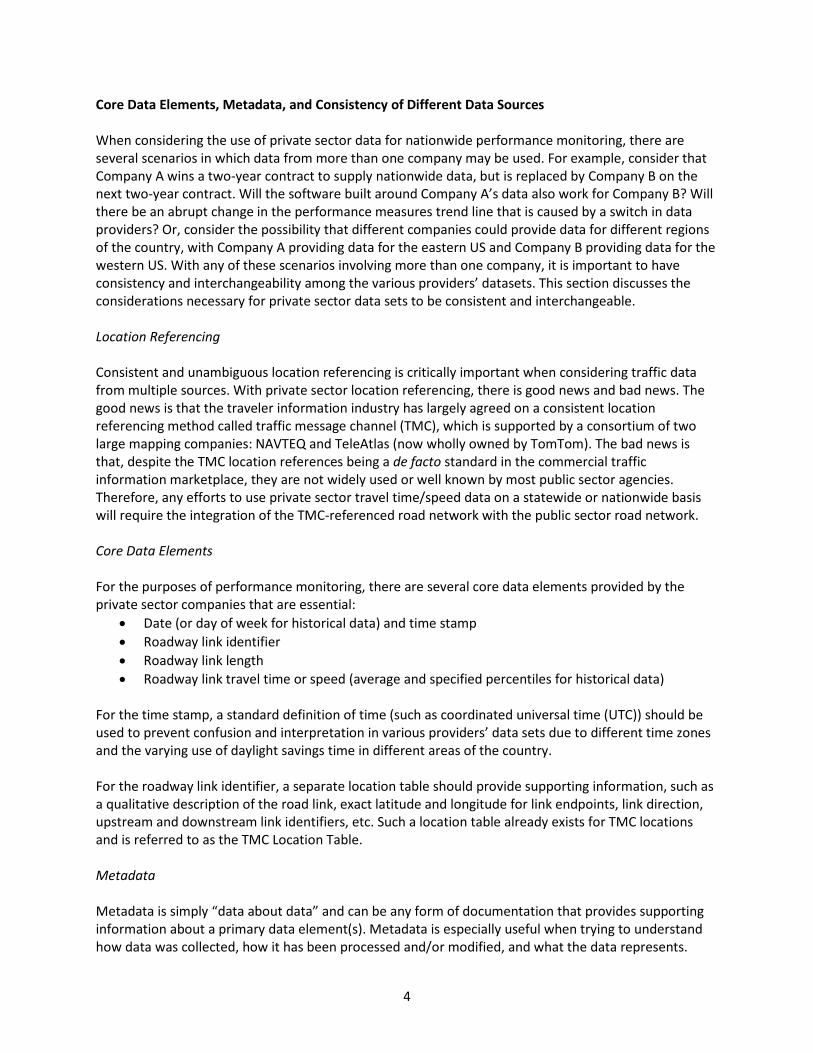
Core Data Elements, Metadata, and Consistency of Different Data Sources When considering the use of private sector data for nationwide performance monitoring, there are several scenarios in which data from more than one company may be used. For example, consider that Company A wins a two-year contract to supply nationwide data, but is replaced by Company B on the next two-year contract. Will the software built around Company A’s data also work for Company B? Will there be an abrupt change in the performance measures trend line that is caused by a switch in data providers? Or, consider the possibility that different companies could provide data for different regions of the country, with Company A providing data for the eastern US and Company B providing data for the western US. With any of these scenarios involving more than one company, it is important to have consistency and interchangeability among the various providers’ datasets. This section discusses the considerations necessary for private sector data sets to be consistent and interchangeable. Location Referencing Consistent and unambiguous location referencing is critically important when considering traffic data from multiple sources. With private sector location referencing, there is good news and bad news. The good news is that the traveler information industry has largely agreed on a consistent location referencing method called traffic message channel (TMC), which is supported by a consortium of two large mapping companies: NAVTEQ and TeleAtlas (now wholly owned by TomTom). The bad news is that, despite the TMC location references being a de facto standard in the commercial traffic information marketplace, they are not widely used or well known by most public sector agencies. Therefore, any efforts to use private sector travel time/speed data on a statewide or nationwide basis will require the integration of the TMC-referenced road network with the public sector road network. Core Data Elements For the purposes of performance monitoring, there are several core data elements provided by the private sector companies that are essential:
• Date (or day of week for historical data) and time stamp • Roadway link identifier • Roadway link length • Roadway link travel time or speed (average and specified percentiles for historical data)
For the time stamp, a standard definition of time (such as coordinated universal time (UTC)) should be used to prevent confusion and interpretation in various providers’ data sets due to different time zones and the varying use of daylight savings time in different areas of the country. For the roadway link identifier, a separate location table should provide supporting information, such as a qualitative description of the road link, exact latitude and longitude for link endpoints, link direction, upstream and downstream link identifiers, etc. Such a location table already exists for TMC locations and is referred to as the TMC Location Table. Metadata Metadata is simply “data about data” and can be any form of documentation that provides supporting information about a primary data element(s). Metadata is especially useful when trying to understand how data was collected, how it has been processed and/or modified, and what the data represents.

5
Metadata can be static for an entire dataset (such as documentation on the blending algorithm used) or it can be dynamic and reported at the individual record level (such as a record-level quality indicator). Although metadata may not be absolutely essential, it can substantially improve the ease of data integration and application development. Therefore, it is important to outline the metadata elements that would be preferred when using private sector data for performance monitoring. The following metadata elements are all data quality indicators and would be useful:
• Vehicle probe sample size – The number of vehicle probes that were used in the calculation of a travel time or speed estimate. Typically, sample size is considered to be an indicator of data quality. However, with some probe vehicle types, the sample size may not be the best indicator of data quality.
• Vehicle probe standard deviation – The standard deviation among the vehicle probes that were
used in the calculation of a travel time or speed estimate. When both the sample size and standard deviation are provided, a standard error and confidence interval can be estimated. This is a surrogate indicator of data quality, because in some situations the standard deviation may be more influenced by the variability of free-flow traffic (in which drivers can select their own speed) than by variability among a limited number of samples.
• Confidence interval or indicator – In lieu of providing sample size and standard deviation, the
data provider could choose to calculate a statistical confidence interval internally and provide that in record-level metadata. Or, a generalized confidence indicator (say on a scale of 1 to 10) could be used to indicate relative quality levels.
• Blending indicator or ratio – A blending indicator is a binary value (YES or NO) that indicates
whether a travel time or speed estimate is blended. A blending ratio is a quantitative value (e.g., 50%) that quantifies the proportion of historical vs. real-time data in the travel time or speed estimate. Similarly, the blending ratio could also quantify the proportion of data points from public agency fixed-point sensors vs. data points from probe vehicles. Both metadata could be used to filter out those data values that have unacceptable levels of blending. For monitoring purposes, the key would be to avoid a blend of data from different years.
Temporal Consistency For monitoring mobility and reliability trends over multiple years, there will need to be consistency in the datasets used for nationwide performance monitoring. This concern about consistency and comparability is not unique to private sector data for performance monitoring and has been addressed in other national data programs through the development of statistically-based data collection and reporting guidelines, best practices, and in some cases, data quality standards. There are proven technical means (such as standardized data dictionaries and exchange formats) to ensure consistency among several different data providers. Similarly, core data elements and preferred metadata can be defined to make data integration less difficult. However, the temporal (i.e., time) consistency issue for trend data remains an issue even with data standardization. One approach to address time consistency for trend data is to ensure that every data provider meets certain accuracy and other data quality requirements. If each data provider meets those specified

6
accuracy targets, then fluctuation between different companies’ datasets will be less likely. The same quality assurance principle applies for addressing data blending (discussed in the next section): as long as all data providers meet specified data quality requirements, public sector agencies should be able to choose among data providers for the best value. One approach would be to consider purchasing traffic data the same way that concrete or reinforcing steel is purchased from private companies - designate certain quality requirements, test randomly, and only pay for or use that data (or material) that meets quality requirements. Another approach to address time consistency is as follows: if a new data provider wins a procurement contract, they must provide a “calibration dataset” from 2 or 3 previous years. This calibration dataset is then compared to the previous data provider for the overlapping years, and adjustments are made as necessary to ensure smooth trend lines. This approach was used in the 2010 Urban Mobility Report, which combined 2007 to 2009 INRIX data with 1982 to 2008 FHWA Highway Performance Monitoring System (HPMS) data. In this case, the overlapping years of 2007 and 2008 were used to adjust the FHWA HPMS trend line to match the 2007 to 2009 INRIX trend line. Finally, the Section 1201 (CFR 23 Part 511) traveler information requirements are a very important foundation for establishing consistency and comparability, in that they establish national standards for real-time travel time accuracy in major metropolitan areas. Once these real-time data are archived, the resulting data archives will have at least the accuracy of the original real-time source data. That is a fundamental principle also included in the U.S. Department of Transportation’s (USDOT) Data Capture and Management Program. Issues Associated With “Blended” Traffic Data A common practice among private sector traffic data providers is to combine several different data sources and/or data types with proprietary algorithms to produce an estimate of current, up-to-date traffic conditions. This practice is referred to as “blending” or “fusion” and typically each company has their own data blending or data fusion algorithm. In this section, we discuss the possible effects that two types of blending may have on the use of private sector traffic data for performance monitoring:
1. Time or location blending: mixes average historical conditions (time blending) or nearby locations (location blending) with stale “real-time” data (e.g., from the past hour).
2. Source blending: mixes private sector (typically probe-based) data with public agency (typically fixed-point sensor) data.
Ultimately, the best way to determine and control the effects of blending is a quality assurance program (see Chapter 4) that ensures that the blended real-time estimates do not exceed some specified level of error acceptable for performance management. Time or Location Blending When considering the possible effects of time or location blending, it is useful to differentiate between performance measures based on historical averages (such as travel time index or delay) and performance measures based on distributions (reliability measures such as the planning time index that use percentiles or variation). As a measure of central tendency, a sample mean (i.e., historical average) is more statistically stable than a specified percentile in situations with low sample size and high variability. What this means is as follows: time or location blending is more likely to affect reliability performance measures than measures based on historical averages. The extent to which reliability

7
performance measures are affected is difficult to know without conducting experimental analyses with blended and non-blended data. Source Blending There is some data source blending that may be unavoidable (and not necessarily detrimental) with private sector vehicle probe data, and that is the blending of different types of vehicle probes. For example, several data providers obtain their real-time vehicle probe data from GPS-equipped commercial fleet vehicles, which could include long-haul freight trucks, package delivery vans, taxi vehicles, construction vehicles, utility/cable/phone service vehicles, etc. Commuter probe vehicles are also becoming more common with the uptake of GPS-equipped smart phones, personal navigation devices, and other mobile consumer devices. Some of these vehicle types have different operating characteristics in traffic, so when sample sizes are small, it is more likely to have a biased estimate of average speed or travel time. When sample sizes are large, it is more likely that different vehicle types will be proportionally represented in the average speed, resulting in less bias. Again, this blending of different probe vehicle types of probe vehicles is unavoidable because, at least in the near future, only a sample of all vehicles will be capable of being monitored. The other type of source blending occurs when vehicle probe data is combined with fixed-point sensor data. Depending upon the blending algorithm, the fixed-point sensor data may be given more weight than a small number of vehicle probes (using the rationale that a fixed-point sensor measures the speed of all vehicles, rather than just a few samples with vehicle probes). However, it is important to recognize that fixed-point sensors measure the speed of all vehicles at a single point, which may not accurately represent the traffic conditions on other parts of the road link. Even if a vehicle probe reports an instantaneous speed at a single point in time, the vehicle probe reports are likely to be randomly distributed over the length of the road link, rather than at one stationary location like a fixed-point sensor, or one type of location, like adjacent to an entrance ramp meter. The extent to which blending vehicle probe data with fixed-point sensor data affects the accuracy of travel times and speeds is difficult to know without conducting experimental analyses with blended and non-blended data. It may be possible to specify in a procurement of historical data that fixed-point sensor data (public or private) not be blended with vehicle probe data in the calculation of summary statistics. There is currently at least one private sector data provider that already provides this option of not including public sector fixed-point sensor data in the calculation of historical summary statistics. Integration of Travel Time and Traffic Volume Data The selection of the best travel time and traffic volume data sources for congestion monitoring depends on the application scale and context. For example, is the performance monitoring program nationwide in scale for all major roads (freeways and arterial streets)? If so, then the most comprehensive source for travel time data appears to be the private sector, whereas the most comprehensive source for traffic volume data will be the HPMS database or a compilation of state Department of Transportation (DOT) databases. Now consider the example of a congestion monitoring program at the urban area level where an extensive network of operations-based fixed-point sensors operates on the freeway system. In this example, it could be that the public agency’s freeway sensors are the most cost-effective dataset and

8
could be supplemented on the arterial streets by private sector travel time data. Again, it depends on the application scale and context, as well as the quality of existing datasets. Once the best source(s) of travel time and traffic volume data have been identified and gathered, the geospatial integration of this data will most likely be necessary. In simple terms, that means combining data sets from different sources so that a travel time/speed and traffic volume is assigned to all roadway links. The combining of data sets, called conflation, is made more difficult by the fact that different data sources will likely have different roadway segmentation. One of several considerations that will have to be addressed during the geographic information systems (GIS) conflation process is the roadway segmentation that will serve as the basis for the monitoring program. This could be the segmentation associated with the travel time dataset, the traffic volume dataset, or an entirely new segmentation defined specifically for performance monitoring. The choice of base segmentation depends on the application context and the particular datasets being conflated, so it is difficult to provide prescriptive guidance. However, the GIS analysis and reporting framework should allow for the base segmentation to be aggregated to several different levels of reporting, such as link, directional route, corridor (both directions combined), functional classes, subarea or relevant sub-jurisdictions, regional, and statewide. Another consideration after spatial conflation is the temporal harmonization for datasets from different data sources. For example, the private sector travel time data could be provided as 15-minute averages for each day of the week for directional links, whereas the traffic volume data could be provided as an average daily count for both travel directions combined. In this example, 15-minute estimates of directional traffic volume should be estimated to match the travel times. Through several previous efforts4,5, TTI researchers have developed an analytical process of estimating sub-daily traffic volumes to match the temporal resolution of private sector speed data. This analytical process was applied at the national level for TTI’s 2010 Urban Mobility Report, which combined private sector travel time data with HPMS traffic volumes.6
Similar procedures could be used by state or local agencies with their detailed datasets.
1) Conflation. In GIS, establish the segmentation relationships (e.g., “crosswalk table”) between the public agency roadway network and the private sector’s roadway network (referred to as the traffic message channel, or TMC, network). This process is known as conflation, and the result is that speeds and traffic volumes are available for all roadway links.
2) Sub-daily volume estimation. Estimate 15-minute or hourly traffic volumes from the public
agency traffic count data. This enables each average traffic speed value to have a corresponding traffic count estimate.
3) Establish free-flow travel speed. Estimate the free-flow speed using speed data from low
volume time periods. In most efforts, the free-flow is calculated as the 85th percentile speed during off-peak periods.
4 See http://utcm.tamu.edu/publications/final_reports/Lomax_09-17-09.pdf, accessed June 27, 2011. 5 See http://apps.dot.state.tx.us/apps/rider56/list.htm, accessed June 27, 2011. 6 See http://mobility.tamu.edu/ums/, accessed June 27, 2011.

9
4) Calculate congestion performance measures. The calculation of performance measures is straightforward once the TMC roadway network is matched with the public agency network in GIS.

11
CHAPTER 3. PRIVATE SECTOR DATA MARKETPLACE REVIEW A state-of-the-practice review was conducted to gather information on:
• Products and services offered by private sector data providers. • Public sector agency uses of the private sector data products and services.
Private Sector Data Products and Services To gather information, survey questions were prepared and supplied to participants prior to a scheduled telephone call. The private sector data providers that participated were:
1. AirSage 2. American Trucking Research Institute (ATRI) 3. INRIX 4. NAVTEQ 5. TomTom 6. TrafficCast
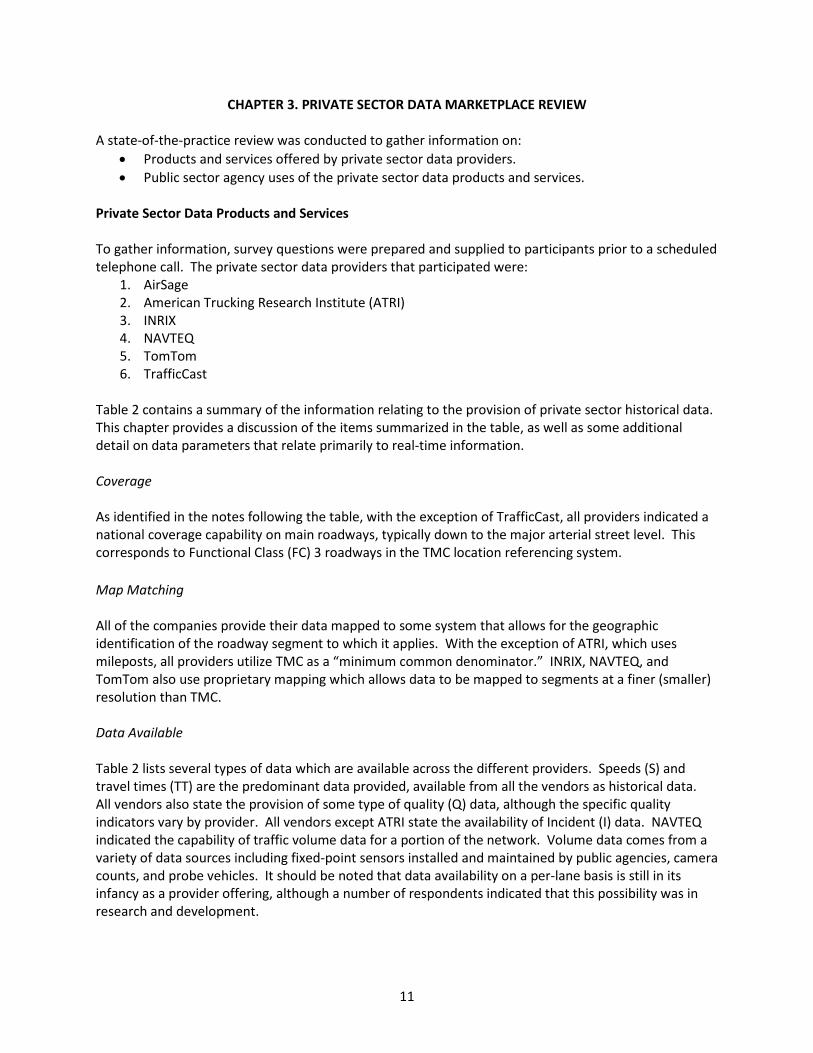
Table 2 contains a summary of the information relating to the provision of private sector historical data. This chapter provides a discussion of the items summarized in the table, as well as some additional detail on data parameters that relate primarily to real-time information. Coverage As identified in the notes following the table, with the exception of TrafficCast, all providers indicated a national coverage capability on main roadways, typically down to the major arterial street level. This corresponds to Functional Class (FC) 3 roadways in the TMC location referencing system. Map Matching All of the companies provide their data mapped to some system that allows for the geographic identification of the roadway segment to which it applies. With the exception of ATRI, which uses mileposts, all providers utilize TMC as a “minimum common denominator.” INRIX, NAVTEQ, and TomTom also use proprietary mapping which allows data to be mapped to segments at a finer (smaller) resolution than TMC. Data Available Table 2 lists several types of data which are available across the different providers. Speeds (S) and travel times (TT) are the predominant data provided, available from all the vendors as historical data. All vendors also state the provision of some type of quality (Q) data, although the specific quality indicators vary by provider. All vendors except ATRI state the availability of Incident (I) data. NAVTEQ indicated the capability of traffic volume data for a portion of the network. Volume data comes from a variety of data sources including fixed-point sensors installed and maintained by public agencies, camera counts, and probe vehicles. It should be noted that data availability on a per-lane basis is still in its infancy as a provider offering, although a number of respondents indicated that this possibility was in research and development.

12
Table 2. Summary of Private Sector Data Products and Services
Airsage ATRI INRIX NAVTEQ TomTom TrafficCast Data Available (a) S, TT, I, Q S, TT, Q S, TT, I, Q S, TT, I, Q, V
(portion of network)
S, TT, I, Q S, TT, I, Q
Services Available (b) D, A, PM D, A, PM D, A D, A D, A, PM D, PM Data Source (c)(d) Cell phone, 911,
traffic counts GPS on commercial truck-only fleets
State installed sensors, commercial fleets, consumer GPS
State installed sensors, commercial fleets, consumer GPS.
Consumer GPS, Fleet GPS
State installed sensors, commercial fleets, consumer GPS, Bluetooth systems.
Aggregation Levels for Historical Usage
None; as captured 1 mile, 1 minute 15 -60 minutes 15 minutes 1 hour 15 minutes
Accuracy Checks Performed
Visual camera count, Probe vehicles.
Anomaly checking done, routines not disclosed.
Independently verified in large-scale testing.
Data checks prior to map matching. Comprehensive drive testing.
Data checks prior to map matching.
Simple-adjacent points compared, some clients doing accuracy checks.
Documented Quality Levels
None provided. Stated they meet Section 511 requirements.
None-burden is on receiver of data.
Accuracy above 95% Availability above 99.9
None provided. None provided. Stated they can meet Section 511 requirements.
None provided. Stated they can meet Section 511 requirements.
Pricing Specific pricing information not provided.
Specific pricing information not provided. Not for profit.
Full use open licensing is $800 per mile per year plus $200 per mile one-time setup fee. 25% discount on other roads purchased in conjunction.
Specific pricing information not provided.
Specific pricing information not provided.
Specific pricing information not provided.
NOTES: (a) Data Available: “S”=Speed, “TT”=Travel Time, “I”=Incidents, “Q”=Quality, “V”=Volumes (b) Services Available: “D”=Discrete Data (individual data points), “A”=Aggregate Data”, “PM”=Performance Measures (c) National Coverage: Not listed in table. All providers indicated national coverage, except TrafficCast which is currently in urban areas (d) Map Matching: Not listed in table. All providers except ATRI indicated a minimum use of TMC. ATRI uses mileposts. INRIX, NAVTEQ and TomTom
also use proprietary segmentation more detailed than TMC.
13
Services Available Table 2 identifies a service of “D” for discrete data, which means each individual (discrete) data point passing a segment within a timeframe. When purchasing discrete data, a consumer would get all of the individual speed or travel time points within a section, within a timeframe, whereas they would only get one value under the purchase of aggregate data. Data Sources Providers are using an expansive range of data sources including GPS data from fleet vehicles, commercial devices, cell phone applications, fixed sensors installed and maintained by other agencies, fixed sensors installed and maintained by the data provider, and cell phone location. Each provider that responded essentially had a unique (to some degree) set of data sources. While there was some overlap, no responding provider utilized exactly the same data model as another provider. Aggregation Level The predominant service offering is refined or aggregated data. Aggregate data are available from all of the responding providers on a historical basis. What is different across the providers is the level of aggregation. ATRI provides the smallest level of aggregation, at 1 mile or 1-minute. Other providers vary from 15 to 60 minutes. In part, the differences are due to the wide variety of data sources. Data Quality and Accuracy Most providers did not disclose specific quality evaluation results or quality assurance algorithms. With the exception of ATRI which stated that none are performed, TrafficCast did state that a part of their general methodology included simple adjacent point comparison routines but also stated that more sophisticated methods were employed. INRIX, in part due to the comparisons performed by the I-95 Corridor Coalition, stated that their data has been verified in large-scale client testing. INRIX explicitly stated the capability of meeting an availability of more than 99.9 percent and an accuracy of greater than 95 percent. While it applies to the real-time data aspect, all providers were also asked about their awareness of, and capability to meet, the information delivery requirements in the FHWA’s Section 1201 Final Rule. Providers were aware of the requirements and expressed no concern over meeting them. With the exception of ATRI, the data parameters for accuracy and availability would appear to exceed the FHWA rule-making requirements. Pricing In general, the availability of pricing information was minimal. Most providers appear to negotiate each purchase individually. Pricing is tied to the usage of the data. If data are used for a single application, one price point is employed. If data are used for multiple applications, other price points are utilized. Providers also make a distinction between uses, such as modeling or O-D studies, and derivative products, such as summaries distributed to external sources. While the various price points were not disclosed, all providers stated they exist. The INRIX pricing provided in Table 2 is the complete package pricing for real-time data with multiple-use ability of the historical data. Reduced requirements and uses would result in lower price points.
14
Public Agency Consumers of Private Sector Data Table 3 summarizes the information for the public agency consumers of private sector data. The public agencies included in this summary are:
1. Wisconsin Department of Transportation 2. Houston-Galveston Area Council 3. Michigan Department of Transportation 4. Texas Department of Transportation 5. Maricopa Association of Governments
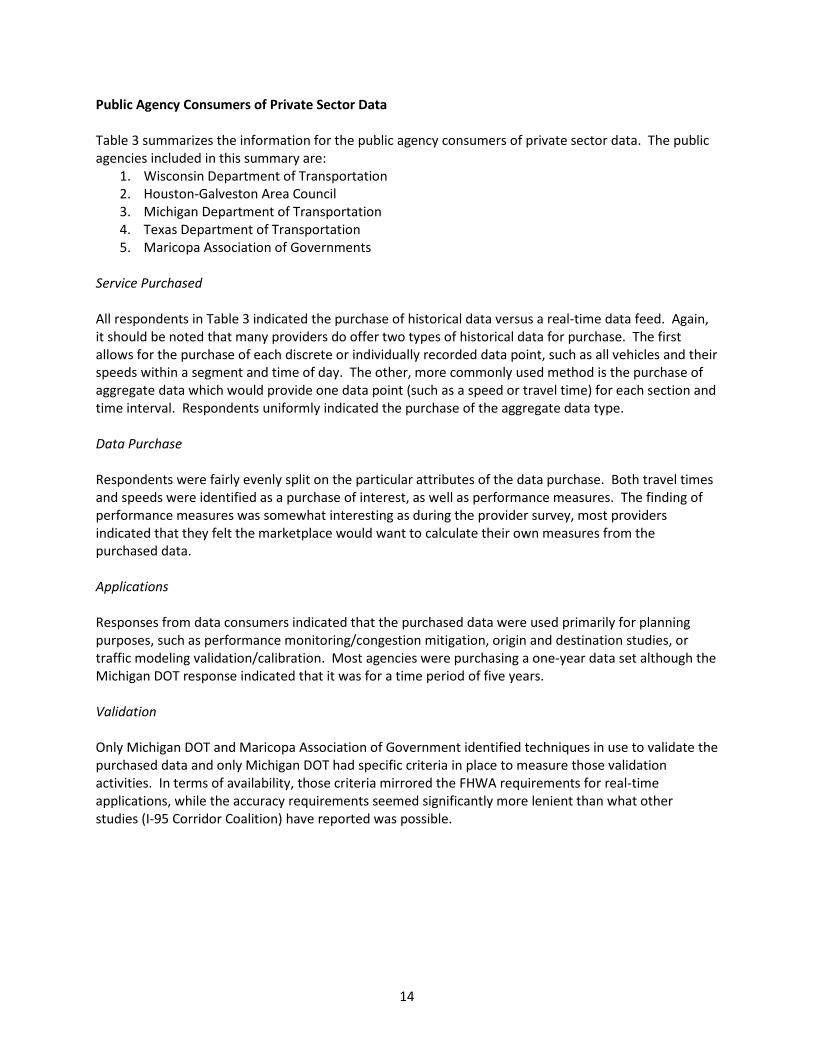
Service Purchased All respondents in Table 3 indicated the purchase of historical data versus a real-time data feed. Again, it should be noted that many providers do offer two types of historical data for purchase. The first allows for the purchase of each discrete or individually recorded data point, such as all vehicles and their speeds within a segment and time of day. The other, more commonly used method is the purchase of aggregate data which would provide one data point (such as a speed or travel time) for each section and time interval. Respondents uniformly indicated the purchase of the aggregate data type. Data Purchase Respondents were fairly evenly split on the particular attributes of the data purchase. Both travel times and speeds were identified as a purchase of interest, as well as performance measures. The finding of performance measures was somewhat interesting as during the provider survey, most providers indicated that they felt the marketplace would want to calculate their own measures from the purchased data. Applications Responses from data consumers indicated that the purchased data were used primarily for planning purposes, such as performance monitoring/congestion mitigation, origin and destination studies, or traffic modeling validation/calibration. Most agencies were purchasing a one-year data set although the Michigan DOT response indicated that it was for a time period of five years. Validation Only Michigan DOT and Maricopa Association of Government identified techniques in use to validate the purchased data and only Michigan DOT had specific criteria in place to measure those validation activities. In terms of availability, those criteria mirrored the FHWA requirements for real-time applications, while the accuracy requirements seemed significantly more lenient than what other studies (I-95 Corridor Coalition) have reported was possible.

15
Table 3. Summary of Historical Data Consumer Survey Results
Wisconsin DOT HGAC Michigan DOT Texas DOT(d) Phoenix MPO (MAG) Status? Request for
Information Purchased Purchased Purchased Purchased
Service Purchased (a) H H H H H Aggregation Level Hourly day-of-week
averages 15 min 5 min Hourly day-of-week
averages Weekday
Data Purchased(b) S/TT, PM S/TT S/TT S/TT, PM PM Applications(c) PM, TM PM, TM, OD PM PM PM Coverage All arterials Houston region MI Freeways Statewide TMC
network Region
Timeframe 1-2 years 1 year 5 years 2009 1 year Validation Criteria Not yet established Not yet established Avail >99.5%
Acc less than +/- 10mph
None Not yet established
Validation techniques N/A N/A Probe, fixed point , re-id
None Probe, fixed point.
Pricing (in thousands) $80,000 (Est.) $77,000 $200,000 per year $28,000 Negotiating Licensing Multiple Use Multiple Use Single Use Single Use Multiple Use Multi-Agency Yes Yes NOTES:
(a) Service Purchased: “H”=Historical, “RT”=Real-time (b) Data Purchased: “S/TT”=Speed or Travel Time”, “PM”=Performance Measures (c) Applications: “PM”-Performance or Congestion Monitoring, “TM”=Traffic Model Validation or Calibration, “OD”=Origin-Destination Studies (d) See http://apps.dot.state.tx.us/apps/rider56/list.htm for published study results.

16
Pricing Not all agencies responded with pricing information. Understanding the pricing models in play are difficult as each provider has different pricing models based on the application, type of data, and coverage area. This was confirmed in the responses from the data providers as none except INRIX would detail their pricing structure. There is little capability to infer standard pricing information that would be applicable over a large (multi-state or national) region from the responses received. While not detailed in Table 3, responding agencies indicated that the use of purchased data was generally considered for the reasons of:
• Cost-effectiveness • Faster turnaround • Accuracy • Availability
Overall, the respondents’ stated advantages to private sector data was:
• Consistency of the data collection approach. • Comprehensive coverage. • Frequency of updates.
Consumers generally expressed satisfaction with their purchases, but this assessment is tempered by the fact that few validation efforts have taken place. Summary Overall, this state-of-the-practice review indicates a growing market for public sector acquisition and usage of private sector data. Private sector data providers are aware that this market has potential, are interested in developing new product offerings, and are looking to expand their customer base. Public agencies see a number of advantages to private sector data, but are still working out issues such as validation of the data and matching data to a consistent location referencing system.

17
CHAPTER 4. QUALITY ASSURANCE AND VALIDATION This section summarizes the findings of the third task of this project, which was intended to address various technical issues related to quality assurance and validation of private sector data. The quality of private sector data should be ensured, as performance data could be used for a number of critical policy and investment decisions. Based on the team’s review of current practice, the private sector data quality levels vary widely among vendors, if it is even measured systematically. The I-95 Corridor Coalition has done the most extensive testing of real-time traffic speeds, and in the past two years the data provider has met the established data quality requirements in the contract. Several providers have extensive internal data quality processes but seldom make the results publicly available. One of the most important considerations when considering data quality for performance measures is that most performance measures use historical averages for longer time intervals over multiple days, weeks, or months. Therefore, the error measured in real-time traffic data is not the same level as the error in an historical average. Over multiple days and time intervals, some of the random error in real-time data cancels out and results in a lower error magnitude for historical data. For a simple example, consider 2 days for a single time interval, and the first day the error is +5 mph and the second day the error is -5 mph. Therefore, the error in the historical average will be 0 mph. The implication of this principle is that historical averages will have at least the same but typically better quality levels than the corresponding raw real-time data. Therefore, if there are accuracy specifications for real-time traffic data (i.e., Section 1201), the historical averages from this real-time data typically will have better accuracy levels. Quality Assurance Methods There are at least three approaches to assess whether historical private sector data quality meets specified levels, and these basic approaches have already been used in several instances. The three approaches are outlined below and are ordered in terms of increasing cost and complexity. Office-Based Statistical Analysis of Data And Metadata This approach would be the least costly option but also the least definitive quality assessment. In this approach, statistical process control methods are used to identify those data that statistically deviate outside of expected properties. This approach can only be used to identify suspect data and does not result in a definitive and quantitative accuracy measure. This statistical process control approach is used by FHWA contractors in reviewing the quality of the Intelligent Transportation Infrastructure Program (ITIP) data. Metadata that expressly serves as or can be interpreted as indicator of data quality can be used to gain an overall understanding as to how data quality has evolved over time, at least from data provider’s perspective. Additionally, if it is possible to establish the correlation between the provided metadata and actual data quality then it will be possible to draw stronger conclusions on archived data quality that were not even directly validated. In this respect, it is crucial to have a close dialog with the data provider to verify the interpretation of their provided metadata and to factor in any changes that they might have incorporated to the production and target use of their provided quality indicators over time.

18
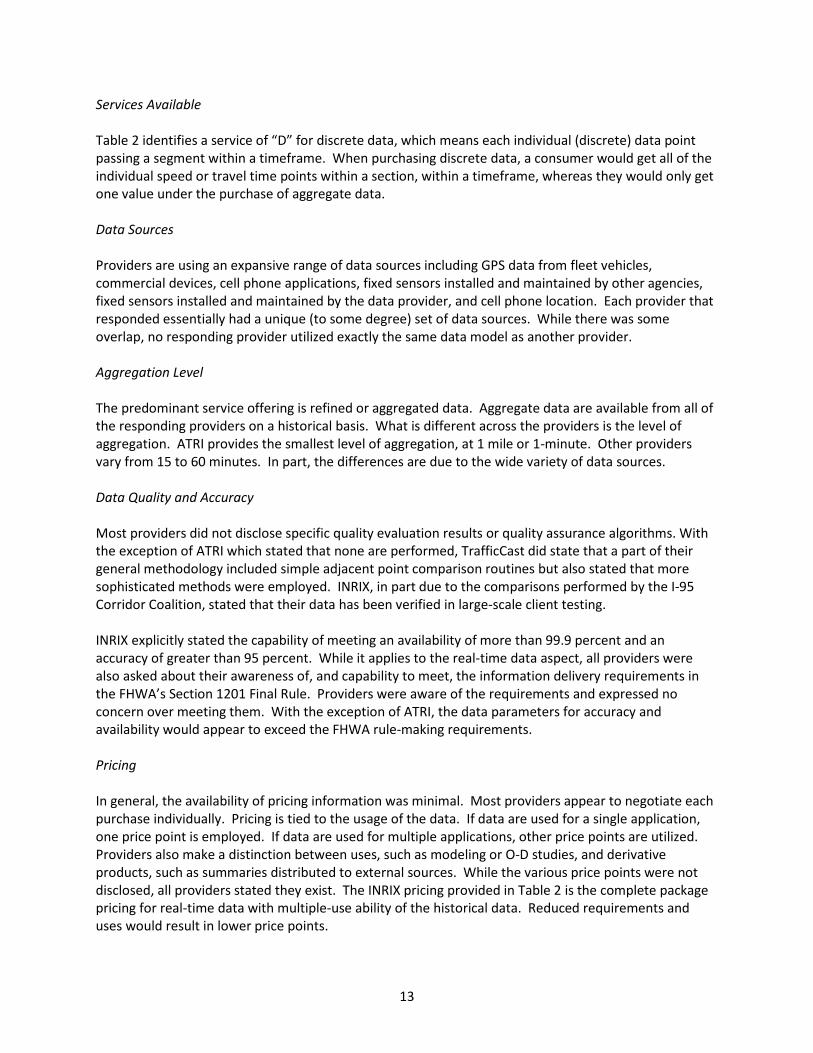
Compare To Other Trusted Public Sector Data Sources This approach involves gathering existing public sector data of a known or trusted quality level and comparing to the private sector data. For example, the FHWA or its contractor could gather and use existing high-quality (e.g., toll tag-based or Bluetooth-based) travel time data from permanent traffic monitoring locations as a benchmark in several US cities (e.g., Houston, New York, San Francisco). Other cities may have fixed-point sensor systems with close enough spacing to permit a valid comparison. This method is more definitive than a statistical process control approach, but there are typically enough differences in road segmentation and/or measurement type (fixed point vs. link) to introduce some uncertainty. TTI has used this approach in several instances to assess the quality of historical average speed data. Evaluate the Quality of Real-Time Data and Extrapolate to Historical Averages This approach is the most costly on a nationwide basis but also the most definitive, especially if temporary/portable equipment (e.g., Bluetooth-based) provides large vehicle samples at high accuracy levels. In this approach, portable traffic monitoring equipment is deployed to numerous locations, collecting benchmark data for one or more weeks at each location. Quantitative accuracy levels are then computed by comparing the private sector data to the established benchmark data. This approach is used by the University of Maryland to assess the quality of real-time traveler information along the I-95 corridor in multiple states. As mentioned earlier, this approach would need to account for the principle that the random error in real-time data is typically reduced when computing historical averages. In this approach real-time data collection should be representative of the overall data to be covered under the validation effort. In other words, the extent and distribution of validation-related data collection should be enough so that we can comfortably generalize the findings to the whole area and time frame for which data is being purchased. This issue is further discussed in the section on sampling procedure. The second consideration in this case is that under ideal conditions the adopted data collection technology used in the validation should be superior to that of the vendor’s. For instance, it does not make sense to use loop detector data to validate travel times obtained by drive tests. On the other hand, validation of travel time data produced by loop detector data based on data obtained by conducting drive tests makes sense. However, more than anything else, budgetary and technological considerations might play a decisive role on the extent and quality of the validation effort. Drawing conclusions on the archived data quality can be accomplished by investigating the variations of data quality over its recent history. Based on such investigations, historic data quality can be extrapolated to the further past. Clearly, this is an indirect inference method that needs to be used cautiously. Generally speaking, extrapolations are more accurate when they are closer to the actual observations and lose their accuracy as we move further away from the actual observation points. For instance, Figure 1 shows a schematic of the application of such method. In this Figure, it is assumed that archived data from 2007 has become available. In addition, ever since 2008, real-time validation of the data has been performed for three consecutive years which resulted in data quality measures indicated by solid dots. At the end of 2010, it would be possible to draw conclusions on the observed trend of the data quality measure(s) in consideration and to cautiously extrapolate into the past and to the future.

19
Figure 1. Schematic of Data Quality Extrapolation
Generalized Validation Guidance The validation team needs to identify the purpose and requirements of the validation and obtain an extensive knowledge of the (potential) users of such validation results. Involving all stake-holders in the decision process ensures the support for validation and acceptability of its results by all parties. Therefore, it is a good practice to keep a close contact between validation team, private sector data provider, and public sector users to address all the concerns and to incorporate all their constructive suggestions both in the planning process and throughout actual data collection and implementation phase. Since a validation effort at the national/regional scale will be highly visible, it is reasonable to expect that typical data providers require complete transparency of the validation process. Aside from gaining providers backing of the validation process and its results, transparent validation has the additional benefit of helping providers to spot shortcomings in their proprietary processes and work on fixing or improving them, the end result of which would be improved data quality for all users of that data. Developing a real-time data validation plan is comprised of taking the following steps:
• Technology selection • Sample design • Logistics planning and coordination • Data quality measures • Data handling, reduction, analysis and storage
In practice, several notable and tested technologies for accurate travel time data collection are available. These methods can be categorized into two umbrella groups, that are tracking and identification. Tracking methods obtain travel time of a single or a representative group of vehicles in traffic stream by tracking them over a stretch of the highway of interest, effectively building the vehicles trajectories. On the other hand, identification techniques follow the notion that once a characteristic signatures of vehicles passing at two different locations are identified a comparison between the pair of passage time stamps would produce the vehicle travel time between the two identification locations.
2007 2008 2009 2010 2011
Dat
a Q
ualit
y M
easu
re
Time (Year)

20
The following is a list of different travel time data collection technologies that fall within these two broad categories and are widely used to establish “ground truth” in travel time validation efforts:
• Tracking methods: o Floating vehicle
GPS o Probe vehicles
GPS receiver Cellular phone GPS on cellular phone
• Identification methods: o Signature matching
License plate Toll tag Magnetic Bluetooth
Both tracking and identification methods collect data that needs to be cleaned before use in travel time estimation. The effort needed to clean the collected data set varies greatly from method to method depending on the cleaning technology used and the operator’s expertise level. Also, the degree to which the produced number of travel time observations can be a representative of the traffic stream is another factor that needs to be taken into consideration when deciding which method to use. Table 4 summarizes the results of a recent survey on Bluetooth traffic monitoring system manufacturers in the US market conducted by the University of Maryland in January/February 2011. In this survey five companies were initially identified as producers of various types of Bluetooth sensors. Out of the five companies, four agreed to provide their system specs and pricing details for the purpose of this report. It is notable that for validation purposes and to maximize flexibility of the sensors, stand-alone direct current (DC) powered systems are preferable as it would be possible to deploy them practically at any location without worrying about the power supply. The DC powered units typically include a car-size battery that can be fully recharged in 48 hours and hold enough charge for up to 10 to 12 days of continuous data collection. In authors opinion even though real-time data processing is potentially capable of realizing on-going monitoring and data quality validation, in general, post processing the data is, more preferable option since in addition to being more economical, it allows for convenient incorporation of the lessons learned in the validation process as well as dissecting the collected data sets to any desirable level.
21
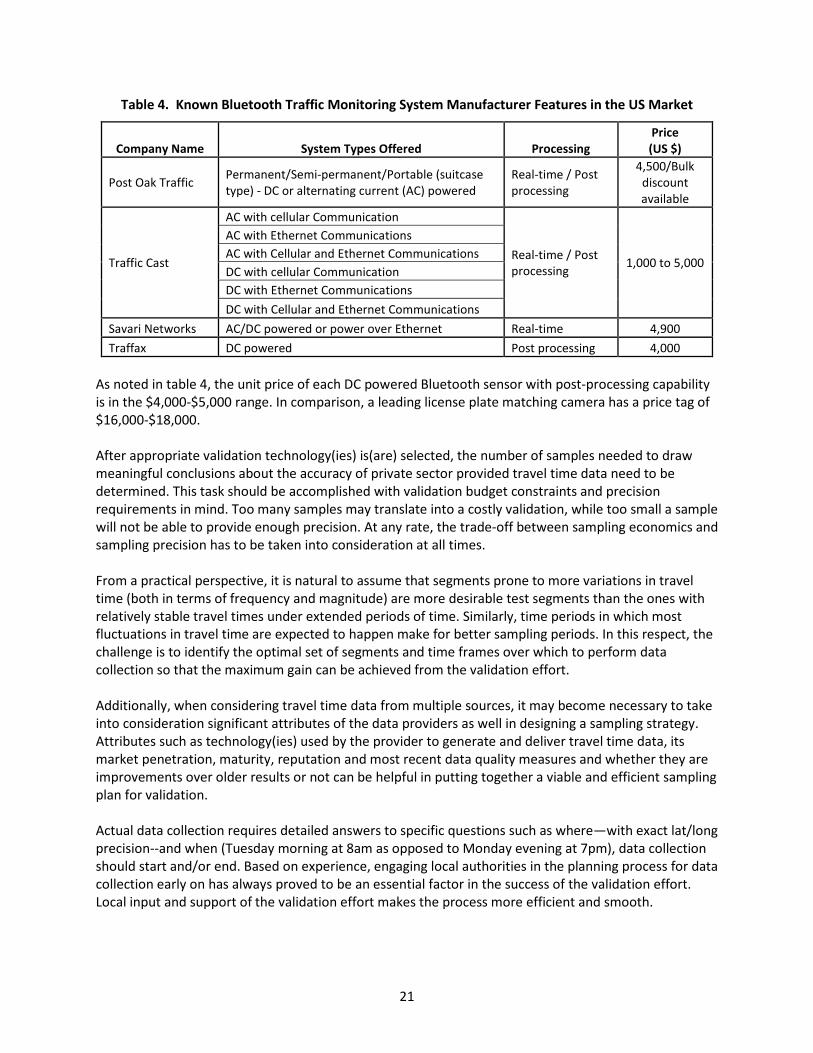
Table 4. Known Bluetooth Traffic Monitoring System Manufacturer Features in the US Market
Company Name System Types Offered Processing Price (US $)
Post Oak Traffic Permanent/Semi-permanent/Portable (suitcase type) - DC or alternating current (AC) powered
Real-time / Post processing
4,500/Bulk discount available
Traffic Cast
AC with cellular Communication
Real-time / Post processing
1,000 to 5,000
AC with Ethernet Communications AC with Cellular and Ethernet Communications DC with cellular Communication DC with Ethernet Communications
DC with Cellular and Ethernet Communications
Savari Networks AC/DC powered or power over Ethernet Real-time 4,900
Traffax DC powered Post processing 4,000 As noted in table 4, the unit price of each DC powered Bluetooth sensor with post-processing capability is in the $4,000-$5,000 range. In comparison, a leading license plate matching camera has a price tag of $16,000-$18,000. After appropriate validation technology(ies) is(are) selected, the number of samples needed to draw meaningful conclusions about the accuracy of private sector provided travel time data need to be determined. This task should be accomplished with validation budget constraints and precision requirements in mind. Too many samples may translate into a costly validation, while too small a sample will not be able to provide enough precision. At any rate, the trade-off between sampling economics and sampling precision has to be taken into consideration at all times. From a practical perspective, it is natural to assume that segments prone to more variations in travel time (both in terms of frequency and magnitude) are more desirable test segments than the ones with relatively stable travel times under extended periods of time. Similarly, time periods in which most fluctuations in travel time are expected to happen make for better sampling periods. In this respect, the challenge is to identify the optimal set of segments and time frames over which to perform data collection so that the maximum gain can be achieved from the validation effort. Additionally, when considering travel time data from multiple sources, it may become necessary to take into consideration significant attributes of the data providers as well in designing a sampling strategy. Attributes such as technology(ies) used by the provider to generate and deliver travel time data, its market penetration, maturity, reputation and most recent data quality measures and whether they are improvements over older results or not can be helpful in putting together a viable and efficient sampling plan for validation. Actual data collection requires detailed answers to specific questions such as where—with exact lat/long precision--and when (Tuesday morning at 8am as opposed to Monday evening at 7pm), data collection should start and/or end. Based on experience, engaging local authorities in the planning process for data collection early on has always proved to be an essential factor in the success of the validation effort. Local input and support of the validation effort makes the process more efficient and smooth.

22
Developing a plan to engage state and local authorities including relevant law enforcement agencies (as required) prior to any real-time or archival data collection for validation purposes is necessary. All relevant information should be prepared and presented to relevant local agencies at least one month before the planned start of data collection. Authorities should then be asked to comment on the plan and propose improvements and any changes they deem necessary based on their local knowledge of potential safety hazards to the general public and their personnel, local and seasonal congestion patterns, construction projects in the area, weather conditions, etc. Every effort should be made to incorporate these comments in the modified data collection plan. A few iterations may be necessary before the final data collection plan is accepted by all parties. The final plan should address the issue of validation logistics in detail. Questions such as how relevant data collection equipment should be transported and deployed in desired locations in a manner that ensures the safety of the personnel involved should be addressed. Data quality has always been an important concern in any ITS application. In recent years, the issue of developing quality measures for different travel related data has been of special interest because of the emergence of private companies which provide traffic information to the public agencies. Two data quality measures that are widely used for travel time data validation purposes are “average absolute speed error” and “speed error bias.” Here by speed we mean average travel speed. Typically, data quality requirements should be in effect whenever the traffic volume is higher than a certain level on the segment of interest. These measures should be calculated and verified separately in different speed ranges. A typical speed partitioning system for freeways is: below 30 miles per hour (mph); 30 mph to 45 mph; 45 mph to 60 mph; and greater than 60 mph. It is important to note that the validation speed or the “ground truth” speed is considered as the basis for speed range definitions. It is expected that large scale validation efforts will result in massive amounts of data that is to be collected and processed. For this reason the validation team should plan for data warehousing and determining the necessary information technology platform and software that is needed for validation. It is a common practice for private sector to report travel time data on TMC codes, which are supported by major map providers such as NAVTEQ and TeleAtlas. In the absence of any other standard, it is a good practice to collect validation data on TMC segments. The latest version of the TMC definitions must be incorporated into the data warehousing system. Additionally two or more TMC segments may be combined to form longer path segments for validation purposes. In such cases it is necessary to create a protocol for communicating the path information to all parties involved in the validation process. If technologies such as Bluetooth are used for travel time sampling, major data processing effort for matching and filtering the raw records must be undertaken to prepare data for validation. In the case of I95 Corridor Coalition VPP, over 6 million travel time samples have been collected resulting from over 30 million raw Bluetooth detections. An appropriate database system is crucial for archiving, manipulating and preparing such data. If multiple technologies will be used for ground truth data collection, it is of particular importance to standardize the data coming from different sources before adding them to the data pool. The recommended approach is a hybrid of all three approaches.
1) Statistical process control analysis should be used on a nationwide basis to identify locations or time periods of suspect data.

23
2) High-quality or trusted public sector traffic data should be identified and used on a selective basis to compare against private sector data. The locations or time periods with the most suspect data (as identified with the statistical process control) will be the highest priority for evaluation purposes.
3) The quality of real-time data should be selectively evaluated by using portable, short-term field
data collection (e.g., Bluetooth-based) at those locations with the most suspect data. Obviously, this approach should be used where there is no nearby trusted public sector data sources.
Another approach will become feasible as the Section 1201 travel time data accuracy specifications are implemented by state DOTs. Essentially, this approach relies on the state DOTs to assess and ensure that their real-time travel time data meets the accuracy requirements in Section 1201, thereby ensuring that the resulting historical averages will be at least that quality level, if not better.
24
CHAPTER 5. LEGAL ISSUES This chapter summarizes the findings of the fourth task of this project, which was intended to address various legal and data rights issues that may arise when the public agencies procure traffic data from the private sector data providers. The topics in this chapter are as follows:
• Data licensing o Data rights o Derivative works o Licensing/pricing models
• Open Records/Freedom of Information Act issues • Privacy issues
Data Licensing When referring to the procurement of private sector data for performance monitoring (or other uses), the term “licensing” is more appropriate than “buying” or “purchasing.” The terms “buying” or “purchasing” imply that the public agency owns the “purchased” data when, in fact, that is often not the case. With most private sector data providers, the ownership of the traffic data remains with the private company and the public agency is simply given permission to use the traffic data for various applications. One can think of private sector data in the same way as a software application—when you “buy” the software, you do not own the software, but you are given permission (the license) to install and/or use the software in a specified way and sometimes on a specified number of computers. The terms of use are typically spelled out in fine print in the attached or enclosed software license. Because the data licensing concept is a departure from the traditional data collection model in public sector ITS, the following sections will address unique aspects that will often arise in licensing private sector data.
• Data rights • Derivative works • Licensing/pricing models
Data Rights As a general rule, the federal government obtains “unlimited rights” if the data pertains to an item or process developed exclusively with government funding.7 “Unlimited rights” means that the federal government may “use, modify, reproduce, perform, display, release or disclose” the data to anyone and for any purpose.”8
These rights also apply to “technical data”, which is defined as follows:
Technical Data means recorded information (regardless of the form or method of the recording) of a scientific or technical nature (including computer databases and computer software documentation). This term does not include computer software or financial, administrative, cost or pricing, or management data or other information
7 See 10 U.S.C. § 2320(a)(2)(A); see also 48 C.F.R. Subpart 27.404(a). 8 See 10 U.S.C. § 2320(a)(2)(A).

25
incidental to contract administration. The term includes recorded information of a scientific or technical nature that is included in computer databases.9
In contrast, the federal government obtains “limited rights” to data (other than software) that embodies trade secrets or are commercial or financial and confidential or privileged, to the extent that such data pertains to items, components or processes developed exclusively with private funding.10 Such “limited rights” restrict the federal government from disclosing the data outside of the government, except under circumstances disclosed and agreed to between the government and the contractor.11 Therefore, to the extent public agencies desire to share the data with its partners and other contractors, they must expressly set forth in the procurement documents the circumstances and conditions under which the traffic data will be disclosed and used by third parties.12
What this means to public agencies is as follows: Unless a public agency pays for the full cost of data collection, they cannot expect to own or freely redistribute the data. That is, they have limited rights to use the data as specified in the licensing agreement. The data rights terms of private sector data providers vary widely; however, there are two common themes:
1. Data rights can often be negotiated. 2. The licensing costs will increase as the extent of data rights and redistribution increases.
Because of this, public agencies should seek the experience of other agencies who have already procured private section data. These other licensing agreements should give a better idea of what terms are possible at what price. Derivative Works Most public agencies that license historical private sector data for performance monitoring will be analyzing and further summarizing the original licensed data. That is, the public agencies will be creating “derivative works” that commonly include summary congestion and reliability statistics, maps and charts of congestion and performance trends, and other aggregate summary information. The nature of performance monitoring requires that this summary information (i.e., derivative works) be freely distributed to other transportation agencies, key decision-makers, elected officials, and the general public. Therefore, any procurement of private sector data should address the data rights for derivate works as produced by the licensing agency (or its contractors). Ideally, a public agency should have unlimited rights to freely redistribute derivate works at some specified level of aggregation or summary. For example, the following terms have been included in several public sector procurements:
• Licensing rights shall be provided that permits TTI to analyze the average speed data and create derivative congestion statistics for the purposes of developing a prototype statewide performance report.
9 Federal Acquisition Regulations (FAR) 52-227-14. 10 See 10 U.S.C. § 2320(a)(2)(B); see also FAR 52-227-14. 11 48 C.F.R. Subpart 27.404-2. 12 See 48 C.F.R. Subpart 27.404-2(c)(1) (listing examples of specific purposes that limited rights data may be used by the federal government).

26
• Licensing rights shall be provided that permits TTI to publicly release and redistribute these derivative congestion statistics at the corridor-level (e.g., 5- to 10-mile long directional sections of road). Examples of these derivative congestion statistics include, but are not limited to, measures such as start time of congestion, end time of congestion, average congestion duration, average multi-hour speed, travel time index, travel delay, etc.).
Licensing/Pricing Models The licensing and pricing models among the private sector data providers varies considerably, and often is only quoted for specific scenarios or requests for bid. There are several different historical data pricing models being used that public agencies should be aware of:
• Pricing by miles covered – a unit price is quoted on a per highway mile basis.
• Pricing by population – a total price is quoted based on the population of the regions of interest (e.g., urban/metro area or state).
• Pricing by number of computer users – a total price is quoted based on the number of
computers that will have access to the original traffic data provided.
• Pricing as a percentage of analysis cost – a total price is quoted as a percentage of the engineering analysis cost (used specifically for consultant-based analyses).
Open Records/Freedom of Information Act Issues Several public agencies have expressed concern about being forced to publicly disclose private sector data that is in their possession. The FHWA is subject to the FOIA, and nearly all state DOTs have a similar Open Records, Open Government, or Sunshine law that requires that certain information within their control must be released upon request of any citizen. The concern is that a public agency may be forced to disclose proprietary private sector traffic data, which would likely be a violation of most private sector data licensing agreements. Federal and state law varies considerably in this regard, so it is difficult to make any generalizations about how private sector data will be viewed with respect to open records laws. During interviews conducted for this project, several state DOTs have noted that they license other proprietary datasets from private companies and that certain legal exclusions protect this proprietary data from public disclosure. Several public agencies have contracted with an intermediary (i.e., consultant or contractor) to produce aggregate performance statistics that can be freely redistributed. In this manner, the public agency never has possession or control of the private sector data and would be less likely to be required to publicly release the proprietary traffic data. The use of an intermediary also has certain disadvantages, as the public agency is dependent on the intermediary for access to create or develop further derivative data works.

27
Privacy Issues Public agencies must take into account any privacy issues that may arise as a result of disclosure of the private sector traffic data by their agency, its contractors, grantees or other third parties. In particular, both federal and state law recognizes a certain degree of privacy with respect to driver information. If the traffic data that a public agency purchases, uses or discloses is anonymous in nature, the proposed transaction is unlikely to trigger legally-recognized privacy rights under current law. If, however, a public agency intends to procure personally identifiable information, constitutional, statutory and common law privacy rights that guard against the intrusion created by the unwarranted and unauthorized distribution of personal information are implicated.
28
U.S. Department of Transportation Federal Highway Administration Office of Operations 1200 New Jersey Avenue, SE Washington, DC 20590 Toll-Free “Help Line” (866) 367-7487 Fax: 202-366-3225 http://www.ops.fhwa.dot.gov July 2011 FHWA-HOP-11-029