private equity funds in norway activity report 2013
DESCRIPTION
ÂTRANSCRIPT
PEREP_ Analytics TM
NORWEGIAN VENTURE CAPITAL & PRIVATE EQUITY ASSOCIATION (NVCA)
PRIVATE EQUITY FUNDS IN NORWAY
ACTIVITY REPORT 2013
(SEED – VENTURE – BUY OUT)

PEREP_ Analytics TM
ABOUT THE ACTIVITY REPORT 2013
§ The Activity Report 2013 is developed for the Norwegian Venture Capital & Private Equity Association (NVCA) by Menon Business Economics and PEREP_Analytics during March 2014.
§ The survey covers activities in:
– Norwegian private equity funds:
– Foreign private equity funds with advisory teams located in Norway
– Foreign private equity funds with investments in Norway:
§ The report contains information on:
– Investments and divestments at cost in portfolio companies located in Norway and abroad
– Fundraising activity in Norwegian private equity firms
§ Figures are collected quarterly
§ Figures are reported directly from the private equity firms
2

PEREP_ Analytics TM
ON THE COMPATABILITY WITH EUROPEAN STATISTICS
NVCA defines a «Norwegian private equity firm» as a firm with headquarters located in Norway.
This definition differs from the EVCA definition, which defines a private equity firm on the basis of where the advisory team responsible for the investment and divestment is located.
Due to the discrepancy in definition the EVCA and the NVCA statistics are not completely compatible.
The advantage of the NVCA definition is that the investment and divestment activity is compatible with the fundraising statistics. In addition, the NVCA definition is in line with what is commonly perceived as the Norwegian private equity industry.
Two examples of how the NVCAs definition applies on the statistic:
1. Investments made from the Swedish office of a Norwegian headquartered PE firm would be defined as Norwegian
2. Investments made from the Norwegian office of a Swedish headquartered PE firm regards as an investment made by a foreign located private equity fund.
3

PEREP_ Analytics TM
MAIN OBSERVATIONS 2013
§ Fewer and bigger deals as 2013 had the highest level of buyout investments by
Norwegian PE firms, and the lowest number of initial and follow-on investments, since 2007.
§ 2013 had the highest level of initial investments in Norwegian portfolio companies by foreign PE firms ever.
§ 2013 had the highest level of trade sales from Norwegian PE firms to industrial buyers since 2007. 5 of the industrial sales were initially seed companies.
4

PEREP_ Analytics TM
FUNDRAISING IN 2013 – NORWEGIAN PRIVATE EQUITY FUNDS
Total fundraising NOK 6,0 bn (EUR 750 mill), compared NOK 2.0 bn. (EUR 250 mill.) in 2012
Venture:
– First closing of Northzone VII of NOK 1.2 bn (EUR 150 mill)
Buyout:
– FSN IV NOK 4.8 bn (EUR 600 mill)
Seed:
– Two new seed funds with governmental loan capital are expected to have their final closing in H1 2014.
– The funds will be managed by Proventure Management and Alliance Venture Spring.
5

PEREP_ Analytics TM
INVESTMENTS BY NORWEGIAN PE FIRMS 2013 (INDUSTRY STATISTICS) 6
Overall:
§ Norwegian PE firms invested 6 019 mill. NOK (EUR 752 mill.) in Norwegian and foreign portfolio companies. – 4131 mill. NOK (EUR 516 mill.) in Norwegian enterprises
– 1889 mill. NOK (EUR 236 mill.) in foreign enterprises
Seed:
– 17 mill. NOK (EUR 2,2 mill.) invested. Up from 14 mill. NOK (EUR 1,7 mill.) in 2012.
Venture
– 765 mill. NOK (EUR 96 mill.) invested. Down from 1 132 mill. NOK (EUR 142 mill.) in 2012.
Buyout:
– 5 237 mill. NOK (EUR 655 mill.) invested. Up from 3 647 mill. NOK (EUR 456 mill.) in 2012.

PEREP_ Analytics TM
INVESTMENTS IN NORWEGIAN PORTFOLIO COMPANIES BY NORWEGIAN AND FOREIGN PE FIRMS 2013 (MARKET STATISTICS)
Overall:
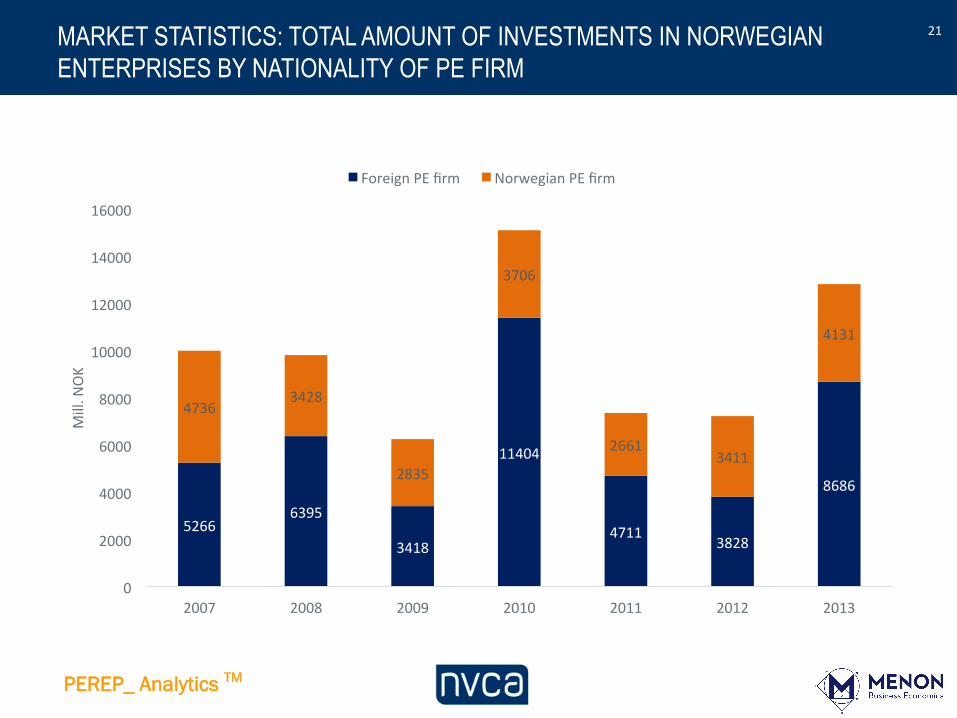
§ 12 817 mill. NOK (EUR 1 602 mill.) invested in Norwegian entreprises by both Norwegian and foreign PE firms – Norwegian PE firms invested 4 131 mill. NOK (EUR 516 mill.)
– Foreign PE firms invested 8 686 mill. NOK (EUR 1085 mill.)
Seed:
– A total of 9.9 mill. NOK (1.2 mill. EUR) invested, up from 7.5 mill. NOK (EUR 0.9 mill) investment in the seed segment in 2012.
Venture:
– A total of 519 mill NOK (EUR 65 mill) invested, down from 875 mill. NOK (EUR 109 mill) in 2012.
Buyout:
– A total of 12 289 mill. NOK (EUR 1 536 mill.) invested, up from 6 357 mill. NOK (EUR 795 mill ) in 2012.
7

PEREP_ Analytics TM
DIVESTMENTS (EXITS) 2013
§ Divestments in Norwegian and foreign enterprises by Norwegian PE firms – 54 divestments by Norwegian PE firms. Up from 44 in 2012.
– 10 divestments within the seed stage. Up from 1 in 2012.
– 26 divestments within the venture stage. Down from 29 in 2012.
– 18 divestments within the buy out stage. Up from 14 in 2012.
– 34 out of 54 divestments were sales to trade buyers.
§ Divestments in Norwegian enterprises by Norwegian and foreign PE firms
– 68 divestments in Norwegian enterprises. Up from 43 in 2012.
– 10 divestments within the seed stage. Up from 1 in 2012.
– 20 divestments within the venture stage. Down from 25 in 2012.
– 38 divestments within buyout. Up from 17 in 2012.
8

PEREP_ Analytics TM
APPENDIX Graphs and charts:
Fundraising
Investments
Divestments

PEREP_ Analytics TM
FUNDRAISING
PEREP_ Analytics TM
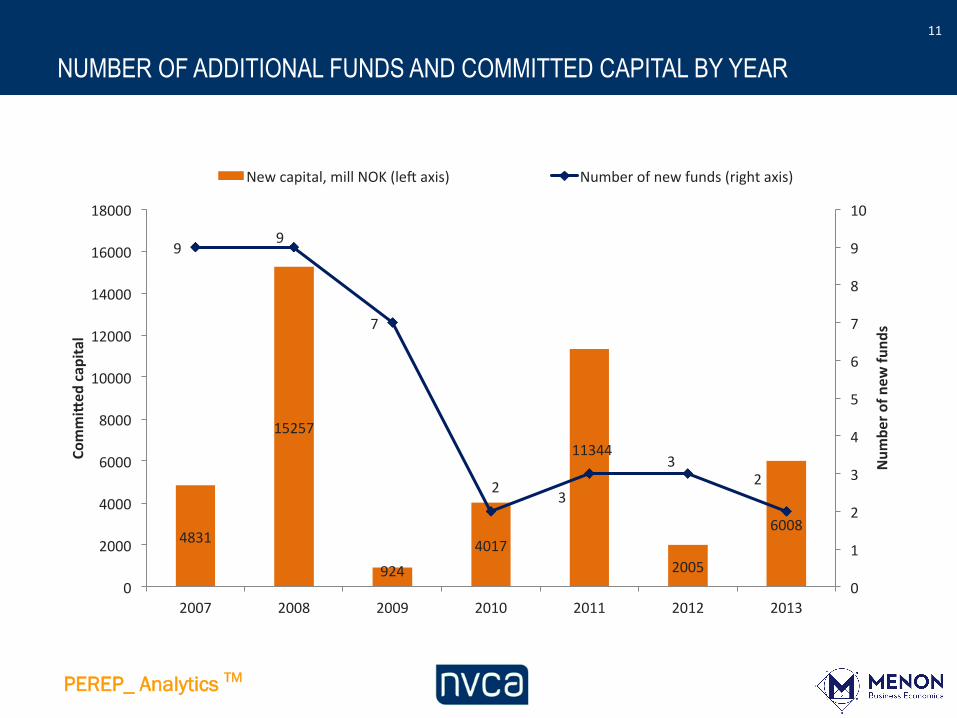
NUMBER OF ADDITIONAL FUNDS AND COMMITTED CAPITAL BY YEAR 11
4831
15257
924
4017
11344
2005
6008
9 9
7
2 3
3 2
0
1
2
3
4
5
6
7
8
9
10
0
2000
4000
6000
8000
10000
12000
14000
16000
18000
2007 2008 2009 2010 2011 2012 2013
Num
ber o
f new
fund
s
Commi0ed
cap
ital
New capital, mill NOK (le: axis) Number of new funds (right axis)

PEREP_ Analytics TM
INVESTMENTS

PEREP_ Analytics TM
Norwegian PE firms’ investments in Norwegian and foreign enterprises
(Industry statistics)

PEREP_ Analytics TM
INDUSTRY STATISTICS: TOTAL AMOUNT OF INVESTMENTS IN NORWEGIAN AND FOREIGN ENTERPRISES BY NORWEGIAN PE FIRMS
14
1670 2091
1116
2103
1076 1381 1889
4736 3428
2835
3706
2661
3411
4131
0
1000
2000
3000
4000
5000
6000
7000
2007 2008 2009 2010 2011 2012 2013
Mill. N
OK
Foreign company Norwegian company
PEREP_ Analytics TM
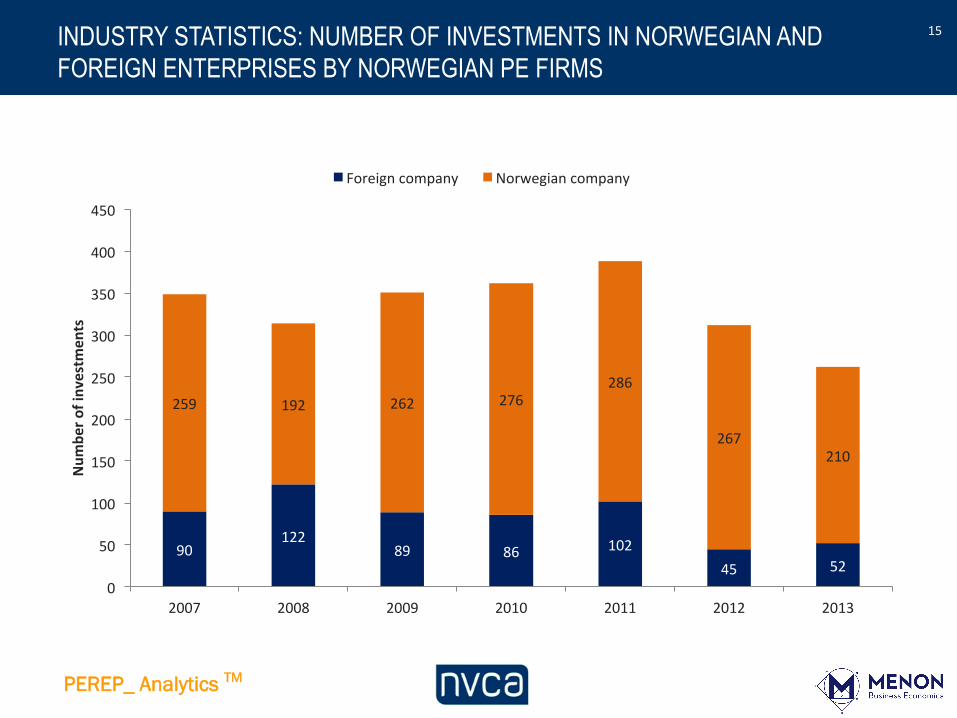
INDUSTRY STATISTICS: NUMBER OF INVESTMENTS IN NORWEGIAN AND FOREIGN ENTERPRISES BY NORWEGIAN PE FIRMS
15
90 122
89 86 102 45 52
259 192 262 276 286
267 210
0
50
100
150
200
250
300
350
400
450
2007 2008 2009 2010 2011 2012 2013
Num
ber o
f investm
ents
Foreign company Norwegian company

PEREP_ Analytics TM
NORWEGIAN PE FIRMS' TOTAL INVESTMENTS BY PHASE (MILL. NOK) 16
3596 3222 2455
4012
2441
3647
5237
2580
2049
1462
1708
1256
1132
765
231
248
33
89
39
14
17
0
1000
2000
3000
4000
5000
6000
7000
2007 2008 2009 2010 2011 2012 2013
Mill. N
OK
Buyout Venture Seed

PEREP_ Analytics TM
INITIAL AND FOLLOW UP INVESTMENTS IN NORWEGIAN AND FOREIGN ENTERPRISES BY NORWEGIAN PE FIRMS (MILL. NOK)
17
3003 2445
1494
2826
1764
2702 3384
593 777 962 1186 677 944
1853
1241
715
605
802
394
361
259
1339 1334 858
906
862 772
506
162
128
22
31
5
13
15
69 120
10 58
34 0
2
0
500
1000
1500
2000
2500
3000
3500
4000
4500
5000
2007 2008 2009 2010 2011 2012 2013 2007 2008 2009 2010 2011 2012 2013
IniOal Follow up
Mill. N
OK
Buyout Venture Seed

PEREP_ Analytics TM
NUMBER OF INITIAL AND FOLLOW UP INVESTMENTS IN NORWEGIAN AND FOREIGN ENTERPRISES BY NORWEGIAN PE FIRMS
18
24 21 22 26 27 24 22 16 24 41 37 46 34 21
69 39 42
58 33 23 20
175 183
231 213
274
225
192 49
18 8
14
2 4 6
16
29
7 14
6
2
1
0
50
100
150
200
250
300
350
2007 2008 2009 2010 2011 2012 2013 2007 2008 2009 2010 2011 2012 2013
IniOal Follow up
Num
ber o
f investm
ents
Buyout Venture Seed

PEREP_ Analytics TM
TOTAL AMOUNT INVESTED BY SECTOR AND PHASE BY NORWEGIAN PE FIRMS IN 2013 (MILL. NOK)
19
0
500
1000
1500
2000
2500
Mill. N
OK
Buyout Venture Seed

PEREP_ Analytics TM
Investments in Norwegian enterprises by Norwegian and foreign PE firms
(Market statistics)
PEREP_ Analytics TM
MARKET STATISTICS: TOTAL AMOUNT OF INVESTMENTS IN NORWEGIAN ENTERPRISES BY NATIONALITY OF PE FIRM
21
5266 6395
3418
11404
4711 3828
8686
4736 3428
2835
3706
2661 3411
4131
0
2000
4000
6000
8000
10000
12000
14000
16000
2007 2008 2009 2010 2011 2012 2013
Mill. N
OK
Foreign PE firm Norwegian PE firm

PEREP_ Analytics TM
MARKET STATISTICS: NUMBER OF INVESTMENTS IN NORWEGIAN PORTFOLIO COMPANIES BY NATIONALITY OF PE FIRM
22
28 47 47 43 35 45 39
259 192
262 276 286 267
210
0
50
100
150
200
250
300
350
2007 2008 2009 2010 2011 2012 2013
Num
ber o
f investm
ents
Foreign PE firm Norwegian PE firm

PEREP_ Analytics TM
MARKET STATISTICS: NUMBER OF INITIAL INVESTMENTS IN NORWEGIAN PORTFOLIO COMPANIES BY NATIONALITY OF PE FIRM
23
15 18 8
18 18 17 22
117
55
53
77
36 39 28
0
20
40
60
80
100
120
140
2007 2008 2009 2010 2011 2012 2013
Num
ber o
f investm
ents
Foreign PE firm Norwegian PE firm

PEREP_ Analytics TM
TOTAL AMOUNT OF INVESTMENTS IN NORWEGIAN ENTERPRISES BY PHASE (MILL. NOK)
24
7766 8391
5080
13729
6326 6357
12289
2026 1304
1136
1335
1043 875
519
209 128
37
46
2 8
10
0
2000
4000
6000
8000
10000
12000
14000
16000
2007 2008 2009 2010 2011 2012 2013
Mill. N
OK
Buyout Venture Seed

PEREP_ Analytics TM
INITIAL AND FOLLOW UP INVESTMENTS IN NORWEGIAN ENTERPRISES BY NORWEGIAN AND FOREIGN PE FIRMS (MILL. NOK)
25
6818 5668
3480
9124
5564 5413
10595
948
2723 1600
4605
762 944 1694
979
609
612
767
323 208
98
1047
695
524
568
720 667 421
155
47
27
31
1 7
8
55
80
10
16
1 0 2
0
2000
4000
6000
8000
10000
12000
2007 2008 2009 2010 2011 2012 2013 2007 2008 2009 2010 2011 2012 2013
IniOal Follow up
Mill. N
OK
Buyout Venture Seed

PEREP_ Analytics TM
NUMBER OF INITIAL AND FOLLOW UP INVESTMENTS IN NORWEGIAN ENTERPRISES BY NORWEGIAN AND FOREIGN PE FIRMS
26
23 24 19 24 23 29 29 18 30 57
39 38 42 33
62 32 33
57 30 24 16
122 115
185 178
227 212
165 47
17 9
14
1 3 5
15 21
6
7
2 2
1
0
50
100
150
200
250
300
2007 2008 2009 2010 2011 2012 2013 2007 2008 2009 2010 2011 2012 2013
IniOal Follow up
Num
ber o
f investm
ents
Buyout Venture Seed

PEREP_ Analytics TM
NUMBER OF INVESTMENTS IN NORWEGIAN ENTERPRISES MADE BY NORWEGIAN AND FOREIGN PE FIRMS BY SECTOR AND PHASE IN 2013
27
Phase Seed Venture Buyout Total Type of investment/Total Initial Follow up Total Initial Follow up Total Initial Follow up Total Business related products and industry products 1 1 2 5 7 4 4 12 Business related services and industry services 2 2 3 3 6 8 Chemicals and materials 1 1 1 Cleantech 3 3 49 49 52 Communication 3 22 25 25 Construction 1 8 9 9 Financial services 1 1 1 Fishery and aquaculture 2 2 2 1 3 5 IT 1 1 2 40 42 2 2 4 47 Life Science 1 1 3 29 32 2 6 8 41 Other energy sources 1 2 3 8 1 9 12 Petroleum 3 15 18 1 8 9 27 Retail /consumer services and products 5 4 9 9 Total 5 1 6 16 165 181 29 33 62 249

PEREP_ Analytics TM
AMOUNT INVESTED IN NORWEGIAN ENTERPRISES MADE BY NORWEGIAN AND FOREIGN PE FIRMS BY SECTOR AND PHASE IN 2013 (MILL. NOK)
28
Phase Seed Venture Buyout Total Type of investment/Total Initial Follow up Total Initial Follow up Total Initial Follow up Total Business related products and industry products 2 2 8 6 13 899 899 914 Business related services and industry services 4 4 1 090 193 1 283 1 287 Chemicals and materials 1 1 1 Cleantech 5 5 117 117 122 Communication 25 48 73 73 Construction 310 164 474 474 Financial services 18 18 18 Fishery and aquaculture 15 15 2 150 4 2 154 2 169 IT 2 2 6 88 94 423 28 450 547 Life Science 1 1 32 104 136 1 444 28 1 471 1 608 Other energy sources 0 3 3 1 243 1 243 1 246 Petroleum 23 39 62 1 710 1 247 2 957 3 019 Retail /consumer services and products 1 308 32 1 340 1 340 Total 8 2 10 98 421 519 10 595 1 694 12 289 12 817

PEREP_ Analytics TM
DIVESTMENTS

PEREP_ Analytics TM
Norwegian PE firms’ Divestments in Norwegian and foreign enterprises
(Industry statistics)

PEREP_ Analytics TM
NUMBER OF DIVESTMENTS IN NORWEGIAN AND FOREIGN ENTERPRISES (EXCL. WRITE OFFS) BY NORWEGIAN PE FIRMS
31
20 7 4 9
16 14 18
80
32 30 24
35 29 26
11
4 3 8
10
1 10
0
20
40
60
80
100
120
2007 2008 2009 2010 2011 2012 2013
Num
ber o
f exits
Buyout Venture Seed

PEREP_ Analytics TM
NUMBER OF INDUSTRIAL SALES OF NORWEGIAN AND FOREIGN ENTERPRISES (EXCL. WRITE OFFS) BY NORWEGIAN PE FIRMS
32
5 2 3 2
7 9 14
32
16 13 11
22 15
15
2
3 1
1
3 5
0
5
10
15
20
25
30
35
40
45
2007 2008 2009 2010 2011 2012 2013
No. indu
stria
l sales
Buyout Venture Seed

PEREP_ Analytics TM
NUMBER OF DIVESTMENTS IN NORWEGIAN AND FOREIGN ENTERPRISES BY NORWEGIAN PE FIRMS 2013 BY PHASE
33
2 4
14
3 2 2 2
1 4
15
5
1
4
5
0
5
10
15
20
25
30
35
40
Write offs, including sales for a nominal
amount
FlotaOon (IPO) Sale of quoted equity post flotaOon
Other capital flows
Sale to another private equity
firm
Sale to management (buy-‐back)
Sale to trade buyers
Num
ber o
f divestm
ents
Buyout Venture Seed

PEREP_ Analytics TM
Divestments in Norwegian enterprises by Norwegian and foreign PE firms
(Market statistics)

PEREP_ Analytics TM
NUMBER OF DIVESTMENTS IN NORWEGIAN ENTERPRISES BY NORWEGIAN AND FOREIGN PE FIRMS (EXCL. WRITE OFFS)
35
32
8 4 11 16 17
38
60
14 20
20
27 25
20
9
4 3
8
10 1
10
0
20
40
60
80
100
120
2007 2008 2009 2010 2011 2012 2013
Num
ber o
f divestm
ents
Buyout Venture Seed

PEREP_ Analytics TM
TYPE OF DIVESTMENTS IN NORWEGIAN ENTERPRISES BY NORWEGIAN AND FOREIGN PE FIRMS IN 2013
36
2 2 2
14
20
3
2
4
1
13
5
1
4
5
0
5
10
15
20
25
30
35
40
Write offs, including sales for a nominal
amount
Repayment of preference shares/
loans
Other capital flows Sale to management (buy-‐back)
Sale to another private equity firm
Sale to trade buyers
Num
ber o
f exits
Buyout Venture Seed