private benefits of control: an international comparison · pdf fileprivate benefits of...
TRANSCRIPT

Private Benefits of Control: An International Comparison
Alexander Dyck*
Harvard Business School
and
Luigi Zingales
University of Chicago
First Draft: November 2001
This Draft: December 2001
Abstract
We construct a measure of the private benefits of control in 39 countries based on 412 control transactions between 1990 and 2000. We find that the value of control ranges between –4% and +65%, with an average of 14 percent. As predicted by theory, in countries where private benefits of control are larger capital markets are less developed, ownership is more concentrated, and privatizations are less likely to take place as public offerings. We also analyze what institutions are most important in curbing these private benefits. A high degree of statutory protection of minority shareholders and high degree of law enforcement are associated with lower levels of private benefits of control, but so are a high level of diffusion of the press, a high rate of tax compliance, and a high degree of product market competition. A crude R-squared test suggests that the “non traditional” mechanisms have at least as much explanatory power as the legal ones commonly mentioned in the literature. In fact, in a multivariate analysis newspapers’ circulation and tax compliance seem to be the dominating factors. We advance an explanation why this might be the case.
* Chris Allen, Omar Choudhry and Mehmet Beceren provided invaluable research assistance in preparing the data. We thank John Matsusaka, Krishna Palepu, Mark Roe, Julio Rotemberg, Abbie Smith, Debora Spar, Per Stromberg, and seminar participants from the University of Pennsylvania (Wharton), University of Southern California, University of Chicago, Georgetown University, and Harvard Business School for helpful comments. We also gratefully acknowledge financial support from Division of Research, Harvard Business School, the Center for Research on Security Prices and the George Stigler Center at the University of Chicago.

1
Traditional finance assumes that all common stock has been created equal and each shareholder receives
the same payoff per share owned. In the last twenty years, however, a different view has slowly gained
acceptance. According to this new view, a controlling shareholder can obtain some benefits that are not shared
by other shareholders (the so-called private benefits of control). From a modeling device (Grossman and Hart,
1980) the idea of private benefits of control has become a centerpiece of the recent literature in corporate
finance, both theoretical and empirical. In fact, the focus of the literature on investor protection and its role in
the development of financial markets (La Porta et al., 2000) is not on managerial agency problems, but on the
amount of private benefits that controlling shareholders extract from companies they run.
In spite of the importance of this concept, there are remarkably few estimates of how big these private
benefits are, even fewer attempts to document empirically what determines their size, and no direct evidence of
their impact on financial development. All of the evidence on this later point is indirect, based on the
(reasonable) assumption that better protection of minority shareholders is correlated with higher financial
development via its curbing of private benefits of control (La Porta et al. (1997)).
The lack of evidence is no accident. By their very nature private benefits of control are difficult to
observe and even more difficult to quantify in a reliable way. A controlling party can appropriate value for
himself only when this value is not verifiable (i.e., provable in court). If it were, it would be relatively easy for
non-controlling shareholders to stop him from appropriating it. Thus, private benefits of control are intrinsically
difficult to measure.
To be true, there are two methods to try to quantify them. The first one, pioneered by Barclay and
Holderness (1989), focuses on privately negotiated transfers of controlling blocks in publicly traded companies.
The price per share an acquirer pays for the controlling block reflects the cash flow benefits from his fractional
ownership and the private benefits stemming from his controlling position in the firm. By contrast, the market
price of a share after the change in control is announced reflects only the cash flow benefits non-controlling
shareholders expect to receive under the new management. Hence, as Barclay and Holderness (1989) have
argued, the difference between the price per share paid by the acquiring party and the price per share prevailing
on the market reflects the differential payoff accruing to the controlling shareholder. In fact, after an

2
adjustment, this difference can be used as a measure of the private benefits of control accruing to the controlling
shareholder.
The second method relies on the existence of companies with multiple classes of stock traded, with
differential voting rights. In this case, one can easily compute the market value of a vote (Lease et al. 1983 and
1984, De Angelo and De Angelo, 1985). On a normal trading day market transactions take place between non
controlling parties, who will never have direct access to the private benefits of control. Hence, the market value
of a vote reflects the expected price a generic shareholder will receive in case of a control contest. This in turn is
related to the magnitude of the private benefits of control. Thus, if one is willing to make some assumptions on
the probability a control contest will arise, the price of a voting right can be used to estimate the magnitude of
the private benefits of control (Zingales (1994) and (1995a)).
In this paper we use the Barclay and Holderness (1989) method to infer the value of private benefits of
control in a large (39) cross section of countries. Based on 412 control transactions between 1990 and 2000 we
find that that on average corporate control is worth 14 percent of the equity value of a firm, ranging from a –4
percent in Japan to a +65 percent in Brazil. Interestingly, the premium paid for control is higher when the buyer
comes from a country that protects investors less (and thus is more willing or able to extract private benefits).
This and other evidence suggest that our estimates capture the effect the institutional environment has on private
benefits of control.
Given the large number of transactions from countries with different levels of financial development in
our dataset, we are able to provide a direct test of several theoretical propositions on the effects private benefits
of control have on the development of financ ial markets. Theory predicts that where private benefits of control
are larger, entrepreneurs should be more reluctant to go public (Zingales, 1995b) and more likely to retain
control when they do go public (Zingales (1995b) and Bebchuk (1999)). In addition, where private benefits of
control are larger a revenue maximizing Government should be more likely to sell a firm through a private sale
than through a share offering (Zingales, 1995b, Dyck ,2001).
We find strong evidence in support of all these predictions. A one standard deviation increase in the size
of the private benefits is associated with a 48 percent reduction in the ratio of external market capitalization of

3
equity to GNP, a 6 percent reduction in the percentage of equity held by non-controlling shareholders, and a 35
percent increase in the number of privatized companies sold in private negotiations rather than through public
listing. This evidence gives support to the prominent role private benefits have come to play in corporate
finance.
While the existence of private benefits is not necessarily bad, their negative effect on the development
of security markets raise the question of what affects their average size across countries. Thus far, the literature
has emphasized the law as the primary mechanism to curb private benefits by giving investors leverage over
controlling shareholders. The right to sue management, for instance, limits the discretionary power of
management and, with it, the ability to extract private benefits (Zingales (1995a)) and so does any right
attributed to minority shareholders (La Porta et al. (1997)). A common law legal origin is likewise argued to
constrain management by lowering the standard of proof in legal suits and increasing the scope of management
decisions subject to judicial review (Johnson et al (2000)). Empirical examinations have consequently focused
almost exclusively on the presence of laws, their enforcement and information that makes it possible for
investors to use legal mechanisms to penalize abusive behavior.
While we consider the importance of legal institutions, we depart from this literature in not assuming
that legal institutions are the only or necessarily the most binding constraints controlling shareholders face in
extracting private benefits. In fact, business decisions have a degree of arbitrariness difficult to eliminate, which
constrains courts’ willingness and ability to interfere in decisions that can produce private benefits. Therefore, it
is possible that reputational or moral considerations (Coffee (2001), Dyck (2000)), or institutions not focused on
shareholder rights, play a role in limiting the consumption of private benefits.
Accordingly, we analyze whether extra legal institutions, which theory suggests could limit private
benefits, are also associated with lower measured private benefits, both by themselves and after controlling for
legal institutions. We begin our analysis by focusing on three extra-legal institutions prominent in the literature:
the potential to limit private benefits through external product market competition, through internal pressures
from organized labor, and through the internal policeman of moral norms.
Shleifer and Vishny (1997), for example, recognize the potential for product market competition to limit

4
private benefits by reducing rents available to be diverted. As Roe (2001) notes, the extent of rents is not driven
just by industrial characteristics but by national characteristics, such as the enforcement of competition laws,
that leave firms within a country with more rents to be distributed.
Others have looked inside the firm for constraints on controlling shareholders, with labor attracting
some attention as a potential policeman to monitor controlling shareholders and stop diversionary activities.
Labor is well positioned to monitor having non legal leverage over the controlling shareholder through the
ability to penalize insiders through threats of work stoppages and in some cases direct channels to stop activities
through their position on the board. But labors’ incentives and ability to reduce private benefits cannot be
assumed, as labor could combine with the controlling shareholder against the interests of outside investors
(Pagano and Volpin (2000)) and may not have access to information to identify many diversionary practices.
Yet others have seen potential restraint on private benefits coming neither from legal punishment for
appropriation, nor penalties from other interest groups delivered through non-legal channels, but rather from
moral concerns of the controlling shareholder. Coffee (2001), for instance, highlights the potential internal
policeman of moral norms, suggests that they account for the fact that Scandinavian countries have well
functioning financial markets in spite of weak formal protections for investors. Stulz and Williamson (2001)
make a related argument about the possibility that culture, defined as “a system of beliefs that shape the actions
of individuals in society,” may also play a role in determining managerial actions.
We test for the association with these extra legal institutions and private benefits and go further to
examine the potential impact of the press, and the government through its role in enforcing corporate taxation
laws.
Reputation is a powerful source of discipline, and being ashamed in the press might be a powerful
deterrent (Zingales, 2000), especially where the press is more diffused. The potential role of the press has been
highlighted in several notable success stories for investor activists in both developed and developing countries
but has, to our knowledge, largely been ignored in empirical examinations of corporate governance.1
1 Djankov et al (2001) analyze media ownership and its correlation with the performance of several macro institutions, but they do not look at the diffusion of the press, nor at its effect on corporate governance.

5
The government also has powers beyond the ability to pass and enforce protections for investors that
might limit diversion. We think the taxation system plays an important, and thus far ignored, role. Tax authority
and minority shareholders have a common objective: to verify the income produced by a corporation. In
performing this verification role, the tax author ity can directly reduce private benefits by identifying and
disallowing diverting practices, such as the notorious examples in Russia where companies have sold oil to
offshore companies completely controlled by controlling shareholders at below market prices (Black, Kraakman
and Tassarova (2000), Federov (2000)). In short, effective tax enforcement has features of a public good in that
it can reduce private benefits of control.
We test these alternative theories, both separately and one against the other, at least within the scope
allowed by the limited degrees of freedom available. We provide direct support for the contention that legal
protections can limit private benefits, finding that a high degree of statutory protection of minority shareholders
and high degree of law enforcement are associated with lower levels of private benefits of control. This direct
evidence complements the existing body of evidence that is primarily anecdotal (Zingales (1995a), Johnson et al
(2000)) or indirect (La Porta et al., 1997).
But we also find that extra-legal protections are associated with lower private benefits of control,
particularly a high level of diffusion of the press, a high rate of tax compliance, and a high degree of
enforcement of competition laws. A crude R-squared test suggests that these extra legal mechanisms have at
least as much explanatory power as the ones commonly mentioned in the literature. In fact, in a multivariate
analysis newspapers’ circulation and tax compliance seem to be the dominating factors.
While the multi collinearity of our institutional variables limits our ability to disentangle the institutional
forces in a definitive way, it does suggest that there are no empirical grounds for ignoring extra legal
mechanisms and their potential to limit private benefits. Our results also suggest that the contention arising from
the existing literature that legal reform is a necessary step for financial market to flourish might be premature.
Extra legal mechanisms appear to be at least as important as legal ones. While changing the legal system might
require a long period of time, improving the corporate taxation system is well within the range of feasible
reforms. If this is indeed an alternative mechanism by which private benefits of control can be curbed and

6
financial markets fostered, the benefits of financial development might be within reach for many more countries.
Our paper complements and expands the existing work in this area that focuses on the voting premia
such as Zingales (1998), who assembles estimates of the voting premium across seven countries, and Nenova
(2000), who uses the price of differential voting shares in 18 countries. We complement the existing work by
providing an alternative estimate of the private benefits of control, available for a broader cross section of
countries. While in a few cases our estimates differ from Nenova’s (she finds that both Brazil and Australia have
a ratio of value of control to value of equity equal to 0.23, while we find only 0.02 for Australia and 0.65 for
Brazil), overall our estimates are remarkably similar. Moreover, we are able to understand the differences
between the two sets of estimates in terms of a sample selection bias present in estimates based on differential
voting shares. These findings give confidence that the extraction of private benefits is a real phenomenon,
which can be consistently estimated.
Our paper also expands the existing work. The estimates for 39 countries allow us to test several
theoretical propositions on the effects private benefits of control have on the development of financial markets.
While Zingales (1998) focuses on the correlation of private benefits with accounting standards and Nenova
(2000) focuses on legal protections, our larger sample of countrie s enable us to test alternative theories of the
major factors driving the magnitude of private benefits of control and to identify some new ones.
The rest of the paper proceeds as follows. Section II discusses how the measure developed by Barclay
and Holderness (1989) relates to the magnitude of the private benefits of control. Section III describes the data
used and presents our estimates. Section IV uses these estimates to test several theoretical predictions regarding
the effects private benefits of control have on the development of markets. Section V analyzes the correlation
between the magnitude of the private benefits of control and the various institutional characteristics. Section VI
discusses our findings and concludes.
II – Theoretical Framework
II.1 What are private benefits of control?
The theoretical literature often identifies private benefits of control as the "psychic" value some

7
shareholders attribute simply to being in control (e.g., Harris and Raviv, 1988; Aghion and Bolton, 1992).
Although this is certainly a factor in some cases, it is hard to justify multimillion dollars premia with the pure
pleasure of command. Another source of private benefits of control is the perquisites enjoyed by top executives.
The use of a company's money to pay for perquisites is the most visible but not the most important way
in which corporate resources can be used to the sole (or main) advantage of the controlling party. If the law does
not effectively prevent it, corporate resources can be appropriated by the large shareholder through outright
theft. Fortunately such activities, while documented in a few cases, are generally rare.
Nevertheless, there are several reasons why more moderate versions of these strategies might be more
pervasive. Educated economists can legitimately disagree on what is the "fair" transfer price of a certain asset or
product. As a result, small deviations from the "fair" transfer price might be difficult or impossible to prove in
court. If these small deviations are applied to large volume trade, however, they can easily generate sizeable
private benefits. Similarly, it is easy to disagree over who is the best provider of an asset or product when the
relationship might involve considerations of quality and price.
Or consider the value of the information a corporate executive acquires thanks to his or her role in the
company. Some of this information pertains directly to the company's business while some reflects potential
opportunities in other more or less related areas. It is fairly easy for a controlling shareholder to choose to
exploit these opportunities through another company he or she owns or is associated with, with no advantage for
the remaining shareholders. The net present value of these opportunities represents a private benefit of control.
The common feature of all the above examples is that some value, whatever the source, is not shared
among all the shareholders in proportion of the shares owned, but it is enjoyed exclusively by the party in
control. Hence, the name private benefits of control.
Control does not only confer benefits: sometimes it involves costs as well. Maintaining a controlling
block, for instance, forces the largest shareholder to be not well diversified. As a result, it might value the
controlling block less. At the same time, a fledging company might inflict a loss in reputation to the controlling
party and, in some extreme cases, even some legal liabilities. For this reason we do not necessarily expect all our

8
estimates to be always positive. In particular, we expect a higher frequency of negative value of control for
financially distressed companies (see also Barclay and Holderness, 1989).
Note that the existence of private benefits of control is not necessarily inefficient. First of all, private
benefits might be the most efficient way for the company to capture some of the value created. Imagine, for
instance, that a corporate executive acquires valuable information about investment opportunities in other lines
of businesses, which the company cannot or does not want to pursue. The executive could sell this information
in the interest of shareholders. But the price she will be able to fetch is probably very low. Thus, it might be
efficient that the executive exploits this opportunity on her own. Second, even if the extraction of private
benefits generate some inefficiency, their existence might be socially beneficial, because their presence makes
value-enhancing takeovers possible (Grossman and Hart (1980)).
Given the difficulties in distinguishing whether private benefits are socially costly, consistently in this
analysis we will shy away from any welfare consideration. Even the implications of the effects of private
benefits on the development of security markets should be interpreted as a positive statement, not a normative
one. In fact, in at least one of the models from where these implications are derived (Zingales, 1995b), the level
of private benefits has no efficiency consequences, but only distributional ones.2
II.2 How to measure private benefits?
Unfortunately, it is very difficult to measure the private benefits directly. As argued above, a
controlling party would find it possible to subtract corporate resources to his or her benefit only when it is
difficult or impossible to prove that this is the case. In other words, if private benefits of control were easily
quantifiable, then those benefits would not be private (accruing only to the control group) any longer because
outside shareholders would claim them in court.
Nevertheless, there are two methods to try to assess empirically the magnitude of these private benefits
of control. The first one, pioneered by Barclay and Holderness (1989), is simple. Whenever a control block
changes hands, they measure the difference between the price per share paid by the acquirer and the price
quoted in the market the day after the sale's announcement. As we will show momentarily, this difference

9
(which we shall call the control premium) represents an estimate of private benefits of control enjoyed by the
controlling party.
The second method of estimating the value of private benefits of control uses the price difference
between two classes of stock, with similar or identical dividend rights, but different voting rights. If control is
valuable, then corporate votes, which allocate control, should be valuable as well. How valuable? It depends on
how decisive some votes are in allocating control and how valuable control is. If one can find a reasonable
proxy for the strategic value of votes in winning control - for example in forming a winning coalition block -
then one can infer the value of control from the relationship between the market price of the votes and their
strategic role. This is the strategy followed by Rydqvist (1987), Zingales (1994 and 1995a) and Nenova (2000).
Both methods have pluses and minuses. We choose the first one for two main reasons. First, dual class
shares are not allowed in every country. Thus, choosing the second method would severely limit the number of
countries that can be included in the study. Second, the number of companies that choose to have dual class
shares in the countries that allow them to is not equal across countries. Thus, the estimates obtained using the
second method represent a different universe of companies. Since the decision to have dual class stock is a
company’s choice, the sample available is selected. This bias can distort international comparisons.
Last but not least, the estimates obtained with the first method are more model free. If we are careful in
isolating only the transactions that transfer control, we do not have to worry about the proper model of how
private benefits will be shared among different parties and what is the probability of a takeover.
II.3 Theoretical relation between control premium and size of the private benefits of control
Let λ, on the interval [0,1], be the bargaining power of the controlling shareholder selling out, bsB, the
level of private benefits extracted by the seller (buyer), and bsY, the level of security benefits generated by the
seller (buyer), then the price P paid for a controlling block of shares with α cashflow rights, on the interval
[0,1], is
2 Bebchuk and Jolls (1999) discuss additional issues associated with a welfare evaluation of private benefits.

10
(1) ))(1()( ssbb YBYBP αλαλ +−++=
and the per share price of the controlling block equals
(2) sbsb YY
BBP)1(
)1(λλ
αλλ
α−++
−+= .
To compute the control premium Barclay and Holderness (1989) subtract from (2) the price prevailing in the
market after the announcement that control has changed hands, which should equal to bY . Thus, they obtain
(3) ))(1()1(
sbsb YY
BB−−−
−+λ
αλλ
.
They then multiply this price difference by the size of the controlling block α. Hence, their estimate of private
benefits of control B̂ is
(4) ))(1()1(ˆsbsb YYBBB −−−−+= λαλλ .
In a perfectly competitive market (λ =1) B̂ collapses tobB and thus the control premium is a legitimate estimate
of the private benefits of control the buyer expects to enjoy. When the market is not perfectly competitive, B̂
represents a weighted average of the private benefits of the seller and those of the buyer, adjusted for the
difference in their security value.
To grasp the sense of this correction, let consider the extreme situation where the buyer has all the
bargaining power and thus buys the controlling block at the seller reservation value ( ss Y
BP+=
αα). In such a
case the proper adjustment factor would be the market price before the announcement of the change in control.
As a result, B̂ calculated as in (4) will tend to underestimate the average private benefits of control enjoyed by

11
the controlling party whenever sb YY > . Hence, the need for a correction.
III – Data and Descriptive Statistics
An example motivates our sample selection strategy and definition of our dependent variable. In
January 1999 Ofer Brothers Investment limited, an investment vehicle for Sami and Yuli Ofer of Israel, bought
53% of the shares and control of Israel Corporation limited from the Eisenberg family. The price per share for
the control block was reported to be 508 shekels per share while the exchange price after announcement of the
transfer was 363 shekels per share. The price premium paid per share for the controlling block over the post
announcement price in this case is 40 percent. A better measure of the value of the private benefits of control is
the total premium paid divided by the equity value of the firm. In this example, the Ofer brothers paid a 40
percent premium relative to the post announcement price for 53% of the firms’ equity, which produces an
estimate of private benefits as a percentage of equity of 21%. This example turns out to be fairly typical of
Israeli deals where we calculate a mean private benefit as a percentage of equity of 27% and a median value of
21%.
As suggested by this example, to construct a measure of private benefits we need to identify transactions
that meet at least three criteria. First, the transaction must involve a transfer of a block of shares that convey
control rights. Second, we need to observe the price per share for the control block. Third, we have to observe
the exchange price after the market has incorporated the identity of the new acquirer in its expectation of future
cash flow. We also add a fourth criteria, implicit in this choice of an Israeli deal – both the control and the post
announcement market prices should not be restricted by regulation. Many countries do not follow the Israeli
(and US) approach of allowing buyers and sellers to determine their own prices but impose some link between
the exchange and the control price. As we will explain, we will eliminate all these cases from our sample.
III.1 Identifying transactions
To identify transactions that convey control rights we use the SDC international mergers and
acquisitions database. SDC describes its sources as: “Over 200 English and foreign language news sources, SEC

12
filings and their international counterparts, trade publications, wires and proprietary surveys of investment
banks, law firms and other advisors.” The database provides extensive information on transactions that involve
transfers of blocks of shares that may convey control, including details of the parties to the transaction, the value
of the transaction, and the date of announcement and conclusion of the transaction. SDC provides extensive
international coverage with 7,144 transactions in 1990 (including 396 transactions from non OECD countries)
and steadily increasing numbers over the decade, including 21,881 transactions in 1999 (including 3,300 from
non-OECD countries).
To identify candidates for control sales we began with the complete set of control transactions from
1990-2000 and then restricted our attention to completed purchases of sizable blocks in publicly traded
companies that could convey control. In particular, we define as potential candidates for control transfers any
transaction that results in the acquiror moving from a position where they hold less than 20 percent of the shares
to a position where they have assembled more than 20 percent of the shares. We exclude all transactions that
were conducted through open market purchases and were identified by SDC as tender offers, spinoffs,
recapitalizations, self-tenders, exchange offers, repurchases and acquisitions of remaining interest. We further
restricted ourselves to transactions where there was a reported transaction value or price per share in the control
block.
We refined our sample by exploiting additional available qualitative data to screen out transactions that
do not involve control transfers (e.g. transfer of shares among subsidiaries of common parent, where acquiror is
not the largest shareholder) or were problematic for other reasons (e.g. involved related parties, reported price
per share based on securities that could not be valued objectively, transfer involved the exercise of options).
This step involved reading multiple news stories for every transaction resulting from searches of Lexis-Nexis
and Dow-Jones Interactive to confirm the details of the transaction collected by SDC and collecting ownership
information through use of company annual reports and other sources. This process significantly increased our
confidence in the observations included in the dataset but inevitably involved greater use of discretion in
determining whether an observation was included in our data set.

13
To ensure the availability of exchange prices we restricted ourselves to transactions involving
companies available in the Datastream International database. To implement the criterion that the difference
between the control price and the exchange price not be driven by legal requirements, we excluded observations
driven by legal requirements. We first excluded all instances where the controlling block was purchased as part
of a public offer, as in this circumstance there are usually laws that require all shareholders be treated equally.
We researched rules regarding mandatory tender offers across different countries and only include transactions
where there is no forced linkage between prices for the control block and prices on the exchange. For example,
in Britain where the city code on takeovers requires that those who purchase a stake greater than or equal to 30%
of the shares make an equal offer to all remaining shareholders on the same terms as the block sale, we restrict
our attention to block sales less than 30 percent. As an illustration of the importance of this legal threshold, more
than one quarter of our observations are between 29 and 30 percent, with a median block size of 25 percent.
Table I summarizes our variable definitions and sources. The data appendix provides a more complete
description of the construction of our sample. Appendix Table 1 lists countries and rules regarding control
transactions. Appendix Table 2 lists the number of equities available for Datastream in each sample year from
each of our countries.
III.2 Descriptive Statistics of the Raw Control Premium
Table II presents descriptive statistics of the block premia from our sample by country in which the
acquired firm is located. After imposing our criteria we have an unbalanced panel of 412 observations from 39
countries for the time period 1990-2000. 3 The sample includes more than 40 observations from active equity
markets such as the United Kingdom and the United States. For some countries despite looking at the full
population of control transactions available in SDC we have relatively few observations as a result of the
combination of weak coverage by Datastream, few reported prices for control sales, and limited observability of
control premia as a result of laws regarding tender offers in case of control sales. The rank ordering of countries
3 We only include countries in our analysis if there were 2 or more transactions over our sample period. The final sample is based on all of the data available over the 10 year sample period for every country aside from the US. For the US, there were many more potential observations and we limited ourselves to an initial sample based on the first 20 transactions for each calendar year over our 10 year sample period that met our sample selection criteria.

14
by control premia is very similar using mean and median values suggesting that our results are not driven by a
few outliers. Table III reports several characteristics of the deals that we will use later in our empirical analysis.
The first column of Table IV presents the average control premium ( B̂ calculated as in (5) normalized
by bY) by country. Overall the average control premium is 14 percent if each country has an equal weight and 10
percent if each observation receives equal weight. In 10 of our 39 sample countries we find that the control
premia exceeds 25 percent of equity value. These high private benefit countries include Argentina, Austria,
Colombia, the Czech Republic, Israel, Italy, Mexico, Turkey, Venezuela, and Brazil, which has the highest
estimated value of 65 percent. At the other extreme, we have 14 countries where private benefits are 3 percent
of the value of equity or less. These low private benefit countries include Australia, Canada, Finland, France,
Hong Kong, Japan, Netherlands, New Zealand, Norway, Singapore, South Africa, Taiwan, the United Kingdom,
and the United States.
As Table III shows, the difference between the security value produced under the buyer and under the
seller on average is a positive 6 percent. Hence, according to equation (5), B̂ underestimates the value of private
benefits. Table IV (column 2) presents our estimates of the control premium after adjusting for the difference in
security benefits (b
sb
b YYY
YB )(
)1(ˆ −
−− αλ ). In this expression only λ is unobservable. In principle, λ is a transaction-
specific variable that depends upon the buyer’s and of the seller’s characteristics. In order to estimate it,
however, we restrict it to be equal across all transactions. Our estimate of (1- λ ) is 0.368, statistically different
form zero at the 10 percent level. Not only does this estimate lie in the [0,1] interval, as predicted by the model,
but it is also very reasonable. It suggests that the on average the seller captures two thirds of the gains from
trade.
After we make this adjustment, a few countries see the average estimated private benefits of control
increase. For example, the estimate for the United States goes from 1.8 to 3.5 percent. The overall ranking,
however, remains substantially unchanged.

15
III.3 Differences in deal and firm characteristics
Cross-country differences in the level of private benefits could be driven by systematic differences in
deal characteristics and firm characteristics. To increase confidence that our estimates of block premia reflect
country differences rather than other characteristics, we generate revised estimates based on a regression of our
raw data against firm and deal characteristics.
Differences in the extent the block carries control
First of all, we assume that all transactions transfer absolute control. This is probably incorrect. The
transfer of a 20% block does not carry the same amount of control as the transfer of a 51% block. Similarly, the
transfer of a 30% block when there is another shareholder controlling 20% carries less control than the transfer
of the same block when the rest of the shares are dispersed. Thus, per given size of private benefits control
blocks above 50% are likely to fetch a higher price. Similarly, the presence of another large shareholder (a stake
in excess of 20 percent) should reduce the premium. 4
In our sample 27 percent of the transactions involve sales that exceed 50 percent of the votes and in 16
percent of the cases the acquirer has to deal with another large shareholder with more than a 20 percent stake.5
As shown in Table IV, ceteris paribus an absolute majority of votes increases the value of a controlling block by
9.6 percent of the total value of equity, significant at the 1 percent level. Contrary to expectations, the presence
of another large shareholder has a positive effect on the premium, but this is not statistically significant.
Differences in the extent of the seller’s bargaining power
In estimating the private benefits of control, we assumed that the seller’s bargaining power is constant
across deals. Variation in the seller’s bargaining power will affect our estimates of the private benefits of
control: per given size of private benefits of control, the lower the seller’s bargaining power, the lower our
estimates.6 We try to control for these differences with three proxies.
4 In Canada and Australia we used 15 percent since exceeding 20 percent would trigger a mandatory offer for remaining shares. 5 An alternative approach to identify the likelihood that a stake brings control is to calculate a Shapley value associated with control. Unfortunately, we were not able to collect information on a consistent basis of the ownership status of other shareholders. For example, some countries might report the presence of all shareholders with stakes that exceed 5% while other countries might only report holdings that exceed 10 percent or higher. 6 The higher the seller’s bargaining power, the more she will be able to extract per given value, thus the higher will be the price per share paid for the controlling block and, hence, our estimate of the private benefits of control.

16
First, if the company is in financial distress, the seller is more likely to be forced to sell. Hence, her
bargaining power is smaller. As a proxy for financial distress, we create a dummy variable that takes value 1 if
earnings per share are zero or negative in the year of the block trade or the year preceding the block trade.7 In
our sample 26 percent of the firms are in financial distress in the year of the block trade and 22 percent in the
year preceding the block trade. As expected, firms in financial distress exhibit a control premium that is 5.5
percentage points lower. This effect is statistically significant at the 5 percent level.
Similarly, that the acquisition of a controlling block takes the form of an equity infusion probably
indicates that a company needs to raise equity, a sign of a weak bargaining position. We insert a dummy if the
block was formed by newly issued equity (16 percent). This method is particularly diffused in Japan where in a
majority of cases control is transferred by a financially distressed company via a private placement of newly
issued equity. This clustering underscores the importance of controlling for industry firms’ and deals’
characteristics, to avoid attributing to the Japan institutional framework a feature due to the particular economic
phase Japan has been going through during our sample period. Contrary to expectations, the fact a block was
created through a new equity offering has a positive effect on the premium, but this is not statistically
significant.
Finally, foreign acquirers generally face more competition (at the very least because the fact they are
involved implies the transaction is open to foreign buyers and thus there is a larger pool of potential acquirers).
Thus, the bargaining power of the seller in these transactions is likely to be bigger. We find that foreign buyers
pay a premium of 6 percent that is statistically significant at the 10 percent level.
Estimates of private benefits controlling for differences in deals’ and firms’ characteristics
At the bottom of column 3 of Table IV we report the estimates of the country average level of private
benefits after we control for the above differences in deal and firm characteristics. Since many of the control
variables included capture part of the value of control, the country fixed effects alone are not any more a good
estimate of the absolute level of private benefits. Hence we focus on the relative rankings. Including these
controls dramatically lowers the ranking for countries characterized by higher than average incidence of foreign
7 While other measures of cash flow are preferable, earnings per share is one of the few data items consistently reported in Datastream for the companies in our database.
17
acquirors and sales of majority stakes like Germany, Switzerland, Egypt, and Poland. In a way this is an
improvement over our raw data, for it keeps constant deal characteristics.
On the other hand, these estimates suffer from an econometric problem. To estimate the impact of these
deal and firm characteristics we had to impose that this impact is constant across countries. In some cases this
assumption might be untenable. Imposing a similar effect throughout the results reported in column 3 might
underestimate differences across countries. In fact, the difference between acquiring a 51 percent stake rather
than a 30 percent one might be huge in a country where private benefits of control are large, but it might be
small or even irrelevant in a country where the private benefits of control are very tiny. 8 The regression,
however, imposes the same effect to all the countries.
In the rest of the paper, where we explore the effects and causes of these cross-country differences, we
focus on a refined measure that incorporates controls to keep constant deal (and other) characteristics. But
recognizing that these deal characteristics may not be constant across countries, we also test and report results
without controls.
III.4 Differences in industry and buyer/seller characteristics
Cross country differences could also arise because of other differences in industry and deal
characteristics. Private benefits might differ across industry. The media industry, for instance, is often
mentioned (Demsetz and Lehn (1985)) as an industry where private benefits are larger. Similarly, individuals
might value opportunities to consume prerequisites more highly than corporate blockholders (see e.g., Barclay
and Holderness, 1989). We want to make sure our cross country comparison is not affected by any systematic
difference in the industry characteristics of the deals or the nature of the seller and the buyer. For this reason we
re-estimate the country averages, controlling for differences in industry characteristics and identity of the
controlling party.
8 Since we have enough observations for the United States (47), we can assess the realism of our assumption by estimating the same specification restricted to U.S. data. While the other coefficients are very similar to the ones reported in Table IV, the coefficient of the majority block dummy is small and insignificant. “Imposing” to the Unites States the same majority dummy effect than other countries, thus, will distort its average level of private benefits upward.

18
To capture industry differences we introduce an industry dummy based on the two-digit SIC code of
the acquired firm. About three quarters of our transactions are accounted for by manufacturing (39 percent),
finance insurance and real estate (23 percent) and services (10 percent). In a crude way these controls capture
differences in private benefits linked to product market competition. Second, we construct a measure of
tangibility of assets (percentage of total assets that are fixed) based on the three digit SIC code the acquired firm
belongs to. The argument for this control is that insiders will have more difficulty diverting resources if assets
are tied down and easily observable, as is the case with tangible assets. To avoid potential endogeneity
problems we use US averages (see Rajan and Zingales (1998))9.
Table IV column 4 shows that firms with more tangible assets have lower private benefits and the
industries of wholesale trade, finance( financial, insurance, and real estate sector) and transportation and utilities
have higher level of private benefits than firms in manufacturing, although these results are not significant.
Including both types of industry controls in a sense overcontrols for industry effects, with tangibility (coefficient
= -.11, pvalue=.033) and financial industry (coefficient = .076, pvalue=.019) being significant in regressions that
include these industry variables separately (not reported).
We also collected information on the identity of the acquirer and the seller. To identify characteristics of
the seller, we focus exclusively on the news stories, identifying whether the seller is an individual, the company
itself (through new share issues), a corporate entity, or unknown. Here we find the most common seller to be a
corporation, followed next by individuals (18 percent), new share issues (16 percent), unidentified (8 percent)
and the government (3 percent). We use SDC data to identify whether the acquirer is a public company,
subsidiary, the government, or a private company. The typical transaction in our sample involve a public
acquirer (42 percent), although private acquirers are also very common (40 percent). We provide a further
classification using news stories and the SDC synopsis fie ld. We identify 13 percent of our transactions
involving an individual acquirer, using as our criteria whether the stories mention the name of an individual or if
the private company involved is identified with a particular individual. We also identify 4 percent of
transactions involving a financial intermediary who purchases the shares and then resells the shares to
9 We derive US measures in a two-step procedure. First, we computed the average ratio of fixed assets (property plant and equipment) to total assets for all companies that in each three digit SIC-code for the period 1990-1999. Then we took the median value across all companies. We then impute this value for all of the companies in our sample.

19
institutional investors. We interpret these acquisitions as the dispersal of the controlling stake. None of these
buyer or seller characteristic turns out to be significant.
At the bottom of column 4 of Table IV we report the estimates of the country average level of private
benefits after we control for the above differences in level of private benefits across industries. The relative
ranking, however, does not seem to be affected very much by these industry controls.
III.5 Alternative Interpretations
Thus far, we have interpreted block premia as indicative of private benefits. Yet, there are alternative
interpretations that we need to consider. The most important alternative interpretation, already considered and
rejected by Barclay and Holderness (1989) in the U.S. sample, is that control premia arise from a systematic
overpayment, possibly due to a winner’s curse problem.
As in Barclay and Holderness (1989) we check for this possibility by looking at the announcement
effect on the stock price of the acquiring company. If these premia reflect overpayments, acquiring firms should
experience negative returns at the announcement of the transaction. In our sample we have 203 observations
where the acquirer is a publicly traded company and the stock price is reported in Datastream for 125 of those.
Table V presents the results of our analysis. Inconsistent with the overpayment hypothesis, the mean value of
the announcement effect is slightly positive (0.5 percent) and not statistically different from zero.
Another implication of the overpayment hypothesis is that the buyer’s announcement return should be
negatively related to the size of the control premium. In Table V, panel B we regress the acquirors’ cumulative
abnormal returns around the transaction on the raw control premium. We focus on a 16 day event window (t-8 to
t+7) to allow for information about the transaction to be leaked in advance or to be communicated slowly ot the
market although results are not significantly affected by the choice of window. The coefficient is indeed
negative, but is neither economically nor statistically significant (coefficient of –0.018, p-value of 0.64).
The results above reject the hypothesis that on average the control premium is due to overpayment. It is
still possible, thus, that this might be true in some countries. In particular, we are concerned that in less
developed countries, where there is more uncertainty about the value of a company, the winner’s curse is more

20
severe leading to a higher apparent premium and distorting our international comparisons. While such a
behavior is inconsistent with a rational bidding process (Milgrom and Weber, 1982), we still want to ensure it is
not present in the data.10 As a measure of the degree of company-specific information available we use the
synchronicity measure developed by Morck, Yeung and Yu (2000). This is a measure of how much stock prices
move together. The more they move together, the less company-specific information is revealed. If there is more
overpayment in less developed markets, we should observe that the control premium is more negatively
correlated with the acquirer’s return in country with a high level of synchronicity. In fact, the interaction
coefficient is positive and not statistically significant.
A second alternative interpretation that could potentially explain a larger premia in underdeveloped
markets is that the buyer has superior information and there is a delay in incorporating new information. On
average delays in adjusting will spuriously inflate our estimates of private benefits. To test for this possibility
we re-estimated the private benefits using the market price 30 days after the announcement rather than 2 days
after. The results (nor reported) are virtually identical. If anything, the average premium in developing countries
like Brazil go up rather than down. We also examined the cumulative abnormal returns to shareholders in target
firms from 2 days to 30 days after the announcement and tested whether the initial level of private benefits was
related to the subsequent cumulative abnormal returns. We found no such effect with an insignificant
relationship between control premia and post announcement returns (coefficient= .009, pvalue=.80).
Another alternative interpretation focuses on liquidity differences between developed and less
developed markets. Differences in liquidity cannot explain our findings either. While a lack of liquidity reduces
the willingness to pay for shares on the exchange and this effect is more pervasive in less developed markets, the
lack of liquidity also impacts the price that is paid for large blocks. Large non-controlling blocks generally sell
at a discount to the exchange price (Holthausen et al., 1990) and the more so the more illiquid is the market for
the underlying stock. Thus, if the control value were zero there would be a bigger discount in less liquid markets
for large blocks. Thus liquidity differences suggest that if anything more underdeveloped countries should have
smaller block premia, not larger ones.
10 A rational bidder knows that if he bids his valuation he will overpay, the more so the more uncertainty there is about the fundamental value of the asset. Thus, the more uncertainty there is, the more he will shade his bid.

21
Finally, we are concerned of a possible distortion due to selective non-disclosure. In fact, one of the
criteria we had to impose to obtain our estimates was the observability of the price paid for the controlling
block. A worrisome possibility is that in countries with better protection of investors, controlling parties are
more fearful to disclose large premia. In such a case, we would estimate lower private benefits in the United
States, not because they are indeed lower, but because large premia are less likely to be disclosed.
To check for this possibility we compute the percentage of deals we have to drop because the terms are
not disclosed. On average, 33 percent of the deals do not disclose the terms, going from 0 percent in Taiwan and
other countries to 70 percent in Austria and 82 percent in the Czech Republic. Contrary to the selective
nondisclosure argument, we find that countries with higher premium tend to have a higher percentage of deals
that are not disclosed (correlation 0.2, not statistically significant). Similarly, if we use as a proxy of
shareholders’ protection the antidirector rights index constructed by La Porta et al. (1997), we find (not
surprisingly) that in countries that protect shareholders a greater percentage of deals are disclosed. In sum, if
selective non disclosure biases our results it biases them in the direction of attenuating the cross country
differences rather than amplifying them.
III.6 Are We Really Estimating Private Benefits?
While we can reject these alternative interpretations, what evidence do we have that our estimates
indeed capture private benefits of control?
At the anecdotal level, we have papers documenting the pervasiveness of self-dealing transactions in
countries like Italy (Zingales, 1994) and the Czech Republic (Glaeser et al., 2000). It is reassuring, thus, that our
estimated private benefits for these two countries are very high (respectively 37 percent and 58 percent). It is
particularly interesting to stress the difference between Poland and the Czech Republic. Both of them are former
socialist countries, with a similar level of GDP per capita. Nevertheless, our estimates are very different (11
percent for Poland, 58 percent for the Czech Republic).
At a more systematic level, if our measures reflect the different ability to extract private benefits in
different countries, they should be affected in predictable ways by country-specific institutions that restrict the

22
ability to extract private benefits. We will explore these implications in section V. One limitation with this
approach, however, is that it is difficult to separate specific institutions from a broad institutional context. A
more subtle test of whether these estimates really reflect the ability to extract private benefits is whether our
estimated private benefits depend not only upon the institutional variables of the country of the company whose
control has been acquired, but also on those of the country of the acquiring company (when this is different).11
In other terms, an acquirer coming form a country with less investor protection is better able to siphon out
corporate resources from a subsidiary than a company coming from a country with very rigid rules. This should
reflect in a higher willingness to pay and, in a non-perfectly competitive market, in a higher price. Thus, we
should observe higher estimated private benefits when the foreign acquirer comes from a country with poor
protection of investors.
For this reason in Table VI we re-estimate our basic specification (see Table IV) inserting as an
additional explanatory variable the difference between the level of anti-director rights of the country of the
acquiring company and that of the target company. As Table VI shows, companies coming from more investor
friendly countries pay on average 2.6 percent less for control, and this effect is statistically significant. In the
bottom of table VI we present country fixed effects with this control. In the next sections when we incorporate
controls we will use all of the controls included in this specification.
The finding is interesting per se within the context of the debate on corporate governance convergence.
Coffee (1999) predicts that companies from countries with better protection of investors will end up buying
companies from countries with weaker protection. Our result suggests that in the presence of controlling blocks
this might not be the case. Companies from countries with better investor protection are more limited in their
ability to extract private benefits and thus ceteris paribus are able to bid less for the controlling block. This
engenders the risk that controlling blocks may end up in the hands of companies from the countries with the
worst rules, not the best ones.
This finding that the owners’ identity (as reflected in the home country of the acquiror) is associated
with the extent of private benefits also provides one rationale for the approach in many privatizations of not
11 For example, Doidge et al. (2001) argue that foreign companies list in the United States to precommit themselves to extract less private

23
simply selling to the highest bidder and for the consistent finding in central and eastern Europe (Djankov and
Murrell (2000)) of superior returns for firms sold to foreigners (most from countries with higher levels of anti-
director rights than in the transition countries) after controlling for possible selection issues.
Comparing control premia measures
Another check that our estimates measure the value of control comes from comparing them with
estimates of the value of control obtained using different methods. The largest set of alternative estimates is
provided by Nenova (2000). By using differential voting shares, she estimates the value of control across 18
countries. Table VII (panel A) reports both her numbers and our numbers. In spite of the different method used,
there is a remarkable similarity in findings. Our estimates for countries like the United States, Switzerland and
Germany are identical, and the overall correlation between our measures is .59 for the raw measure and .55 for
the refined measure.12 There are, however, notable exceptions. Nenova finds that both Brazil and Australia have
a ratio of value of control to value of equity equal to 0.23, while we find only 0.02 for Australia and 0.65 for
Brazil. What can explain these differences?
One possibility is the sample selection in Nenova sample mentioned in the introduction. Companies are
more likely to issue dual class shares when private benefits of control are large (Grossman and Hart (1988),
Zingales (1995b)). Hence, a measure of private benefits of control based on the voting premium of companies
that issued dual class shares tends to overestimate the value of control. Most importantly, this upward bias is not
homogeneous across countries, but it is more severe the fewer the percentage of dual class companies in the
population of traded companies in a country. And this percentage varies widely across countries.
The final column in Table VII reports the percentage of dual class firms with prices available by
Datastream as a percentage of the total population of Datastream firms in the country in that year. In countries
that allow dual class shares, on average only 14 percent of the firms have two classes of shares traded. There is
a wide cross-sectional variation: Brazil has 59 percent of such firms, while Australia and the United Kingdom
have only 1 percent.
benefits of control. 12 If we exclude Brazil, an outlier, the correlation increases to .69 using the raw data and .81 using the refined data.

24
We test the possible effects of the sample selection described above by regressing the difference
between Nenova’s estimates and our estimates against the percentage of companies with two classes traded. If
there exists a bias, we expect Nenova’s estimates to exceed ours in countries with few dual class-stocks like
Australia and the United Kingdom (i.e., a negative coefficient in the regression). This is indeed what we find. In
countries where dual class shares are more rare Nenvova’s number significantly exceeds ours. The effect is
economically very important. A one standard deviation increase in the percentage of dual class shares leads
Nenova’s estimates to exceed ours by 22 percentage points.13 This variable alone explains 76 percent of the
difference in raw estimates and 57 percent of the difference in refined estimates.
Overall, these results give confidence that the Barclay and Holderness method to estimates private
benefits measures indeed private benefits (and not overpayment) and it does so introducing smaller biases than
the alternative method. That the two set of estimates differ in the way predicted by theory is also a strong
indication these estimates are indeed measuring the value of private benefits of control.
Having established some degree of confidence in our estimates, we now move to use them in
international comparisons.
IV – Effects of Private Benefits on Financial Development
IV.1 Theoretical Predictions
We have shown that the magnitude of private benefits of control varies greatly across countries. We have
not shown, however, that larger private benefits are necessarily more inefficient. Can we derive any implication
on the effects of larger private benefits of control on the development of financial markets that is independent of
their characterization as efficient of inefficient?
The answer is yes. In countries where a controlling party can appropriate a larger share of the value of a
company, entrepreneurs will be more reluctant to take their companies public. If they sell a minority position,
outside investors will be willing to pay less for it than what it is currently worth it to the entrepreneur, because
13 Using differential voting shares to estimate the value of control can induce also another bias. When ownership is highly concentrated, the price of voting shares tends to underestimate the value of votes, because control is securely held in the hands of the largest shareholder. There is some weak evidence this might be the case if we use Nenova’s (2000) raw estimates. Nenova (2000), however, is aware of this problem and in her regressions she controls for ownership concentration. Consistently, her refined measure seems completely unaffected by this bias.

25
they factor in the possibility a new acquirer will dilute the value of the company in the future. As a result,
entrepreneurs are reluctant to sell (Zingales, 1995b). At the same time, when control value is high they do not
want to sell a majority of votes in the market because they will not receive an adequate compensation for it.
Atomistic shareholders will pay for the voting rights they expect to receive in a future tender offer. If, as it is
likely to be the case, the market for corporate control is not perfectly competitive, atomistic shareholders will
receive less in a tender offer than what a controlling shareholder would have obtained in a private negotiation
(Zingales, 1995b). Hence, three implications follow:
1) Since fewer companies will list, in countries with high private benefits of control the importance of the
equity market relative to GDP should be smaller;
2) Since incumbents are more likely to retain control after they take their company public, in countries with
high private benefits of control the percentage of companies widely held should be smaller;
3) Since it is more profitable to sell control in a private negotiation, in countries with high private benefits of
control a revenue maximizing Government should prefer to sell control in private transactions rather than in
public offerings.
All these predictions are independent of the direct welfare implications of private benefits of control. In
fact, they are derived from Zingales (1995b), where private benefits of control have no efficiency consequences,
but only distributional ones.
IV.2 Test
In table VIII we test these three predictions using our private benefits measure as an independent
variable. We focus on our estimated country fixed effects from table VI. Since our explanatory variable is
estimated, OLS estimates are biased and inconsistent. Thus, we also report instrumental variable (IV) estimates,
where we use the family of origin of a country’s legal system as an instrument for the extent of private benefits.
As we show below in table XI, legal origin is highly correlated with our private benefit measure. All of the
reported results are robust to using the raw measure of private benefits from table II in place of the estimated
country fixed effects.

26
We begin by focusing on the relation between the size of private benefits and ownership concentration
(column 1). As a measure of ownership concentration that is available for almost all of the countries in our
dataset we use the percentage of equity controlled by the 3 largest shareholders in the 10 largest non financial
firms where the state is not a shareholder (La Porta et al. 1998). To control for other possible factors we insert in
all the regressions the log GDP per capita.
As predicted, countries with higher private benefits have more concentrated ownership. A one standard
deviation increase in the size of private benefits translates into 6 percent more of the equity held by the largest
three shareholders. This simple specification seems to have also a very high explanatory power (R**2 = 0.47).
In column 2 we test the effect of private benefits on the way firms are privatized. Our dependent
variable is the percentage of privatizations that took place as a private asset sale, rather than as a share offering
from Megginson, Nash, Netter and Poulsen, 2000. Asset sales almost always involve the sale of a majority (or
100 percent) of the shares to a controlling shareholder or group. Share offerings disperse ownership to a greater
extent. To control for other factors we include not only the per capita GDP, but also the importance of the
equity market, on the basis that governments are more likely to sell shares in a public offerings if the market is
more developed. 14
We find that in countries with large private benefits governments are more likely to divest companies
through private sales. A one standard deviation increase in the size of private benefits translates into 35 percent
more firms being privatized through private negotiations. These results are consistent with evidence from
privatizations in specific countries. In Brazil, for example, government interest in receiving the control premia
at the time of privatization led them to weaken existing protections for minority investors so that minority
holders of voting shares no longer had the right to an equal offer at the same price as the control block. In
Mexico, Lopez-de-Silanes (1997) reports that the price per share for sales that did not involve control were just
one quarter of the prices for sales of control blocks, helping to explain the fact that 87 percent of all sales in his
sample of Mexican firms involved sales of control.
In Table VIII, panel B we test the link between private benefits and capital market development,
beginning with the various aggregate indicators of financial development introduced by LaPorta et al (1997):

27
number of IPOs/population, the number of listed firms/population, the external market capitalization relative to
GDP, and the level of debt/GDP. Private benefits also explain a significant fraction of the cross sectional
variation in these measures. Our measure of private benefits is significant in all regressions with the exception
of the OLS specification with the number of listed firms, where the single data point of Israel, with an unusually
high level of number of firms, reduces our level of significance. All the regressions include log per capita GDP
as a regressor, to control for other possible factors.15 A one standard deviation increase in private benefits
translates into a 48 percent decline in the percent of external equity capitalization/GNP.
V - What Curbs Private Benefits of Control?
V.1 Theoretical Predictions
Since the extent of private benefits of control seem to matter for security market development, the
question of what curbs them becomes of central importance for any attempt to foster security market
development.
The prominent place of legal institutions in the current discussions on the causes of financial
development owes much to the influential survey of Shleifer and Vishny (1997) and the subsequent empirical
work by LaPorta et al. (1997, 1998,1999). Whereas the traditional law and economics literature suggested that
legal institutions were unlikely to influence firm behavior, as sophisticated investors and entrepreneurs could
anticipate difficulties and craft localized solutions to these problems (including opting out of national laws), this
new law and economics literature redirected attention to national institutions. Echoing a theme found in the new
institutional economics, the institution of legal rules is a constraint that can complement markets rather than
limit market transactions by affecting the bargaining over competing claims on the wealth of the corporation.
The evidence of systematic differences in legal rules and the correlation between these rules and
features of financial development has reinforced belief in the importance of institutions in general and legal
institutions in particular. We follow the literature and examine empirical proxies for the three most important
14 The results are robust to excluding this variable. 15 Similar results obtain if we follow LaPorta et al 1997 and include GDP growth to capture future growth prospects and log GDP to capture any economies of scale in financial development.

28
institutional dimensions of legal protections: legal leverage for minority shareholders, information to identify
abuse of legal protections, and expectations of enforcement where legal protections have been identified.
Legal institutions
i) The legal environment. The ability of a controlling shareholder to appropriate some of the value generated is
limited by the possibility of being sued. Thus, a greater ability to sue should translate into smaller private
benefits of control (Zingales (1995a)). The same reasoning applies to any legal right attributed to non-
controlling shareholders (La Porta et al., 1997). Accordingly, we examine the explanatory power of legal rights
that give minority investors leverage over insiders in firms focusing on the so-called anti-director rights index
developed by La Porta et al., 1997 and used by Pistor et al., 2000 for the transition countries. We focus our
attention on the level of shareholder rights in the country of the target firm. As seen above, we also examine the
impact of shareholder rights in the acquiror’s country based on the hypothesis that these might also constrain
private benefits (Dyck (2000)).
ii) Disclosure standards. Disclosure standards regulate the information available to non-controlling
shareholders. The more accurate this information is, the more difficult it is for a controlling shareholder to
appropriate value without incurring legal penalties or, at least, reputational costs. Thus, measures of quality of
disclosure should be negatively correlated with the size of private benefits of control.
iii) Enforcement The strength of legal protections depends upon the expectations of speedy and predictable
enforcement. Thus, we include as one of our contractual variables a measure of the strength of a country’s law
and order tradition as measured by the country risk rating agency International Country Risk. This rule of law
index is scaled from zero to ten.
Extra legal institutions
We examine the association of legal mechanisms with levels of private benefits but do not limit
ourselves to legally-focused institutions. As noted above, the possibility of extracting private benefits is
intrinsically related to managerial discretion, a discretion that courts cannot and even do not want to restrict (see

29
for example the business judgment rule in the United States). As a result, extra-legal institutional may play an
important role in constraining private benefits (Dyck (2000)) both in settings with legal protections as well as in
settings where legal protections are non existent or not enforced.
The potential constraints imposed by extra-legal institutions have not been prominent in current debates,
at least in part because of a lack of empirical examination. We focus our attention on five institutional factors
that, at least in theory, have the potential to raise expectations of penalties for activities that produce private
benefits for controlling shareholders. Some of these factors that can raise the costs to the controlling
shareholder for diverting activities (such as the penalties produced by product market competition and by public
opinion pressure) are constraints external to the firm. Other factors (such as the sanctions that can be introduced
by moral norms, labor, and the government as tax collector) are more ‘internal’ to the firm.
iv) Product market competition. The degree of product market competition affects the opportunity to appropriate
private benefits in two dimensions. First, the more competitive markets are, the more verifiable prices become.
When prices are more “objective”, it is more difficult for a controlling shareholder to tunnel out resources
through manipulated transfer prices without incurring legal and/or reputational costs. Second, in a competitive
market the distortions produced by the extraction of private benefits are more likely to jeopardize the survival of
the firm. Hence, competition represents a natural constraint to the extraction of private benefits.
The extent of product market competition is based both on industry and on country characteristics. In
our regressions we include controls for industry characteristics which we constrain to be constant across
countries. The extent of product market competition is also influenced by country level characteristics,
particularly government policies regarding entry and competition. We use as our proxy for the extent of product
market competition at the national level the response to the survey question, “competition laws prevent unfair
competition in your country?” as reported by the World Competitiveness Yearbook for 1996. This variable,
which is available for all of our countries, captures cross country differences in the extent to which national
policy makers allow for barriers to competition over and above those constraints associated with industry.
v) Public opinion pressure. Controlling shareholders might limit their efforts to divert firm resources not out of

30
fear of legal sanction but rather out of concern for their reputation. For reputation to reduce diversion, the
information about improper behavior must be publicized. For example, shareholders’ activist Robert Monks
succeeded in initiating some major changes at Sears, not by means of the norms of the corporate code (his proxy
fight failed miserably), but through the pressure of public opinion. He paid for a full-page announcement in the
Wall Street Journal where he exposed the identities of Sears’ directors, labeling them the “non-performing
assets” of Sears (Monks and Minnow (1995)). The embarrassment for the directors was so great that they
implemented all the changes proposed by Monks. Similarly, recent efforts to stem diversionary practices by the
powerful Korean Chaebol have also come not from court cases but through the public identification and
dissemination of behavior through the media by shareholder activists. Public humiliation is not only a tool of
activists, but is also viewed as an important tool of regulators. In Hong Kong, for example, the main sanction
available to securities regulators was not financial penalties but the threat and use of publishing those who
violate listing requirements through the press.
Critically, for reputation to work, though, it is necessary to have a “public opinion:, i.e. a combination of
an independent press that publicizes the facts and of a large set of educated investors, who read the newspapers
and sanction improper behavior (Zingales, 2000). We try to capture this idea with an indicator of newspapers’
diffusion, measured as the circulation of daily newspapers normalized by population.
vi) Internal policing through moral norms. Regardless of the reputational cost and/or the legal punishment the
appropriation of private benefits trigger, a controlling shareholder might choose not to appropriate value for
moral considerations. But what constitutes a measure of the strength of such an internal policeman? Coffee
(2001) proposes the violent crime rate as a proxy for these moral norms, noting that this at least captures an
important difference between Scandinavian and other countries. Stulz and Williamson (2001) focus on culture
as an indicator of norms. They use religion as their proxy for cultural norms and hypothesize that certain
religious traditions will be more antagonistic to investor rights, such as the historical antagonism Catholics and
Muslims had toward the payment of interest. To test for an impact of moral norms we use both proposed
measures: the number of violent crimes reported by the World Competitiveness Yearbook based on Interpol data

31
for 1993 and Stulz and Williamson’s classification of countries by their primary religious orientation.
vii) Labor as monitor. Additional constraints on controlling shareholders might come from the presence of
economic entities with a direct interest in firm decisions that could penalize efforts to extract private benefits
directly without having to turn to the courts. From this perspective, it is clear that labor has the potential to
monitor controlling shareholders and the ability to penalize diversions without resorting to legal sanctions.
Labor is privy to inside information on customers and suppliers and can hold up the controlling shareholder by
threatening to withhold services and in some cases, through their position on the board of directors. At the same
time, it is theoretically ambiguous how labor might act for it does not necessarily have the incentive to constrain
private benefits, possibly aligning itself with the controlling shareholder against outside investors and labor’s
information access might not include critical information that is the source of private benefits. We test for the
effect of labor on private benefits using as a cross country measure of the extent of potential labor power the
degree of employee protection. This measure is available for all OECD countries.
viii) Government as monitor through tax enforcement. Like labor, the government has an economic interest in
firm decisions and it can take actions to reduce private benefits without having to turn to the courts. We focus
on the role of the government in enforcing corporate tax legislation. Tax authorities and non-controlling
shareholders have a common objective: to ascertain the value produced by a company and get a share of it. For
example, a principle of corporate taxation for transfer pricing is the use of an arms-length price based on what
independent parties in a competitive market would charge. How tax authorities enforce their rules on transfer
pricing affects the incentives to reallocate returns through transfer pricing, with strict enforcement reducing the
likelihood that a controlling shareholders will use transfer prices to siphon out value at the expense of minority
shareholders.16 Unlike non-controlling shareholders, however, the tax authority does not face any free rider
problem in monitoring and enforcing its right. Furthermore, it has the benefit of disciplinary powers that are
simply not available to dispersed shareholders. Therefore, better tax enforcement should lead to smaller private
benefits of control. As a measure of the effectiveness of the taxation system we use an index developed by the
16 Tax authorities should be particularly concerned about diversions of revenues from taxed to non-taxed entities, be those entities domestic or foreign.

32
World Competitiveness Report, which assesses the level of tax compliance. The index goes from 0 to 6 where
higher scores indicate higher compliance.
That an effective corporate taxation system might have this positive externality has not been emphasized
in the corporate finance literature, or, to our knowledge, in the public finance literature.17 Any evidence in this
direction would be an important element in the debate on the costs and benefits of corporate income taxation,
particularly in countries with high private benefits.
V.2 Test
The large panel data set of 412 transactions from 39 countries provides a unique sample to try and
identify the main institutional curbs of private benefits of control discussed above. In what follows we describe
the empirical proxies used and their effect on the private benefits of control. The definition for all these proxies
is reported in Table I. Table IX reports their actual values. In table X we test the impact of each institution in
isolation, in Table XI we try to test them one against the other.
We start with the impact of “legal” factors, i.e. factors that directly or indirectly rely on the court
enforcement of certain rights. Information disclosure is the prerequisite for any legal action. Thus, we start
(column 1) with the quality of the accounting standards, as measured by the CIFAR index. Firms in countries
with better accounting standards have lower private benefits of control. This effect is both statistically and
economically significant. A one standard deviation increase in accounting standards reduces the value of control
by 8.0 percentage points. Together with the other control variables, accounting standards explain 20 percent of
the variation in private benefits of control (the firm specific control variables alone explain just 15 percent).
Our second variable (column 2) is the extent of legal protections for minority investors, measured using
La Porta et al. (1998) index of anti-director rights. Countries with more anti-director rights have lower private
benefits of control. A one standard deviation increase in anti-director rights reduces the value of control by 3.8
percentage points. Together with the firm specific variables, anti-director rights explain 17 percent of the
variation in private benefits of control.
17 For example, Gresik’s (2001) recent review of the literature on rationales for and effects of corporate income taxation in the context of transnationals does not mention any spillovers between government actions and agency costs.

33
Finally, we use the quality of law enforcement, which we measure using the IBR index of the quality of
the law enforcement in a country. Countries with better law enforcement have lower private benefits of control.
A one standard deviation increase in our law enforcement measure reduces the value of control by 6.8
percentage points. Together with the firm specific variables, rule of law explains 24 percent of the variation in
private benefits of control.
In sum, we find that legal institutions are strongly associated with lower levels of private benefits. When
we combine the two legal variables that are available for our full sample in one regression (Table XI, column 1),
both are statistically significant and the R-squared is 20 percent.
We also test the explanatory power provided by extra-legal institutions, which are suggested by a
functional rather than an institutional perspective. Here we focus on crude country-wide measures of product
market competition, scope of reputational penalties, moral norms, employee protections, and diligence of tax
authorities.
Table X, columns 4-9, explores the explanatory power of these factors one at a time. In column 4 we
test the effect of competition. After having controlled for industry type, we find that countries with more
competitive product markets, at least as measured by this survey of the World Competitiveness Report, have
lower private benefits of control. A one standard deviation increase in our measure of competition reduces the
value of control by 5.5 percentage points. Together with the firm specific variables, competition explains 24
percent of the variation in private benefits of control.
In column 5 of table X we explore the idea that public opinion pressure might curb the amount of
private benefits extracted. We measure the importance of this pressure with the diffusion of newspapers (number
of copies sold per 100,000 inhabitants). Countries where newspapers are more diffused have lower private
benefits of control. A one standard deviation increase in newspapers’ diffusion reduces the value of control by
5.8 percentage points. Together with the firm specific variables, newspapers’ diffusion explains 25 percent of
the variation in private benefits of control. Columns 4 and 5 suggest that institutions external to the firm are
associated with private benefits.
In column 6 and 7 we test the idea that countries with higher moral norms have lower private benefits.

34
Consistent with Coffee’s prediction, countries with worse norms as proxied by higher violent crime rate have
higher private benefits of control, but the effect is economically and statistically insignificant. To investigate
moral norms as proxied by primary religion we introduce indicator variables for the four main religions
(Buddhist, Catholic, Muslim and Protestant). As a country religion we use the dominant one (see Stulz and
Williamson, 2001). We find that Catholic countries have significantly higher private benefits, and Protestant
ones significantly lower (estimate not reported). The effect of the Muslim and Buddhist religion is not
insignificant.
In columns 8 and 9 we test whether the strength of other entities that have a direct economic interest in
firm decision making is associated with lower levels of private benefits. In column 8 we examine the impact of
labor as a monitor of private benefits. As an index of potential labor strength we use both an unweighted and a
weighted (not reported) index of employee protections based on average indictors on regular contracts and short
term contracts from OECD data compiled in Pagano and Volpin (2000). The restriction to OECD countries
unfortunately limits our number of countries and observations but is perhaps a purer test of the contention that
labor can work as monitors, since this literature has focused on organized labor in developed economies.
Inconsistent with the hypothesis that labor is an effective monitor, and consistent with Pagano and Volpin’s
counter contention that entrepreneurs and workers will align themselves against the interests of minority
investors, we find that increased labor power is associated with higher private benefits, although this result is not
statistically significant (p-value of 0.34 for employee protections, 0.22 for weighted employee protections).
In column 9 we investigate the possibility that a government interested in enforcing tax rules can reduce
private benefits. The column shows that in countries with a higher degree of tax compliance, as measured by
the World Competitiveness Report, have lower private benefits of control. A one standard deviation increase in
our measure of tax compliance reduces the value of control by 10.7 percentage points, a significant amount.
Together with the firm specific variables, tax compliance explains 22 percent of the variation in private benefits
of control.
Tax compliance is an equilibrium outcome, affected both by tax enforcement and by the attitude of
citizens toward cheating on the ir taxes. To try to identify the impact of tax enforcement in an unreported

35
regression we include a measure of willingness to cheat on taxes as measured in the World Value Survey. In this
survey people are asked to rate from 1 to 10 the statement “cheating on taxes if you have a chance is ….”, where
1 is never justifiable and 10 is always justifiable. We find this variable to be insignificant, and the coefficient on
tax compliance to remain significant, suggesting the effect of tax compliance comes from tax enforcement and
not from differences in moral values across countries.
In Table XI (column 2) we combine the four extra legal institutions that individually had a statistically
significant effect. All four variables retain the predicted sign, but the magnitudes of their coefficients drops and
only tax compliance and newspaper diffusion remain statistically significant at the 5% level. Together these
four variables are able to explain 23 percent of the variation in private benefits.
The evidence, thus far, is consistent with both the legal and the extra legal institutions playing a role in
constraining private benefits. In fact, a crude R-squared test suggests they have roughly the same explanatory
power. Can we distinguish which one is more important?
The multicollinearity across our institutional variables presented in panel B of Table IX constrains our
ability to disentangle these institutional variables in any definitive way. Nevertheless, we think it is interesting to
try and put all these variables in one regression and see which ones turn out to be more important. This is what
we do in column 3 of Table XI. When all the institutional variables we found to be significant in the previous
regressions are simultaneously included, only newspapers’ diffusion and tax compliance remain significant.
The paucity of observations and the high degree of multicollinearity caution us against drawing any
strong conclusion from this comparison. We can say, however, that the results are inconsistent with an exclusive
focus on legal variables as institutional curbs to private benefits.
V.3 The effect of legal families
Since LLSV (1998) seminal paper, the origin of a country’s legal system has played an important role in
all the institutional explanations of cross-country differences. LLSV (1998) claim that legal traditions differ in
their respect for property rights and, hence, in their ability to protect minority shareholders. We should have
already accounted for this effect by inserting the LLSV index of anti-director rights. Nevertheless, it is possible
that the origin of a country’s legal system is a better indicator of the degree of protection of outside investors

36
than the anti-director index. For this reason, we repeat some of the previous estimates substituting the country of
origin of the legal system for the anti-director rights variable.
As table XII panel A shows, the average level of private benefits differ substantially across different
legal families. Private benefits are highest in former communist countries (34 percent), then countries with a
French code (21 percent), and countries with a German, English, and Scandinavian code seem to have the lowest
level of private benefits (11, 6 and 4 percent). Panel B, column 1, shows that the levels of private benefits are
significantly lower in countries with English, German and Scandinavian legal origins than in French legal origin
countries. Thus, the distinction is not in terms of civil law versus common law, but it is more complex.
In Table XII, panel B we report how these results are changed after we control for the most significant
extra legal institutions (diffusion of readership and tax enforcement). Any distinction between English-based
legal systems and the others disappear. If anything, common law countries have higher (not lower) private
benefits of control once these extra legal institutions are taken into consideration, but this effect it is not
statistically significant. Only Scandinavian countries have lower private benefits of control even after
controlling for extra legal institutions.
Overall, these results confirm the previous ones: extra legal institutions are very important and they
should be controlled for in any cross-country analysis. Controlling for them substantially alters the explanatory
power of legal institutions.
VI – Conclusions
In this paper we apply the approach pioneered by Barclay and Holderness (1989) to measure the
magnitude of private benefits of control across countries. That we obtain estimates very consistent with previous
studies, using different approaches, indicates that the extraction of private benefits is a very real phenomenon
that can be consistently measured.
We then use these estimates to test several theoretical predictions from the corporate finance literature
on the negative effects that large private benefits have on financial development. In countries where private
benefits of control are large, ownership is more concentrated, privatizations are less likely to take place as public

37
offerings, and capital markets are less developed by several measures. These results vindicate the emphasis that,
since Shleifer and Vishny (1997), corporate finance research has put on the importance of protecting outside
investors against expropriation by insiders. They also suggest the importance of gaining a better understanding
of what are the institutions that help curb private benefits.
We find that many institutional variables, taken in isolation, seem to be associated with a lower level of
private benefits of control: better accounting standards, better legal protection of minority shareholders, better
law enforcement, more intense product market competition, a high level of diffusion of the press, a high rate of
tax compliance. A crude attempt to disentangle among them points to a high level of diffusion of the press and a
high rate of tax compliance as the most important institutional factors.
The role of tax enforcement in reducing private benefits, and thus indirectly enhancing financial
development, is probably the most important new fact that emerges from our analysis. Improving the corporate
taxation system is well within the range of feasible reforms. If this is indeed a primary mechanism by which
private benefits of control can be curbed and financial markets fostered, the benefits of financial development
might be within reach for many more countries.
The paper also suggests some avenues for future research. The empirical association between extra
legal institutions and the extent of private benefits calls for further investigation including studies of institutional
reforms that would help to identify the effect of specific institutions from the broader institutional context.
Recognition of the extent of private benefits and their association with security market development also
suggests scope for further analysis of whether private benefits are socially costly.

38
Data appendix
1. Steps to identify transactions We used the following approach to implement the first criterium that a transaction be a control transaction between
unrelated parties: (1) The transaction had to be identified in the SDC database and through the transaction the acquirer had to move from a shareholding position of less than 20% to shareholding of more than 20% shareholding.18 (2) News stories surrounding the transaction had to confirm a transfer of control from the seller to the acquirer, with news stories identified by using the company name and transaction date in Nexis -Lexis and Dow Jones Interactive search engines, often with the use of both English and foreign language media. We impose the lower bound of 20 percent to ensure that we have identified transactions where the acquirer is likely to have assembled voting control. This bound is significantly higher than the 5 percent used by Barclay and Holderness (1989). The 20 percent cutoff reflects our belief that greater ownership is needed to assemble control over corporations outside of the United States and is the criteria used in other cross country studies.
Illustrative of the steps we took to identify control transactions is our exclusion of related party transactions. With related parties it is questionable whether control is transferred and the price of the deal is unlikely to reflect the value of control. Systematically, we excluded transactions where SDC reported that the acquirer involved management, as management already has control rights prior to sale. Using qualitative data we identified further related party transactions excluding transfers of shares between subsidiaries and parents of the same company and other deals that don’t transfer control. For example, we excluded the sale of 36% of the shares of Shin Corp in Thailand in September 2000. News stories reported that “Telecoms Tycoon turned politician Thaksin Shinawatra and his wife have sold their 35.4 per cent stake in their flagship Shin Corporation at a deep discount, in what appears to be an attempt to comply with the laws on ministers’ ownership of companies. The stake was sold to their son and relatives at just 10 baht a share, less than 6 percent of the stocks closing price yesterday of 177 baht…. Analysts said the move was purely political and would have no impact on shareholders or on the company.”19
To implement the second criterium, that a control price be available and reflect the value of control, we restricted our attention to SDC transactions that met three additional criteria:
(1) There had to be data in SDC to identify a control price. In many cases SDC reports a price per share in a separate data field where they value cash offers at face value and offers of shares at the exchange price on the day prior to the announcement of the transaction. In other instances, the price per share is not reported in the data field but can be derived by combining information in available data fields and information from other data sources on the number of shares outstanding. For example, SDC would report the total price paid and the percentage of shares sold and we would construct an estimate of the per share price involved in the offer by collecting information on the number of shares outstanding at the time of the transaction. For many transactions, SDC reported that no terms were disclosed or that the reported price was only one component of the compensation. We are unable to use such transactions.
(2) The form of sale had to involve purchases where assets used to establish a per share sale price include securities that could be priced objectively (we exclude transactions that involve warrants, convertible bonds, notes, liabilities, debt-equity swaps, etc.), and where the terms of sale were not determined by exercising an option or included an option to buy additional shares in addition to the shares purchased.
(3) The synopsis field and news stories had to confirm the price per share and to ensure that the reported price was not misleading. We excluded observations where news stories identified other considerations, and adjusted the price per share from the SDC reported price if two news stories reported a price that deviated from the SDC price.
To implement the third criterium that an exchange price be available we begin by restricting our attention to those transactions where the company whose share are being acquired is covered by Datastream international, the data provider with the most extensive coverage of international firms.20 We also are interested in identifying the exchange price after the market is aware of the purchase of shares by the new controlling shareholder. A traditional approach in the finance literature of focusing on the share price on the day of announcement is not warranted with our data base. In many cases the transfer of control leads to a suspension of trading of the company shares either because there is a need for time for the information about the control transfer to be communicated broadly or there are limits to movement of the exchange price per day. While the suspension is of limited duration in established markets like the United States and the United Kingdom, the suspension can last for a day or more in other settings. Consequently, we use as a standard approach the control price two days after announcement. Where news stories indicated a longer delay we used the first date after restrictions on
18 For Australia and Canada we used a 15 per cent cutoff due to the presence of takeover rules for stakes exceeding 20 percent. 19 “Thaksin, wife sell entire stake in flagship,” Harish Mehta, Business Times Singapore, September 7, 2000. 20 We attempted to access additional information sources for price information for local stocks not covered during our time period by Datastream through direct contacts with country stock exchanges and through appealing to news reports that often reported share price information for large local companies. These efforts produced 26 additional observations.

39
trading or pricing of securities. This produced modifications in 17 cases where we use a later date for all of our calculations. 2. The special case of dispersions of control blocks
In 17 transactions we identify through reading news stories that the controlling block is not sold intact but rather sold to a financial intermediary that then sells the block to a variety of institutional investors. We elected to include these deals in our data set. In the Barclay and Holderness (1989) dataset such transactions were excluded by construction of their sample, but as they argued, such transactions should be included if a private benefit measure is to reflect the general benefits and costs of control. Such transactions are only likely if there is a limited benefit to control of enterprises and costs to control. Our dataset includes 9 transactions from the United Kingdom, 3 from Germany, and one from Finland, Japan, Norway, New Zealand, and Taiwan. Our results are robust to the exclusion of these transactions, with small increases in our raw measures of private benefits for the United Kingdom (from 1.6 to 2.4 percent), Germany (from 9.5 to 11.8 percent) and New Zealand (2.6 to 3.6 percent). 3. The special case of companies with dual class shares
We identify all transactions that involve firms with multiple classes of shares. When this is the case we measure the control premium for the shares with voting power relative to the shares that lack voting power, where Datastream provides price information for both classes. For example, we have 11 observations from Brazil that involve firms with dual class shares and Datastream has price series for both classes for 10 of these 11 observations. In Brazil, the principle difference between the two classes is the voting right with largely equal rights to cash flow. Our dataset includes 38 dual class firms altogether, including companies from canada, denmark, finland, italy, germany mexico, norway, sweden, and USA. 4. Biases from not reporting terms of sale
We made some steps to investigate this bias. When the SDC field reported other considerations we made efforts using stories from local media to see if subsequent to the announcement the other considerations became known. For almost all cases we were unsuccessful. However, for Malaysia, a country with an active business press, we were able to identify additional information. For the year 1995 and 1996 we identified all stories regardless of whether SDC included a transaction price or not. Using this technique we identified 9 transactions not identified in our original sample and we were able to identify prices reported in the local press for 8 of these transactions. Comparing the estimated private benefits from these transactions and from our reported transactions is revealing. The average control premia is similar identical between the initial sample used and this new SDC sample with unreported prices with a control premia as a percentage of equity of 6.9 % for our core sample and 4.5% for our sample of ‘unreported prices’.

40
References Aghion, Philippe, and Patrick Bolton, 1992, “An incomplete contract approach to financial contracting,” Review
of Economic Studies, 59, 473-494. Barclay, Michael and Clifford Holderness, 1989, “Private Benefits of Control of Public Corporations,” Journal
of Financial Economics, 371-395. Bebchuk, Lucien, 1999, “A Rent-Protection Theory of Corporate Ownership and Control,” NBER working
paper 7203. Bebchuk, Lucien and Christine Jolls, 1999,“Managerial Value Diversion and Shareholder Wealth,” Journal of
Law, Economics and Organization, (15) 2, 487-502. Black, Bernard, Reinier Kraakman and Anna Tassarova, 2000, “Russian Privatization and Corporate
Governance: What Went Wrong?” Stanford Law Review, 52, 1731-1808. Coffee, John, 1999, “The Future as History: The Prospects for Global Convergence in Corporate Governance
and its Implications” Northwestern University Law Review, Vol. 93, No. 3, pp. 641-708. Coffee, John, 2001. “Do Norms Matter? A Cross-country Examination of Private Benefits of Control,” mimeo,
Columbia University Law School. DeAngelo, H. and L. DeAngelo, 1985, ``Managerial Ownership of Voting Rights,'' Journal of Financial
Economics, 14, 36-39. Demsetz , H. and K. Lehn, 1985, “The Structure of Corporate Ownership: Causes and Consequences” Journal
of Political Economy 93: 1155-1175. Djankov , Simeon, Clara McLeish, Tatiana Nenova, Andrei Shleifer, 2001, “Who Owns the Media?” NBER
Working Paper 8288. Djankov , Simeon, Peter Murrell, 2000, “The determinants of enterprise restructuring in transition: An
assessment of the evidence” Working paper, University of Maryland. Doidge, C., G. Andrew Karolyi, and R. Stulz, 2001, “Why Are Foreign Firms Listed in the U.S. worth more?”,
Ohio State University Working Paper. Dyck, I.J. Alexander, 2000, “Ownership Structure, Legal Protections and Corporate Governance,” in Boris
Pleskovic and Nicholas Stern (eds.) 2000 Annual World Bank Conference on Development Economics, 291-330.
Dyck, I.J. Alexander, 2001, “Privatization and Corporate Governance: Principles, Evidence and Future Challenges,” World Bank Research Observer, Vol. 16, No. 1, 59-84.
Federov, Oleg, 2000, “Case Studies on Abusive Self-Dealing,” OECD/World Bank Corporate Governance Roundtable for Russia, February 24-25.
Glaeser, Edward, Simon Johnson, and Andrei Shleifer, 2001, “Coase vs. the Coasians”, Quarterly Journal of Economics, 116: 853-900.
Grossman, Sanford, and Oliver Hart, 1980, “Takeover bids, the free rider problem, and the theory of the corporation,” Bell Journal of Economics, 11, 42-69.
Grossman, Sanford, and Oliver Hart, 1988, “One share one vote and the market for corporate control,” Journal of Financial Economics, 20(1-2), 175-202.
Harris, Milton and Artur Raviv, 1988. “Corporate Governance: Voting Rights and Majority rules,” Journal of Financial Economics, 20, 203-235.
Holderness, Clifford, and Dennis Sheehan, 1988. “The role of majority shareholders in publicly held corporations: An exploratory analysis,” Journal of Financial Economics, 20, 317-346.
Holthausen, R.W., R.W. Leftwich, and D. Myers, 1990, “Large Block Transactions, the Speed of Response, and Temporary and Permanent Stock Price Effects”, Journal of Financial Economics, 26: 71-95.
Johnson, Simon, Rafael La Porta, Florencio Lopez-de-Salines, and Andrei Shleifer. 2000. “Tunneling,” American Economic Review, 90(2), 22-27.
La Porta, Rafael, Florencio Lopez-de-Salines, and Andrei Shleifer. 2000. “Investor Protection and Corporate Governance,” Journal of Financial Economics, 59 (1-2), 3-27.
La Porta, Rafael, Florencio Lopez-de-Salines, and Andrei Shleifer. 1999. “Corporate Ownership Around the World.” Journal of Finance 54(2): 471-517.
La Porta, Rafael, Florencio Lopez-de-Salines, Andrei Shleifer and Robert W. Vishny. 1997. “Legal Determinants of External Finance.” Journal of Finance 53(1), 1131-1150.

41
La Porta, Rafael, Florencio Lopez-de-Salines, and Andrei Shleifer and Robert W. Vishny. 1998. “Law and Finance.” Journal of Political Economy 106(6), 1113-155.
Lease, Ronald C; McConnell, John J; Mikkelson, Wayne H. 1984. “The Market Value of Differential Voting Rights in Closely Held Corporations”. Journal of Business. Vol. 57 (4). 443-67..
Lease, Ronald C; McConnell, John J; Mikkelson, Wayne H. 1983. “The Market Value of Control in Publicly-Traded Corporations.” Journal of Financial Economics. Vol. 11 (1-4). 439-71.
Lopez-de-Silanes, Florencio, (1997), “Determinants of Privatization Prices,” The Quarterly Journal of Economics 4, 965-1025.
Megginson, William L., Robert C. Nash, Jeffrey M. Netter, and Annette B. Poulsen. 2000. “The choice between private and public markets: Evidence from privatizations,” working paper, University of Georgia.
Milgrom, P.R and R.J. Weber, 1982, “A Theory of Auctions and Competitive Bidding”, Econometrica 50: 1089-1122.
Monks, Robert, and Nell Minnow, 1995, Watching the Watchers: Corporate Governance for the 21st Century (Blackwell Publishing, Malden, MA).
Morck, Randall, Bernard Yeung and Wayne Yu, 2000. “The Information Content of Stock Markets: Why Do Emerging Markets Have Synchronous Stock Price Movements?” Journal of Financial Economics. 58 (1-2). p 215-60.
Nenova, Tatiana, 2000, “The Value of Corporate Votes and Control Benefits: A Cross-Country Analysis,” mimeograph, Harvard University.
Pagano, Marco and Paolo Volpin, 2000, “The Political Economy of Corporate Governance,” working paper, London Business School.
Pistor, Katherina, Raiser, Martin and Satanislaw Gelfer. 2000. “Law and Finance in Transition Economies, Economics of Transition, 8(2). 325-368.
Rajan, Rajan and Luigi Zingales 1998,” Financial Dependence and Growth,” American Economic Review. Roe, Mark, 2001, “Rents and their corporate law consequences,” Discussion paper, Columbia Law school. Rydqvist, K. 1987.”Empirical Investigation of the Voting Premium,” Northwestern University Working Paper
No. 35. Shleifer, Andrei, and Robert Vishny, 1997, “A survey of corporate governance,” Journal of Finance 52, 737-
783. Stulz, Renee and Rohan Williamson, 2001, “Culture, Openness and Finance,” NBER working paper 8222. Zingales, Luigi, 1994, “The value of the voting right: A study of the Milan stock exchange experience,” Review
of Financial Studies 7, 125-148. Zingales, Luigi, 1995a, “What determines the value of corporate votes?,” Quarterly Journal of Economics,
110,1047-1073. Zingales, Luigi, 1995b, "Insider Ownership and the Decision to Go Public." Review of Economic Studies, 62: 425-448. Zingales, Luigi, 1998, “Why it’s worth being in control” , in Bickerstaffe, George ed.: The Complete Finance
Companion (FT Pitman Publishing, London). Zingales, Luigi, 2000, “In Search of New Foundations,” Journal of Finance, 55: 1623- 1653

42
Table I
Description of Variables
Variable Description Source
Block premia as a percentage of the value of equity
The block premia is computed taking the difference between the price per share paid for the control block and the exchange price two days after the announcement of the control transaction, dividing it by the exchange price two days after the announcement and multiplying the ratio by the proportion of cash flow rights represented in the controlling block.
Securities Data Corporation, Datastream International, 20-Fs, Company annual reports, Lexis-nexis, Dow-Jones interactive, various country sources including ISI Emerging markets and country company yearbooks.
The change in security value
The difference between the security value of the buyer (market price at t+2) and of the seller (market price at t-30) normalized by the market price at t+2. We subtract from this amount the percentage difference in the level of the market index over the same time period (between date t+2 and t-30 normalized by the level of the index at date t+2).
Datastream International.
Majority block
A dummy variable that takes the value 1 if the control block includes 50% of all shares or 50% of all voting shares.
Securities Data Corporation, 20-Fs, Company annual reports, Lexis-nexis, Dow-Jones interactive, various country sources including ISI Emerging markets and country company yearbooks.
Another large shareholder
A dummy variable that takes the value 1 if there is another shareholder with a stake in excess of 20 percent after the block sale.
Securities Data Corporation, Company annual reports, Lexis-nexis, Dow-Jones interactive, various country sources including ISI Emerging markets and country company yearbooks.
Financial distress
A dummy variable that takes the value 1 if earnings per share in the target are zero or negative in the year of the block trade or the year preceding the block trade.
Datastream International.
Seller identity Dummy variables to identify seller identity. Includes dummies for individual seller, the company itself (through new share issues), a corporate entity, or unknown. A corporate entity is the most prevalent category and is the excluded category.
Securities Data Corporation, Company annual reports, Lexis-nexis, Dow-Jones interactive, various country sources including ISI Emerging markets and country company yearbooks.
Foreign acquirer
A dummy variable that takes the value 1 if the acquirer is from a different country than the target. Where acquirer is unknown assume acquirer is from same country as target.
Securities Data Corporation.
Acquirer identity
Dummy variables to identify if the acquirer is a public company, subsidiary, the government, or a private company. A public company is the most prevalent group and is the excluded category.
Securities Data Corporation.
Industry type Dummy variables that indicate the acquired companies industrial type (2 digit SIC). Manufacturing is the most prevalent group and is the excluded category.
Agriculture, forestry, & fishing (01-09) Mining (10-14) Construction (15-17) Manufacturing (20-39)
Transportation & pub. utilities (40-49) Wholesale trade (50-51) Retail trade (52-59)
Finance, insurance, & real estate (60-67) Services (70-89)
Securities Data Corporation, Global Access.

43
Tangibility of assets
The median value of the percentage of total assets that are fixed for US firms in the same 3 digit SIC code as the acquired firm.
Securities Data Corporation, Standard and Poors Research Insight (compustat)
Stock market synchronicity
As a measure of valuation uncertainty we use the average R2 of firm-level regressions of bi-weekly stock returns on local and U.S. market indexes in each country in 1995. Returns include dividends and are trimmed at ?25%. Higher levels indicate that stocks are more likely to move together.
Morck and Yeung and Yu(2000).
Control premia based on voting/ non-voting shares
“Control benefits based on a sample of 661dual-class firms in 18 countries using data for 1997. Control benefits are extracted from the total value of the votes in the control block, based on a baseline control contest model in the case of a dual class firm.” Nenova (2000)
Nenova (2000)
Log gdp per capita
Average log gdp per capita 1970-1995. World Bank.
Ownership concentration
“The average percentage of common shares owned by the three largest shareholders in the 10 largest nonfinancial, privately owned domestic firms in a given country. A firm is considered privately owned if the state is not a known shareholder in it.” La Porta, Lopez-de-Silanes, Shleifer, Vishny (1998)
La Porta, Lopez-de-Silanes, Shleifer, Vishny (1998), derived from: Moodys International, CIFAR, EXTEL, Worldscope, 20-F’s, Price-Waterhouse, and various country sources
Initial public offerings/ population
“Ratio of the number of initial public offerings of equity in a given country to its population (in millions) for the period 1995:7 – 1996:6.” La Porta, Lopez-de-Silanes, Shleifer, Vishny (1997)
La Porta, Lopez-de-Silanes, Shleifer, Vishny (1997), derived from: Securities Data Corporation, AsiaMoney, LatinFinance, GT Guide to World Equity Markets, and World Development Report, 1996.
Number of listed firms/ population
“Ratio of the number of domestic firms listed in a given country to its population (in millions) in 1994.” La Porta, Lopez-de-Silanes, Shleifer, Vishny (1997)
La Porta, Lopez-de-Silanes, Shleifer, Vishny (1997) derived from: Emerging Market Factbook and World Development Report, 1996.
External market capitalization/ GNP
“The ratio of the stock market capitalization held by minorities to gross national product for 1994. The stock market capitalization held by minorities is computed as the product of the aggregate stock market capitalization and the average percentage of common shares not owned by the top three shareholders in the ten largest non-financial, privately owned domestic firms in a given country. A firm is considered privately owned if the State is not a known shareholder in it. “ La Porta, Lopez -de-Silanes, Shleifer, Vishny (1997)
La Porta, Lopez-de-Silanes, Shleifer, Vishny (1997), derived from Moodys International, CIFAR, EXTEL, Worldscope, 20-F’s, Price-Waterhouse, and various country sources
Takeover laws A dummy variable that takes the value 1 if the transaction takes place in the presence of a legal requirement to make a mandatory offer if the shareholding after acquisition exceeds a threshold, yet the transaction lies below the threshold. Data presented in Appendix table 1.
ISSA Handbook, 6th and 7th editions, EIU country commerce guides, exchange web sites, country company handbooks.
Accounting standards
“Index created by examining and rating companies’ 1990 annual reports on their inclusion or omission of 90 items. These items fall into seven categories (general information, income statements, balance sheets, funds flow statement, accounting standards, stock data, and special items). A minimum of three companies in each country were studied. The companies represent a cross section of various industry groups; industrial companies represented 70 percent, and financial companies represented the remaining 30 percent.” La Porta, Lopez-de-Silanes, Shleifer, Vishny (1998)
La Porta, Lopez-de-Silanes, Shleifer, Vishny (1998) derived from: International accounting and auditing trends, Center for International Financial Analysis and Research

44
Anti-director rights
“An index aggregating shareholder rights formed by adding 1 when (1) the country allows shareholders to mail their proxy vote to the firm, (2) shareholders are not required to deposit their shares prior to the general shareholder’s meeting, (3) cumulative voting or proportional representation of minorities in the board of directors is allowed, (4) an oppressed minorities mechanism is in place, (5) the minimum percentage of share capital that entitles a shareholder to call for an extraordinary shareholder’s meeting is less than or equal to 10 percent (the sample median), or (6) shareholders have preemptive rights that can be waived only by a shareholders’ vote. The index ranges from zero to six.” La Porta, Lopez-de-Silanes, Shleifer, Vishny (1998)
La Porta, Lopez-de-Silanes, Shleifer, Vishny (1998) based on company law or commercial code. Pistor, Raiser and Gelfer (2000) for Czech Republic and Poland.
Rule of law “Assessment of the law and order tradition in the country produced by the country risk rating agency International Country Risk (ICR). Average of the months of April and October of the monthly index between 1982 and 1995. Scale from zero to 10, with lower scores for less tradition for law and order (we changed the scale from its original range going from zero to six).” La Porta, Lopez-de-Silanes, Shleifer, Vishny (1998)
La Porta, Lopez-de-Silanes, Shleifer, Vishny (1998), derived from: International Country Risk guide. Pistor, Raiser and Gelfer (2000) for Czech Republic and Poland.
Competition laws
Response to survey question, "competition laws prevent unfair competition in your country," Higher scores suggest agreement that competition laws are effective.
World Competitiveness Yearbook, 1996.
Newspaper circulation/ population
Circulation of daily newspapers/population. UNESCO Statistical yearbook 1996, as reported in World Competitiveness Report, For Taiwan based on Editors and Publishers’ Association Year Book and AC Nielsen, Hong Kong, as reported in “Asian Top Media – Taiwan” www.business.vu.edu
Violent crime This is a proxy for moral norms suggested by Coffee (2001). It is the reported number of murders, violent crimes or armed robberies per 100,000 population.
Interpol and country data for 1993 as reported in World Competitiveness Yearbook, 1995.
Catholic This is another proxy for moral norms suggested by Stulz and Williamson (2001). The indicator variable takes the value 1 if the country’s primary religion is catholic.
2000 CIA World Factbook as reported in Stulz and Williamson (2001).
Labor power We use as an index of labor power the extent of statutory employee protections based on the average of indicators on regular contracts (procedural inconveniences, notice and severance pay for no-fault-dismissals, difficulty of dismissal) and short term contract (fixed-term and temporary) as derived in Pagano and Volpin (2000). An alternate index is the weighted average of indicators on regular contracts, short-term contract and collective dismissals as derived by Pagano and Volpin (2000)..
The index is from Pagano and Volpin (2000) based on data from OECD 1999.
Tax compliance
“Assessment of the level of tax compliance. Scale from 0 to 6 where higher scores indicate higher compliance. Data is for 1995.” La Porta et al. 1999.
The Global Competitiveness Report 1996 as reported in La Porta et al. 1999.
Cheating on taxes
Response to survey question “cheating on taxes if you have a chance is justified.” Scaled from 1-10 where 1 is never justified and 10 is always justified.
World Values Survey, 1996.
Legal origin Identifies the legal origin of the company law or commercial code of each country. Categories include English common law, French commercial code, German commercial code, Scandinavian civil law, and former Soviet bloc country.
La Porta, Lopez-de-Silanes, Shleifer, Vishny (1998), derived from Reynolds and Flores (1989)

45
Country mean medianstandard deviation minimum maximum
Number of observations
Number of positive
observationsArgentina 0.27 0.12 0.26 0.05 0.66 5 5Australia 0.02 0.01 0.04 -0.03 0.11 13 9Austria 0.38 0.38 0.19 0.25 0.52 2 2Brazil 0.65 0.49 0.83 0.06 2.99 11 11Canada 0.01 0.01 0.04 -0.02 0.06 4 2Chile 0.15 0.12 0.18 -0.08 0.51 9 8Colombia 0.27 0.15 0.34 0.06 0.87 5 5Czech Republic 0.58 0.35 0.80 0.01 2.17 6 6Denmark 0.08 0.04 0.11 -0.01 0.26 5 3Egypt 0.04 0.04 0.05 0.01 0.07 2 2Finland 0.02 0.01 0.06 -0.07 0.13 14 9France 0.02 0.01 0.10 -0.10 0.17 5 3Germany 0.10 0.10 0.13 -0.24 0.32 18 15Hong Kong 0.01 0.03 0.05 -0.12 0.05 9 7Indonesia 0.07 0.07 0.03 0.05 0.09 2 2Israel 0.27 0.21 0.32 -0.01 0.89 9 8Italy 0.37 0.16 0.57 -0.09 1.64 8 7Japan -0.04 -0.01 0.09 -0.34 0.09 21 5Malaysia 0.07 0.05 0.10 -0.08 0.39 41 31Mexico 0.34 0.47 0.35 -0.04 0.77 5 4Netherlands 0.02 0.03 0.05 -0.07 0.06 5 4New Zealand 0.03 0.03 0.09 -0.17 0.18 19 14Norway 0.01 0.01 0.05 -0.05 0.13 14 9Peru 0.14 0.17 0.11 0.03 0.23 3 3Phillipines 0.13 0.08 0.32 -0.40 0.82 15 11Poland 0.11 0.08 0.11 0.02 0.28 5 5Portugal 0.20 0.20 0.14 0.11 0.30 2 2Singapore 0.03 0.03 0.03 -0.01 0.06 4 3South Africa 0.02 0.00 0.03 0.00 0.07 4 2South Korea 0.16 0.17 0.07 0.04 0.22 6 6Spain 0.04 0.02 0.06 -0.03 0.13 5 4Sweden 0.06 0.02 0.08 -0.01 0.22 13 12Switzerland 0.06 0.07 0.04 0.01 0.15 8 8Taiwan 0.00 0.00 0.01 -0.01 0.00 3 2Thailand 0.12 0.07 0.19 -0.08 0.64 12 11Turkey 0.30 0.09 0.55 -0.03 1.41 6 5United Kingdom 0.02 0.01 0.05 -0.06 0.17 43 23United States 0.02 0.02 0.10 -0.20 0.40 47 28Venezuela 0.27 0.28 0.21 0.04 0.47 4 4average/number 0.14 0.11 0.18 -0.04 0.48 412 300
Table II
Block Premium as Percent of Firm EquityThis table presents descriptive statistics by country on the block premia in the 412 control block transactions we study. The block premia is computed taking the difference between the price per share paid for the control block and the exchange price two days after the announcement of the control transaction, dividing it by the exchange price two days after the announcement and multiplying the ratio by the proportion of cash flow rights represented in the controlling block.

46
VariableNumber of
observations Mean Std. Dev. Min Max
Buyers proportion of change in security value. 412 0.02 0.09 -0.43 0.40Initial shareholding as a percent of total shares 412 1.31 3.72 0.00 20.00Size of control block as a percent of total shares 412 37.71 17.51 6.00 90.00Fixed assets as a percentage of total assets (US 3 digit SIC) 412 0.29 0.23 0.00 0.77
Indicator VariablesTransactions with blocks greater than 20% 412 0.27Transactions where another large shareholder 412 0.16Financial distress in target in year of transaction (EPS<=0) 412 0.26Financial distress in target in year before transaction (EPS<=0) 412 0.22Domestic acquirer 412 0.62Control block created by issuing new shares 412 0.16
Agriculture, forestry, & fishing (SIC 01-09) 412 0.05 Mining (SIC 10-14) 412 0.04 Construction (SIC 15-17) 412 0.01 Manufacturing (SIC 20-39) 412 0.39 Transportation & pub. Utilities (SIC 40-49) 412 0.09 Wholesale trade (SIC 50-51) 412 0.03 Retail trade (SIC 52-59) 412 0.06 Finance, insurance, & real estate (SIC 60-67) 412 0.23 Services (SIC 70-89) 412 0.10 Seller an individual (news stories) 412 0.18Seller government (news stories) 412 0.03Seller unidentified (news stories) 412 0.08Seller public company (news stories) 412 0.54Acquiror public company (SDC) 412 0.42Acquiror subsidiary (SDC) 412 0.13Acquiror private (SDC) 412 0.40Acquiror government (SDC) 412 0.01Acquiror unknown (SDC) 412 0.03
Table III
Transaction Characteristics
The difference between the security value of the buyer (market price at t+2) and of the seller (market price at t-30) normalized by the market price at t+2.
412 0.06 0.24 -1.84 0.90
This table presents the summary statistics of the specific characteristics of all the 412 transactions analyzed in this paper. Variable definitions can be found in Table I.

47
Independent Variables
Buyer's proportion of change in security value -0.368* (0.211) -0.356* (0.211) -0.353* (0.210)Stake greater than 50% 0.096*** (0.037) 0.096** (0.038)Another large shareholder 0.043 (0.042) 0.024 (0.039)Financial distress in selling firm -0.055** (0.027) -0.047* (0.027)Sold through new share issue 0.036 (0.053) 0.027 (0.054)Buyer is foreign 0.064* (0.033) 0.060* (0.034)Buyer individual or private -0.035 (0.026)Buyer government -0.010 (0.043)Buyer subsidiary 0.000 (0.043)Buyer dispersed or unknown -0.038 (0.041)Seller Individual 0.014 (0.029)Seller government 0.000 (0.102)Seller unknown 0.019 (0.030)Fixed assets as percent of total -0.087 (0.058)Industry-Agriculture, Forestry, Fishing -0.023 (0.049)Industry-Mining -0.066 (0.062)Industry-Construction -0.030 (0.041)Industry- Transportation & utilities 0.057 (0.030)Industry-Wholesale Trade 0.048* (0.038)Industry- Retail Trade -0.042 (0.052)Industry-Finance, Insurance, Real Est. 0.061 (0.043)Industry-Services -0.013 (0.035)Country fixed effects
Argentina 0.268** (0.111) 0.268** (0.112) 0.162 (0.129) 0.196 (0.123)Australia 0.019 (0.012) 0.028* (0.017) -0.007 (0.037) 0.041 (0.052)Austria 0.383*** (0.099) 0.363*** (0.081) 0.315*** (0.052) 0.306*** (0.049)Brazil 0.650*** (0.251) 0.653*** (0.248) 0.596*** (0.224) 0.637*** (0.240)Canada 0.013 (0.017) 0.017* (0.009) -0.055 (0.054) -0.046 (0.072)Chile 0.147** (0.058) 0.182*** (0.061) 0.123** (0.056) 0.135** (0.061)Colombia 0.273* (0.141) 0.274** (0.128) 0.177 (0.139) 0.214 (0.135)Czech Republic 0.578* (0.312) 0.602* (0.320) 0.466 (0.297) 0.545* (0.324)Denmark 0.077 (0.048) 0.076* (0.045) 0.030 (0.048) 0.023 (0.068)Egypt 0.038 (0.024) 0.035** (0.014) -0.077 (0.050) -0.009 (0.062)Finland 0.025 (0.016) 0.028 (0.018) -0.014 (0.026) -0.013 (0.035)France 0.017 (0.042) 0.032 (0.040) 0.023 (0.044) 0.047 (0.061)Germany 0.095*** (0.032) 0.093*** (0.031) -0.018 (0.050) 0.010 (0.057)Hong Kong 0.007 (0.017) 0.029 (0.019) 0.034 (0.027) 0.033 (0.045)Indonesia 0.072*** (0.017) 0.029 (0.025) -0.039 (0.039) 0.029 (0.043)Israel 0.270** (0.107) 0.285** (0.113) 0.234** (0.108) 0.253** (0.114)Italy 0.369* (0.199) 0.378* (0.200) 0.317* (0.191) 0.299 (0.192)Japan -0.043** (0.021) -0.041** (0.020) -0.075* (0.043) -0.049 (0.051)Malaysia 0.071*** (0.017) 0.070*** (0.014) 0.064*** (0.017) 0.089*** (0.031)Mexico 0.345** (0.146) 0.384** (0.150) 0.287** (0.145) 0.303** (0.145)Netherlands 0.016 (0.020) -0.034 (0.048) -0.070 (0.070) -0.038 (0.062)New Zealand 0.026 (0.020) 0.043* (0.023) -0.028 (0.037) 0.016 (0.040)Norway 0.010 (0.012) 0.016 (0.017) 0.001 (0.024) 0.035 (0.040)Peru 0.142*** (0.053) 0.120 (0.076) 0.068 (0.081) 0.064 (0.083)Phillipines 0.129 (0.083) 0.171** (0.084) 0.121 (0.080) 0.141* (0.077)Poland 0.111** (0.046) 0.119*** (0.036) -0.007 (0.068) 0.022 (0.073)Portugal 0.203*** (0.073) 0.216*** (0.075) 0.164*** (0.049) 0.194*** (0.054)Singapore 0.030* (0.016) 0.027 (0.019) 0.025 (0.034) 0.036 (0.066)South Africa 0.017 (0.015) 0.036* (0.019) -0.040 (0.058) 0.000 (0.065)South Korea 0.157*** (0.027) 0.145*** (0.036) 0.081 (0.069) 0.076 (0.086)Spain 0.041 (0.027) 0.050* (0.026) 0.025 (0.042) 0.047 (0.057)Sweden 0.064*** (0.023) 0.076*** (0.025) 0.025 (0.042) 0.036 (0.049)Switzerland 0.063*** (0.015) 0.060*** (0.016) -0.069 (0.053) -0.070 (0.070)Taiwan -0.004 (0.004) -0.011** (0.005) -0.047 (0.038) -0.049 (0.072)Thailand 0.125** (0.054) 0.143** (0.057) 0.075 (0.079) 0.120 (0.082)Turkey 0.305 (0.214) 0.304 (0.196) 0.204 (0.205) 0.253 (0.222)United Kingdom 0.016** (0.008) 0.019** (0.009) 0.000 (0.019) 0.032 (0.032)United States 0.018 (0.016) 0.035* (0.018) 0.013 (0.030) 0.049 (0.036)Venezuela 0.270*** (0.094) 0.307*** (0.103) 0.245** (0.101) 0.203* (0.108)Number of observationsR-squared 0.449
Table IV
Estimated Block Premia by Country
Dependent Variable: Block premium
( 1 ) ( 2 )
The dependent variable is the block premia as a percent of firm equity. Each regression includes country fixed effects. In addition, in column (2) we introduce the buyer’s proportion of the difference in security value between the buyer and seller. In column (3) we introduce several deal characteristics: whether it is a majority block, whether there is another large shareholders, whether the firm is in financial distress, whether the block was created by issuing new shares, and whether the buyer is foreigner. In column (4) we introduce several industry and seller/buyer characteristics: identity of the buyer (individual, government, subsidiary, dispersed), identity of the seller (individual, government, unknown), 2-SIC code industry dummies, and the proportion of fixed to total assets. Definitions for each of the variables can be found in Table I. All regressions are estimated by OLS. Robust standard errors are in parentheses.
( 3 ) ( 4 )
0.382412
0.394412
0.424412 412
* significant at the 10% level, ** significant at the 5% level, *** significant at the 1% level.

48
Panel A - Cumulative abnormal returns of the acquiror
MeanMedianMaximumMinimumStandard deviationNumber of observations
Panel B - Systematic differences in cumulative abnormal returnsIndependent Variables Dependent Variable: Cumulative Abnormal Return of acquiror (from t-8 to t+7)
Table V
R-squared 0.002
(0.039)
0.007(0.011)
0.008104
Constant
Number of Observations 125
Block premia x syncrhonicity in target nation
-0.4080.108125
Block premia -0.018
Does the Control Premium Come from Overpayment?
(1)
from t-8 to t+70.0050.0000.333
0.007(0.011)
(2)-0.111(0.151)
0.448(0.806)
Panel A reports the summary statistics of the cumulative abnormal returns (CAR) of the stock price of the acquiring company around the date the acquisition of the controlling block is announced. We use a window from 8 days prior to the announcement to 7 days after the announcement. We have 203 transactions involving publicly-traded acquirors, of which 125 have stock prices reported in Datastream. Panel B reports the OLS estimates of two regressions, where the dependent variable is the acquiror’ CAR from t-8 and t+7 and the independent variables are: (1) the raw block premia (Table IV column 1); (2) the raw block premia (Table IV column 1) interacted with a measure of how much stock prices move together at the country level (see Morck, Yeung and Yu (2000)). Definitions for each of the variables can be found in Table I. Robust standard errors are in parentheses.
* significant at the 10% level, ** significant at the 5% level, *** significant at the 1% level.

49
* significant at 10% level; ** significant at 5% level; *** significant at 1% level
Indepenedent VariablesForeign acquiror dummy
Variables Controlled for:Buyer's proportion of change in security valueOwnership variablesFinancial distressBuyer identitySeller identityIndustry groupTangibility of assets
Country fixed effects
Argentina 0.184 (0.114)Australia 0.041 (0.051)Austria 0.305*** (0.05)Brazil 0.641*** (0.24)Canada -0.049 (0.079)Chile 0.131** (0.059)Colombia 0.255* (0.135)Czech Republic 0.552* (0.327)Denmark 0.017 (0.062)Egypt 0.043 (0.066)Finland -0.005 (0.035)France 0.044 (0.061)Germany 0.029 (0.055)Hong Kong 0.034 (0.045)Indonesia 0.029 (0.042)Israel 0.250** (0.116)Italy 0.312 (0.192)Japan -0.043 (0.049)Malaysia 0.086*** (0.031)Mexico 0.330** (0.133)Netherlands -0.046 (0.064)New Zeland 0.016 (0.040)Norway 0.041 (0.041)Peru 0.080 (0.076)Phillipines 0.145* (0.078)Poland 0.020 (0.075)Portugal 0.200*** (0.054)Singapore 0.040 (0.061)South Africa -0.016 (0.069)South Korea 0.116 (0.078)Spain 0.058 (0.053)Sweden 0.045 (0.048)Switzerland -0.058 (0.068)Taiwan -0.047 (0.072)Thailand 0.112 (0.079)Turkey 0.269 (0.221)United Kingdom 0.024 (0.032)United States 0.042 (0.037)Venezuela 0.217** (0.104)Number of observations 412R-squared 0.455
Table VI
Does Investor Protection in the Acquiror’s Country of Origin Affect the Acquiror's Willingness to Pay for Control?
Dependent Variable: Block Premium0.058*(0.033)
Interaction of relative strength of anti-director rights (home -target nation) and foreign acquiror -0.026**
(0.011)
yyy
yyyy
The dependent variable is the block premia as a percent of firm equity. The explanatory variables include all of the variables introduced in table IV column (4) plus the interaction between the foreign acquiror’s dummy and the difference between the La Porta et al. (1998) measure of anti-director rights for the country of the acquiring company and the one for the country of the acquired company. Robust standard errors are in parentheses.

50
Country
Premia using voting/non-
voting shares (Nenova, table 5
(2000))Block premia
(table IV, col 1)
Premia using voting/non-
voting shares (Nenova, table 6, IV (2000))
Block premia (table VI)
Percentage of equities with dual class shares and
available price data
Australia 0.232 0.019 0.185 0.04 0.01Brazil 0.232 0.650 0.180 0.64 0.59Canada 0.028 0.013 0.035 -0.05 0.04Switzerland 0.054 0.063 0.054 -0.07 0.19Chile 0.231 0.147 0.231 0.14 0.07Germany 0.095 0.095 0.148 0.01 0.14Denmark 0.008 0.077 0.009 0.02 0.20Finland -0.050 0.025 0.058 -0.01 0.24France 0.281 0.017 0.282 0.05 0.02United Kingdom 0.096 0.016 0.090 0.03 0.02Hong Kong -0.029 0.007 -0.029 0.03 0.01Italy 0.294 0.369 0.345 0.30 0.31South Korea 0.289 0.157 0.338 0.08 0.11Mexico 0.364 0.345 0.460 0.30 0.06Norway 0.058 0.010 0.058 0.04 0.11Sweden 0.010 0.064 0.010 0.04 0.19United States 0.020 0.018 0.016 0.05 0.08South Africa 0.067 0.017 0.063 0.00 0.07
Percentage of dual class firms in country
Constant
Number of observationsAdjusted R-squared
***significant at 1% level
Table VII
Comparing Control Premia Measures
Panel A - Data comparisons
Raw dataEstimated country fixed
effects
0.573
-0.806***(0.234)
0.156***(0.037)
18
Dependent variable : Nenova measure - our measure
Dependent variable: Refined Nenova measure - our refined
measure
Panel B. Can differences between benefits-estmates be explained by potential selection bias in voting rights approach?
-0.877***
0.756
(0.110) 0.129***(0.029)
18
Panel A reports side by side Nenova’s (2000) estimates of the value of control based on the price difference between classes of shares with differential voting rights and ours, based on control block transactions. Column 1 reports Nenova’s voting premium, defined as total vote value (value of a vote times number of votes) as a share of firm’s market value. Column 2 reproduces our raw block premium (table IV column (1)). Column 3 reports Nenova’s fixed effect estimates of the value of control, where she controls for differences in the dividend rights between the two classes of stock, differences in liquidity, and the presence of a conversion option (Nenova, (2000), table 6, IV). Column 4 reports our fixed effect estimates of the value of control (table VI). Column 5 reports the percentage of firms in Datastream sample that have multiple share classes with available price data, where the number of firms with multiple share classes is taken from Nenova (2000) and the number of firms with equity prices in Datastream for 1997 is reported in Appendix Table 2. Panel B reports OLS regressions of the difference between Nenova’s control premia and ours. In column 1 there is the difference between the raw estimates, in column 2 the difference between the fixed effect estimates. The explanatory variable is the percentage of firms that have dual class shares and price data available in each country (column 5 of Panel A). Robust standard errors are in parentheses.

Dependent variables:
Independent Variables
Country control premia
log per capita income
equity market capitalization/ GNP
constant
Number of Obs. R-squared
OLS Instrumental Variables
Independent Variables
Country control premia -1.207*** -4.378**(0.439) (1.772)
log per capita income -0.029 -0.168(0.064) (0.115)
constant 0.814* 2.320**(0.600) (1.108)
Number of Obs. 37 37R-squared 0.172
* significant at 10% level; ** significant at 5%; ***significant at 1% level
Dependent Variables:
(0.131)
Panel B. Dependent Variable: Capital market structure based on aggregate data
340.230
1.031***
.004(.129)
.518
Instrumental VariablesOLS Instrumental VariablesOLS
Testing the Theoretical Predictions on the Effects of Private Benefits on Financial Market DevelopmentTable VIII
Panel A - Dependent Variables: Ownership Structure
(1) (2)
(0.361)-0.025(0.058)
0.760**(0.347)-0.029(0.024)
4.638**
0.114
-1.22
(.132)
(.515)
-2.434*(1.279)0.482**(0.196)-2.652*(1.528)
340.184 0.158
-51.50**(24.85)
-15.64(31.03)9.190***(3.113)
-222.1*(118.4)0.165
(6.110)46.52
(61.54)
OLS
34(1.45)(0.235)
36360.437
3734
-15.11*(7.694)-0.131(0.485)3.965
(4.752)37
(0.143)
( 1 ) ( 2 ) ( 3 )
0.560(0.538)
0.833***
-0.050***(0.015)
0.616**
Equity market capitalization/ GNP
ownership concentration (3 largest) Percentage of privatizations as asset sales (not share offerings)
Instrumental Variables OLS Instrumental Variables
Initial public offerings in 1996/ population Number of listed domestic firms/ population
(2.262)0.378**
In column 1 of Panel A the dependent variable is the average concentration of ownership as measured by the combined stakes of the three largest shareholders in the 10 largest non-financial, non-foreign corporations where the state is not a shareholder (see La Porta et al. (1997)). In column 2 the dependent variable is the percentage of privatization transactions that took the form of an asset sale rather than a share offering (Megginson et al. (2000). In Panel B the dependent variables are: (1) the number of initial public equity offerings of equity in 1995-1996; (2) the number of listed domestic firms; (3) the ratio of the stock market capitalization held by minority investors to GNP (all from La Porta et al. 1997). The explanatory variables are the average log GDP per capita 1970-1995 (World Bank) and our fixed effect estimates of the country average level of value of control. More complete variable descriptions and sources are provided in Table I. The instruments are the families of origin of a country’s legal system (English, French, German, Scandinavian, and Soviet). Robust standard errors are in parentheses.

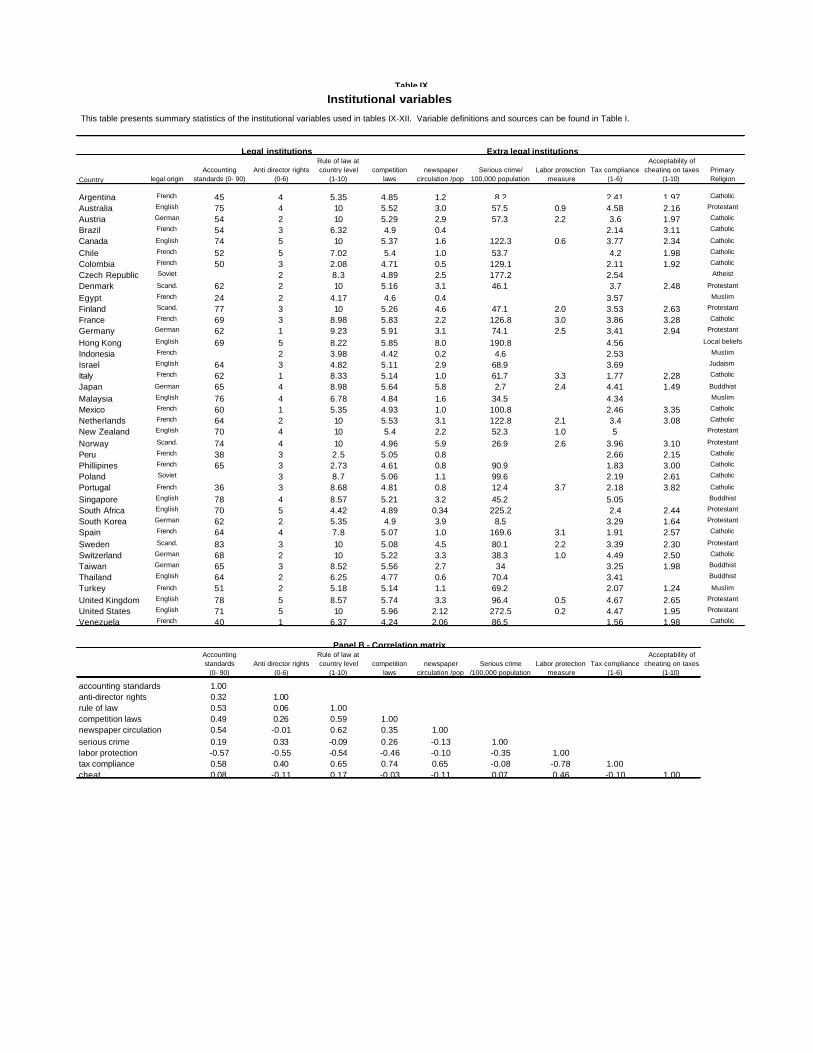
Country legal originAccounting
standards (0- 90)Anti director rights
(0-6)
Rule of law at country level
(1-10)competition
lawsnewspaper
circulation /popSerious crime/
100,000 populationLabor protection
measureTax compliance
(1-6)
Acceptability of cheating on taxes
(1-10)Primary Religion
Argentina French 45 4 5.35 4.85 1.2 8.2 2.41 1.97 Catholic
Australia English 75 4 10 5.52 3.0 57.5 0.9 4.58 2.16 Protestant
Austria German 54 2 10 5.29 2.9 57.3 2.2 3.6 1.97 Catholic
Brazil French 54 3 6.32 4.9 0.4 2.14 3.11 Catholic
Canada English 74 5 10 5.37 1.6 122.3 0.6 3.77 2.34 Catholic
Chile French 52 5 7.02 5.4 1.0 53.7 4.2 1.98 Catholic
Colombia French 50 3 2.08 4.71 0.5 129.1 2.11 1.92 Catholic
Czech Republic Soviet 2 8.3 4.89 2.5 177.2 2.54 Atheist
Denmark Scand. 62 2 10 5.16 3.1 46.1 3.7 2.48 Protestant
Egypt French 24 2 4.17 4.6 0.4 3.57 Muslim
Finland Scand. 77 3 10 5.26 4.6 47.1 2.0 3.53 2.63 Protestant
France French 69 3 8.98 5.83 2.2 126.8 3.0 3.86 3.28 Catholic
Germany German 62 1 9.23 5.91 3.1 74.1 2.5 3.41 2.94 Protestant
Hong Kong English 69 5 8.22 5.85 8.0 190.8 4.56 Local beliefs
Indonesia French 2 3.98 4.42 0.2 4.6 2.53 Muslim
Israel English 64 3 4.82 5.11 2.9 68.9 3.69 Judaism
Italy French 62 1 8.33 5.14 1.0 61.7 3.3 1.77 2.28 Catholic
Japan German 65 4 8.98 5.64 5.8 2.7 2.4 4.41 1.49 Buddhist
Malaysia English 76 4 6.78 4.84 1.6 34.5 4.34 Muslim
Mexico French 60 1 5.35 4.93 1.0 100.8 2.46 3.35 Catholic
Netherlands French 64 2 10 5.53 3.1 122.8 2.1 3.4 3.08 Catholic
New Zealand English 70 4 10 5.4 2.2 52.3 1.0 5 Protestant
Norway Scand. 74 4 10 4.96 5.9 26.9 2.6 3.96 3.10 Protestant
Peru French 38 3 2.5 5.05 0.8 2.66 2.15 Catholic
Phillipines French 65 3 2.73 4.61 0.8 90.9 1.83 3.00 Catholic
Poland Soviet 3 8.7 5.06 1.1 99.6 2.19 2.61 Catholic
Portugal French 36 3 8.68 4.81 0.8 12.4 3.7 2.18 3.82 Catholic
Singapore English 78 4 8.57 5.21 3.2 45.2 5.05 Buddhist
South Africa English 70 5 4.42 4.89 0.34 225.2 2.4 2.44 Protestant
South Korea German 62 2 5.35 4.9 3.9 8.5 3.29 1.64 Protestant
Spain French 64 4 7.8 5.07 1.0 169.6 3.1 1.91 2.57 Catholic
Sweden Scand. 83 3 10 5.08 4.5 80.1 2.2 3.39 2.30 Protestant
Switzerland German 68 2 10 5.22 3.3 38.3 1.0 4.49 2.50 Catholic
Taiwan German 65 3 8.52 5.56 2.7 34 3.25 1.98 Buddhist
Thailand English 64 2 6.25 4.77 0.6 70.4 3.41 Buddhist
Turkey French 51 2 5.18 5.14 1.1 69.2 2.07 1.24 Muslim
United Kingdom English 78 5 8.57 5.74 3.3 96.4 0.5 4.67 2.65 Protestant
United States English 71 5 10 5.96 2.12 272.5 0.2 4.47 1.95 Protestant
Venezuela French 40 1 6.37 4.24 2.06 86.5 1.56 1.98 Catholic
Accounting standards
(0- 90)Anti director rights
(0-6)
Rule of law at country level
(1-10)competition
lawsnewspaper
circulation /popSerious crime
/100,000 populationLabor protection
measureTax compliance
(1-6)
Acceptability of cheating on taxes
(1-10)
accounting standards 1.00anti-director rights 0.32 1.00rule of law 0.53 0.06 1.00competition laws 0.49 0.26 0.59 1.00newspaper circulation 0.54 -0.01 0.62 0.35 1.00serious crime 0.19 0.33 -0.09 0.26 -0.13 1.00labor protection -0.57 -0.55 -0.54 -0.46 -0.10 -0.35 1.00tax compliance 0.58 0.40 0.65 0.74 0.65 -0.08 -0.78 1.00cheat 0.08 -0.11 0.17 -0.03 -0.11 0.07 0.46 -0.10 1.00
Panel B - Correlation matrix
Table IX
Institutional variables
Legal institutions Extra legal institutions
This table presents summary statistics of the institutional variables used in tables IX-XII. Variable definitions and sources can be found in Table I.

54
Independent Variables(1) (2) (3) (4) (5) (6) (7) (8) (9)
Accounting standards -0.006***(0.002)
Anti director rights -0.031**(0.013)
Rule of law -0.028***(0.009)
Competition laws -0.135***(0.042)
Newspaper circulation/pop -0.033**(0.012)
Violent crime incidence 0.000(0.000)
Labor protection 0.030(0.021)
Catholic is primary religion 0.106*(0.062)
Tax compliance -0.078***(0.023)
Variables Controlled for:Buyer bargaining power y y y y y y y y yOwnership variables y y y y y y y y yFinancial distress y y y y y y y y yForeign acquiror y y y y y y y y yBuyer identity y y y y y y y y ySeller identity y y y y y y y y yIndustry group y y y y y y y y yTangibility of assets y y y y y y y y y
y y y y y y y y y
presence of takeover law y y y y y y y y yconstant y y y y y y y y y
number of observations 399 412 412 412 412 396 246 412 412Countries included 36 39 39 39 39 36 18 39 39R squared 0.203 0.166 0.244 0.244 0.245 0.203 0.188 0.176 0.218* significant at 10% level; ** significant at 5%; ***significant at 1% level
Interaction of relative strength of anti-director rights (home -target nation) and foreign acquiror
Table X
Institutional Determinants of Private Benefits of Control – Univariate analysis
Legal Institutions Extra Legal InstitutionsDependent Variable: Block Premium
The dependent variable is the block premia as a percent of firm equity. The explanatory variables include all of variables introduced in table VI expect the country fixed effects, but including a dummy to indicate the presence of a mandatory tender offer law. In place of the country fixed effects, we introduce one at a time several institutional variables: (1) accounting standards index; (2) anti-director rights index; (3) rule of law index; (4) tax compliance index; (5) diffusion of the press as measured by the newspaper circulation/ population; (6) an index of the extent of competition laws; (7) incidence of violent crimes; (8) extent of legal protections for labor; (9) a dummy variable if primary religion is Catholicism. More complete descriptions of variables are provided in Table I. Standard errors, which are reported in parentheses, are robust and clustered by country.

55
Independent Variables (1) (2) (3)anti director rights -0.020* 0.002
(0.011) (0.018)rule of law -0.025*** -0.007
(0.009) (0.010)catholic 0.019
(0.053)-0.059*** -0.058*(0.019) (0.033)-0.018** -0.015*(0.008) (0.009)
-0.037 (0.033)
Variables Controlled for:Buyer bargaining power y y yOwnership variables y y yFinancial distress y y yBuyer characteristics y y ySeller characteristics y y yForeign acquirer y y yIndustry type y y yTangibility of assets y y y
presence of takeover law y y yconstant y y y
number of observations 412 412 412Countries included 39 39 39R squared 0.203 0.230 0.230
* significant at 10% level; ** significant at 5%; ***significant at 1% level
competition laws
Dependent Variable: Block premium
Institutional Determinants of Private Benefits of Control – Multivariate analysisTable XI
tax compliance
newspaper circulation/ population
Interaction of relative strength of anti-director rights (home -target nation) and foreign acquiror
y y y
The dependent variable is the block premia as a percent of firm equity. The explanatory variables include all of the variables introduced in table VI expect the country fixed effects, but including a dummy to indicate the presence of a mandatory tender offer law. As institutional variables in specification (1) we use anti-director rights index and rule of law index. In specification (2) a dummy variable if primary religion is Catholicism, a tax compliance index, the diffusion of the press as measured by the newspaper circulation/ population and the index of the extent of competition laws. The independent variables in specification (3) are anti-director rights index, rule of law index, tax compliance index, diffusion of the press as measured by the newspaper circulation/ population. More complete descriptions of variables are provided in Table I. Standard errors, which are reported in parentheses, are robust and clustered by country.

56
Panel A. Block Premium by Legal Origin
Law Origin meanstandard deviation Number of Countries mean
standard deviation
Number of observations
scandinavian origin 0.04 0.03 4 0.04 0.07 46english origin 0.06 0.08 11 0.05 0.12 205german origin 0.11 0.15 6 0.05 0.14 58french origin 0.21 0.17 16 0.24 0.43 92soviet origin 0.34 0.33 2 0.37 0.62 11
Panel B. Investigating explanatory power of legal origin
Independent Variables (1) (2) (3) (4)english origin -0.131** 0.065 0.002
(0.063) (0.041) (0.057)soviet origin 0.117 0.121
(0.199) (0.206)german origin -0.213** -0.114
(0.090) (0.081)scandinavian origin -0.171*** -0.091*
(0.052) (0.050)tax compliance -0.064*** -0.089*** -0.069***
(0.019) (0.026) (0.020)Newspaper circulation -0.018** -0.010 0.001
(0.009) (0.010) (0.008)Variables controlled for:Buyer bargaining power y y y yOwnership variables y y y yFinancial distress y y y yBuyer identity y y y ySeller identity y y y yIndustry group y y y yTangibility of assets y y y yforeign acquirer dummy y y y y
presence of takeover law y y y yConstant y y y y
Num of obs. 412 412 412 412Num. of countries (clusters) 39 39 39 39R-squared 0.228 0.228 0.233 0.247* significant at 10% level; ** significant at 5%; ***significant at 1% level
Dependent Variable: Block premium
Groups of Legal Origin All transactions
Table XII
Private Benefits of Control and Legal Origin
yInteraction of relative strength of anti-director rights (home -target nation) and foreign acquiror
y y y
Panel A presents descriptive statistics of block premia by legal origin, first presenting averages at the country level and second presenting averages based on the full set of 412 transactions. Panel B provides OLS regressions of block premia on legal origin and our other explanatory variables. The independent variables examined are those included in Table X with (1) legal origin; (2) tax compliance and newspaper circulation; (3) English origin to capture the difference between common and civil law origin, tax compliance and newspaper circulation; (4) all legal origin dummies, tax compliance and newspaper circulation. More complete descriptions of variables are provided in Table I. Robust standard errors clustered by country are in parentheses.

57
Appendix Table 1 - Laws regarding control transactions
Country
Law requiring mandatory
purchase of additional
shares
Voluntary code requiring
purchase of additional
shares
Shareholding that
triggers mandatory purchase of
shares
Year of passage of dominant
legal statute Legal and Regulatory Bases on TakeoversArgentina N - - Resolution 227, National Securities CommissionAustralia Y 20 1989 Corporations LawAustria* Y 30 1999 Council of Vienna Stock Exchange, State CommissionerBrazil (1) Y 50 1976 Law 6404, law 9457, CVM rule #299Canada Y 20 1975 Canada Business Corporations Act, Provincial legislationChile (2) N - 1994 Law 18.045Colombia N - 1979 Act No. 32 Czech Republic Y 50 1991 Czech Commercial CodeDenmark Y 50 n/a Danish Securities Trading Act, Stock Exchange Ethics RulesEgyptFinland Y 67 1989 Securities Market ActFrance Y 33 1992 COB regulations, Stock Exchange CouncilGermany* (3) N Y 50 1995 Voluntary takeover code (Ubernahmekodex)Hong Kong N Y 35 1975 Hong Kong code on Takeovers and MergersIsrael N -Indonesia Y 20 1995 Decree of Capital Market Supervisory Agency No. 22/PM/1Italy Y 30 1998 Law no. 149Japan N - - Securities and Exchange Law Ch. II.2Kenya N - 1985 Company Act,Capital Markets Authority ActSouth Korea Y 25 Securities and Exchange LawMalaysia y 33 1993 Malaysian Code on takeovers and mergers, Companies ActMexico N - - Corporation Law, Credit Law, other regulatory actsNetherlands N - 1970 Merger Code of the Social Economic CouncilNew Zealand N - 1986 Companies Act 1986Norway Y 45 1985 Securities Trading ActPeru N - - Stock Market LawPhillipines* (4) Y - 1998 Revised tender-offer rules, Securities and exchange commissionPoland Y 33 1991 Act on Public Trading in Securities and Trust FundsPortugal Y 50 1986 Securities ActSingapore N Y 25 1985 Singapore Code on Takeovers and MergersSouth Africa Y 30 1991 Securities Regulation Code on Takeovers and MergersSpain Y 25 1991 Law No. 24, Royal Decree 1197Sweden N - 1991 Financial Instruments Trading ActSwitzerland* Y Y 33 1998 Federal Act on Stock Exchanges and Securities TradingTaiwan N - 1988 Securities and exchange Law, company law 1983Thailand Y 25 1992 Securities and Exchange ActTurkey* Y 25 1986 Capital Market LawUnited Kingdom N Y 30 1968 City code on Takeovers and MergersUnited States N - 1934 Securities and Exchange ActVenezuela N - - Capital Markets Law
Sources: ISSA Handbook, 6th and 7th edition, EIU country commerce guides, exchange web sites.(1) Prior to 1997, Brazil law 6404 required equal offer to minority investors with voting shares (but not non-voting preferred shares). This protection eliminated in May 1997 (Law 9457)
with reform to enhance privatization proceeds. In 1999, CVM rule #299 reintroduces protections for minorities, now extending to voting and non-voting class an equal price offer.
(2) IN December 2000 (after our observations) Chile has a new law, ley de OPSAS, governing control transactions.
(3) Germany has a voluntary takeover code (Ubernahmekodex) in place since 1995. This code "was deemed a failure in early 2000, when both stock market supervisors and the takeover
commission appointed by Mr.Schroder demanded a mandatory law." EIE Country Commerce, section 2.2. 2000.
(4) The SEC generally failed to enforce tender-offer rules in major deals involving mergers and acquisitions from 1998 to 2000 because of loopholes in the old regulations. (EIU March 2001)
Securities Regulation Code (RA 8799 effective August 2000, implementing rules January 2001) requires those assembling >15% to make offer.

58
Appendix Table 2 -No. of equities with price information in Datastream, by year
Country code 1989 1990 1991 1992 1993 1994 1995 1996 1997 1998 1999 2000 1990-2000Argentina 12 13 14 23 61 66 70 73 78 80 84 93 655Australia 452 474 487 515 594 697 741 1095 1176 1178 1287 1506 9750Austria 71 91 110 131 142 158 170 179 186 188 196 208 1759Brazil 75 143 234 314 371 371 456 481 500 540 557 4042Canada 1502 1971 1976 2024 2195 2353 2473 2653 2981 3222 3352 3759 28959Chile 115 127 134 151 164 170 177 196 209 220 219 221 1988Colombia 104 109 133 122 113 108 98 85 72 944Czech Republic 38 57 91 114 129 128 131 126 814Denmark 205 210 249 252 261 267 277 296 295 303 291 304 3005Egypt 10 12 65 72 82 101 103 445Finland 58 67 70 71 76 123 128 153 178 198 228 258 1550France 508 628 640 663 693 793 859 1084 1143 1287 1229 1416 10435Germany 618 700 735 742 777 800 835 893 926 1015 1188 1348 9959Hong Kong 251 266 322 371 429 494 518 567 676 723 756 1072 6194Indonesia 107 120 133 150 192 213 225 259 261 292 313 2265Israel 196 202 201 267 475 542 558 567 569 593 667 710 5351Italy 283 309 319 323 325 348 366 388 406 419 443 535 4181Japan 2011 2321 2520 2592 2677 2954 3136 3347 3552 3582 3829 4304 34814Malaysia 346 404 447 493 544 607 663 757 847 872 738 776 7148Mexico 46 52 75 99 132 151 145 152 172 163 170 160 1471Netherlands 237 260 271 273 277 288 303 326 361 408 437 482 3686New Zeland 68 74 80 91 111 126 130 145 154 153 157 176 1397Norway 80 97 100 114 128 160 182 217 273 287 269 274 2101Peru 22 48 76 98 100 105 102 99 104 96 850Phillipines 64 96 103 114 137 160 187 212 231 229 222 225 1916Poland 6 11 12 22 27 51 103 167 200 221 820Portugal 101 110 116 135 140 149 144 148 155 152 143 148 1540Singapore 142 172 176 195 222 255 273 293 337 348 409 534 3214South Africa 161 458 454 469 483 526 535 606 641 724 770 736 6402South Korea 604 660 678 685 694 739 796 1017 1135 1140 1299 1569 10412Spain 110 125 133 138 149 152 154 165 184 211 234 264 1909Sweden 177 197 202 213 232 296 318 362 442 484 532 633 3911Switzerland 259 295 295 290 309 325 343 375 390 401 426 459 3908Taiwan 161 178 199 240 271 305 340 451 515 620 738 856 4713Thailand 244 291 350 410 441 521 537 576 602 579 546 531 5384Turkey 70 100 125 135 152 178 209 236 270 298 302 387 2392United Kingdom 1812 1872 1749 1713 1782 1841 1932 2084 2222 2272 2301 2625 22393United States 274 393 415 419 427 438 462 662 929 1235 2671 4743 12794Venezuela 10 10 11 14 19 21 22 23 25 29 53 237Total 2011 2321 2520 2592 2677 2954 3136 3347 3552 3582 3829 4743