prisoner reentry experiences of adult males: characteristics
TRANSCRIPT

PPrriissoonneerr RReeeennttrryy EExxppeerriieenncceess ooff AAdduulltt MMaalleess:: CChhaarraacctteerriissttiiccss,, SSeerrvviiccee RReecceeiipptt,, aanndd OOuuttccoommeess
ooff PPaarrttiicciippaannttss iinn tthhee SSVVOORRII MMuullttii--ssiittee EEvvaalluuaattiioonn
TTHHEE MMUULLTTII--SSIITTEE EEVVAALLUUAATTIIOONN OOFF TTHHEE SSEERRIIOOUUSS AANNDD VVIIOOLLEENNTT OOFFFFEENNDDEERR RREEEENNTTRRYY IINNIITTIIAATTIIVVEE
DDeecceemmbbeerr 22000099
Pamela K. Lattimore RTI International 3040 East Cornwallis Road Research Triangle Park, NC 27709 Phone: (919) 485-7759 Fax: (919) 541-5985 [email protected]
Danielle M. Steffey RTI International 3040 East Cornwallis Road Research Triangle Park, NC 27709 Phone: (919) 485-7759 Fax: (919) 541-5985 [email protected]
Christy A. Visher University of Delaware/The Urban Institute Center for Drug and Alcohol Studies 77 East Main Street Newark, DE 19716 Phone: (302) 831-6921 Fax: (302) 831-3307 [email protected]
This project was supported by Grant No. 2004-RE-CX-002 awarded by the National Institute of Justice, Office of Justice Programs, U.S. Department of Justice. Points of view in this document are those of the authors and do not necessarily represent the official position or policies of the U.S. Department of Justice.


iii
AAcckknnoowwlleeddggmmeennttss
The Multi-site Evaluation of the Serious and Violent Offender Reentry Initiative (SVORI) was supported by grant number 2004-RE-CX-002 from the National Institute of Justice (U.S. Department of Justice) and was conducted by RTI International and the Urban Institute. Points of view are those of the authors and do not necessarily represent those of the U.S. Department of Justice.
Principal Investigators Pamela K. Lattimore, RTI International Christy A. Visher, University of Delaware and Urban Institute
Report Authors Pamela K. Lattimore, RTI International Danielle M. Steffey, RTI International Christy A. Visher, University of Delaware and Urban Institute
Staff Contributors Susan Brumbaugh, RTI International Alexander Cowell, RTI International Debbie Dawes, RTI International Christine Lindquist, RTI International Mark Pope, RTI International Laura Winterfield, Urban Institute
We also acknowledge the contributions of the site liaisons from RTI and the Urban Institute, who documented the implementation of SVORI programming across the sites and facilitated data collection for the impact study. In addition, we are grateful for the hard work and dedication shown by our field interviewers, supervisors, and data collection task leader throughout the data collection period.
iv
RTI and the Urban Institute thank the SVORI project directors, other program and research staff from the SVORI sites, and staff at the facilities where interviews were conducted. We greatly appreciate the assistance and support received from these individuals.
Finally, RTI and the Urban Institute acknowledge the invaluable assistance and direction provided by the members of our external advisory group.
For more information about the SVORI Multi-site Evaluation, please visit our Web site at http://www.svori-evaluation.org/.

v
AAbbssttrraacctt Statement of Purpose
The Serious and Violent Offender Reentry Initiative (SVORI) funded 69 agencies in 2003 to develop programs to improve criminal justice, employment, education, health, and housing outcomes for released prisoners. These programs were to conduct assessments and provide participants programs and services during and after incarceration. The SVORI Multi-site Evaluation was funded by the National Institute of Justice to examine the extent to which SVORI program participation improved access to appropriate, comprehensive, integrated services and resulted in better outcomes.
Research Subjects
This report presents findings for the adult male participants in 12 programs selected for the impact evaluation (863 SVORI participants; 834 comparison men). The study participants had extensive criminal and substance use histories, low levels of education and employment skills, and high levels of need across a range of services (e.g., education, driver’s license, substance abuse treatment, job training and employment).
Study Methods
The impact evaluation included interviews 30 days pre-release and 3, 9, and 15 months post-release. Data from state agencies and the National Criminal Information Center documented post-release recidivism. Propensity score techniques were used to improve the comparability between the SVORI and non-SVORI groups. Weighted analyses examined the treatment effects of SVORI program participation.
Major Findings
The report provides evidence that SVORI program participation increased receipt of services and programming. Program participants were significantly more likely, e.g., to have reentry

vi
plans, met with someone and participated in programs to prepare for release, participated in programs to reduce criminal thinking, participated in employment and education programs, and received a needs assessment—although levels of provision for most services fell short of 100% and declined substantially following release.
Modest improvements were observed for some outcomes in the housing, employment, substance use, and criminal behavior domains. SVORI appeared to have a positive impact on abstinence from drug use, although drug use was quite high for both groups and increased across the follow-up periods. The men enrolled in SVORI programs were less likely to report perpetrating violence and engaging in criminal behavior and to have an officially recorded rearrest, although these differences were not statistically significant. There was no difference in the proportions reporting being booked in jail or reincarcerated. Administrative data confirmed no difference in reincarceration rates—with about 40% of both groups reincarcerated within 24 months.
Conclusions
Although SVORI programs were successful in increasing the types and amounts of needs-related services provided prior to and after release from prison, the proportion of individuals who reported receiving services was less than reported need and, generally, less than the expectations of the SVORI program directors. This finding is consistent with SVORI programs that were developing and implementing their programs and provides a reminder that starting complex programs may require sustained effort over several years to reach full implementation.
Service delivery declined following release. Thus, overall, the programs were unable to sustain support to individuals during the critical, high-risk period immediately following release. This decline may be due to the programs’ difficulty identifying and coordinating services for individuals released across wide geographic areas and, again, suggests the need for sustained effort to reach full implementation.
SVORI program participation resulted in modest improvements in intermediate outcomes at levels consistent with findings from meta-analyses of single-program efforts (e.g., 10% to 20%). If

vii
the underlying model that links services to improved intermediate outcomes that in turn improve recidivism is correct, the level of improvement in these intermediate outcomes may have been insufficient to result in observable reductions in recidivism.
Additional analyses are planned to determine whether there are specific programs or subgroups associated with positive outcomes and to examine the relationship between receipt of specific services and outcomes.


ix
CCoonntteennttss
Section Page
Executive Summary ES-1
Introduction 1 Research on Prisoner Reentry ..................................... 4 SVORI .................................................................... 16 Adult Impact Site SVORI Programs ............................. 19 Multi-site Evaluation design ....................................... 22
Characteristics of the SVORI and Non-SVORI Comparison Respondents 35
Demographic Characteristics ...................................... 35 Housing .................................................................. 39 Family and Children .................................................. 39 Substance Use and Physical and Mental Health ............. 42 Employment History and Financial Support .................. 50 Criminal History, Violence, Victimization, and Gang
Involvement ....................................................... 54 In-Prison Experiences ............................................... 56 Summary ................................................................ 62
Self-reported Service Needs 65 Weighted Service Need Bundle Scores across
Waves 1 through 4 .............................................. 68 Employment/Education/Skills Services ........................ 71 Transition Services ................................................... 72 Health Services ........................................................ 76 Domestic Violence Services ........................................ 76 Child Services .......................................................... 78 Levels of Need Across Services ................................... 80
Self-reported Service Receipt 83 Weighted Service Need Bundle Scores Across
Waves 1 through 4 .............................................. 86 Coordination Services ............................................... 89

x
Employment/Education/Skills Services ........................ 92 Transition Services ................................................... 94 Health Services ........................................................ 97 Domestic Violence Services ........................................ 99 Child Services .......................................................... 99 Summary and Conclusions ....................................... 100
Outcomes 105 Housing ................................................................ 107 Employment .......................................................... 113 Family, Peers, and Community Involvement ............... 117 Substance Use and Physical and Mental Health ........... 121 Criminal Behavior and Recidivism ............................. 127 Taking a Broad View: Outcomes Over Domains and
Time ............................................................... 134
Conclusions, Policy Implications, and Future Work 139
References 147
Appendix A. Data Tables A-1

xi
EExxhhiibbiittss
Exhibit Number Page
ES-1. Completed interviews by wave, group, and site ES-6
ES-2. Use of specific substances during the 30 days prior to incarceration, by group ES-9
ES-3. Criminal history of respondents, by group ES-9
ES-4. Weighted average super bundle scores by group for Waves 1 through 4 ES-11
ES-5. Weighted average service receipt super bundle scores by group for Waves 1 through 4 ES-13
1. SVORI program logic model and evaluation framework 17
2. Outcome foci among adult impact and non–impact sites 20
3. Mean proportion of SVORI program participants receiving pre-release and post-release services in adult program impact sites (as reported by program directors) 21
4. Adult male sample sizes, by state and group 25
5. Completed interviews by wave, group, and site 27
6. t-statistics comparing means of SVORI and non-SVORI groups 29
7. Balance checks for Wave 1 data based on propensity score weighted regression of the variable on a SVORI indicator 33
8. Characteristics of p̂ distributions for adult male SVORI and non-SVORI evaluation participants 34
9. Demographic characteristics of respondents at time of interview, by group 36
10. Age at time of interview, by site and group 37
11. Race (white or black), by site and group 38
12. Completed 12th grade or obtained a GED, by site and group 39

xii
13. Percentages of fathers reporting on child care or child support responsibilities, by group 40
14. Criminal history and substance use of family and peers, by group 41
15. Lifetime substance use, by group 43
16. Lifetime use of cocaine, heroin, and hallucinogens, by site and group 44
17. Substance use during the 30 days prior to incarceration, by site and group 45
18. Use of specific substances during the 30 days prior to incarceration, by group 45
19. Any substance use treatment prior to current incarceration, by site and group 46
20. Lifetime health problems, by group 47
21. Current health problems, by group 48
22. Average scores on Brief Symptom Inventory subscales, by group 49
23. Employment prior to incarceration, by group 51
24. Employment during the 6 months prior to incarceration, by site and group 51
25. Characteristics of respondents’ jobs prior to incarceration, by groupa 52
26. Sources of income during the 6 months prior to incarceration, by employment status and group 54
27. Criminal history of respondents, by group 55
28. Conviction offenses for current incarceration, by group 56
29. Average duration of incarceration at time of interview, by site and group 57
30. Disciplinary infractions and administrative segregations during current incarceration, by group 58
31. Institutional employment, by site and group 59
32. Work-release participation, by site and group 60
33. Frequency of in-prison contact with family members and friends, by group 61
34. Amount of contact with family members and friends at time of interview compared with contact when first incarcerated 62
35. Pre-release service need bundle scores across service bundles, by group 67
36. Most commonly reported service needs pre-release, by group 67
37. Weighted average super bundle scores by group for Waves 1 through 4 69

xiii
38. Weighted average service bundle scores by type (Employment/Education/Skills, Transition Services, Health Services), group (SVORI, non-SVORI), and wave (1, 2, 3, 4) 70
39. Weighted average super bundle scores by type (Child Services, Domestic Violence, group (SVORI, non-SVORI), and wave (1, 2, 3, 4) 71
40. Weighted means for employment/education/skills bundles and items, by group and wave 73
41. Weighted means for transition services bundles and items, by group and wave 74
42. Weighted means for health services bundles and items, by group and wave 77
43. Weighted means for domestic violence services bundles and items, by group and wave 78
44. Weighted means for child services bundles and items, by group and wave 79
45. Pre-release service receipt bundle scores across service bundles, by group 85
46. Weighted average service receipt super bundle scores by group for Waves 1 through 4 86
47. Weighted average service need and receipt super bundle scores by group for Waves 1 through 4 87
48. Weighted average service receipt bundle scores by type, group, and wave 88
49. Weighted average service receipt bundle scores by type, group, and wave 89
50. Weighted means for coordination services bundles and items, by group and wave 91
51. Weighted means for employment/education/skills service receipt bundles and items, by group and wave 93
52. Weighted means for transition services receipt bundles and items, by group and wave 95
53. Weighted means for health services receipt bundles and items, by group and wave 98
54. Weighted means for domestic violence services receipt bundles and items, by group and wave 100
55. Weighted means for child services bundles and items, by group and wave 101
56. SVORI Program Model 106
57. Self-reported homeless, living in a shelter, or without a set place to live, by group and wave 108
58. Percentages living with mothers or fathers post-release, by group (SVORI and non-SVORI) and post-release follow-up wave (2, 3, and 4) 109

xiv
59. Percentages living with partners, spouses, or children post-release, by group (SVORI and non-SVORI) and post-release follow-up wave (2, 3, and 4) 110
60. Weighted means and regression parameter estimates for housing outcomes 111
61. Percentage reporting living in own house or apartment; weighted means by group and follow-up wave 112
62. Weighted means and regression parameter estimates for employment outcomes 115
63. Weighted means for self-report that job provides insurance or paid leave, by group (SVORI, non-SVORI) and data collection wave (2, 3, or 4) 116
64. Weighted means for self-report of supporting self with a job, by group and data collection wave 117
65. Marital status and intimate partnerships by group and wave 119
66. Percentage reporting civic action since release/last interview 121
67. Weighted means and regression parameter estimates for substance use outcomes 123
68. Percentages of each group who reported no drug use since release/last interview and had no positive drug test 124
69. Percentages of each group who reported no drug use in the past 30 days and had no positive drug test 124
70. Weighted means and regression parameter estimates for mental health outcomes 126
71. Weighted means and regression parameter estimates for core self-report recidivism outcomes 128
72. Weighted average reports of committing no crimes since release/last interview 129
73. Weighted average reports of committing no violent crimes/no weapons since release/last interview 130
74. Weighted average reports of not reincarcerated at interview 131
75. Weighted average reports of not reincarcerated at interview and no jail/prison stay of more than 24 hours since release/interview 131
76. Official measures of recidivism 133
77. Cumulative rearrest rates by group 134
78. Cumulative reincarceration rates by group 134

xv
79. Odds ratios from propensity score weighted logistic regressions of 98 Wave 2 (3-month) outcomes as a function of SVORI program participation 135
80. Odds ratios from propensity score weighted logistic regressions of 93 Wave 3 (9-month) outcomes as a function of SVORI program participation 136
81. Odds ratios from propensity score weighted logistic regressions of 98 Wave 4 (15 month) outcomes as a function of SVORI program participation 136
82. Summary results of odds ratios from propensity score weighted logistic regressions of three waves of outcomes as a function of SVORI program participation 137
A-1. Adult male case disposition—Wave 1 (pre-release) A-1
A-2. Respondent characteristics, by group (pre-release) A-2
A-3. Proportion of respondents who reported needing specific services, by group (pre-release) A-11
A-4. Proportion of respondents who reported receiving specific services, by group (pre-release) A-12
A-5. Proportion of respondents who reported living with the indicated individuals in the period since the last interview A-14


ES-1
EExxeeccuuttiivvee SSuummmmaarryy
In 2003, the U.S. Department of Justice (DOJ), Department of Labor (DOL), Department of Education (DOEd), Housing and Urban Development (HUD), and Department of Health and Human Services (HHS) provided more than $100,000,000 in grant funds to states to develop, enhance, or expand programs to facilitate the reentry of adult and juvenile offenders returning to communities from prisons or juvenile detention facilities. The Serious and Violent Offender Reentry Initiative (SVORI) funded agencies to develop programs to improve criminal justice, employment, education, health, and housing outcomes for released prisoners. Sixty-nine agencies received federal funds ($500,000 to $2,000,000 over 3 years) to develop 89 programs. The initiative responded to emerging research findings that suggested that providing individuals with comprehensive, coordinated services based on needs and risk assessments could result in improved post-release outcomes. Grantees were to use their SVORI funding to create a three-phase continuum of services for returning serious and/or violent prisoners that began during the period of incarceration, intensified just before release and during the early months post-release, and continued for several years after release as former inmates took on more productive and independent roles in the community.
The initiative imposed relatively few restrictions on grantees. The criteria for programs funded by SVORI grants were the following:
Programs were to improve criminal justice, employment, education, health (including substance abuse and mental health), and housing outcomes.
Programs were to include collaborative partnerships between correctional agencies, supervision agencies,
SVORI responded to emerging research findings that suggested providing individuals with comprehensive, coordinated services based on needs and risk assessments could result in improved post-release outcomes.

Prisoner reentry experiences of adult males
ES-2
other state and local agencies, and community and faith-based organizations.
Program participants were to be serious and/or violent offenders.
Program participants were to be 35 years of age or younger.
Programs were to encompass three stages of reentry—in prison, post-release on supervision, and post-supervision.
Needs and risk assessments were to be used to guide the provision of services and programs to participants.
In some cases, grantees asked for and received permission for exceptions to these criteria. For example, some programs were primarily post-release programs, and age restrictions were sometimes lifted (e.g., for programs targeting sex offenders).
The SVORI programs attempted to address the initiative’s goals and provide a wide range of coordinated services to returning prisoners. Although SVORI programs shared the common goals of improving outcomes across various dimensions and improving service coordination and systems collaboration, programs differed substantially in their approaches and implementations (Lindquist, 2005; 2005; Winterfield, Lattimore, Steffey, Brumbaugh, & Lindquist, 2006; Winterfield & Lindquist, 2005).
In spring 2003, the National Institute of Justice awarded RTI International, a nonprofit research organization, a grant to evaluate programs funded by SVORI. The Urban Institute, a nonpartisan economic and social policy research organization, collaborated on the project. With data collected from grantee staff, partnering agencies, and returning prisoners, the 6-year evaluation involved an implementation evaluation of all 89 SVORI programs, an intensive impact evaluation of 12 adult and 4 juvenile programs, and an economic analysis of a subset of the impact sites (see Lattimore, Visher, Winterfield, Lindquist, & Brumbaugh, 2005). The goal of the SVORI evaluation was to document the implementation of SVORI programs and determine whether they accomplished SVORI’s overall goal of increasing public safety by reducing recidivism among the populations served. The SVORI evaluation was designed to answer the following research questions:
To what extent did SVORI lead to more coordinated and integrated services among partner agencies?

Executive Summary
ES-3
To what extent did SVORI participants receive more individualized and comprehensive services than comparable non-SVORI offenders?
To what extent did reentry participants demonstrate better recidivism, employment, health, and personal functioning outcomes than comparable non-SVORI offenders?
To what extent did the benefits derived from SVORI programming exceed the costs?
The local nature of the SVORI programs and the expectation that programs would tailor services to meet individual needs meant that the intervention to be evaluated was not a program in the typical conceptualization of the term (e.g., a residential drug program or a cognitive behavior program). Instead, SVORI was a funding stream that agencies used to expand and enhance existing programs or to develop and implement new programs. Further, individuals not in SVORI programs also generally received some services. Thus, although the components of the individual programs were identified and the extent of service receipt was measured, the SVORI Multi-site Evaluation was not designed to examine the impact of specific services or combinations of services. The evaluation was designed to determine whether individuals who participated in enhanced reentry programming, as measured by their enrollment in SVORI programs, had improved post-release outcomes.
This report presents findings for the adult male participants in the impact evaluation. Other results from the impact and economic evaluations are presented in the following reports:
Lattimore, P. K., & Visher, C. A. (2009). The Multi-site Evaluation of SVORI: Summary and synthesis. Research Triangle Park: RTI International.
Lattimore, P. K., & Steffey, D. M. (2009). The Multi-Site Evaluation of SVORI: Methodology and analytic approach. Research Triangle Park, NC: RTI International.
Lindquist, C. H., Barrick, K., Lattimore, P. K., & Visher, C. A. (2009). Prisoner reentry experiences of adult females: Characteristics, service receipt, and outcomes of participants in the SVORI Multi-site Evaluation. Research Triangle Park, NC: RTI International.
The evaluation was designed to determine whether individuals who participated in enhanced reentry programming, as measured by their enrollment in SVORI programs, had improved post-release outcomes.
Prisoner reentry experiences of adult males
ES-4
Lattimore, P. K., Steffey, D. M., & Visher, C. A. (2009). Prisoner reentry experiences of adult males: Characteristics, service receipt, and outcomes of participants in the SVORI Multi-site Evaluation. Research Triangle Park, NC: RTI International.
Hawkins, S., Dawes, D., Lattimore, P. K., & Visher, C. A. (2009). Reentry experiences of confined juvenile offenders: Characteristics, service receipt, and outcomes of juvenile male participants in the SVORI Multi-site Evaluation. Research Triangle Park, NC: RTI International.
Cowell, A., Roman, J., & Lattimore, P. K. (2009). An economic evaluation of the Serious and Violent Offender Reentry Initiative. Research Triangle Park, NC: RTI International.
The following section summarizes the research design. Subsequent sections present key findings and conclusions.
RESEARCH DESIGN The SVORI Multi-site Evaluation included an implementation assessment (to document the programming delivered across the SVORI programs) and an impact evaluation (to determine the effectiveness of programming). Sixteen programs were included in the impact evaluation, comprising 12 adult programs and 4 juvenile programs located in 14 states (adult only unless specified): Colorado (juveniles only), Florida (juveniles only), Indiana, Iowa, Kansas (adults and juveniles), Maine, Maryland, Missouri, Nevada, Ohio, Oklahoma, Pennsylvania, South Carolina (adults and juveniles), and Washington.1 The impact evaluation included pre-release interviews (conducted approximately 30 days before release from prison) and a series of follow-up interviews (conducted at 3, 9, and 15 months post-release). Nearly 2,400 prisoners returning to society—some of whom received SVORI programming and some of whom received “treatment as usual” in their respective states—were included in the impact evaluation. An economic analysis was also conducted in five of the impact sites to assess the extent to which program benefits exceeded costs; findings from this study are reported separately (see Cowell et al., 2009).
1 Site selection and other methodological aspects of the study are
described in The Multi-site Evaluation of SVORI: Methodology and Analytic Approach (Lattimore & Steffey, 2009).
Executive Summary
ES-5
A site-specific research design was developed for each impact site (see Lattimore & Steffey, 2009). In two sites (Iowa and Ohio), individuals were randomly assigned to SVORI programs. In the remaining sites, comparison groups were developed by isolating the criteria that local site staff used to identify individuals eligible for enrollment in their SVORI program (these included factors such as age, criminal history, risk level, post-release supervision, transfer to pre-release facilities, and county of release) and replicating the selection procedures on a different population. Where possible, the comparison participants came from the same pre-release facilities and were returning to the same post-release geographic areas as the SVORI participants.
Data collection consisted of four waves of in-person, computer-assisted interviews: the pre-release interview (Wave 1) conducted about 1 month before expected release and three follow-up interviews (Waves 2 through 4) conducted 3, 9, and 15 months after release. In addition, oral swab drug tests were conducted during the 3- and 15-month interviews for respondents who were interviewed in a community setting. For examination of recidivism outcomes, the interview and drug test data were supplemented with arrest data obtained from the FBI National Crime Information Center (NCIC) and with administrative records obtained from state correctional agencies.2 All interviews were conducted in private settings by experienced RTI field interviewers using computer-assisted personal interviewing. Pre-release interviews were conducted from July 2004 through November 2005 in more than 150 prisons and juvenile detention facilities and were designed to obtain data on the respondents’ characteristics and pre-prison experiences, as well as incarceration experiences and services received since admission to prison. Post-release interviews were conducted from January 2005 through May 2007. The post-release interviews were similar in content across waves and obtained data on reentry experiences, housing, employment, family and community integration, substance abuse, physical and mental health, supervision and criminal history, service needs, and service receipt.
2 Note that in some instances these administrative records were
supplemented with data obtained from online criminal history databases. Readers are referred to Lattimore and Steffey (2009) for details.

Prisoner reentry experiences of adult males
ES-6
A total of 2,564 cases were fielded of adult men eligible for inclusion in the multi-site evaluation. Wave 1 (pre-release) interviews were obtained with 1,697 (66%) of these men. Among eligible subjects approached for interviews, refusal rates were reasonably low—11.5% across the 12 sites. Most of the noninterviews (21% of fielded cases) were due to the men being released before their Wave 1 pre-release interview could be scheduled and completed. Nearly 80% of the men who were interviewed at Wave 1 responded to at least one of the follow-up interviews. All cases were fielded for each follow-up wave. Overall, the response rate for follow-up interviews increased over time. Response rates for the Wave 2, 3, and 4 interviews were 58%, 61%, and 66%, respectively. All three follow-up interviews were obtained for 43% of the adult male samples. Exhibit ES-1 shows the number of interviews conducted at each wave, by group and site.
Exhibit ES-1. Completed interviews by wave, group, and site
State
Wave 1 (Pre-release)
Wave 2 (3 Months Post)
Wave 3 (9 Months Post)
Wave 4 (15 Months Post)
SVORI Non-
SVORI SVORI Non-
SVORI SVORI Non-
SVORI SVORI Non-
SVORI IA 114 55 59 29 82 39 87 46 IN 64 94 49 53 41 56 45 59 KS 23 48 11 15 14 15 15 24 MD 130 124 58 63 64 56 65 65 ME 35 44 20 21 24 26 25 30 MO 36 50 26 31 27 24 26 35 NV 107 50 77 31 81 31 82 29 OH 47 38 25 26 28 27 28 26 OK 42 51 26 12 29 17 24 27 PA 57 66 43 50 44 50 46 48 SC 179 166 123 104 119 95 126 109 WA 29 48 12 20 12 34 13 33 Total 863 834 529 455 565 470 582 531
Although the response rates were reasonable, the possibility remains that respondents who “dropped out” of subsequent waves of interviews differed from those who completed the follow-up interviews. As preliminary evidence that the attrition was random or affected the SVORI and non-SVORI groups similarly, the SVORI and comparison groups were compared

Executive Summary
ES-7
and were found to be similar at each wave on a range of characteristics. Results from models that examined for differences between groups with respect to response also suggested that SVORI program participation was not related to whether a participant responded.
Propensity score techniques were used to improve the comparability between the SVORI and non-SVORI groups. Weighted analyses were used to examine the treatment effects of SVORI program participation with respect to outcomes in housing, employment, family/peer/community involvement, substance use, physical and mental health, and criminal behavior and recidivism.
KEY FINDINGS This section summarizes key findings from the evaluation. Characteristics of study participants are described next, followed by descriptions of expressed service needs, reported service receipt, and post-release outcomes.
Research Subject Characteristics
The study enrolled 863 SVORI program participants and 834 comparison men. The study participants were high-risk offenders who had extensive criminal and substance use histories, low levels of education and employment skills, and families and peers who were substance and criminal justice system involved. There were few statistically significant differences in the characteristics of the groups.
More than half (57%) of the SVORI respondents were black and 32% were white. Only 4% of both groups identified themselves as Hispanic. The average age of respondents in both samples was about 29 years at the time of the pre-release interview. Respondents in both groups had substantial educational deficiencies—over one third (39% SVORI and 42% non-SVORI) had not completed 12th grade or earned a GED. Most subjects reported having worked at some time prior to incarceration—89% of SVORI versus 92% of non-SVORI—and about two thirds of both groups reported having a job during the 6 months prior to incarceration (64% and 68%, SVORI and non-SVORI, respectively).
More than 1 in 10 of both SVORI and non-SVORI respondents reported that they were homeless, living in a shelter, or had no
The study participants were high-risk offenders who had extensive criminal and substance use histories, low levels of education and employment skills, and families and peers who were substance and criminal justice system involved.

Prisoner reentry experiences of adult males
ES-8
set place to live prior to their current incarceration. About 40% of both groups reported that they were either currently married or in a steady relationship (39% SVORI, 40% non-SVORI) at the time of the pre-release interview. Most study participants from both groups (59% SVORI and 61% non-SVORI) reported having children under age 18. Large majorities of both groups reported having family members and friends who had been convicted of a crime or incarcerated, and who had problems with drugs or alcohol.
Nearly all of the respondents reported having used alcohol and drugs during their lifetimes. The majority of both groups reported using alcohol (96% SVORI and 97% non-SVORI), and the average age of first use was about 14 years (13.7 and 13.6 for the SVORI and non-SVORI respondents, respectively). Similarly, nearly all respondents in both groups reported having used marijuana (92% SVORI and 94% non-SVORI), again reporting a young age of first use (13.9 and 14.1 for the SVORI and non-SVORI respondents, respectively). More than half of all respondents reported having used cocaine (53% and 58% of the SVORI and non-SVORI respondents, respectively), and nearly one half reported having used hallucinogens (43% and 49%, SVORI and non-SVORI, respectively). Fewer respondents reported using other substances.
There were few differences between the two groups with respect to reported drug use during the 30 days prior to their current incarceration. About two thirds of both groups reported having used one or more illicit drugs during the 30 days prior to their imprisonment (66% and 69% for the SVORI and non-SVORI respondents, respectively). Exhibit ES-2 shows the two groups’ reported drug use during the 30 days prior to incarceration for the most commonly reported drugs. More than half of both SVORI and non-SVORI respondents reported using marijuana; approximately one quarter of all respondents reported using cocaine. More than half of SVORI and non-SVORI respondents had received treatment for a substance use or mental health problem at some point during their lifetime (56% and 55% of SVORI and non-SVORI, respectively).
SVORI and non-SVORI respondents reported considerable involvement with the criminal justice system prior to their current incarceration (Exhibit ES-3). On average, the respondents were 16 years old at the time of their first arrest
Nearly all of the respondents reported having used alcohol and drugs during their lifetimes.
About two thirds of both groups reported having used one or more illicit drugs during the 30 days prior to their imprisonment.

Executive Summary
ES-9
9
14
14
26
53
9
11
13
22
52
0% 20% 40% 60% 80% 100%
Hallucinogens
Pain relievers
Amphetamines
Cocaine
Marijuana
SVORINon-SVORI
Note: Differences between SVORI and non-SVORI are not significant at the 0.05 level.
Criminal History SVORI Non-SVORI
Age at first arrest (mean) 15.92 16.03 Times arrested (mean) 12.42 13.14 Times convicted (mean) 5.48 5.70 Ever been previously incarcerated* 83% 87% Times previously incarcerated (mean)* 1.20 1.47 *p < 0.05 for test of significant difference between SVORI and non-SVORI.
and had been arrested more than 12 times.3 In addition to their current term of incarceration, most respondents had served a previous prison term, with the non-SVORI group being significantly more likely to report a prior prison term (83% of SVORI, 87% of non-SVORI). Also, the non-SVORI respondents reported significantly more incarcerations, on average, than the SVORI group (1.20 for SVORI, 1.47 for non-SVORI).
The two groups were similar in self-reported juvenile detentions. Overall, about half reported that they had spent time in a juvenile correctional facility for committing a crime. Of
3 This measure of prior arrest recoded extreme values to the 95th
percentile of reported arrests. The uncapped means were 14.48 (standard deviation 23.25) and 14.56 (standard deviation 17.49) for SVORI and non-SVORI groups, respectively.
Exhibit ES-2. Use of specific substances during the 30 days prior to incarceration, by group
Exhibit ES-3. Criminal history of respondents, by group

Prisoner reentry experiences of adult males
ES-10
those who reported a juvenile detention, they reported having been detained, on average, 3.5 times.
At the time of the pre-release interview, SVORI respondents had been incarcerated significantly longer than non-SVORI respondents (an average of 2.8 years and 2.3 years, respectively). SVORI respondents also were more likely than the non-SVORI respondents to report disciplinary infractions and administrative segregations during their current incarceration. Nearly two thirds (64%) of SVORI respondents reported at least one disciplinary infraction, compared with 57% of non-SVORI respondents. Less than half reported administrative segregation during the current term of incarceration (45% of SVORI and 40% of non-SVORI). These differences between groups are statistically significant but may simply reflect the longer lengths of stay reported by the SVORI respondents.4
Service Needs
The findings substantiate previous research that male prisoners returning to their communities after serving more than 2 years in prison comprise a population with extremely high needs and that their expressed needs remained high (if somewhat diminished from pre-release) up to 15 months following release from prison. Overall, there was little difference in reported needs between the two groups. Key findings are summarized below.
Expressed need for services post-release were lower overall than those expressed 30 days prior to release.
There was little difference in reported service needs at 3, 9, and 15 months following release.
Levels of expressed need for educational/education/skills and transition services and programming were high and similar overall for men participating in SVORI programs and the comparison subjects.
More than 85% of respondents at all waves reported needing more education, the highest need of six employment/education/skills services
Financial assistance, transportation and a driver’s license were the most commonly reported of 10 transition
4 Longer lengths of stay expose subjects to greater opportunity to
commit infractions and receive administrative segregation; in other words, the period at risk is longer.
SVORI respondents had been incarcerated significantly longer than non-SVORI respondents…and were more likely to report infractions and segregation.

Executive Summary
ES-11
service needs pre-release and at 3, 9 and 15 months post-release.
Public health care insurance and financial assistance were also consistently reported as needs by majorities of both groups.
Service need bundle scores were developed to summarize needs across specific domain areas (transition services; health care services; employment, education and skills services; domestic violence-related services; and child-related services) and overall. There were a total of 28 needs across the bundles, including 5 in the child-related services that were only relevant for the men who reported having children. Scores for each individual were generated by summing one/zero indicators for whether the individual reported or did not report needing each of the items; this sum was then divided by the number of items in the bundle. At the individual respondent level, this score can be interpreted as the proportion of the services in the bundle that the individual reported needing. The “super bundle” need scores are shown in Exhibit ES-4, which suggests three findings: (1) SVORI and non-SVORI subjects were similar on the level of reported need across all waves; (2) overall need dropped following release; and (3) there was little difference in average need across the three follow-up waves.
54
42 43 4454
43 43 45
0102030405060708090
100
Wave 1 Wave 2 Wave 3 Wave 4
SVORI
Non-SVORI
Note: Differences between groups were not significant at the 0.05 level. Wave 1 = 30 days pre-release; Wave 2 = 3 months post-release; Wave 3 = 9 months post-release; Wave 4 = 15 months post-release.
SVORI and non-SVORI subjects were similar on the level of reported need.
Overall need dropped following release.
Average need was similar at 3, 9, and 15 months post-release.
Exhibit ES-4. Weighted average super bundle scores by group for Waves 1 through 4

Prisoner reentry experiences of adult males
ES-12
Service Receipt
The report provides evidence that SVORI program participation increased receipt of services and programming, including programs to prepare for release, meeting with a case manager, and receiving a needs assessment—although levels of provision for most services fell far short of 100%, were substantially below expressed needs for services, and declined substantially following release. Key findings are summarized below:
SVORI program participants reported receiving significantly more coordination, employment/education/skills, and transition services than comparison subjects at all interviews.
Overall levels of reported service receipt declined substantially between the pre-release and the first post-release interview and the differences between SVORI and non-SVORI groups diminished over time.
The percentages of SVORI participants who reported receiving any employment-related services was 37% pre-release—a small proportion that dropped to 34% at 3 months, 21% at 9 months, and 14% at 15 months post-release; although far less than 100%, these proportions were significantly higher at all waves than reported by the non-SVORI group—20% pre-release, declining to 10% at 15 months.
Aggregate levels of service receipt were substantially lower than comparable measures of service need (across all bundles and time periods and among both groups), indicating that most men had unmet needs.
The services that men were most likely to report receiving after release were similar across the post-release waves and included post-release supervision, case management, and needs assessments.
In addition to the domain areas identified for expressed needs, a coordination services bundle was identified for service receipt. Exhibit ES-5 summarizes information on average reported service receipt for each group across the four waves of interview data. For Wave 1, the results suggest that, on average, about 30 days before release the SVORI subjects reported receiving about a third (34%) of the various service items and the non-SVORI comparison subjects reported receiving about one quarter (24%) of the items. Exhibit ES-5 suggests four findings: (1) SVORI program participants
SVORI program participants received substantially more services pre-release.
Service receipt dropped following release.
Service receipt continued to decline as the time since release increased.
By 15 months following release, there was little difference in receipt, with both groups reporting receipt of less than 10% of service items.

Executive Summary
ES-13
34
1813 9
2212 10 8
0102030405060708090
100
Wave 1 Wave 2 Wave 3 Wave 4
SVORI
Non-SVORI
Note: Differences between groups at Waves 1, 2, and 3 were significant at the 0.0001 level. Wave 1 = 30 days pre-release; Wave 2 = 3 months post-release; Wave 3 = 9 months post-release; Wave 4 = 15 months post-release.
received substantially more services pre-release than non-SVORI subjects; (2) service receipt dropped substantially at release; (3) reported service receipt continued to drop as the time since release lengthened; and (4) there was little difference in average receipt at 15 months following release.
Post-Release Outcomes
The significant—albeit less-than-universal—increase in service receipt associated with participation in SVORI programs was associated with moderately better outcomes with respect to housing, employment, substance use, and self-reported criminal behavior—although these improvements were not associated with reductions in official measures of reincarceration. As many of the previous evaluations of reentry programs have focused primarily on recidivism and substance use, this evaluation provided an opportunity to examine the impacts of reentry programming on an array of other important indicators of successful reintegration, including housing and employment. Key findings are summarized below.
Housing
SVORI programming did not appear to affect core housing outcomes, including housing independence, stability, and the extent to which housing challenges were encountered. Although SVORI participants were significantly more likely to have achieved housing independence at 15 months, they were also less likely
Exhibit ES-5. Weighted average service receipt super bundle scores by group for Waves 1 through 4

Prisoner reentry experiences of adult males
ES-14
(albeit not significantly) to report that housing had been stable and that they had not encountered housing challenges during the 6 months prior to the 15-month interview.
For both the SVORI and non-SVORI groups, housing situations improved gradually over the 3-, 9-, and 15-month post-release time periods; for example, 72% of SVORI participants and 70% of the non-SVORI group were “housing independent” at the 3-month interview compared to 86% of SVORI and 80% of non-SVORI 15 months following release.
SVORI program participants were more likely to report living in their own house or apartment at each follow-up, although differences were not statistically significant at the 0.05 level.
Employment
SVORI programming appeared to positively affect many dimensions of employment, with effects being strongest for the time period prior to the 15-month post-release interview. Compared with the non-SVORI group, SVORI program participants were more likely to report
– supporting themselves with a job (at 15 months post-release),
– working at a job that provided health insurance and paid-leave benefits (at 3 and 15 months post-release),
– working at a job that provided formal pay (at 3 months)
Members of both groups reported working about the same number of months during the reference period—about two thirds of the 3 or 6 months prior to interview.
SVORI program participants were much more likely post-release to report having supported themselves with a job during the reference period in comparison to the period immediately preceding their incarceration—increasing from 59% prior to incarceration to 64% at 3 months post-release to 71% at 15 months; there was little difference over time for those in the comparison group.
Family, Peers, and Community Involvement
SVORI programming did not have an impact on familial or peer relationships.
For both groups, the levels of family emotional support, family instrumental support, and the quality of intimate-

Executive Summary
ES-15
partner relationships declined over the three post-release time periods.
The SVORI and non-SVORI groups reported similar levels of negative peer exposure.
Participation in civic activities, such as performing volunteer work or participating in local organization, was low for both groups; however, reports of civic action increased over the three follow-up periods such that by 15 months post-release SVORI program participants were significantly more likely to report civic activity.
Substance Use
SVORI appeared to have a positive impact on abstinence from drug use. Self-reported substance use was generally lower for the SVORI group than the non-SVORI group, in several cases significantly so.
Members of the SVORI group were also more likely to report not using drugs and to not test positive on oral swab drug tests that were conducted at 3 and 15 months post-release although these differences were not statistically significant at the 0.05 level.
Overall, substance use was quite high (primarily marijuana) and increased across the post-release follow-up periods.
Physical and Mental Health
SVORI did not appear to influence physical outcomes. No differences were observed, at any time period, between the SVORI and non-SVORI subsamples on the 12-Item Short Form Health Survey (SF-12; Ware et al., 2002) physical health scale or the number of physical conditions experienced.
SVORI group members appeared to have slightly better mental functioning as indicated by the SF-12 mental health scale (at 3 and 15 months post-release) and mental health status as measured by the Global Severity Index (GSI-45; at 15 months post-release).
Criminal Behavior and Recidivism
The men enrolled in SVORI were less likely to report having perpetrated violence and to have engaged in any criminal behavior during the 3 or 6 months prior to the follow-up interviews, although differences were statistically significant only for no criminal behavior at 3 months post-release.

Prisoner reentry experiences of adult males
ES-16
There was little difference between the two groups in a measure that combined reports of carrying a weapon and committing a violent crime.
SVORI program participants were more likely than non-SVORI respondents to report complying with conditions of supervision at 15 months post-release.
The proportion of members of both groups who either (1) reported having been booked into jail since the last interview or (2) were incarcerated at the time of the follow-up interview was high and similar. Only about 80% of both groups were either not incarcerated during the 3 month interview or reported having not been booked into jail. This proportion declined to about 50% at the 15 month interview.
Members of the SVORI group were less likely to have an officially recorded arrest during the 24 months following release, but the differences were not statistically significant.
Reincarceration rates for both groups were high with about 40% of both groups reincarcerated (official measure) within 24 months of release.
Conclusions
Although SVORI programs were successful in increasing the types and amounts of needs-related services provided prior to and after release from prison, the proportion of individuals who reported receiving services was less than reported need and, generally, less than the expectations of the SVORI program directors. This finding is consistent with SVORI programs that were developing and implementing their programs and provides a reminder that starting complex programs may require sustained effort over several years to reach full implementation.
Service delivery declined following release. Thus, overall, the programs were unable to sustain support to individuals during the critical, high-risk period immediately following release. This decline may be due to the programs’ difficulty identifying and coordinating services for individuals released across wide geographic areas and, again, suggests the need for sustained effort to reach full implementation.
SVORI program participation resulted in modest improvements in intermediate outcomes at levels consistent with findings from meta-analyses of single-program efforts (e.g., 10% to 20%). If
Executive Summary
ES-17
the underlying model that links services to improved intermediate outcomes that in turn improve recidivism is correct, the level of improvement in these intermediate outcomes may have been insufficient to result in observable reductions in recidivism.
Additional analyses are planned to determine whether there are specific programs or subgroups associated with positive outcomes and to examine the relationship between receipt of specific services and outcomes.


1
IInnttrroodduuccttiioonn
SVORI was a collaborative federal effort to improve outcomes for adults and juveniles returning to their communities after a period of incarceration. The initiative sought to help states better utilize their correctional resources to address outcomes along criminal justice, employment, education, health, and housing dimensions by providing grant funds in 2003 to state agencies to establish or enhance prisoner reentry programming.5 Funded by the U.S. Departments of Justice (DOJ), Labor (DOL), Education (DOEd), Housing and Urban Development (HUD), and Health and Human Services (HHS), SVORI was an unprecedented national response to the challenges of prisoner reentry. Sixty-nine state and local grantees (corrections and juvenile justice agencies) received SVORI funding, representing all 50 states, the District of Columbia, and the U.S. Virgin Islands. These grantees developed 89 programs that targeted adult and juvenile correctional populations.
The initiative responded to emerging research findings that suggested that providing individuals with comprehensive, coordinated services based on needs and risk assessments could result in improved post-release outcomes. Grantees were to use their SVORI funding to create a three-phase continuum of services for returning prisoners that began during the period of incarceration, intensified just before release and during the early months post-release, and continued for several years after release as former inmates took on more productive and
5 Although grant awards were announced by the federal partners in
2002, grantees were required to complete planning and other activities prior to having access to full funding. Program directors reported in a survey conducted in 2005 that access to full grant funds was provided to grantees over a substantial time frame—February 2003 to May 2004.

Prisoner reentry experiences of adult males
2
independent roles in the community. The SVORI programs attempted to address the initiative’s goals and provide a wide range of well-coordinated services to returning prisoners. Although SVORI programs shared the common goals of improving outcomes across various dimensions and improving service coordination and systems collaboration, programs differed substantially in their approaches and implementations (Lindquist, 2005; Winterfield & Brumbaugh, 2005; Winterfield et al., 2006; Winterfield & Lindquist, 2005).
In spring 2003 the National Institute of Justice awarded RTI International, a nonprofit research organization, a grant to evaluate programs funded by SVORI. The Urban Institute, a nonpartisan economic and social policy research organization, collaborated on this project, which was one of the largest evaluation studies ever funded by the National Institute of Justice. With data collected from grantee staff, partnering agencies, and returning prisoners, the 6-year evaluation involved an implementation evaluation of all 89 SVORI programs, an intensive impact evaluation of 16 selected programs, and an economic analysis on a subset of the impact sites (Lattimore et al., 2005). The goal of the SVORI evaluation was to document the implementation of SVORI programs and determine whether they accomplished SVORI’s overall goal of increasing public safety by reducing recidivism among the populations served.
The SVORI evaluation was designed to answer the following research questions:
To what extent did SVORI lead to more coordinated and integrated services among partner agencies?
To what extent did SVORI participants receive more individualized and comprehensive services than comparable, non-SVORI offenders?
To what extent did reentry participants demonstrate better recidivism, employment, health, and personal functioning outcomes than comparable, non-SVORI offenders?
To what extent did the benefits derived from SVORI programming exceed the costs?
This report presents findings for the adult male participants in the impact evaluation, which included 863 SVORI participants and 834 comparison subjects returning from prison in 12
The SVORI evaluation was designed to answer the following research questions: ● To what extent did
SVORI lead to more coordinated and integrated services among partner agencies?
● To what extent did SVORI participants receive more individualized and comprehensive services than comparable, non-SVORI offenders?
● To what extent did reentry participants demonstrate better recidivism, employment, health, and personal functioning outcomes than comparable, non-SVORI offenders?
● To what extent did the benefits derived from SVORI programming exceed the costs?

Introduction
3
states.6 Other results from the impact and economic evaluations are presented in the following reports:
Lattimore, P. K., & Visher, C. A. (2009). The Multi-site Evaluation of SVORI: Summary and synthesis. Research Triangle Park: RTI International.
Lattimore, P. K., & Steffey, D. M. (2009). The Multi-Site Evaluation of SVORI: Methodology and analytic approach. Research Triangle Park, NC: RTI International.
Lindquist, C. H., Barrick, K., Lattimore, P. K., & Visher, C. A. (2009). Prisoner reentry experiences of adult females: Characteristics, service receipt, and outcomes of participants in the SVORI Multi-site Evaluation. Research Triangle Park, NC: RTI International.
Hawkins, S., Dawes, D., Lattimore, P. K., & Visher, C. A. (2009). Reentry experiences of confined juvenile offenders: Characteristics, service receipt, and outcomes of juvenile male participants in the SVORI Multi-site Evaluation. Research Triangle Park, NC: RTI International.
Cowell, A., Roman, J., & Lattimore, P. K. (2009). An economic evaluation of the Serious and Violent Offender Reentry Initiative. Research Triangle Park, NC: RTI International.
In the remainder of this chapter, previous research on prisoner reentry is summarized, the SVORI and the evaluation design are described, and the SVORI programs provided in the 12 impact evaluation sites are characterized. Subsequent sections provide detailed information on characteristics of the evaluation participants, self-reported service needs and receipt at each of the four interviews, post-release outcomes, and conclusions and policy recommendations.
6 Findings from the analysis of the pre-release interview data collected,
on average, 30 days prior to release from prison were published in Pre-release Characteristics and Service Receipt among Adult Male Participants in the SVORI Multi-site Evaluation (Lattimore et al., 2008). These findings were primarily descriptive and conveyed characteristics of the respondents, as well as their pre-prison and incarceration experiences. Differences between the SVORI and non-SVORI groups were also identified and discussed with respect to assessing the comparability of the groups and implications for outcome analyses.
Prisoner reentry experiences of adult males
4
RESEARCH ON PRISONER REENTRY In 2008, more than 735,000 prisoners were released from state and federal prisons across the country (West, Sabol, & Cooper, 2009). This number represents a greater than four-fold increase over the nearly 170,000 released in 1980 (Harrison, 2000). With the exception of those who die while in prison, all prisoners will eventually “re-enter” the community. Prisoner reentry has sweeping consequences for the individual prisoners themselves, their families, and the communities to which they return (Petersilia, 2003; Travis, 2005). Nationwide, over half of individuals who are released from prison are reincarcerated within three years. Programs and services for men and women leaving prison are designed to stop this revolving door and encourage individuals to desist from offending. Imprisonment without such preparation for community reintegration may reduce human capital and impede the acquisition of pro-social skills and behaviors, thus lessening the probability of a successful transition from prison to the community (Visher & Travis, 2003; Western, 2007). However, in comparison to twenty years ago, men and women leaving prison are less prepared for reintegration, less connected to community-based social structures, and more likely to have health or substance abuse problems than prior cohorts (Lynch & Sabol, 2001; Petersilia, 2005).
In recent years, significant attention has been focused on the impact of these increases in rates of incarceration and rates of return from jail or prison (Bonczar & Beck, 1997; Clear, Rose, & Ryder, 2001; Hagan & Coleman, 2001; Mauer, 2000; Travis, 2005). The geographic clustering of former prisoners by socio-economic characteristics has led to disproportionate rates of removal from, and return to, already distressed communities (Clear et al., 2001; Lynch & Sabol, 2001). As a result, current research on the social and economic impacts of incarceration is increasingly focused on local effects of incarceration and prisoner reintegration, and the concurrent effects on family structure, intergenerational offending, and general community well-being (Clear et al., 2001; Hagan & Dinovitzer, 1999). Prisoner reentry programs that have emerged since the late 1990s seek to address the effects of incarceration by more successfully reintegrating former prisoners, thereby reducing subsequent offending.

Introduction
5
Reentry programming is designed to break the cycle between offending and incarceration. Incarcerating offenders generally has two purposes: incapacitation and deterrence. Incapacitation leads to temporary instrumental desistance, and specific deterrence may lead to future deterrence. However, desistance is mainly achieved through rehabilitative programming. Predictors of desistance generally do not vary by the pattern of past criminal behavior or by the antecedent characteristics of the offender (Laub & Sampson, 2001). Processes that consistently are identified as leading to desistance include marriage and stable families (Laub & Sampson, 1993; Sampson & Laub, 1993), aging (Glueck & Glueck, 1974; Gottfredson & Hirschi, 1990; Laub & Sampson, 2003), stable employment (Laub & Sampson, 1993; Sampson & Laub, 1993) and reduced exposure to antisocial peers (Laub & Sampson, 2003; Warr, 1998). In addition, all of these outcomes may be dependent upon cognitive changes in identity which are the precursor to changes in behavior (Maruna, 2001).
Until recently, the majority of rehabilitation and reentry strategies have been dominated by service providers who represent a single domain from among the possible correlates of desistance. For instance, many reentry programs are centered on one-stop workforce centers whose main function is to prepare and place individuals in jobs. Reentry services may include interventions directly related to skill acquisition to improve labor market prospects such as job readiness, training, and placement programs. Other reentry programs may focus on reducing specific deficits by reducing substance abuse, addressing physical and mental health disorders, improving educational attainment through GED or high school programming, or offering other assistance from the small (access to official identification and transfer of prescriptions) to the large (securing transitional and long-term housing). Reentry initiatives also may assist in the cognitive development of participants to promote behavioral change through faith-based or classroom-based programming (e.g., anger management, parenting skills, and life skills).

Prisoner reentry experiences of adult males
6
However, the needs of individuals returning to the community usually span these domains of problems, and typical service providers are unlikely to be as effective at providing or facilitating other services as they are in their primary area of expertise. For example, it is not unusual for individuals struggling with mental health and substance abuse disorders to be denied entry into programs designed to respond to either but not both of these disorders. The complexity of the disadvantages confronting prisoners after release means that individual offenders often require more than a single program or intervention. To address this dilemma, many reentry specialists are encouraging a broader focus on comprehensive reentry strategies, not specific programs (Lattimore, 2007; National Research Council, 2007; Re-entry Policy Council, 2005; Visher, 2007). Such strategies would involve multiple levels of government, coordination of efforts across agencies, and involvement of organizations that are traditionally not part of the reentry discussion (e.g., public health, local businesses; community colleges). Moreover, these coordinated efforts may improve reintegration across a broader range of outcomes (e.g., employment, substance use, health) than simply reductions in recidivism.
This emerging focus on the need for comprehensive programming provided the context within which the federal government developed the Serious and Violent Offender Reentry Initiative, resulting in the award of SVORI grants in 2002 and SVORI program start-ups in 2003 and 2004. The brief review of literature discussed in the remainder of this section provides a context in which the findings of the Multi-Site Evaluation of the Serious and Violent Offender Reentry Initiative can be assessed.
Characteristics and Needs of Former Prisoners
Individuals in the prison population face disadvantages associated with poor educational and employment histories, alcohol and other drug misuse, and poor physical and mental health (e.g., Petersilia, 2005). These disadvantages can result in serious challenges at the time of release as the individual attempts to reenter and integrate with the community. Among the most serious challenges facing former prisoners are finding employment and addressing health needs, including risk of renewed substance abuse after release. Most prisoners have
The complexity of the disadvantages confronting prisoners after release means that individual offenders often require more than a single program or intervention.
…many reentry specialists are encouraging a broader focus on comprehensive reentry strategies, not specific programs…

Introduction
7
extensive substance use histories and need substance abuse treatment. About half of individuals incarcerated in state prisons report that they used illegal drugs in the month before the arrest that led to the current prison term (Karberg & James, 2005), and many used drugs on a daily or weekly basis (Petersilia, 2005; Visher & Mallik-Kane, 2007). Despite high levels of drug use, half or fewer receive drug treatment while incarcerated (Petersilia, 2005; Visher & Mallik-Kane, 2007; Winterfield & Castro, 2005). Prisoners are also more likely to suffer from physical and mental health problems than the general population (see Greifinger, Bick, & Goldenson, 2007; Petersilia, 2005). The Bureau of Justice Statistics reported that as many as 16 percent of those in state prisons, local jails, or on probation are mentally ill (James & Glaze, 2006). Finally, finding employment is the single largest concern reported by men and women before they are released from prison (Visher, 2007). Although, about two thirds of prisoners nationwide had worked before incarceration (Petersilia, 2005) , former prisoners often have difficulty finding and maintaining employment. Results of a study of men and women leaving prison in three states revealed that less than one in five had a job lined up in the month before release (Visher, 2007). Not surprisingly, nine in ten prisoners also reported that they needed job training and more education.
Former prisoners are also not a homogeneous group. The need for services immediately before and soon after release is likely to vary from individual to individual. For example, although one in five have served sentences of five years or more, the average prisoner in the U.S. serves about 28 months, and about 17 percent are released within one year (Lynch & Sabol, 2001). The average age of men leaving state prison is older than many realize—33 years—and those in their thirties will likely have different needs than those in their twenties (Petersilia, 2005). Some have serious mental or physical health needs; others are fathers with minor children.
Thus, men and women face formidable challenges in their personal lives as they leave prison and return to the community. Many individuals require intensive services and support to meet post-release needs ranging from transportation to employment services to health care. Further, these individuals are often faced with additional obstacles to a successful transition from prison in the form of collateral effects

Prisoner reentry experiences of adult males
8
(sometimes called “invisible punishments”) that may include exclusions from certain professions (e.g., realtor or health care) and access to public benefits (e.g., student loans, public housing, or food stamps), as well as the loss of parental rights (Hagan & Dinovitzer, 1999; Petersilia, 2003; Travis, 2002). These realities, in conjunction with conditions imposed upon their release (e.g., employment, in-person reporting, and payment of restitution, fees, and fines), make the first few weeks and months after release especially difficult.
Risk and Needs Assessment
Research over the past 25 years has led to the development of a new generation of risk assessment tools that are reasonably able to predict the probability that an individual will commit additional crimes (Holsinger, Lurigio, & Latessa, 2001). Moreover, there is considerable evidence that concentrating both services and supervision on the higher-risk individuals will result in greater reductions in crime than a more generalized approach to service delivery and supervision (Byrnes, Macallair, & Shorter, 2008; MacKenzie, 2006).
An important first step in linking newly incarcerated men and women to rehabilitative programming is a thorough assessment of needs. Intake screening is widely utilized in correctional institutions for security classification, and prisoners are also typically screened for literacy and physical and mental health conditions. However, problems exist with screening instruments and procedures including choice of instrument, lack of staff training, and lack of follow-through regarding subsequent assessment and treatment while in prison (Moore & Mears, 2003). Moreover, if programs are limited (which is a typical situation in many prisons), staff can feel that screening and assessment serves no worthwhile purpose. Programs that adhere more strictly to assessment results to generate appropriate treatment matching may ultimately achieve better outcomes, although this hypothesis remains generally untested. There is also general agreement that promising correctional programs should be timed so that they are provided close to a prisoner’s release date, focus on skills applicable to the local job market, reflect current market demands, and are provided for an extended period of time, generally three to six months (Cullen & Gendreau, 2000). However, the duration of in-prison programming is somewhat arbitrary—one research area that
Programs that adhere more strictly to assessment results to generate appropriate treatment matching may ultimately achieve better outcomes, although this hypothesis remains generally untested
Introduction
9
remains unexplored is whether reentry programs would be more effective if the length of reentry programs varied according to the magnitude of the individual prisoner’s deficits.
Employment, Education, and Skills Building
Research indicates that ‘work’ is a primary feature of successful reintegration (Laub, Nagin, & Sampson, 1998; Sampson & Laub, 1990, 1993) as connections made at work may serve as informal social controls that help prevent criminal behavior. For former prisoners, employment is correlated with lower recidivism (Rossman & Roman, 2003; Visher, Debus, & Yahner, 2008) and rates of return to prison are significantly reduced by participation in work readiness programs (Buck, 2000; Finn, 1998; Sung, 2001). Although recent studies have indicated that work programs can have a significant impact on the employment and recidivism rates of men (see Bushway & Reuter, 2002), vocational and educational programs often are unavailable in prisons, and their availability has declined (Lynch & Sabol, 2001).
Stable employment is one of the key predictors of desistance that can be directly addressed through policy or programming. As a result, many reentry initiatives have typically focused on preparing returning prisoners to re-enter the job market. Reentry services often include interventions directly related to skill acquisition to improve labor market prospects such as job readiness, training and placement programs. Although about two thirds of prisoners worked prior to incarceration (Beck et al., 1993), their educational level, work experience, and skills are well below national averages for the general population (Andrews & Bonta, 2006), and the stigma associated with incarceration often makes it difficult for them to secure jobs following release (Bushway & Reuter, 2002; Holzer, Raphael, & Stoll, 2006). When former prisoners do find jobs, they tend to earn less than individuals with similar background characteristics who have not been incarcerated (Bushway & Reuter, 2002). Thus, research supports a strong programmatic emphasis on increasing individual employability through skills training, job readiness, and work release programs, both during incarceration and after release.
Few such programs have been studied using a random assignment research design. One exception is the evaluation of the Opportunity to Succeed (OPTS) program, which delivered

Prisoner reentry experiences of adult males
10
employment services within a set of comprehensive services for drug-using former prisoners, and found that participants were more likely to be employed full-time in the year after release. However, self-reported arrests and official record measures of recidivism showed no differences between participants and controls (Rossman & Roman, 2003). Employed participants, however, reported fewer arrests and less drug use. Another study of prisoners in Tennessee, who were required to secure either employment or enroll in a training program as a condition of release, found that those who graduated had marginally better outcomes than a matched comparison, while those who failed had significantly worse outcomes (Chalfin, Tereshchenko, Roman, Roman, & Arriola, 2007).
In a meta-analysis examining the impact of employment training and job assistance in the community for persons with a criminal record, Aos, Miller, and Drake (Aos, Miller, & Drake, 2006) concluded that these programs have a modest, but significant, 5 percent impact on recidivism. However, in another meta-analysis, using a very similar set of studies and methods, Visher, Winterfield, and Coggeshall (Visher, Winterfield, & Coggeshall, 2005) concluded that community-based employment programs do not significantly reduce recidivism for persons with previous involvement with the criminal justice system.
Contemporary job assistance and training programs for former prisoners such as the Center for Employment Opportunities (New York), Safer Foundation (Chicago), and Project Rio (Texas) are more holistic in their approach and incorporate other transition services and reentry support into their programs (Buck, 2000) while maintaining a primary focus on job placement. Although several rigorous evaluations are underway, the impact of these newer types of comprehensive, employment-focused programs on former prisoners’ employment and recidivism rates is not yet known.
In the U.S., adult corrections has a long history of providing education and employment training (Gaes, Flanagan, Motiuk, & Stewart, 1999; Piehl, 1998). Comprehensive reviews of dozens of individual program evaluations generally conclude that adult academic and vocational programs lead to modest reductions in recidivism and increases in employment (Aos, 2006; Cullen & Gendreau, 2000; Gaes et al., 1999; Gerber & Fritsch, 1994;

Introduction
11
Wilson, Gallagher, & MacKenzie, 2000). However, the majority of the evaluations have one or more methodological problems (Wilson et al., 2000).
Numerous studies show that recidivism rates are significantly reduced for those with more education; however, just getting a GED—the most prevalent in-prison educational programming—generally does not show impacts on reentry outcomes (Adams et al., 1994; Boudin, 1993; Harer, 1995; Stillman, 1999). Despite the high demand for these programs by inmates, participation in these programs declined from 42 percent in 1991 to 35 percent in 1997 (Lynch & Sabol, 2001). Reasons for these declines include the rapid growth in prison populations in combination with decreased funding for correctional programming, the frequent transfer of prisoners from one facility to another, and greater interest in short-term programs such as substance abuse and cognitive-behavioral programs (Lawrence, Mears, Dubin, & Travis, 2002).
Research suggests that correctional education programming is most successful as part of a systematic approach, integrating employability, social skills training, and other specialized programming (Holzer & Martinson, 2005). Best-practice correctional education programs carefully tailor programming to the needs of individuals and to related vocational and job skills training. Education and job training for low earners are most successful when they provide workers with credentials that meet private sector demands. Thus, comprehensive programs that provide training, a range of services and supports, job retention incentives, and access to employers are promising, but rigorous evaluations are lacking.
Integrated Post-release Service Delivery
Individuals exiting prison are at the highest risk of rearrest during the first few months after release. The overall probability of arrest is roughly twice as high in the first month of supervision as it is in the fifteenth month (National Research Council, 2007). Just as important, the arrest rate between months 15 and 36 is uniformly lower than in the earlier period. Between months 1 and 15, the chance of arrest for property and drug offenses drops by 40 percent. Thus, the challenge for policy makers and corrections professions is to respond to this ‘high-risk’ period by frontloading services and supervision during these early months (Pew Center on the States, 2009).
Individuals exiting prison are at the highest risk of rearrest during the first few months after release.

Prisoner reentry experiences of adult males
12
Developing tailored reentry plans to guide post-release services begins with an assessment and classification of re-offending risk, needs, and strengths leading to individualized and unified case planning and management that addresses individual variation in likelihood to re-offend (Andrews & Bonta, 2006; Wiebush, McNulty, & Le, 2000). These assessments differ from the initial screens conducted at prison entry and are the foundation for an individualized reentry plan. Such targeted assessments not only determine the specific kinds of services and supervision level that individuals need to succeed, but also determine who requires documents, medications, or other immediate transition preparation. The ideal case management approach incorporates a family and social network perspective, a mix of surveillance and services focused on risk and protective factors, the imposition of realistic and enforceable release conditions coupled with graduated incentives and sanctions. In addition, this approach uses service brokering to community service providers and resources and other supportive community organizations (Healy, Foley, & Walsh, 1999; Petersilia, 2003).
In the immediate period after release from prison, access to supportive reentry (or transitional) services are critical in those first few days, weeks, and months for men and women as they readjust to life in the community. Among the most important are obtaining photo identification, getting appropriate clothes, securing stable housing, having reliable transportation, and signing up for public assistance, if eligible. Unfortunately, often these types of needs are not addressed before release and it falls to family and friends to help arrange these for the former prisoner. There are no evaluations of programs that focus exclusively on the immediate post-release period, but one program in Maryland that generally focused on this period was found to reduce recidivism—particularly the most serious and violent offenses—and to be cost-effective (Roman, Brooks, Lagerson, Chalfin, & Tereshchenko, 2007).
Research suggests that an integrated, multi-modal intervention strategy—often referred to as ‘wraparound’ service delivery—can be effective in meeting the multiple needs of this population. This strategy involves “wrapping” a comprehensive array of individualized services and support networks “around” clients, rather than forcing them to enroll in pre-determined, inflexible treatment programs (Franz, 2003). Treatment

Introduction
13
services are usually provided by multiple agencies working together as part of a collaborative interagency agreement, and each individual’s treatment plan is determined and managed by an interdisciplinary team consisting of a caseworker, family and community members, and several social services and mental health professionals.
General Evaluations of Reentry Programs
Over many decades of attention, the overwhelming majority of evaluations of rehabilitative programs for offenders have focused on programs designed to address specific individual needs, such as reducing drug and alcohol use, addressing mental health issues, or finding a job. But as discussed earlier, the focus of recent reentry services and programs has been to ease the transition of individuals exiting prison, addressing needs with individualized approaches. Many, if not most reentry programs for individuals exiting prison are relatively new, having begun as a result of federal funding in the early years of this decade. As a result, there are few impact evaluations of programs focused specifically on reentry (Petersilia, 2004).
Numerous challenges characterize the extant research assessing the effectiveness of programs for formerly incarcerated individuals, whether focused on reentry or general rehabilitation. Foremost among the challenges is the lack of theoretical models that articulate behavior change among former prisoners. Within any particular substantive area, there are also problems of fidelity in that a particular service approach may manifest itself in different ways under different programs and circumstances. As a result, it is often difficult to generalize research findings from one program to others, and substantial variability exists among the outcome variables examined (e.g., employment, homelessness, substance use, recidivism). The numerous combinations of program types unique to each study also render comparisons difficult. Finally, there are problems related to the research itself, as rigorous experimental designs—including the use of comparison groups (randomly assigned or otherwise)—are rare in this research literature (National Research Council, 2007).
Several reviews of reentry program evaluations recently have examined the available research on what works with regard to reentry and/or rehabilitative programming (Aos et al., 2006; Gaes et al., 1999; Lipsey & Cullen, 2007; MacKenzie, 2006;

Prisoner reentry experiences of adult males
14
Petersilia, 2004; Seiter & Kadela, 2003). The evidence has been very consistent in establishing that contact-driven supervision, surveillance, and enforcement of supervision conditions have a limited ability to change offender behavior or to reduce the likelihood of recidivism (MacKenzie, 2006). However, intensive supervision programs with a clear treatment component do show a sizeable impact on recidivism (Aos et al., 2006; Gaes et al., 1999; Petersilia, 2004).
MacKenzie (MacKenzie, 2006) recently summarized the “what works” literature in corrections, with specific chapters on various community corrections programs (e.g., life skills, cognitive behavioral therapy, education, drug treatment, and intensive supervision). She concluded that human service-oriented programs were much more effective than those based on a control or deterrent philosophy. In particular, there is growing consensus that practices focusing on individual-level change, including cognitive change, education, and drug treatment, are likely to be more effective than other strategies, such as programs that increase opportunities for work, reunite families, and provide housing (see also Andrews & Bonta, 2006). All of the strategies MacKenzie identified as effective focus on dynamic criminogenic factors, are skill-oriented, are based on cognitive/behavioral models, and treat multiple offender deficits simultaneously. These conclusions are consistent with several large meta-analyses of the evaluation literature (Andrews et al., 1990; Aos et al., 2006; Lipsey & Cullen, 2007).
Selection of program type may be less important than proper implementation of the program. Delivering a program in the wrong context (i.e., intensive substance abuse treatment to casual drug users) or poor implementation are common and may explain most of the weak or null findings in the research studies. Despite advances in knowledge and best practices, studies of programs for offenders have documented persistent problems in implementation and adherence to the fidelity of evidence-based practice models (Lowenkamp, Latessa, & Smith, 2006; Petersilia, 2004; Young, 2004). Additionally, improperly implemented programs may be harmful. One recent reentry program, Project Greenlight, was developed from research and best practice models to create an evidence-based reentry initiative which was evaluated with a random assignment research design (Wilson & Davis, 2006). However,
All of the strategies MacKenzie identified as effective focus on dynamic criminogenic factors, are skill-oriented, are based on cognitive/behavioral models, and treat multiple offender deficits simultaneously.

Introduction
15
the program participants performed significantly worse than a comparison group on multiple measures of recidivism after one year. The evaluators concluded that the New York program did not replicate past best practice. Instead, Project Greenlight modified past practice to fit institutional requirements, was delivered ineffectively, did not match individual needs to services, and failed to implement any post-release continuation of services and support (Wilson & Davis, 2006; see also Rhine, Mawhorr, & Parks, 2006; Visher, 2006; Marlowe, 2006). The evaluators attributed the findings to a combination of implementation difficulties, program design, and a mismatch between participant needs and program content. A key difficulty for Project Greenlight, as with many other community-based reentry programs, was its lack of integration into an overall “continuum of care” strategy that linked prison and community-based treatment.
Another line of research has focused on identifying the principles of effective treatment (as opposed to the substantive content of the program) in assessing evidence-based practices (e.g., Andrews & Bonta, 2006; Cullen & Gendreau, 2000). MacKenzie (2006) summarizes this work, identifying five principles of effective rehabilitation strategies. Specifically, she notes that effective rehabilitation strategies have strong program integrity, identify criminogenic factors, employ a multimodal treatment approach, use an actuarial risk classification, and ensure responsivity between an offender’s learning style and mode of program delivery. One of the failings of Project Greenlight was poor management of the program according to these principles that help guide or maximize program effectiveness (Andrews, 2006).
In her review of what works in reentry programming, Petersilia (2004) discusses the striking disconnect between the published ‘what works’ literature and the efforts of governmental reentry task forces to develop programs that are thought to improve offender transitions from prison to the community. The goal of most reentry programs is to develop a seamless transition from prison to the community. However, the challenges in this regard are enormous. Corrections departments and community supervision agencies often have conflicting incentives, and community-justice partnerships linking these organizations with community groups face even larger hurdles. An important barrier to effective reentry strategies in many communities is
… effective rehabilitation strategies have strong program integrity, identify criminogenic factors, employ a multi-modal treatment approach, use an actuarial risk classification, and ensure responsivity between an offender’s learning style and mode of program delivery.

Prisoner reentry experiences of adult males
16
the lack of information sharing between the criminal justice system and the community because of institutional barriers and privacy rules. Effective service delivery after release requires coordinated actions by government agencies, non-government service providers, and the community to ensure that returning prisoners do not fall through service gaps between agencies. Yet, knowledge about how to develop and manage these partnerships is lacking (Rossman & Roman, 2003).
SVORI programs were developed and implemented by the grantee agencies as these strands of research findings were emerging. The programs were to provide a range of coordinated services (based on needs and risk assessments) that spanned incarceration and return to the community, including services that focused on cognitive development. Although the programs differed from site to site, as discussed below, the overall focus of the SVORI initiative was consistent with emerging recommendations at the time the programs were developed and implemented. Thus, the SVORI Multi-site Evaluation provided an opportunity to test whether coordinated services provided in response to assessment to meet individual needs could be implemented and whether these services would have positive impacts on criminal justice, employment, health, housing, and substance abuse outcomes.
SVORI Exhibit 1 shows the SVORI program logic model and the SVORI Multi-site Evaluation design, including the evaluation components. The SVORI program model identifies SVORI funding, technical assistance (TA) and requirements as INPUTS that, in combination with local resources in the sites (THROUGHPUTS), yield a set of services and programming (OUTPUTS) that are expected to improve the OUTCOMES for SVORI participants, as well as to improve the state and local systems that provide these services and programs. Community and individual participant characteristics influence these throughputs, outputs, and outcomes.
The criteria for programs funded by SVORI grants were as follows:
Programs were to improve criminal justice, employment, education, health (including substance abuse and mental health), and housing outcomes.
… the SVORI Multi-site Evaluation provided an opportunity to test whether coordinated services provided in response to assessment to meet individual needs could be implemented and whether these services would have positive impacts on criminal justice, employment, health, housing, and substance abuse outcomes.

Introduction
17
Exhibit 1. SVORI program logic model and evaluation framework
Programs were to include collaborative partnerships between correctional agencies, supervision agencies, other state and local agencies, and community and faith-based organizations.
Program participants were to be serious and/or violent offenders.
Program participants were to be 35 years of age or younger.
Programs were to encompass three stages of reentry—in prison, post-release on supervision, and post-supervision.
Needs and risk assessments were to be used to guide the provision of services and programs to participants.
In some cases, grantees asked for and received permission for exceptions to these criteria. For example, some programs were
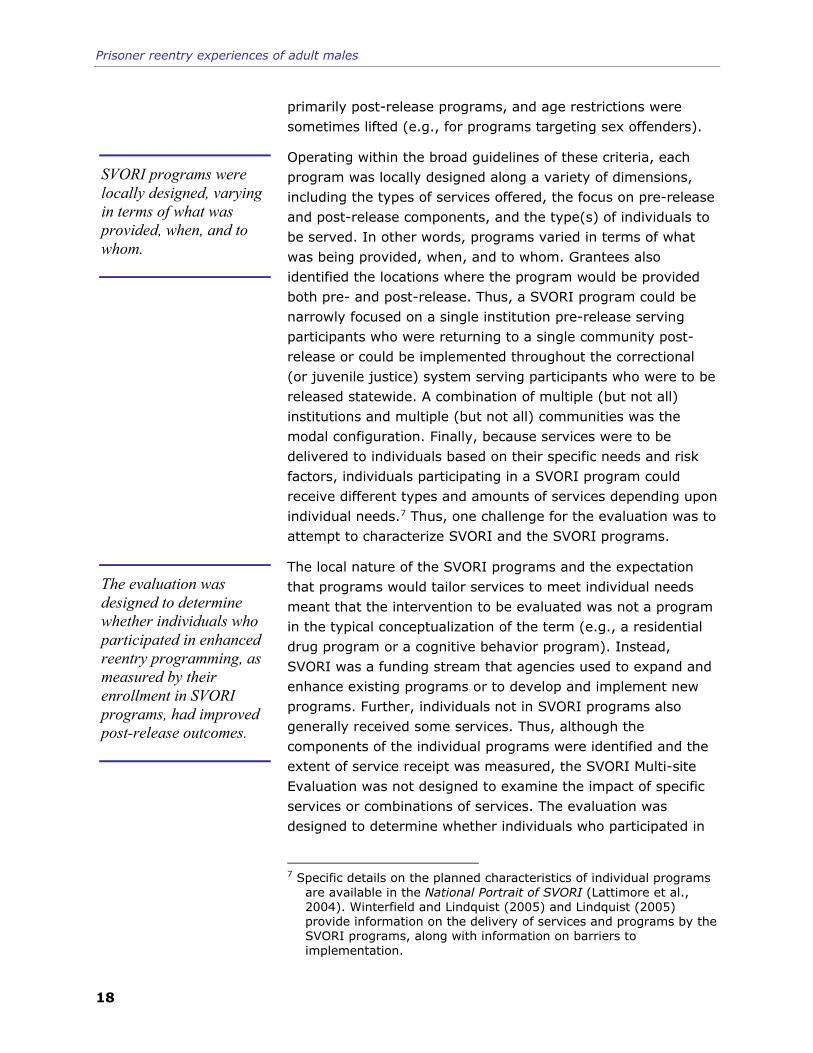
Prisoner reentry experiences of adult males
18
primarily post-release programs, and age restrictions were sometimes lifted (e.g., for programs targeting sex offenders).
Operating within the broad guidelines of these criteria, each program was locally designed along a variety of dimensions, including the types of services offered, the focus on pre-release and post-release components, and the type(s) of individuals to be served. In other words, programs varied in terms of what was being provided, when, and to whom. Grantees also identified the locations where the program would be provided both pre- and post-release. Thus, a SVORI program could be narrowly focused on a single institution pre-release serving participants who were returning to a single community post-release or could be implemented throughout the correctional (or juvenile justice) system serving participants who were to be released statewide. A combination of multiple (but not all) institutions and multiple (but not all) communities was the modal configuration. Finally, because services were to be delivered to individuals based on their specific needs and risk factors, individuals participating in a SVORI program could receive different types and amounts of services depending upon individual needs.7 Thus, one challenge for the evaluation was to attempt to characterize SVORI and the SVORI programs.
The local nature of the SVORI programs and the expectation that programs would tailor services to meet individual needs meant that the intervention to be evaluated was not a program in the typical conceptualization of the term (e.g., a residential drug program or a cognitive behavior program). Instead, SVORI was a funding stream that agencies used to expand and enhance existing programs or to develop and implement new programs. Further, individuals not in SVORI programs also generally received some services. Thus, although the components of the individual programs were identified and the extent of service receipt was measured, the SVORI Multi-site Evaluation was not designed to examine the impact of specific services or combinations of services. The evaluation was designed to determine whether individuals who participated in
7 Specific details on the planned characteristics of individual programs
are available in the National Portrait of SVORI (Lattimore et al., 2004). Winterfield and Lindquist (2005) and Lindquist (2005) provide information on the delivery of services and programs by the SVORI programs, along with information on barriers to implementation.
SVORI programs were locally designed, varying in terms of what was provided, when, and to whom.
The evaluation was designed to determine whether individuals who participated in enhanced reentry programming, as measured by their enrollment in SVORI programs, had improved post-release outcomes.

Introduction
19
enhanced reentry programming, as measured by their enrollment in SVORI programs, had improved post-release outcomes.
Exhibit 1 shows the evaluation components. The implementation assessment addressed the extent to which the 89 SVORI programs (69 grantees) increased access to services and promoted systems change. The impact evaluation assessed the effectiveness of SVORI by comparing key outcomes among those who received services as part of SVORI programs with those of a comparable group of individuals who received “treatment as usual” in 16 sites. The third component of the evaluation, an economic analysis, determined the return on SVORI investment and included both a cost-benefit and a cost-effectiveness analysis.
The remainder of this chapter briefly describes the SVORI programs provided in the 12 adult impact sites, and the evaluation design. Subsequent chapters provide detailed information on the characteristics of study participants, self-reported service needs and receipt, post-release outcomes, and conclusions and policy recommendations.
ADULT IMPACT SITE SVORI PROGRAMS Information on the SVORI programs was obtained by reviewing program proposals and implementation plans and through annual surveys of the local SVORI programs. This section provides information on the characteristics of the adult programs in the sites selected for the impact evaluation.
Two thirds of the SVORI program directors (PDs) for the 12 adult impact programs reported that their programs focused equally on the pre- and post-release phases, while one PD reported that the pre-release phase and three PDs reported that the post-release phase was the primary focus.8 Six of the 12 PDs indicated that the SVORI grant funds were used to start new programs; three indicated the funds were used to fill
8 Source: 2005 SVORI program director survey; see Lattimore and
Steffey (2009) for comparisons between impact and non–impact sites and for additional information on program characteristics. With the exception of specific impact site selection criteria including expected enrollment and likelihood of implementation, the impact and non–impact sites were similar along most measured dimensions.

Prisoner reentry experiences of adult males
20
service gaps, and two said they were used to expand existing services.
Exhibit 2 shows the primary outcome foci for the 12 adult impact sites, as reported by the PDs. When asked to identify the top 3 (of 8) outcomes for their program, six or more of the PDs indicated community integration, employment, improved decision-making or self-sufficiency, and substance use. Further, 6 or more of the 12 PDs thought that it would be fair to use all of the eight outcomes as measures of the effectiveness of their programs. Indeed, all 12 PDs thought that it would be fair to rate the effectiveness of their programs with respect to community integration and employment outcomes; and 11 reported that it would be fair to rate effectiveness based on the programs’ ability to reduce recidivism.
Outcomes % N Outcomes targeted (program director ranked in top 3)
Community integration 66.70% 8 Employment 58.30% 7 Improved decision-making or self-sufficiency 58.30% 7 Reduced substance use 50.00% 6 Housing 33.30% 4 Educational attainment 16.70% 2 Improved physical and/or mental health 8.30% 1 Family reunification/functioning 8.30% 1
Outcomes fair to determine program effectiveness Community integration/connectedness 100.00% 12 Employment 100.00% 12 Reduced recidivism 91.70% 11 Reduced substance use 75.00% 9 Family reunification/functioning 75.00% 9 Educational attainment 66.70% 8 Housing 66.70% 8 Improved physical and/or mental health 50.00% 6
Source: 2006 program director survey of 12 impact site PDs.
Exhibit 3 provides information on the types of services that the SVORI PDs reported were being provided to SVORI program participants in 2005. The services are organized into “service bundles,” which are described in more detail in subsequent chapters. Of coordination services, the 12 PDs suggested that, on average, most participants were receiving risk and needs assessments, as well as treatment/release plan development, both pre- and post-release. Further, most of the PDs reported
Exhibit 2. Outcome foci among adult impact and non–impact sites

Introduction
21
Exhibit 3. Mean proportion of SVORI program participants receiving pre-release and post-release services in adult program impact sites (as reported by program directors)
Services Pre-release Post-release Mean (SD) Mean (SD)
Bundle 1: Coordination Services Risk assessment 0.88 (0.30) 0.86 (0.29) Needs assessment 0.88 (0.30) 0.81 (0.35) Treatment/release plan development 0.91 (0.29) 0.91 (0.29) Formal post-release supervision NA 0.82 (0.27)
Bundle 2: Transition Services Legal assistance 0.24 (0.25) 0.21 (0.24) Assistance obtaining identification (e.g., driver’s license, Social
Security card) 0.60 (0.42) 0.46 (0.35)
Assistance obtaining benefits and completing applications (e.g., Medicaid, disability)
0.44 (0.35) 0.47 (0.35)
Financial support/emergency assistance 0.45 (0.43) 0.63 (0.29) Peer support groups 0.42 (0.38) 0.37 (0.34) One-on-one mentoring 0.50 (0.42) 0.45 (0.38) Housing placements or referrals 0.54 (0.39) 0.66 (0.29) Transportation NA 0.60 (0.34)
Bundle 3: Health Services Comprehensive drug treatment programs 0.31 (0.20) 0.32 (0.28) Alcoholics Anonymous/Narcotics Anonymous 0.39 (0.33) 0.44 (0.30) Counseling sessions 0.60 (0.37) 0.48 (0.31) Mental health services 0.35 (0.31) 0.35 (0.30) Anger management/violence counseling 0.52 (0.34) 0.35 (0.25) Medical services 0.70 (0.41) 0.30 (0.32) Dental services 0.70 (0.41) 0.24 (0.23)
Bundle 4: Employment, Education, and Skills Development Services Education/GED/tutoring/literacy 0.67 (0.29) 0.37 (0.29) Vocational training 0.33 (0.29) 0.34 (0.30) Employment referrals/job placement 0.51 (0.35) 0.65 (0.33) Resume and interviewing skills development 0.68 (0.33) 0.56 (0.37) Work-release program 0.17 (0.30) 0.24 (0.39) Cognitive skills development/behavioral programming 0.49 (0.35) 0.46 (0.35) Life skills training 0.71 (0.39) 0.62 (0.37)
Bundle 5: Family Services Domestic violence services 0.38 (0.35) 0.32 (0.32) Parenting skills development 0.40 (0.37) 0.48 (0.34) Family reunification 0.39 (0.34) 0.50 (0.34) Family counseling 0.18 (0.26) 0.24 (0.25)
Note: NA = Not applicable, GED = general educational development, SD = standard deviation. Values were calculated by taking the midpoint of the response categories (0%, 1–25%, 26–50%, 51–75%, 76–99%, and 100%) reported by the SVORI adult program directors for each of the services.
Source: 2005 program director survey.

Prisoner reentry experiences of adult males
22
that most SVORI program participants were expected to be on post-release supervision.
Other services were reported to be less universally provided. Housing placements/referrals was the only one of seven transition services that the PDs reported was being provided to more than half of SVORI program participants both pre- and post-release. The PDs were also asked about the provision of post-release transportation assistance and indicated, on average, that 60% of SVORI participants were receiving help with transportation post-release.
Although the PDs reported that more than half of program participants were receiving counseling, anger management/violence counseling, or medical and dental services pre-release, this finding did not apply to post-release, as the PDs reported providing less than half of all participants with the seven different types of health services.
PDs were asked to report the percentage of SVORI program participants who were provided each of seven different types of employment, education, and skills development services. The PDs reported that about two thirds were receiving education programming pre-release, but only about one third (0.37) post-release. The PDs did report that, on average, more than half of all SVORI program participants were provided employment referrals/job placement, resume and interviewing skills development, and life skills training both pre- and post-release. Of the four types of family services, only family reunification post-release was provided to half or more of the SVORI program participants. In a subsequent chapter of this report, reports on service receipt by SVORI program participants are compared with those of the comparison subjects who did not participate in SVORI programs.
MULTI-SITE EVALUATION DESIGN This section briefly summarizes the evaluation design, data collection procedures, and issues related to potential bias. Interested readers are referred to Lattimore and Steffey (2009) for a full description of the evaluation methodology.
The evaluation components are shown in Exhibit 1. The implementation assessment addressed the extent to which the 89 SVORI programs (69 grantees) increased access to services

Introduction
23
and promoted systems change. Results were presented in Lattimore et al. (2005) and Winterfield et al. (2006) and in a series of Reentry Research in Action brief reports, including Lindquist and Winterfield (2005) and Lindquist (2005).
The impact evaluation assessed the effectiveness of SVORI by comparing key outcomes among those who received services as part of SVORI programs with those of a comparable group of individuals who received “treatment as usual” in 16 sites. These impact sites were chosen from the 89 SVORI programs following an extensive site selection process, with the objective of achieving diversity in programmatic approach and geographic representation. Likelihood of implementation and anticipated program enrollment (case flow) were other criteria considered during the site selection process. The 16 programs included 12 adult programs and 4 juvenile programs located in 14 states (adult only unless specified): Colorado (juveniles only), Florida (juveniles only), Indiana, Iowa, Kansas (adults and juveniles), Maine, Maryland, Missouri, Nevada, Ohio, Oklahoma, Pennsylvania, South Carolina (adults and juveniles), and Washington. The impact evaluation consisted of a longitudinal study of 2,391 returning prisoners (adult males, adult females, and juvenile males) who were interviewed approximately 1 month before release and then again at 3, 9, and 15 months post-release.9
As detailed in Lattimore and Steffey (2009), a site-specific research design was developed for each impact site. In two sites (Iowa and Ohio), the programs implemented a random-assignment evaluation design.10 In the remaining sites, comparison groups were developed by isolating the criteria that local site staff used to identify individuals eligible for enrollment in their SVORI program (these included factors such as age, criminal history, risk level, post-release supervision, transfer to pre-release facilities, and county of release) and replicating the selection procedures on a different population. Where possible, the comparison participants came from the same pre-release
9 Juvenile females were excluded from the impact evaluation because
of the extremely small number of SVORI participants in this subgroup.
10 Even though random assignment was employed in Iowa, participants were not evenly allocated to the two conditions. Program slots were filled first, and then the remaining participants were assigned to the control condition (which is the reason SVORI participants exceeded non-SVORI comparisons in Iowa).

Prisoner reentry experiences of adult males
24
facilities and were returning to the same post-release geographic areas as the SVORI participants. In some instances, comparison participants were identified as those who met all eligibility criteria except pre- or post-release geographic parameters. When this exception occurred, the comparison sample consisted of selected individuals from pre-release facilities that were comparable to facilities in which SVORI was available, or they consisted of selected individuals from SVORI facilities who were returning to a separate but similar geographic area. Eligible respondents (both SVORI and comparison) were identified monthly during the 17-month enrollment period for the impact evaluation. The evaluation adopted an “intent to treat” approach—SVORI participants were individuals who were enrolled in SVORI programs at the time of the pre-release interview regardless of the extent of services received or the length of time in programs.
The third component of the evaluation, an economic analysis, determined the return on SVORI investment and included both a cost-benefit and a cost-effectiveness analysis; results are presented in Cowell, Roman and Lattimore (2009).
Exhibit 4 presents the distribution of adult male pre-release interview respondents by site and by group. As the exhibit indicates, there was variation in the numbers of individuals who enrolled in the study across the sites, with the total number of enrollees ranging from 71 (Kansas) to 345 (South Carolina). Although the within-site case distribution was roughly 50:50 (SVORI to non-SVORI) in most sites, there were exceptions—most notably Iowa, Indiana, and Kansas.
Data Collection Procedures
Data collection consisted of four waves of in-person, computer-assisted interviews: the pre-release interview (Wave 1) conducted about one month before expected release and three follow-up interviews (Waves 2 through 4) conducted 3, 9, and 15 months after release. In addition, oral swab drug tests were conducted during the 3- and 15-month interviews for respondents who were interviewed in a community setting. For examination of recidivism outcomes, the interview and drug test data were supplemented with arrest data obtained from the FBI National Crime Information Center (NCIC) and with
The evaluation adopted an “intent to treat” approach…

Introduction
25
State SVORI Non-SVORI Total % of Total Iowa 114 55 169 10.0 Indiana 64 94 158 9.3 Kansas 23 48 71 4.2 Maine 35 44 79 4.7 Maryland 130 124 254 15.0 Missouri 36 50 86 5.1 Nevada 107 50 157 9.2 Ohio 47 38 85 5.0 Oklahoma 42 51 93 5.5 Pennsylvania 57 66 123 7.2 South Carolina 179 166 345 20.3 Washington 29 48 77 4.5 Total 863 834 1697 100.0
administrative records obtained from state correctional agencies.11
All interviews were conducted in private settings by experienced RTI field interviewers using computer-assisted personal interviewing. Pre-release interviews were conducted from July 2004 through November 2005 in more than 150 prisons and juvenile detention facilities. Pre-release interviews were conducted approximately 30 days before release and obtained data on the respondents’ characteristics and pre-prison experiences, as well as incarceration experiences and services received since admission to prison. These interviews also obtained data on the respondents’ post-release plans and expectations about reentry.
Post-release interviews were conducted from January 2005 through May 2007. The post-release interviews were conducted approximately 3, 9, and 15 months following release and were similar in content across waves and obtained data on reentry experiences, housing, employment, family and community integration, substance abuse, physical and mental health, supervision and criminal history, service needs, and service receipt. The interview instruments were developed through an
11 Note that in some instances these administrative records were
supplemented with data obtained from online criminal history databases. Readers are referred to Lattimore and Steffey (2009) for details.
Exhibit 4. Adult male sample sizes, by state and group
Pre-release interviews were conducted approximately 30 days before release…
The post-release interviews were conducted approximately 3, 9, and 15 months following release …

Prisoner reentry experiences of adult males
26
extensive instrumentation process involving substantive domain experts and the use of existing, validated measures and scales.
In addition to obtaining approval from and oversight by the Institutional Review Boards at RTI and the Urban Institute, memoranda of agreement or formal research agreements were negotiated with all agencies, and evaluation staff ensured that study procedures were approved by all facilities in which interviews were conducted (or by correctional agencies overseeing the facilities).
The following sections summarize the examination of nonresponse, attrition, and selection. The concluding section in this chapter provides information on the propensity score model and approach to the analyses.
Approach for Addressing Nonresponse and Attrition
A total of 2,564 cases were fielded of adult men eligible for inclusion in the multi-site evaluation. Wave 1 (pre-release) interviews were obtained with 1,697 (66%) of these men. Among eligible subjects approached for interviews, refusal rates were reasonably low—11.5% across the 12 sites. A breakdown of the categories of noninterviews and ineligible cases is provided in Appendix A, Exhibit A-1. As shown in the exhibit, most of the noninterviews with eligible men (21%) were due to the men being released before their Wave 1 pre-release interview could be scheduled and completed.12
Nearly 80% of the men who were interviewed at Wave 1 responded to at least one of the follow-up interviews. All cases were fielded for each follow-up wave. Overall, the response rate for follow-up interviews increased over time. Response rates for the Wave 2, 3, and 4 interviews were 58%, 61%, and 66%, respectively. All three follow-up interviews were obtained for 43% of the adult male samples. Exhibit 5 shows the number of interviews conducted at each wave, by group and site. 12 Release before an interview could be completed was particularly
problematic during the initial fielding of the Wave 1 interviews. The original protocols required identifying eligible participants 30 to 60 days prior to release. Although these cases were processed quickly (i.e., within 2 weeks to attempt an interview), some subjects were released before the interview could be scheduled. The protocols were changed to identify subjects earlier. No information was uncovered that would suggest that these “early releases” affected individuals in the two study groups differently. Further, although the release was “early,” the difference between actual and expected release dates was only a few days.

Introduction
27
Exhibit 5. Completed interviews by wave, group, and site
State
Wave 1 (Pre-release)
Wave 2 (3 Months Post)
Wave 3 (9 Months Post)
Wave 4 (15 Months Post)
SVORI Non-
SVORI SVORI Non-
SVORI SVORI Non-
SVORI SVORI Non-
SVORI IA 114 55 59 29 82 39 87 46 IN 64 94 49 53 41 56 45 59 KS 23 48 11 15 14 15 15 24 MD 130 124 58 63 64 56 65 65 ME 35 44 20 21 24 26 25 30 MO 36 50 26 31 27 24 26 35 NV 107 50 77 31 81 31 82 29 OH 47 38 25 26 28 27 28 26 OK 42 51 26 12 29 17 24 27 PA 57 66 43 50 44 50 46 48 SC 179 166 123 104 119 95 126 109 WA 29 48 12 20 12 34 13 33 Total 863 834 529 455 565 470 582 531
Although the response rates were reasonable, the possibility remains that respondents who “dropped out” of subsequent waves of interviews differed from those who completed the follow-up interviews. As preliminary evidence that the attrition was random or affected the SVORI and non-SVORI groups similarly, the SVORI and comparison groups were compared and were found to be similar at each wave on a range of characteristics. Results from models that examined for differences between groups with respect to response also suggested that SVORI program participation was not related to whether a participant responded.
Approach for Addressing Selection Bias
In most sites, men were not randomly assigned to SVORI or non-SVORI conditions. Although considerable effort was expended during the planning phases of the evaluation to work with each site to identify appropriate comparison populations, the possibility of differences between the SVORI and non-SVORI groups existed. A multitude of variables were examined, comparing SVORI to non-SVORI evaluation participants, and few differences between the two adult male groups were observed.

Prisoner reentry experiences of adult males
28
Exhibit 6 shows the t-statistics for comparisons between SVORI and non-SVORI participants. As can be seen, for the adult males, there are statistically significant differences for several variables, some of which have traditionally been linked to criminal behavior. In particular, those in SVORI programs were younger on average than non-SVORI participants at the time of the instant incarceration (26.1 years versus 27.1 years), more likely to be black (57% versus 50% black), less likely to be white (32% versus 37% white), and less likely to have been employed either in the 6 months prior to the current incarceration (64% versus 68%) or ever (89% versus 92%)—although the latter differences are relatively small. Although there were no significant differences in self-reported drug use immediately prior to the current incarceration, those in the non-SVORI group were more likely to report ever using cocaine (58% versus 53%) and heroin (23% versus 18%). SVORI participants were more likely than non-SVORI participants to be serving time for a drug crime (36% versus 31%), while non-SVORI participants were more likely to be serving time for a public order crime (22% versus 17%). This last finding is consistent with non-SVORI participants being more likely than SVORI participants to report that they were currently incarcerated for a parole violation (which was coded as a public order crime; 35% versus 27%) and for non-SVORI participants to report more prior prison incarcerations on average (1.33 versus 1.12 incarcerations).13
Propensity score matching techniques were used to improve the comparability between the SVORI and non-SVORI groups. The propensity score model is discussed in the following section.
13 Subjects were asked to indicate all crimes for which they were
currently incarcerated, so an individual could have reported serving time, for example, for both a violent crime and a parole violation.

Introduction
29
Exhibit 6. t-statistics comparing means of SVORI and non-SVORI groups
Variable Adult Males
N = 1,691 Age at incarceration −2.57* Race_white −2.30* Race_black 2.74* Race_other −0.83 Homeless/shelter/no set place to live prior to incarceration −0.12 Intimate relationship 6 months prior to incarceration −0.28 Employed during 6 months prior to incarceration −2.04* Ever held a job? −2.21* Received substance use treatment prior to incarceration 0.42 Received treatment for MH problem prior to incarceration −0.52 Any victimization 6 months prior to incarceration 0.61 Any violence perpetration 6 months prior to incarceration 0.80 Used alcohol 30 days prior to incarceration 0.43 Used marijuana 30 days prior to incarceration −0.76 Used drugs other than marijuana 30 days prior to incarceration −1.92 Ever use marijuana −1.25 Ever use cocaine −2.09* Ever use heroin −2.59* Conviction offense: person/violent crime 0.92 Conviction offense: property crime −1.35 Conviction offense: drug crime 2.36* Conviction offense: public order/other crime −2.58* Currently serving time for parole violation −3.18* Age at first arrest (minimum set at 7 years) −0.47 Arrest rate −0.50 Conviction rate −0.25 Times in juvenile lockup 0.86 Incarceration rate −3.28* Number of previous prison incarcerations −2.97*
Note: MH = mental health. *p value < 0.05, two-tailed test.
Propensity Score Model
A propensity score model was used to address potential selection bias due to the quasi-experimental design (see Rubin [2006] for a collection of seminal papers in propensity score modeling; see D’Agostino [1998] for an accessible tutorial). Propensity score models use observed characteristics to model the likelihood that an individual with those characteristics will

Prisoner reentry experiences of adult males
30
be selected (or assigned) to the intervention.14 The purpose is to identify a set of parameters that are then used to estimate the probability of assignment to the intervention for each individual in a study. These probabilities (p-hats or p̂ ) are then used either (1) to establish probability strata (or bins) within which subjects have similar probabilities of receiving the intervention; (2) as weights in the outcome models; or (3) as matching variables. The success of the estimation is judged by the effectiveness of the strata or weights in reducing differences between the treatment and control groups on observed characteristics or, in the common terminology, achieving balance between the two groups.
The stratification or binning approach was used during preliminary assessments of the impact of SVORI on multiple outcomes. The final outcome models were estimated using the weighting approach, since it greatly simplifies the presentation of findings. Results showed that population average treatment effects estimated by combining results from the analyses based on strata were nearly identical to those derived from the weighted models—as would be expected.
The adult male sample included 1,697 observations, 1,500 (88.4%) of which had no missing values on any of the variables
14 Propensity scoring methods are not without limitations. For
example, use of propensity scores can only adjust for included covariates (Glynn, Schneeweiss, & Sturmer, 2006; Rosenbaum & Rubin, 1983). Unlike randomization, which tends to balance treatment and control groups on observed and unobserved covariates, use of propensity scores only balances on observed confounding covariates. The failure to include unobserved covariates can lead to biased estimates of treatment effects. However, if many of the covariates believed to be related to treatment assignment are measured, propensity score approaches (i.e., matching, stratification, regression adjustment) should yield consistent and approximately unbiased estimates of treatment effects (D'Agostino, 1998; Rosenbaum & Rubin, 1983). A second limitation is that propensity score approaches work better in larger samples; in studies with small samples, substantial imbalances of covariates may be unavoidable (Rubin, 1997). However, this is also true of randomized experiments and is not limited to propensity score methods. A third possible limitation is that included covariates that are strongly related to treatment assignment and only weakly correlated with the outcome are treated the same as covariates that are strongly related to both treatment assignment and outcome (Rubin, 1997). This might be considered a limitation because including irrelevant covariates can reduce efficiency. Rubin (1997) notes, however, that the potential biasing effects of failing to control for weakly correlated covariates are worse than the potential loss of efficiency from including them.

Introduction
31
included in the propensity score model. However, to take advantage of the full sample (and minimize selection issues with respect to item missingness), imputation procedures were used to generate values for missing items. In particular, the logit model to generate the probability of assignment to SVORI [p(SVORI) or p(S)] was estimated within the framework of SAS® 9.1 PROC MI ANALYZE. This SAS procedure allowed accommodation of item missingness by imputing values for missing values.
As detailed in Lattimore and Steffey (2009), the propensity score model included a total of 24 variables that reflected pre-assignment characteristics. These variables were the following:
age at incarceration;
race (white and other; black was reference);
homeless in the 6 months prior to incarceration;
employed in the 6 months prior to incarceration;
steady relationship in the 6 months prior to incarceration;
experienced victimization in the 6 months prior to incarceration;
family deviance scale;
peer deviance scale;
used drugs other than marijuana in the 30 days prior to incarceration;
used marijuana in the 30 days prior to incarceration;
drank alcohol in the 30 days prior to incarceration;
mental health treatment prior to incarceration;
substance abuse treatment prior to incarceration;
age at first arrest;
times locked up in juvenile detention;
arrest rate;
conviction rate;
incarceration rate;
currently serving time for a parole violation;
currently serving time for a person/violent crime;
currently serving time for a property crime;
currently serving time for a drug crime; and
currently serving time for a public order or other crime.

Prisoner reentry experiences of adult males
32
The coefficients from the logit model were then used to generate a p̂ for each individual (i.e., the 1,697 adult male subjects).15
Assessment of the validity of the model is attained by examining the extent to which the propensity scores allow attainment of balance between the SVORI and non-SVORI groups. After this issue is addressed, information is presented on the distribution of the propensity scores that the models generated.
The purpose of the propensity score is to achieve greater comparability between treatment and comparison groups. Two ways of checking for balance are to examine t statistics comparing SVORI and non-SVORI means or standardized differences (see, e.g., Rosenbaum & Rubin, 1985). The data were examined using both approaches; results suggested substantial improvement with respect to balance within bins. These results are presented in Lattimore and Steffey (2009). Additionally, the estimated p̂ values were used as weights in models that provided checks to determine the extent to which these weights resulted in comparability between the two groups. Exhibit 7 provides one indication in the improvement in balance attained with the propensity scores. This exhibit presents the results of regressing individually the variables that were included in the SVORI propensity score model on the SVORI indicator using Proc Survey Logistic Regression. These analyses tested whether knowledge of a particular characteristic (e.g., race) resulted in better prediction of SVORI program participation. As can be seen in Exhibit 7, the results suggest that this hypothesis was rejected in every case,
15 Within the PROC MI procedure, each of the five data sets was used
to generate the five sets of coefficients shown above. Each set of coefficients was then applied to the dataset from which it was generated, resulting in five p̂ s for each individual. The five
estimates were then averaged to produce one estimate for each individual. Because the range of parameter estimates is small for all of the variables included in the model, the difference between the minimum and maximum p̂ values is also small for most
observations. The difference between the minimum and maximum p̂ values ranged from 0.0008 to 0.1271 with a mean of 0.012
(standard deviation = 0.012) and median of 0.008. Extreme values in the maximum difference between estimated p-hats were rare. The 99th, 95th, 90th, and 75th percentiles were 0.063, 0.032, 0.023, and 0.012, respectively

Introduction
33
Exhibit 7. Balance checks for Wave 1 data based on propensity score weighted regression of the variable on a SVORI indicator
Variable Estimate SE Wald
Chi Sq Prob
Chi Sq
Odds Ratio
Estimate Lower
CL Upper
CL Age at incarceration −0.00006 0.007 0.000 0.993 1.000 0.987 1.013 Race_white −0.00280 0.104 0.001 0.979 0.997 0.813 1.223 Race_black 0.00206 0.099 0.000 0.983 1.002 0.825 1.217 Race_other 0.00107 0.149 0.000 0.994 1.001 0.748 1.340 No home 0.00096 0.148 0.000 0.995 1.001 0.749 1.337 Employed −0.00077 0.104 0.000 0.994 0.999 0.814 1.226 Steady relationship 0.00225 0.106 0.000 0.983 1.002 0.814 1.234 Drug treatment prior 0.00696 0.100 0.005 0.945 1.007 0.827 1.226 MH treatment prior −0.00293 0.114 0.001 0.980 0.997 0.797 1.248 Victim_prior −0.00636 0.100 0.004 0.949 0.994 0.816 1.209 Perpetration 0.00000 0.106 0.000 1.000 1.000 0.813 1.230 rBSUA1b 0.00645 0.106 0.004 0.951 1.006 0.818 1.238 rBSUA10b −0.00112 0.099 0.000 0.991 0.999 0.823 1.213 Other_drug −0.00211 0.099 0.000 0.983 0.998 0.821 1.213 Person crime 0.00217 0.101 0.000 0.983 1.002 0.823 1.221 Property crime 0.00226 0.114 0.000 0.984 1.002 0.802 1.253 Drug crime −0.00050 0.105 0.000 0.996 0.999 0.814 1.228 Public order/other crime −0.00151 0.123 0.000 0.990 0.998 0.784 1.272 Parole violation 0.00150 0.114 0.000 0.990 1.002 0.800 1.253 Age first arrest 0.00048 0.010 0.002 0.962 1.000 0.981 1.020 arrest_rate −0.00760 0.108 0.005 0.944 0.992 0.803 1.226 convict_rate 0.01522 0.206 0.005 0.941 1.015 0.678 1.520 # juvenile detentions −0.00024 0.016 0.000 0.988 1.000 0.970 1.031 inc_rate −0.07839 0.874 0.008 0.929 0.925 0.167 5.129
Note: CL = confidence level. SE = standard error.
implying no differences between the groups with respect to these observed characteristics.
Similar balance checks were conducted on the data from Waves 2 through 4 to determine whether the balance attained with the propensity scores persisted with the reduced samples available for the follow-up data. Results were similar to those presented above for Wave 1 data. No parameter estimate was significantly different from zero at the alpha = 0.05 level.
The distributional findings for p̂ are shown in Exhibit 8. As can be seen, p̂ ranges from a low of 0.1806 to a high of 0.7412. The means of the distributions of the SVORI and non-SVORI groups are similar—0.5232 for SVORI and 0.4934 for non-SVORI. It is also clear that the distributions have substantial overlap.
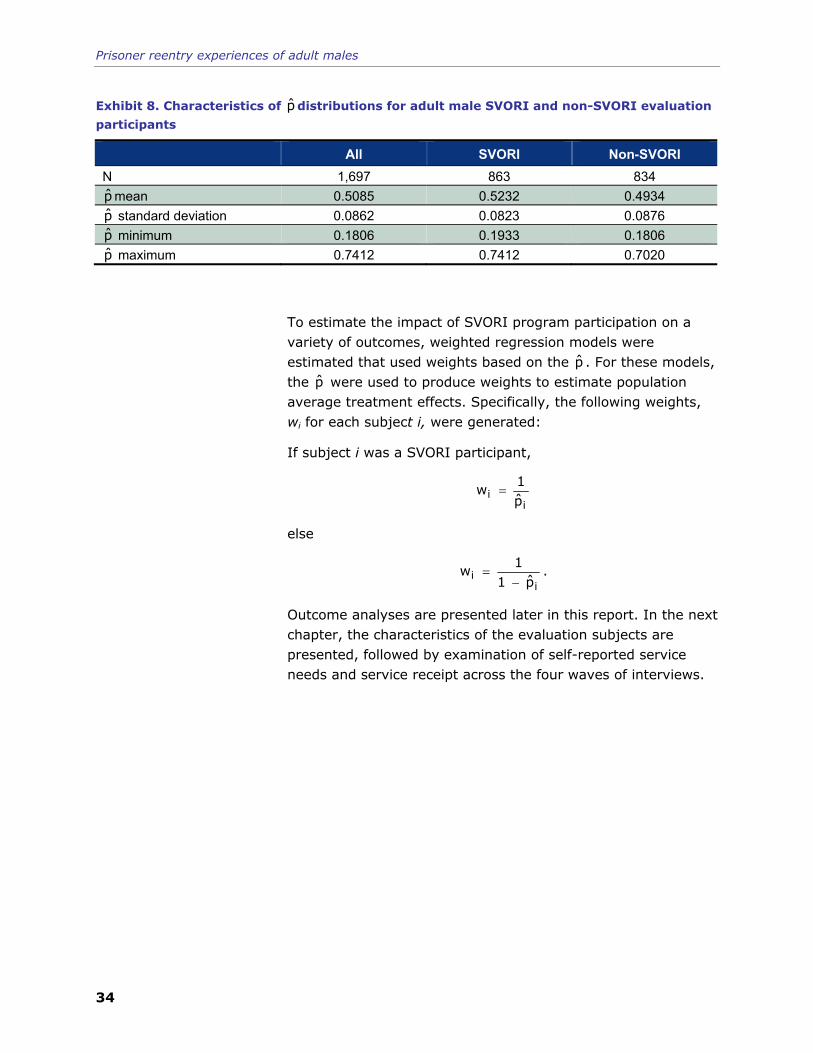
Prisoner reentry experiences of adult males
34
Exhibit 8. Characteristics of p̂ distributions for adult male SVORI and non-SVORI evaluation
participants
All SVORI Non-SVORI N 1,697 863 834 p̂ mean 0.5085 0.5232 0.4934 p̂ standard deviation 0.0862 0.0823 0.0876 p̂ minimum 0.1806 0.1933 0.1806 p̂ maximum 0.7412 0.7412 0.7020
To estimate the impact of SVORI program participation on a variety of outcomes, weighted regression models were estimated that used weights based on the p̂ . For these models, the p̂ were used to produce weights to estimate population average treatment effects. Specifically, the following weights, wi for each subject i, were generated:
If subject i was a SVORI participant,
i
i p̂1
w =
else
i
i p̂11
w−
= .
Outcome analyses are presented later in this report. In the next chapter, the characteristics of the evaluation subjects are presented, followed by examination of self-reported service needs and service receipt across the four waves of interviews.

35
CChhaarraacctteerriissttiiccss ooff tthhee SSVVOORRII aanndd NNoonn--SSVVOORRII CCoommppaarriissoonn RReessppoonnddeennttss
This chapter provides descriptive information about the 1,697 adult male SVORI and non-SVORI respondents interviewed in the 12 adult impact sites. Exhibit A-2 in Appendix A provides the means, standard deviations, and t-statistics for the variables discussed here.16
DEMOGRAPHIC CHARACTERISTICS The men in the SVORI and non-SVORI samples were almost exclusively U.S. born (100% and 98% of the SVORI and non-SVORI respondents, respectively) and spoke English as a first language (98% and 97%, SVORI and non-SVORI, respectively). In addition, as shown in Exhibit 9, more than half (57%) of the SVORI respondents were black and 32% were white.17 The SVORI sample included a higher percentage of black men and a lower percentage of white men than the non-SVORI comparison sample, which was 50% black and 37% white. Only 4% of both groups identified themselves as Hispanic.18
16 The results in this chapter are updated from material presented in
Lattimore et al. (2008). In a few cases, results differ slightly from those presented earlier. The small differences result from decisions made during the final cleaning of the data.
17 Respondents were allowed to select all that applied. Individuals who reported more than one race are coded here as “other,” which also includes American Indian or Alaska Native, Asian or East Indian, and Native Hawaiian or other Pacific Islander.
18 Individuals are coded Hispanic if they chose “Hispanic, Latino or Spanish,” regardless of whether they chose a race category.
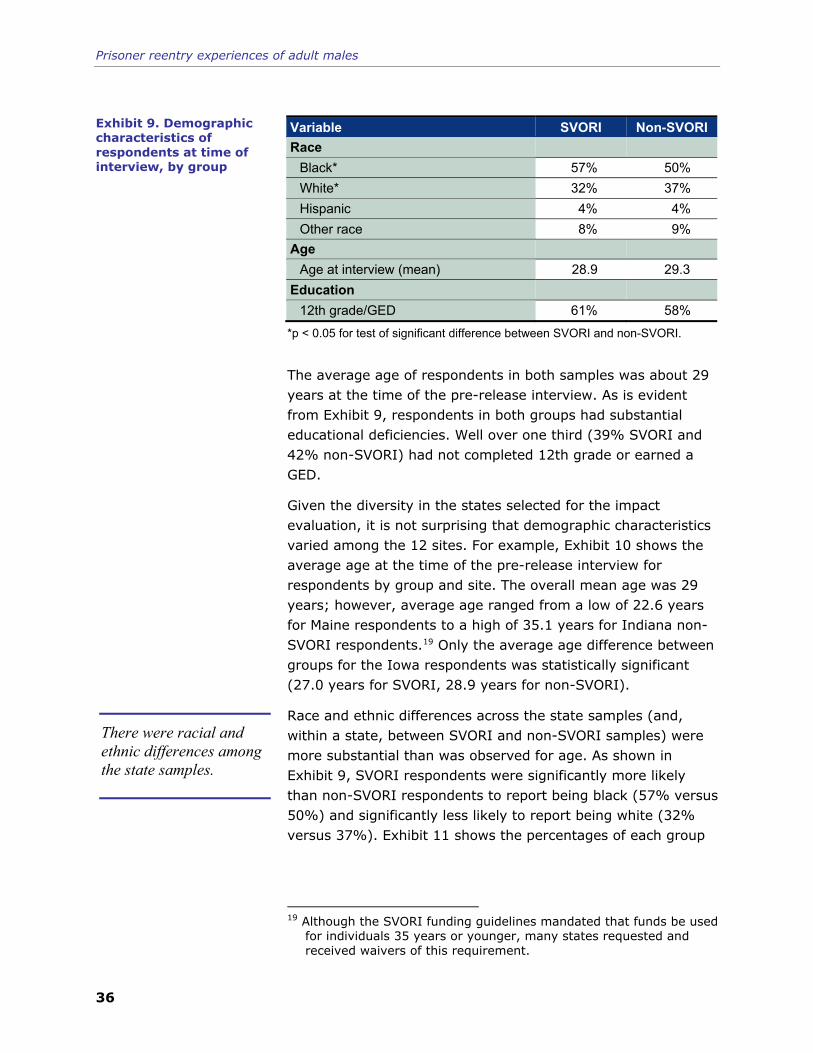
Prisoner reentry experiences of adult males
36
Variable SVORI Non-SVORI Race
Black* 57% 50% White* 32% 37% Hispanic 4% 4% Other race 8% 9%
Age Age at interview (mean) 28.9 29.3
Education 12th grade/GED 61% 58%
*p < 0.05 for test of significant difference between SVORI and non-SVORI.
The average age of respondents in both samples was about 29 years at the time of the pre-release interview. As is evident from Exhibit 9, respondents in both groups had substantial educational deficiencies. Well over one third (39% SVORI and 42% non-SVORI) had not completed 12th grade or earned a GED.
Given the diversity in the states selected for the impact evaluation, it is not surprising that demographic characteristics varied among the 12 sites. For example, Exhibit 10 shows the average age at the time of the pre-release interview for respondents by group and site. The overall mean age was 29 years; however, average age ranged from a low of 22.6 years for Maine respondents to a high of 35.1 years for Indiana non-SVORI respondents.19 Only the average age difference between groups for the Iowa respondents was statistically significant (27.0 years for SVORI, 28.9 years for non-SVORI).
Race and ethnic differences across the state samples (and, within a state, between SVORI and non-SVORI samples) were more substantial than was observed for age. As shown in Exhibit 9, SVORI respondents were significantly more likely than non-SVORI respondents to report being black (57% versus 50%) and significantly less likely to report being white (32% versus 37%). Exhibit 11 shows the percentages of each group
19 Although the SVORI funding guidelines mandated that funds be used
for individuals 35 years or younger, many states requested and received waivers of this requirement.
Exhibit 9. Demographic characteristics of respondents at time of interview, by group
There were racial and ethnic differences among the state samples.

Respondent Characteristics
37
27.0
32.8
27.8
22.7
34.6
28.4
26.4 28
.8
26.2 27.2 28
.9
27.528
.9
35.1
22.6
27.8
27.1 28
.4
26.0 27
.4 30.0
27.1
26.8
32.5
0
5
10
15
20
25
30
35
40
IA* IN KS ME MD MO NV OH OK PA SC WA
Yea
rs
SVORINon-SVORI
*p < 0.05 for test of significant difference between SVORI and non-SVORI.
by site who reported that they were white or black.20 There were considerable variations among sites, however. For example, in Maryland, only 2% of the SVORI respondents were white, whereas in Maine, 69% of the SVORI respondents and 73% of the non-SVORI respondents were white. Overall, where there were statistically significant differences within a state, more SVORI respondents than non-SVORI respondents reported that they were black. This was true for 5 of the 12 sites—Kansas, Maryland, Missouri, Oklahoma, and South Carolina. Furthermore, in three sites—Maryland, Missouri, and Oklahoma—the proportion of white SVORI respondents was significantly less than the proportion of white non-SVORI respondents.
20 Respondents were also coded as Hispanic or other/multiracial—see
footnote 18.
Exhibit 10. Age at time of interview, by site and group
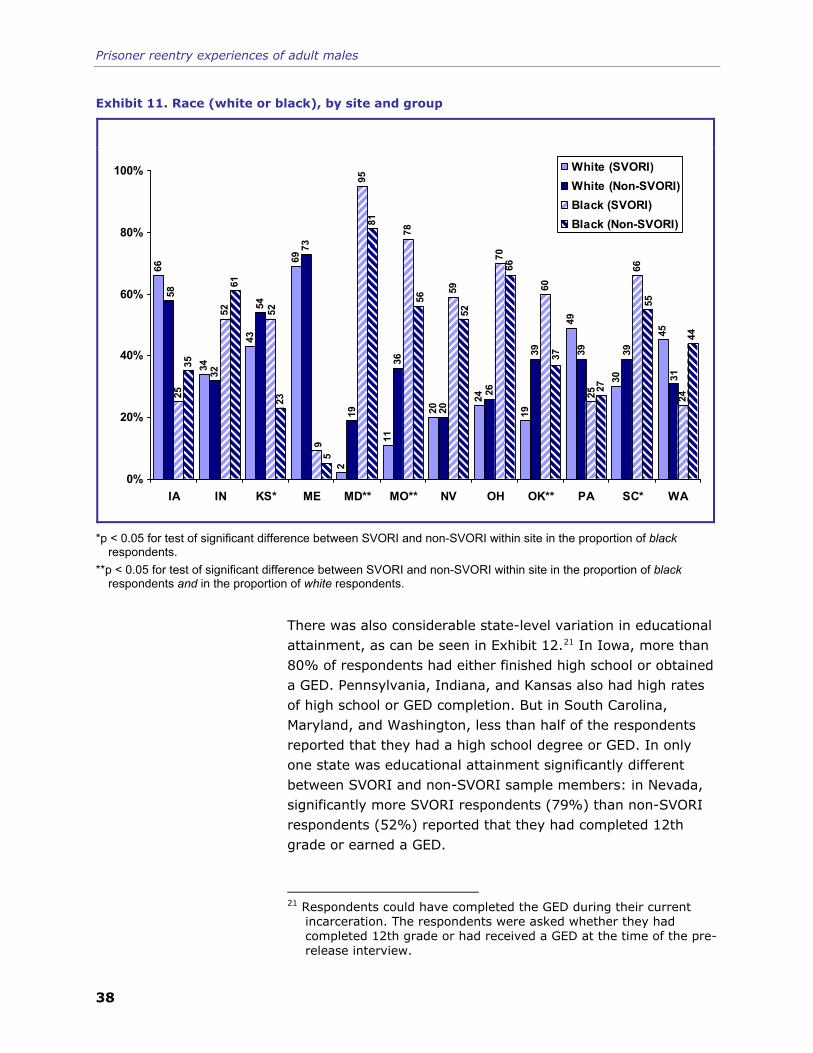
Prisoner reentry experiences of adult males
38
Exhibit 11. Race (white or black), by site and group
45
30
49
19
24
20
11
2
69
43
34
66
3939
26
20
36
19
73
54
32 31
39
58
24
66
60
70
59
78
95
52
25 25
52
9
44
27
81
23
61
35
37
52
5
55
66
56
0%
20%
40%
60%
80%
100%
IA IN KS* ME MD** MO** NV OH OK** PA SC* WA
White (SVORI)White (Non-SVORI)Black (SVORI)Black (Non-SVORI)
*p < 0.05 for test of significant difference between SVORI and non-SVORI within site in the proportion of black respondents.
**p < 0.05 for test of significant difference between SVORI and non-SVORI within site in the proportion of black respondents and in the proportion of white respondents.
There was also considerable state-level variation in educational attainment, as can be seen in Exhibit 12.21 In Iowa, more than 80% of respondents had either finished high school or obtained a GED. Pennsylvania, Indiana, and Kansas also had high rates of high school or GED completion. But in South Carolina, Maryland, and Washington, less than half of the respondents reported that they had a high school degree or GED. In only one state was educational attainment significantly different between SVORI and non-SVORI sample members: in Nevada, significantly more SVORI respondents (79%) than non-SVORI respondents (52%) reported that they had completed 12th grade or earned a GED.
21 Respondents could have completed the GED during their current
incarceration. The respondents were asked whether they had completed 12th grade or had received a GED at the time of the pre-release interview.
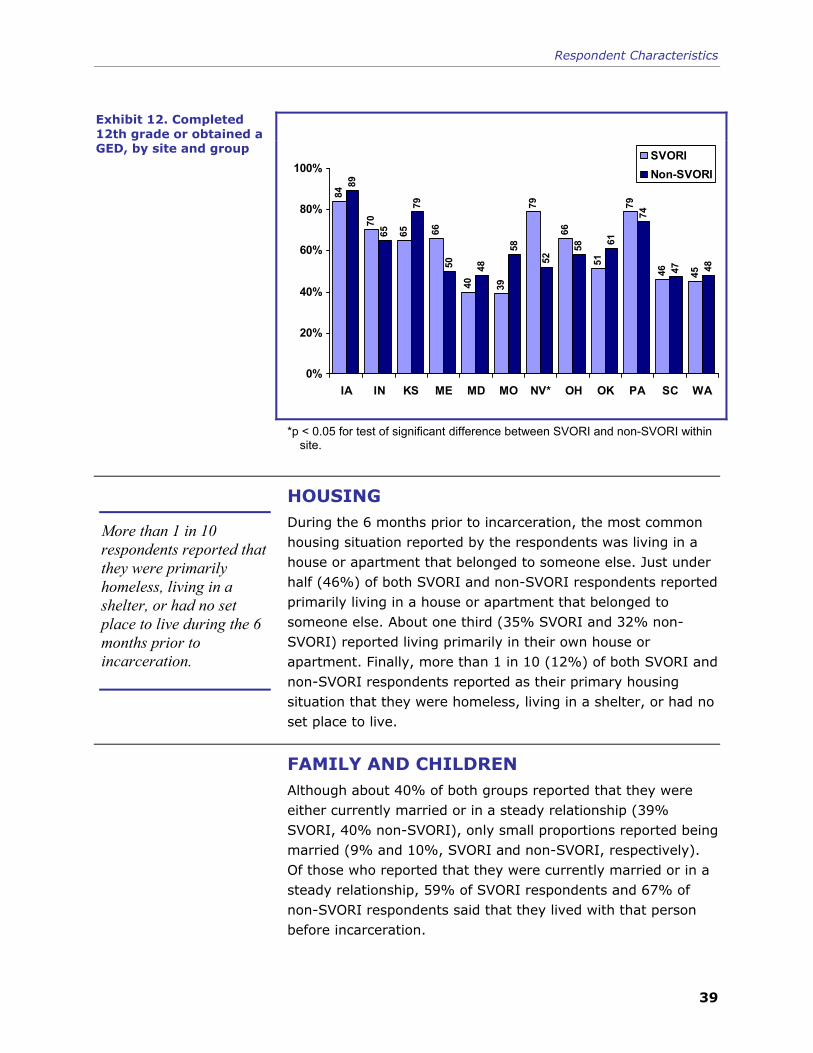
Respondent Characteristics
39
4546
79
51
66
79
3940
6665
70
84
4847
74
6158
52
58
4850
79
65
89
0%
20%
40%
60%
80%
100%
IA IN KS ME MD MO NV* OH OK PA SC WA
SVORINon-SVORI
*p < 0.05 for test of significant difference between SVORI and non-SVORI within site.
HOUSING During the 6 months prior to incarceration, the most common housing situation reported by the respondents was living in a house or apartment that belonged to someone else. Just under half (46%) of both SVORI and non-SVORI respondents reported primarily living in a house or apartment that belonged to someone else. About one third (35% SVORI and 32% non-SVORI) reported living primarily in their own house or apartment. Finally, more than 1 in 10 (12%) of both SVORI and non-SVORI respondents reported as their primary housing situation that they were homeless, living in a shelter, or had no set place to live.
FAMILY AND CHILDREN Although about 40% of both groups reported that they were either currently married or in a steady relationship (39% SVORI, 40% non-SVORI), only small proportions reported being married (9% and 10%, SVORI and non-SVORI, respectively). Of those who reported that they were currently married or in a steady relationship, 59% of SVORI respondents and 67% of non-SVORI respondents said that they lived with that person before incarceration.
Exhibit 12. Completed 12th grade or obtained a GED, by site and group
More than 1 in 10 respondents reported that they were primarily homeless, living in a shelter, or had no set place to live during the 6 months prior to incarceration.
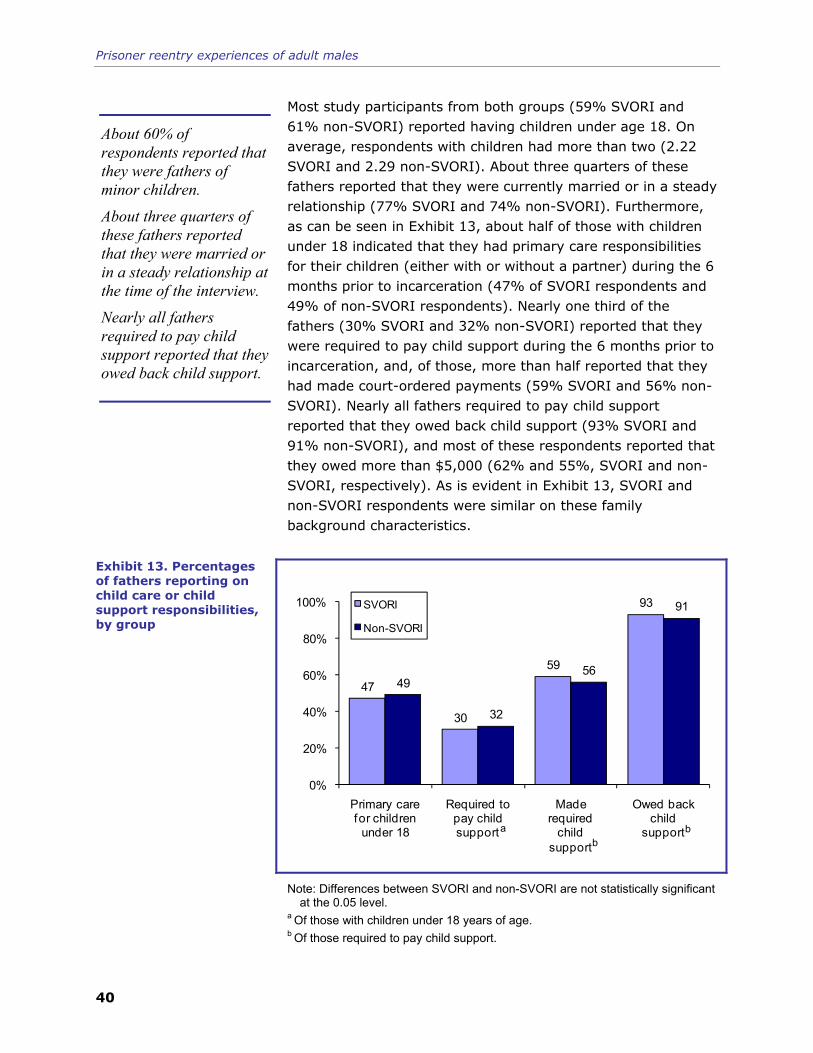
Prisoner reentry experiences of adult males
40
Most study participants from both groups (59% SVORI and 61% non-SVORI) reported having children under age 18. On average, respondents with children had more than two (2.22 SVORI and 2.29 non-SVORI). About three quarters of these fathers reported that they were currently married or in a steady relationship (77% SVORI and 74% non-SVORI). Furthermore, as can be seen in Exhibit 13, about half of those with children under 18 indicated that they had primary care responsibilities for their children (either with or without a partner) during the 6 months prior to incarceration (47% of SVORI respondents and 49% of non-SVORI respondents). Nearly one third of the fathers (30% SVORI and 32% non-SVORI) reported that they were required to pay child support during the 6 months prior to incarceration, and, of those, more than half reported that they had made court-ordered payments (59% SVORI and 56% non-SVORI). Nearly all fathers required to pay child support reported that they owed back child support (93% SVORI and 91% non-SVORI), and most of these respondents reported that they owed more than $5,000 (62% and 55%, SVORI and non-SVORI, respectively). As is evident in Exhibit 13, SVORI and non-SVORI respondents were similar on these family background characteristics.
47
30
59
93
49
32
56
91
0%
20%
40%
60%
80%
100%
Primary care for children
under 18
Required to pay child support
Made required
child support
Owed back child
support
SVORI
Non-SVORI
bba
Note: Differences between SVORI and non-SVORI are not statistically significant at the 0.05 level.
a Of those with children under 18 years of age. b Of those required to pay child support.
About 60% of respondents reported that they were fathers of minor children.
About three quarters of these fathers reported that they were married or in a steady relationship at the time of the interview.
Nearly all fathers required to pay child support reported that they owed back child support.
Exhibit 13. Percentages of fathers reporting on child care or child support responsibilities, by group

Respondent Characteristics
41
Nearly all SVORI and non-SVORI respondents (97% of both groups) reported having people in their lives they considered to be family. Respondents also reported that their family provided an important source of emotional support (data not shown). Nearly all respondents (88% of SVORI and 91% of non-SVORI) agreed or strongly agreed that they felt close to their family and wanted their family to be involved in their life (95% SVORI and 96% non-SVORI).
Although they provided a substantial source of emotional support for these men, family members also may have served as a negative influence. As shown in Exhibit 14, about three quarters of both SVORI and non-SVORI respondents reported having family members who had been convicted of a crime or incarcerated, and nearly three quarters (72% SVORI and 74% non-SVORI) reported having family members who had problems with drugs or alcohol.
Exhibit 14. Criminal history and substance use of family and peers, by group
8275 75 72
83 81 838176 74 74
83
0%
20%
40%
60%
80%
100%
Family whohave beenconvicted
Family whohave been
incarcerated
Family withdrug oralcohol
problems
Friends whohave beenconvicted
Friends whohave been
incarcerated
Friends withdrug oralcohol
problems
SVORINon-SVORI
Note: Differences between SVORI and non-SVORI are not statistically significant at the 0.05 level.
About three quarters of respondents reported having family members who had been convicted of a crime or incarcerated.
Prisoner reentry experiences of adult males
42
Similarly, the reported prevalence of illegal behavior and problems with substance use among friends was also high. A large majority of respondents reported having criminally involved friends prior to incarceration. The majority of both SVORI and non-SVORI respondents reported having friends prior to incarceration who had been convicted of a crime (83% of both groups) or incarcerated (81% of both groups). The respondents also reported that, prior to incarceration, they had friends who had problems with drugs or alcohol (82% SVORI and 83% non-SVORI).
SUBSTANCE USE AND PHYSICAL AND MENTAL HEALTH Respondents were asked a variety of questions about their pre-prison alcohol and drug use, as well as their substance abuse treatment experiences. They were also asked about their lifetime and current experiences with a variety of physical illnesses. In addition, they were asked to respond to a series of items that comprise three well-known scales—the SF-12 physical health scale, the SF-12 mental health scale, and the SA-45 Global Severity Index (GSI; Ware et al., 2002; Strategic Advantages, 2000).
Substance Use and Treatment
Nearly all of the respondents reported having used alcohol and drugs during their lifetimes. The majority of both groups reported using alcohol (96% SVORI and 97% non-SVORI), and the average age of first use was about 14 years (13.7 and 13.6 for the SVORI and non-SVORI respondents, respectively). Similarly, nearly all respondents in both groups reported having used marijuana (92% SVORI and 94% non-SVORI), again reporting a young age of first use (13.9 and 14.1 for the SVORI and non-SVORI respondents, respectively). Exhibit 15 shows responses for lifetime use for the most common drugs.
As can be seen, self-reports on “ever using” indicate somewhat higher usage among the non-SVORI respondents for most drugs. More than half of all respondents reported having used cocaine (53% and 58% of the SVORI and non-SVORI respondents, respectively), and nearly one half reported having used hallucinogens (43% and 49%, SVORI and non-SVORI,
A large majority of respondents reported having criminally involved friends prior to incarceration.
Nearly all of the respondents reported having used alcohol and drugs during their lifetimes.
Self-reports on “ever using” indicate somewhat higher usage among the non-SVORI respondents for most drugs.

Respondent Characteristics
43
Exhibit 15. Lifetime substance use, by group
16
20
21
23
30
31
30
49
58
94
15
16
18
18
24
25
26
43
53
92
0% 20% 40% 60% 80% 100%
Inhalants
Stimulants*
Sedatives
Heroin*
Pain relievers*
Tranquilizers*
Amphetamines
Hallucinogens*
Cocaine*
Marijuana
SVORINon-SVORI
*p < 0.05 for test of significant difference between SVORI and non-SVORI.
respectively). Fewer respondents reported using other substances.22
There was considerable variability among the states with respect to self-reports of ever using specific drugs. Exhibit 16 presents the percentages of respondents in each site and group who reported ever using cocaine, heroin, and hallucinogens. Only 22% of the Missouri SVORI respondents reported ever using cocaine in comparison with 82% of the non-SVORI respondents from Maine. Self-reported heroin use ranged from a low of 3% (Missouri SVORI) to a high of 64% (Maine non-SVORI), whereas self-reported hallucinogen use ranged from 21% (Maryland SVORI) to 86% (Maine non-SVORI).
22 Less than 10% reported ever using methadone (6% and 9% for the
SVORI and non-SVORI respondents, respectively) or anabolic steroids (2% for both the SVORI and non-SVORI respondents).

Prisoner reentry experiences of adult males
44
Exhibit 16. Lifetime use of cocaine, heroin, and hallucinogens, by site and group
Site
Cocaine Heroin Hallucinogens
SVORI Non-SVORI
SVORI Non-SVORI
SVORI Non-SVORI IA 75% 65% 14% 13% 68% 65% IN 72% 67% 17% 17% 47% 49% KS 30%* 62%* 9% 21% 48% 64% ME 69% 82% 49% 64% 83% 86% MD 48% 52% 49% 49% 21%* 36%* MO 22%* 58%* 3%* 26%* 56% 62% NV 36% 50% 5%* 16%* 48% 48% OH 34% 50% 11% 13% 38% 32% OK 55% 54% 7% 12% 62% 63% PA 49% 59% 12% 17% 39% 53% SC 56% 53% 7% 9% 22%* 31%* WA 66% 60% 38% 23% 76% 63%
*p < 0.05 for test of significant difference between SVORI and non-SVORI within site.
There were only a few statistically significant differences between SVORI and non-SVORI groups within site; in each of these cases more non-SVORI than SVORI respondents reported ever using various types of drugs. Specifically, non-SVORI respondents in Kansas and Missouri were much more likely than SVORI respondents in those states to report having used cocaine, and non-SVORI respondents in Missouri and Nevada were more likely than SVORI respondents in those states to report heroin use. Finally, in Maryland and South Carolina, non-SVORI respondents were more likely than SVORI respondents to report hallucinogen use.
There were few differences between the two groups with respect to reported drug use during the 30 days prior to their current incarceration. About two thirds of both groups reported having used one or more illicit drugs during the 30 days prior to their imprisonment (66% and 69% for the SVORI and non-SVORI respondents, respectively). Exhibit 17 shows that there were SVORI/non-SVORI differences among the sites on this measure although the differences between groups within site are not statistically significant at the 0.05 level. Reported use ranged from a high of 84% of non-SVORI respondents in Maine to a low of 46% of SVORI respondents in Pennsylvania.
In some sites, more non-SVORI than SVORI respondents reported ever using various types of drugs.
About two thirds of respondents reported having used one or more illicit drugs during the 30 days prior to their imprisonment.

Respondent Characteristics
45
72
68
46
83
6058
69
58
77
65
7374
83
62
52
8279
62
8284
68
64
76
0%
20%
40%
60%
80%
100%
IA IN KS ME MD MO NV OH OK PA SC WA
SVORINon-SVORI
Note: Within-site differences between SVORI and non-SVORI are not significant at the 0.05 level.
Exhibit 18 compares the two groups’ reported use during the 30 days prior to incarceration for the most commonly reported drugs. More than half of both SVORI and non-SVORI respondents reported using marijuana; approximately one quarter of all respondents reported using cocaine.
9
14
14
26
53
9
11
13
22
52
0% 20% 40% 60% 80% 100%
Hallucinogens
Pain relievers
Amphetamines
Cocaine
Marijuana
SVORINon-SVORI
Note: Within-site differences between SVORI and non-SVORI are not significant at the 0.05 level.
Exhibit 17. Substance use during the 30 days prior to incarceration, by site and group
Exhibit 18. Use of specific substances during the 30 days prior to incarceration, by group

Prisoner reentry experiences of adult males
46
More than half of SVORI and non-SVORI respondents had received treatment for a substance use or mental health problem at some point during their lifetime (56% and 55% of SVORI and non-SVORI, respectively). Of these, about one quarter had received treatment for alcohol abuse or dependency (25% of SVORI respondents and 28% of non-SVORI respondents), and more than one third reported that they had received treatment for drug abuse or dependence (42% SVORI and 41% non-SVORI). On average, those who had received treatment had started a treatment program on more than two separate occasions.
As shown in Exhibit 19, the percentage of respondents reporting receiving treatment prior to prison varied considerably across sites (but not within). Whereas less than 30% of Nevada respondents reported having previously received treatment for substance use, about two-thirds of those in Iowa reported that they had participated in substance use treatment prior to their current incarceration.
41
36
51
3334
21
44
36
57
4847
67
42
28
50
37
32
28
58
33
45
5048
64
0%
20%
40%
60%
80%
100%
IA IN KS ME MD MO NV OH OK PA SC WA
SVORINon-SVORI
Note: Within-site differences between SVORI and non-SVORI are not significant at the 0.05 level.
More than half of respondents had received treatment for a substance use or mental health problem at some point during their lifetime.
Exhibit 19. Any substance use treatment prior to current incarceration, by site and group

Respondent Characteristics
47
Physical Health
Overall, the study participants reported currently experiencing few physical health problems. Most respondents rated their current physical health as excellent or very good (65% of SVORI and 63% of non-SVORI). The percentages of subjects in each group who reported ever or currently having specific diseases are shown in Exhibits 20 and 21.
Exhibit 20. Lifetime health problems, by group
1
2
5
6
5
7
16
16
19
1
2
3
5
5
6
15
17
20
0% 5% 10% 15% 20% 25%
HIV positive/AIDS
Diabetes
Hepatitis B or C
Arthritis
Heart trouble
Tuberculosis
Chronic back pain
High blood pressure
Asthma
SVORINon-SVORI
Note: Differences between SVORI and non-SVORI are not significant at the 0.05 level.
Asthma, high blood pressure, and chronic back pain were the most commonly reported. Only 1% of the respondents reported that they were HIV positive or had been diagnosed with AIDS, whereas about 4% reported that they had been diagnosed with hepatitis B or C. There were no statistically significant differences in the reports of physical illnesses between the two groups.
Overall, the study participants reported currently experiencing few physical health problems.

Prisoner reentry experiences of adult males
48
Exhibit 21. Current health problems, by group
1
2
5
5
3
0
13
8
10
1
1
3
5
3
0
11
9
11
0% 5% 10% 15% 20% 25%
HIV positive/AIDS
Diabetes
Hepatitis B or C*
Arthritis
Heart trouble
Tuberculosis
Chronic back pain
High blood pressure
Asthma
SVORINon-SVORI
Note: Differences between SVORI and non-SVORI are not significant at the 0.05 level.
Mental Health
There were also no differences between SVORI and non-SVORI respondents in their scores on the four scales measuring physical and mental functioning (the SF-12 scales) and mental health (the SA-45 GSI and Positive Symptom Total [PST]). Scores on the SF-12 physical health scale were above 50 (53.63 for SVORI respondents, 53.34 for non-SVORI respondents). Furthermore, more than half of each group responded that they had no limitations with respect to each of the five items that constitute the physical health scale (59% of SVORI respondents and 56% of non-SVORI respondents). Scores on the SF-12 mental health scale were nearly 50 (48.93 for SVORI respondents, 48.51 for non-SVORI respondents). Both groups scored less than 70 on the GSI, which has a range of 45 to 225; higher scores indicate more psychopathology (66.64 and 68.09 for the SVORI and non-SVORI respondents, respectively). Average scores on the PST index were 13 for both SVORI and non-SVORI respondents, meaning that respondents reported experiencing, on average, 13 of the 45
There were no differences between SVORI and non-SVORI respondents in their general measures of physical and mental functioning and mental health.

Respondent Characteristics
49
symptoms included in the SA-45 during the 7 days prior to the interview.
In addition to the GSI, the SA-45 includes subscales indicating symptoms of specific psychopathologies. Of the nine subscales, there were statistically significant differences for two measures—in each case indicating that the non-SVORI respondents were slightly worse on these measures than the SVORI respondents. Results are shown in Exhibit 22. Scores on these subscales range from a low of 5 to a high of 25, and all results for the respondents were on the lower end of the range. Scores were similar between groups for anxiety, depression, interpersonal sensitivity, obsessive-compulsive disorder, paranoid ideation, phobic anxiety, and somatization. Non-SVORI respondents were significantly more likely than SVORI respondents to indicate symptoms of hostility (6.41 for SVORI respondents, 6.69 for non-SVORI respondents) and psychoticism (6.58 for SVORI respondents, 6.89 for non-SVORI respondents).
Measure SVORI Non-SVORI Anxiety scale 7.42 7.67 Depression scale 8.31 8.45 Hostility scale* 6.41 6.69 Interpersonal sensitivity scale 7.50 7.60 Obsessive-compulsive scale 8.12 8.17 Paranoid ideation scale 8.84 8.85 Phobic anxiety scale 6.42 6.56 Psychoticism scale* 6.58 6.89 Somatization scale 7.05 7.16 *p < 0.05 for test of significant difference between SVORI and non-SVORI.
As reported previously, more than half of SVORI and non-SVORI respondents had received treatment for a substance use or mental health problem at some point during their lifetime (56% and 55% of SVORI and non-SVORI, respectively). Of those who reported that they had ever received mental health treatment, depression was cited as the most common reason for the treatment. About 20% of each group reported that they had received care for depression or dysthymia (19% SVORI and 20% non-SVORI). Ten percent or more reported that they had received treatment for attention deficit hyperactivity disorder (12% of SVORI respondents and 13% of non-SVORI
Non-SVORI respondents were significantly more likely than SVORI respondents to indicate symptoms of hostility and psychoticism.
Exhibit 22. Average scores on Brief Symptom Inventory subscales, by group
Depression was cited as the most common reason for the treatment.

Prisoner reentry experiences of adult males
50
respondents) or bipolar disorder (10% SVORI and 12% non-SVORI). Less than 10% reported that they were currently receiving treatment for any mental health problem. Of those who reported that they were currently receiving treatment, the most common diagnoses were depression or dysthymia (6% and 10%, SVORI and non-SVORI, respectively) and bipolar disorder (5% and 6%, SVORI and non-SVORI, respectively).
Most respondents described their mental health status at the time of the pre-release interview as excellent or very good (52% SVORI and 49% non-SVORI). During their current period of incarceration, 13% of SVORI respondents were prescribed medication for emotional problems, and 22% felt they needed treatment for mental health problems. The non-SVORI respondents were significantly more likely to have been prescribed medication for a mental or emotional problem while incarcerated (19%) and to feel in need of treatment for mental health problems (29%).
EMPLOYMENT HISTORY AND FINANCIAL SUPPORT This subsection covers the respondents’ employment history prior to incarceration and describes additional sources of financial support.
Employment History
As shown in Exhibit 23, most subjects reported having worked at some time prior to incarceration—89% of SVORI versus 92% of non-SVORI—and about two thirds of both groups reported having a job during the 6 months prior to incarceration (64% and 68%, SVORI and non-SVORI, respectively). Although these differences are statistically significant (at 0.05 levels), they are relatively small in magnitude.
Some variation in the percentage of respondents who had worked during the 6 months prior to entering prison was evident across the 12 sites (Exhibit 24). More than 70% of SVORI respondents in Iowa, Maine, and South Carolina reported working during the 6 months prior to their incarceration. In contrast, only about 40% of all respondents in Washington reported working immediately prior to incarceration. Differences between SVORI and non-SVORI respondents were not statistically significant at the 0.05 level in any state.
Most respondents described their mental health status at the time of the pre-release interview as excellent or very good.
Most subjects reported having worked at some time prior to incarceration.

Respondent Characteristics
51
64
89
68
92
0%
20%
40%
60%
80%
100%
Ever held job* Held job in 6 months beforeprison*
SVORINon-SVORI
*p < 0.05 for test of significant difference between SVORI and non-SVORI.
38
72
63
57
47
6467
56
74
48
67
72
44
73
63
71
6668
72
57
7067
8182
0%
20%
40%
60%
80%
100%
IA IN KS ME MD MO NV OH OK PA SC WA
SVORINon-SVORI
Note: Within-site differences between SVORI and non-SVORI are not significant at the 0.05 level.
For those who worked during the 6 months prior to incarceration, about three quarters of respondents described their most recent job as a permanent job (75% SVORI and 73% non-SVORI) for which they received formal pay (Exhibit 25).
Exhibit 23. Employment prior to incarceration, by group
Exhibit 24. Employment during the 6 months prior to incarceration, by site and group

Prisoner reentry experiences of adult males
52
93
7475
94
7273
0%
20%
40%
60%
80%
100%
Held a permanentjob
Worked for formalpay
Worked more than20 hrs/wk
SVORINon-SVORI
Note: Differences between SVORI and non-SVORI are not significant at the 0.05 level.
a Among respondents who worked during the 6 months prior to incarceration.
Almost all who worked reported that they had worked more than 20 hours a week, working an average of about 42 hours (41.7 hours per week for SVORI respondents and 41.8 hours per week for non-SVORI respondents). The SVORI respondents reported a slightly higher average hourly rate of $10.91 compared with the average $10.13 reported by the non-SVORI respondents.
Although the majority described their most recent job as a permanent job, many of the respondents who had worked reported having had more than one job during the 6 months prior to incarceration. More than one third of the sample (35% SVORI, 36% non-SVORI) reported having had two or more jobs during the 6 months prior to incarceration. Furthermore, well over one third (35% SVORI, 38% non-SVORI) reported that they worked at the job for 3 months or less. When asked about the longest they had ever worked at one job since they were 18, most respondents reported less than 2 years (61% SVORI, 62% non-SVORI).
The jobs that respondents typically held were blue-collar jobs. More than one third of the respondents in both groups who had been employed during the 6 months prior to incarceration
Exhibit 25. Characteristics of respondents’ jobs prior to incarceration, by groupa
When asked about the longest they had ever worked at one job since they were 18, most respondents reported less than 2 years.

Respondent Characteristics
53
reported that the last job they had was as a laborer, which includes construction workers, day laborers, landscapers, and roofers (35% SVORI, 36% non-SVORI). About one fifth of respondents (22% of each group) had worked in the service industry as cooks, waiters, janitors, cashiers, and dishwashers. Many respondents also reported working as skilled craftsmen (15% SVORI, 17% non-SVORI) or equipment operators (16% SVORI, 13% non-SVORI). Few respondents reported having professional or technical occupations or jobs as managers or administrators (4% of each group).
Financial Support
The respondents were asked how they had supported themselves, in addition to legal employment, during the 6 months prior to incarceration. Nearly half of the respondents reported supporting themselves with income from illegal activities (46% and 43% of SVORI and non-SVORI, respectively). Another one third received support from family (32% of both groups). Fewer reported receiving financial help from friends (17% of SVORI respondents, 14% of non-SVORI respondents) or the government (11% of SVORI respondents, 10% of non-SVORI respondents).
Exhibit 26 shows the sources of financial support for SVORI and non-SVORI respondents, disaggregated by their employment status during the 6 months prior to incarceration. As shown in the exhibit, within employment status there were relatively few differences between SVORI and non-SVORI respondents with respect to whether they reported receiving financial support from each of the four sources.
The most substantial difference between the reports of those working and not working was in reports of support from illegal activities. More than 60% of those who were not employed during the 6 months prior to incarceration reported financial support from illegal activities, compared with less than 40% of those who reported working during that period. For both SVORI and non-SVORI respondents, those who held a job prior to incarceration were somewhat less likely than those who had no job to receive financial support from friends, the government, or other sources.
Nearly half of the respondents reported supporting themselves with income from illegal activities during the 6 months prior to incarceration.

Prisoner reentry experiences of adult males
54
Exhibit 26. Sources of income during the 6 months prior to incarceration, by employment status and group
3
35
8
14
31
6
34
8
12
31
14
63
16
20
34
19
63
14
18
32
0%
20%
40%
60%
80%
100%
Family Friends Government Illegal Other*
Held job (SVORI)Held job (Non-SVORI)No job (SVORI)No job (Non-SVORI)
*p < 0.05 for test of significant difference between SVORI (Held Job) and non-SVORI (Held Job).
CRIMINAL HISTORY, VIOLENCE, VICTIMIZATION, AND GANG INVOLVEMENT This subsection describes respondents’ involvement with the criminal and juvenile justice systems prior to incarceration and outlines preincarceration perpetration of violence and victimization. Respondents’ reports of gang involvement are also briefly described.
Criminal History
SVORI and non-SVORI respondents reported considerable involvement with the criminal justice system prior to their current incarceration (Exhibit 27). On average, the respondents were 16 years old at the time of their first arrest and had been arrested more than 12 times. In addition to their current term of incarceration, most respondents had served a previous prison term, with the non-SVORI group being significantly more likely to report a prior prison term (83% of SVORI, 87% of non-SVORI). Also, the non-SVORI respondents reported significantly more incarcerations, on average, than the SVORI group (1.20 for SVORI, 1.47 for non-SVORI).
Respondents reported considerable involvement with the criminal justice system prior to their current incarceration.
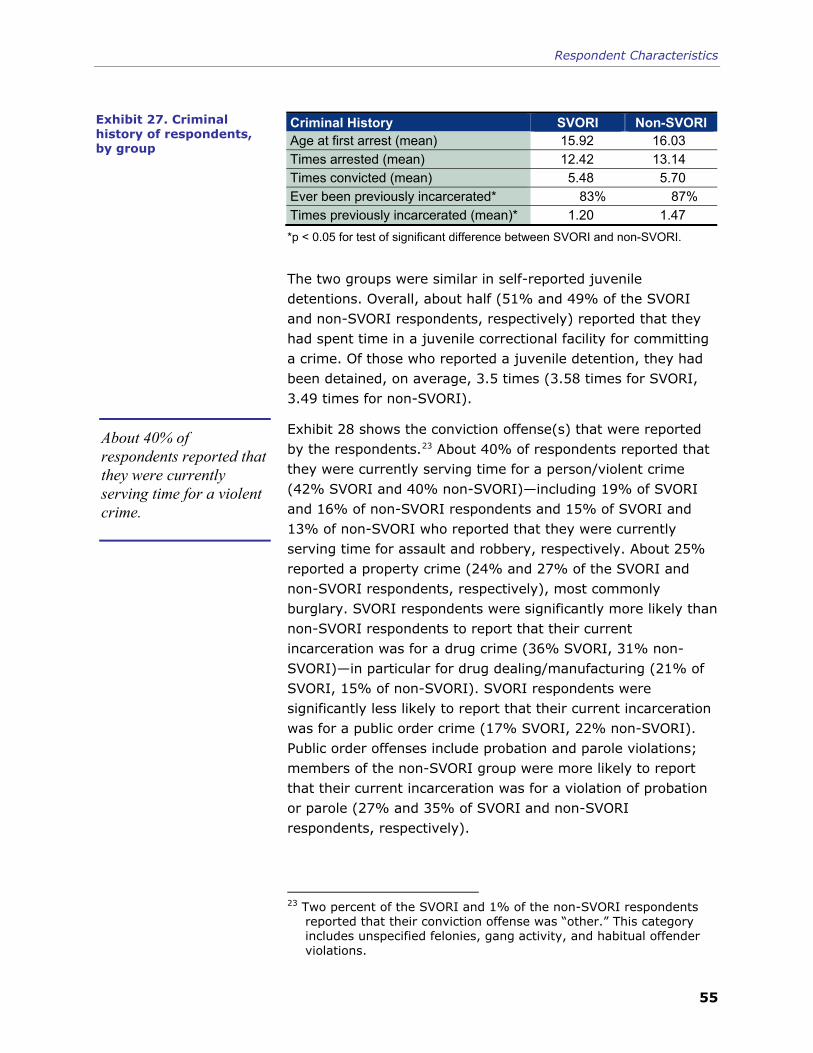
Respondent Characteristics
55
Criminal History SVORI Non-SVORI Age at first arrest (mean) 15.92 16.03 Times arrested (mean) 12.42 13.14 Times convicted (mean) 5.48 5.70 Ever been previously incarcerated* 83% 87% Times previously incarcerated (mean)* 1.20 1.47 *p < 0.05 for test of significant difference between SVORI and non-SVORI.
The two groups were similar in self-reported juvenile detentions. Overall, about half (51% and 49% of the SVORI and non-SVORI respondents, respectively) reported that they had spent time in a juvenile correctional facility for committing a crime. Of those who reported a juvenile detention, they had been detained, on average, 3.5 times (3.58 times for SVORI, 3.49 times for non-SVORI).
Exhibit 28 shows the conviction offense(s) that were reported by the respondents.23 About 40% of respondents reported that they were currently serving time for a person/violent crime (42% SVORI and 40% non-SVORI)—including 19% of SVORI and 16% of non-SVORI respondents and 15% of SVORI and 13% of non-SVORI who reported that they were currently serving time for assault and robbery, respectively. About 25% reported a property crime (24% and 27% of the SVORI and non-SVORI respondents, respectively), most commonly burglary. SVORI respondents were significantly more likely than non-SVORI respondents to report that their current incarceration was for a drug crime (36% SVORI, 31% non-SVORI)—in particular for drug dealing/manufacturing (21% of SVORI, 15% of non-SVORI). SVORI respondents were significantly less likely to report that their current incarceration was for a public order crime (17% SVORI, 22% non-SVORI). Public order offenses include probation and parole violations; members of the non-SVORI group were more likely to report that their current incarceration was for a violation of probation or parole (27% and 35% of SVORI and non-SVORI respondents, respectively).
23 Two percent of the SVORI and 1% of the non-SVORI respondents
reported that their conviction offense was “other.” This category includes unspecified felonies, gang activity, and habitual offender violations.
Exhibit 27. Criminal history of respondents, by group
About 40% of respondents reported that they were currently serving time for a violent crime.

Prisoner reentry experiences of adult males
56
17
36
24
42
22
31
27
40
0% 20% 40% 60% 80% 100%
Public order*
Drug*
Property
Person/Violent
Non-SVORISVORI
*p < 0.05 for test of significant difference between SVORI and non-SVORI.
Perpetration of Violence
During the 6 months prior to incarceration, more than two thirds of both SVORI and non-SVORI respondents (69% and 67%, respectively) reported violent behavior (including threats of violence).
Victimization
Most respondents also reported being victims of violence. More than half of the respondents (59% SVORI and 58% non-SVORI) reported being victimized either through threats or use of violence during the 6 months prior to incarceration.
Gang Membership
Very few respondents in both groups (5% of SVORI and 6% of non-SVORI) reported being a member of a gang. Of the small number of respondents in a gang, about half (53% of SVORI, 52% of non-SVORI) considered their gang to be family and about half reported that they had relatives who were members of the gang (55% SVORI, 58% non-SVORI).
IN-PRISON EXPERIENCES This subsection describes respondents’ in-prison experiences on several dimensions, including sentence length, disciplinary infractions, and in-prison victimization. This is followed by a
Exhibit 28. Conviction offenses for current incarceration, by group
More than two thirds of respondents reported violent behavior prior to incarceration.
Most also reported being victims of violence.
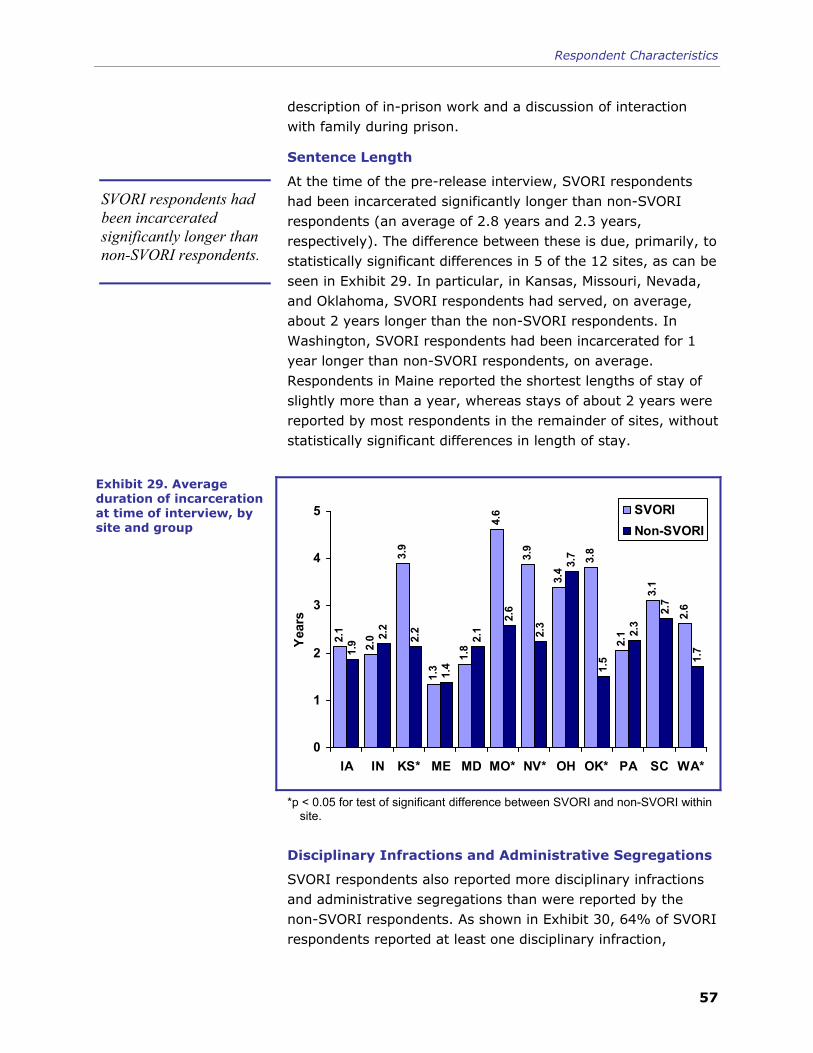
Respondent Characteristics
57
description of in-prison work and a discussion of interaction with family during prison.
Sentence Length
At the time of the pre-release interview, SVORI respondents had been incarcerated significantly longer than non-SVORI respondents (an average of 2.8 years and 2.3 years, respectively). The difference between these is due, primarily, to statistically significant differences in 5 of the 12 sites, as can be seen in Exhibit 29. In particular, in Kansas, Missouri, Nevada, and Oklahoma, SVORI respondents had served, on average, about 2 years longer than the non-SVORI respondents. In Washington, SVORI respondents had been incarcerated for 1 year longer than non-SVORI respondents, on average. Respondents in Maine reported the shortest lengths of stay of slightly more than a year, whereas stays of about 2 years were reported by most respondents in the remainder of sites, without statistically significant differences in length of stay.
2.1
2.0
3.9
1.3
1.8
4.6
3.9
3.4
3.8
2.1
3.1
2.6
1.9 2.
2
2.2
1.4
2.1
2.6
2.3
3.7
1.5
2.3
2.7
1.7
0
1
2
3
4
5
IA IN KS* ME MD MO* NV* OH OK* PA SC WA*
Year
s
SVORINon-SVORI
*p < 0.05 for test of significant difference between SVORI and non-SVORI within site.
Disciplinary Infractions and Administrative Segregations
SVORI respondents also reported more disciplinary infractions and administrative segregations than were reported by the non-SVORI respondents. As shown in Exhibit 30, 64% of SVORI respondents reported at least one disciplinary infraction,
SVORI respondents had been incarcerated significantly longer than non-SVORI respondents.
Exhibit 29. Average duration of incarceration at time of interview, by site and group

Prisoner reentry experiences of adult males
58
Infractions and Segregations SVORI Non-SVORI Disciplinary Infractions
None 35% 43% One 17% 17% More than one 47% 40%
Administrative Segregations None 55% 60% One 19% 18% More than one 26% 22%
*p < 0.05 for test of significant difference between SVORI and non-SVORI.
compared with 57% of non-SVORI respondents. Less than half reported administrative segregation during the current term of incarceration (45% of SVORI and 40% of non-SVORI). These differences between groups are statistically significant but may simply reflect the longer lengths of stay reported by the SVORI respondents.24
In-prison Victimization
Reported in-prison victimization was similar for the two groups. Slightly more than half of all respondents (55% and 54% of SVORI and non-SVORI respondents, respectively) reported being victimized during the current incarceration—somewhat fewer than reported being victimized during the 6 months prior to incarceration (59% SVORI and 58% non-SVORI). This measure includes both threat of violence (including someone threatening to hit the respondent with a fist or anything else that could hurt him or someone threatening to use a weapon on him) and perpetration of violence (including someone throwing anything at the respondent; pushing, grabbing, shoving, slapping, kicking, biting, hitting with a fist, or using a weapon on him; or the respondent needing medical attention for violent acts directed at him). The reported severity of victimization was low. On a 36-point victimization scale, SVORI and non-SVORI respondents scored an average of 2.7 and 2.9, respectively.25 This victimization severity was somewhat lower than was
24 Longer lengths of stay expose subjects to greater opportunity to
commit infractions and receive administrative segregation; in other words, the period at risk is longer.
25 Responses to six victimization items were coded 0 though 6, with higher values indicating more frequent victimization. (Response options ranged from “never” to “daily.”) The six items were summed to create the in-prison victimization scale.
Exhibit 30. Disciplinary infractions and administrative segregations during current incarceration, by group
Slightly more than half of all respondents reported being victimized during the current incarceration.

Respondent Characteristics
59
reported for the 6 months prior to incarceration (3.85 SVORI, 3.75 non-SVORI).
In-prison Work
Nearly two thirds of the respondents (63% of SVORI and 61% of non-SVORI) said that they had a job in the institution where they were incarcerated. On average, respondents with prison jobs spent about 23 hours per week working (23.8 and 22.3 hours for SVORI and non-SVORI respondents, respectively). Most of the jobs were prison service as opposed to prison industry jobs. About 60% reported having a prison service job (60% of SVORI, 57% of non-SVORI), but only 4% of both groups reported having a prison industry job. As can be seen in Exhibit 31, respondents in South Carolina and Pennsylvania were most likely to report working while in prison, and those in Nevada were the least likely. A significant difference between SVORI and non-SVORI respondents was observed only for Indiana (56% and 29%, respectively).
48
90
81
62
66
23
69
65
71
52
5654
40
8382
69
58
30
52
69
75
44
29
64
0%
20%
40%
60%
80%
100%
IA IN* KS ME MD MO NV OH OK PA SC WA
SVORINon-SVORI
*p < 0.05 for test of significant difference between SVORI and non-SVORI.
Very few respondents reported having a work-release job. Only 3% of SVORI and 4% of non-SVORI respondents reported that they were on work release. Those with work-release jobs reported working more hours than those with institution jobs. SVORI respondents reported working significantly more hours than non-SVORI respondents (40 and 31 hours, respectively).
Nearly two thirds of the respondents said that they had a job in the institution where they were incarcerated.
Exhibit 31. Institutional employment, by site and group
Very few respondents reported having a work-release job.

Prisoner reentry experiences of adult males
60
As shown in Exhibit 32, only in Pennsylvania did more than 10% of the respondents participate in work release.26 For the remaining states, less than 10% (and usually many fewer) reported having a work-release job.
3
0
16
22
0
3
56
4
8
2
29
2
0
2
6
2
5
00%
5%
10%
15%
20%
25%
30%
35%
IA* ME MD MO NV OH OK PA SC WA
SVORINon-SVORI
Note: Values for IN and KS were 0%. *p < 0.05 for test of significant difference between SVORI and non-SVORI within
site.
Family
Most respondents (97% of both groups) indicated that they had people in their lives that they considered to be family and that these family members served as an important source of emotional support. A scale was created to represent the degree of family emotional support that respondents felt at the time of the pre-release interview. Respondents were asked the degree to which they agreed with 10 statements about their relationships with their family, such as “I have someone in my family who understands my problems” and “I have someone in my family to love me and make me feel wanted.”27 The items were combined to create a scale with possible values ranging
26 Most respondents in Pennsylvania were interviewed at a community
corrections center, where work-release jobs were common. 27 Response categories were “strongly agree,” “agree,” “disagree,” and
“strongly disagree.” Values of 0 through 3 were assigned to response categories, with higher values representing greater family emotional support. The values for each of the 10 items were summed to create the family emotional support scale.
Exhibit 32. Work-release participation, by site and group
Most respondents indicated that family members served as an important source of emotional support during incarceration.

Respondent Characteristics
61
from 0 to 30 and higher scores indicating higher levels of family emotional support. There were no significant differences between SVORI respondents and non-SVORI respondents on this measure (21.63 for SVORI, 21.35 for non-SVORI).
Respondents were also asked about the frequency of contact with family members and friends. Response options for each type of contact ranged from “never” to “daily.” SVORI and non-SVORI respondents reported similar frequencies of contact with their family members through phone calls or mail (Exhibit 33). About 40% of both groups reported weekly phone or mail contact with family members. Both SVORI and non-SVORI respondents reported less frequent phone and mail contact with friends than with family. In-prison visits with family members were less frequent than phone calls and mail. However, on average, SVORI respondents received more visits from family and non-family members than the comparison group.
Exhibit 33. Frequency of in-prison contact with family members and friends, by group
Form of Contact Contact with
Family Members
Contact with Friends SVORI Non-SVORI SVORI Non-SVORI Phone Contact Never 16% 18% 47% 52% A few times 15% 14% 16% 13% Monthly 16% 16% 13% 11% Weekly 38% 36% 16% 15% Daily 14% 16% 8% 9% Mail Contact Never 10% 9% 30% 36% A few times 17% 18% 19% 17% Monthly 23% 21% 16% 16% Weekly 41% 41% 30% 25% Daily 9% 10% 6% 6% In-Person Visits Never 35%* 43%* 64% 71% A few times 23% 21% 16% 13% Monthly 17% 18% 8% 6% Weekly 21% 17% 10% 8% Daily 3% 2% 2% 1%
*p < 0.05 for test of significant difference between SVORI and non-SVORI.
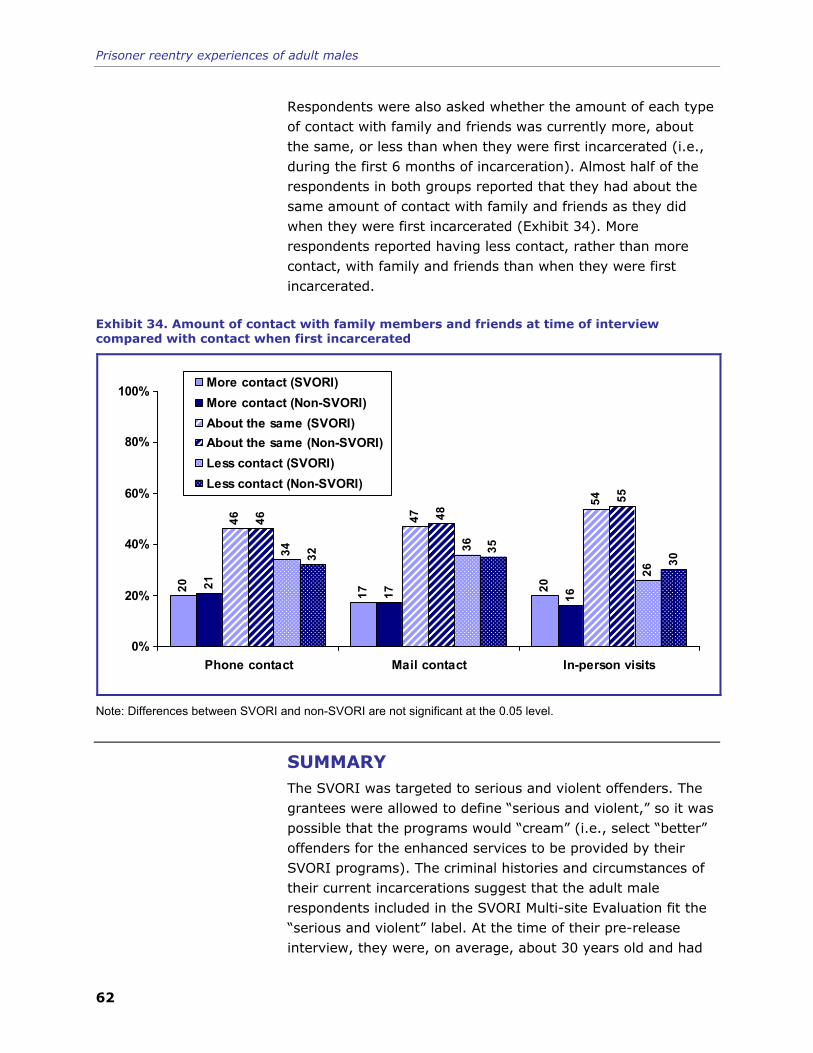
Prisoner reentry experiences of adult males
62
Respondents were also asked whether the amount of each type of contact with family and friends was currently more, about the same, or less than when they were first incarcerated (i.e., during the first 6 months of incarceration). Almost half of the respondents in both groups reported that they had about the same amount of contact with family and friends as they did when they were first incarcerated (Exhibit 34). More respondents reported having less contact, rather than more contact, with family and friends than when they were first incarcerated.
Exhibit 34. Amount of contact with family members and friends at time of interview compared with contact when first incarcerated
201720
1617
21
54
4746
55
4846
26
3634
30
3532
0%
20%
40%
60%
80%
100%
Phone contact Mail contact In-person visits
More contact (SVORI)More contact (Non-SVORI)About the same (SVORI)About the same (Non-SVORI)Less contact (SVORI)Less contact (Non-SVORI)
Note: Differences between SVORI and non-SVORI are not significant at the 0.05 level.
SUMMARY The SVORI was targeted to serious and violent offenders. The grantees were allowed to define “serious and violent,” so it was possible that the programs would “cream” (i.e., select “better” offenders for the enhanced services to be provided by their SVORI programs). The criminal histories and circumstances of their current incarcerations suggest that the adult male respondents included in the SVORI Multi-site Evaluation fit the “serious and violent” label. At the time of their pre-release interview, they were, on average, about 30 years old and had
Respondent Characteristics
63
been in prison more than 2 years. More than 40% were serving time for a violent/person offense, most commonly assault and robbery. Other common offenses included drug dealing/manufacturing and drug possession. Nearly all had a history of alcohol and drug use and nearly two thirds reported using drugs in the 30 days prior to their current incarceration. They reported substantial arrest histories (an average of more than 12 arrests) and conviction histories (an average of more than 6). Most also reported having family members and peers who had crime and substance use involvement.
Consistent with profiles of prisoners found in the literature, the respondents had low levels of educational attainment and unstable employment histories. Most had worked at some point, but only about two thirds reported working in the 6 months prior to their incarceration. Although about 60% said they had supported themselves with a job, many reported that they also relied on illegal activities and family for support prior to their incarceration.
These characteristics suggest that these individuals had high levels of need that could be addressed with programs and services to facilitate their transitions back to their communities at release—a topic that is addressed in the following chapter.

65
SSeellff--rreeppoorrtteedd SSeerrvviiccee NNeeeeddss
SVORI programs were to identify individual service needs and provide services and programming to respond to those needs. This chapter focuses on self-reported service needs. In each interview, respondents were asked about the extent to which they needed each of 28 specific services.28 For ease of presentation and interpretation, the individual services were grouped into five service categories or “bundles.” The bundles are
transition services (10 items: need legal assistance, financial assistance, public financial assistance, public health care insurance, mentoring, documents for employment, place to live, transportation, drivers license, clothes/food bank);
health care services (5 items: need medical treatment, mental health treatment, substance abuse treatment, group for abuse victims, anger management services);
employment, education, and skills services (6 items: job, more education, money management skills, life skills, work on personal relationships, change attitudes on criminal behavior);
domestic violence-related services (2 items: need batterer intervention program, need domestic violence support group); and
child-related services (5 items: need child support payments, modifications in child support debt, modifications in custody, parenting skills, child care).
28 Response options were “a lot,” “a little,” or “not at all.” Responses
were recoded to “some” and “not at all.”

Prisoner reentry experiences of adult males
66
The service need bundle scores were developed from the interview data to summarize respondents’ needs in the domains of transition, health, employment/education/skills, domestic violence, and child services (which was calculated only for respondents with children). Scores for each individual were generated by summing one/zero indicators for whether the individual reported or did not report needing each of the items within a bundle; this sum was then divided by the number of items in the bundle. At the individual respondent level, this bundle score can be interpreted as the proportion of the services in the bundle that the individual reported needing (Winterfield et al., 2006).29
The pre-release data suggested high levels of expressed need as can be seen in Exhibit 35. The levels of expressed need for employment, education, and skills were very high—on average, respondents reported needing nearly three quarters of all of the service items in the employment bundle (average bundle scores of 75 for SVORI and 74 for non-SVORI). Respondents also expressed a high level of need for the services and assistance contained in the transition services bundle. On average, respondents reported needing nearly two thirds of these services, which include financial assistance, transportation, and obtaining a driver’s license and other documentation (average scores of 64 for SVORI and 62 for non-SVORI).
SVORI and non-SVORI respondents were similar on most measures and reported high need across the spectrum of services (see Exhibit A-3 in Appendix A). Specifically, as shown in Exhibit 36, most SVORI respondents reported needing more education (94%), financial assistance (86%), a driver’s license (83%), job training (82%), and a job (80%). About three quarters (75%) also reported needing public health care insurance and life skills training. Of these services, non-SVORI respondents were significantly less likely than SVORI respondents to report needing financial assistance or job training—perhaps because SVORI participants had an increased awareness of need as a result of needs assessments conducted in conjunction with their SVORI program participation.
29 Although not presented in this report, program-level bundle scores
of service delivery were also developed from reports provided by SVORI program directors. These bundle scores are discussed in Winterfield et al. (2006).
SVORI service bundle scores were developed to summarize service needs and service receipt by summing indicators of needs and receipt in multiple domain areas.
SVORI and non-SVORI reported high need across the spectrum of services.

Self-reported Service Needs
67
8
34
48
62
74
7
31
46
64
75
0 20 40 60 80 100
Domestic violence services
Health services*
Child servicesa
Transitional services
Employment/education/life skills services
SVORINon-SVORI
a
a Among those who reported having minor children. *p < 0.05 for test of significant difference between SVORI and non-SVORI.
*p < 0.05 for test of significant difference between SVORI and non-SVORI.
When asked to identify their top two service needs, more than one third of respondents mentioned needing a job after release (38% SVORI, 36% non-SVORI). About one quarter (24% SVORI, 25% non-SVORI) listed needing a driver’s license as one of their top two needs. The next four needs mentioned by the most respondents as one of their top two included more education (18% of both groups), job training (17% SVORI, 14% non-SVORI), financial assistance (15% SVORI, 16% non-
Exhibit 35. Pre-release service need bundle scores across service bundles, by group
Exhibit 36. Most commonly reported service needs pre-release, by group
73
73
76
76
81
82
92
75
75
80
82
83
86
94
0% 25% 50% 75% 100%
Life skills
Public health care insurance
Job
Job training*
Driver’s license
Financial assistance*
Education
SVORINon-SVORI

Prisoner reentry experiences of adult males
68
SVORI), and a place to live when released (15% SVORI, 16% non-SVORI).
In addition to the domain-specific service bundles, an “all services” bundle was also created to capture the level of overall need across all services (individual items are in Exhibit A-3 in Appendix A).30 On average, the respondents reported needing more than half of all the service items (average score of 54 for both SVORI and non-SVORI).
The findings on self-reported service needs are discussed for each of the five bundles over the four interview waves in the remainder of this chapter. Needs are first presented and discussed at the service bundle level. More detailed information for each bundle and the individual services contained therein are then presented.
The findings presented in the remainder of this chapter were generated using SAS procedures that allow use of the propensity scores to weight the observations (as described earlier). The mean values were generated using Proc Survey Means. Tests of significance of differences between SVORI and non-SVORI were conducted using Proc Survey Logistic or Regression to regress the SVORI indicator on each of the service need scores and assessing whether the resulting parameter estimate was significantly different from zero.
WEIGHTED SERVICE NEED BUNDLE SCORES ACROSS WAVES 1 THROUGH 4 Four waves of interviews were conducted:
Wave 1: 30 days prior to respondent’s release
Wave 2: 3 months following respondent’s release
Wave 3: 9 months following respondent’s release
Wave 4: 15 months following respondent’s release
Respondents were asked about their need for services at each wave. Exhibit 37 summarizes information on average reported service needs for each group across the four waves of interview data. As noted previously, the averages were generated using
30 The number of items varied, depending on whether the individual
had children (59% of SVORI and 61% of non-SVORI respondents reported having children under the age of 18; 62% and 64% reported having any children).
Respondents reported needing more than half of all the service items.
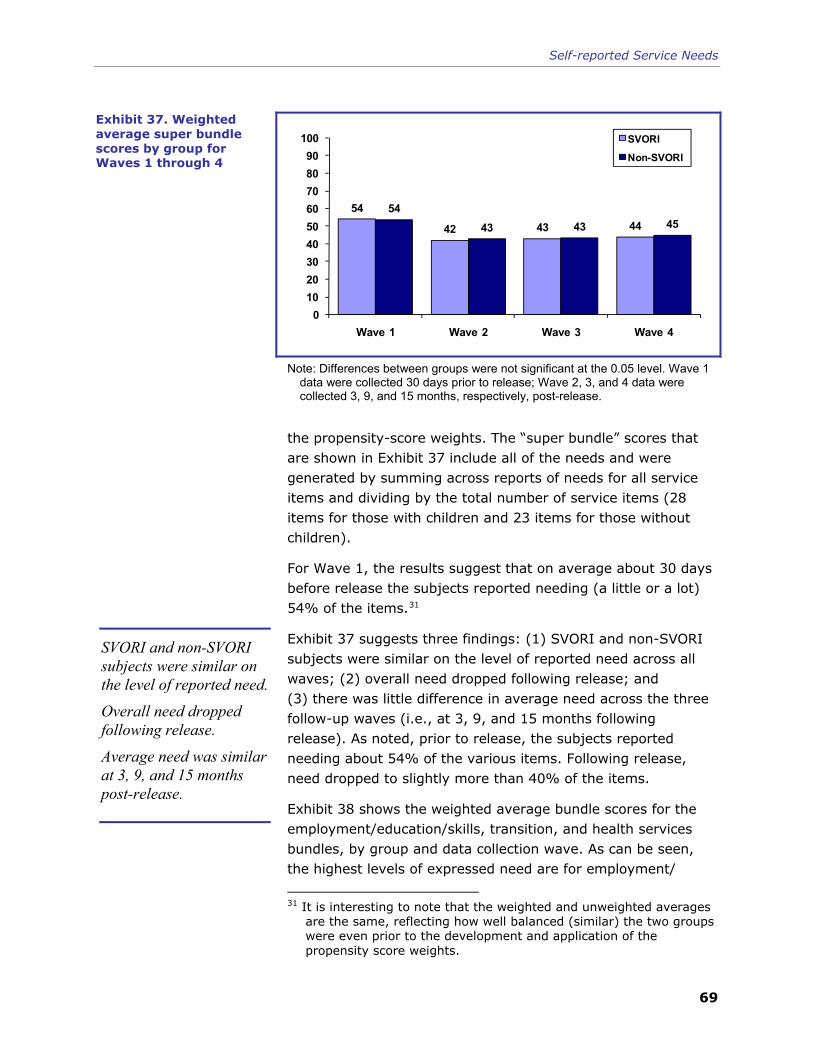
Self-reported Service Needs
69
54
42 43 4454
43 43 45
0102030405060708090
100
Wave 1 Wave 2 Wave 3 Wave 4
SVORI
Non-SVORI
Note: Differences between groups were not significant at the 0.05 level. Wave 1 data were collected 30 days prior to release; Wave 2, 3, and 4 data were collected 3, 9, and 15 months, respectively, post-release.
the propensity-score weights. The “super bundle” scores that are shown in Exhibit 37 include all of the needs and were generated by summing across reports of needs for all service items and dividing by the total number of service items (28 items for those with children and 23 items for those without children).
For Wave 1, the results suggest that on average about 30 days before release the subjects reported needing (a little or a lot) 54% of the items.31
Exhibit 37 suggests three findings: (1) SVORI and non-SVORI subjects were similar on the level of reported need across all waves; (2) overall need dropped following release; and (3) there was little difference in average need across the three follow-up waves (i.e., at 3, 9, and 15 months following release). As noted, prior to release, the subjects reported needing about 54% of the various items. Following release, need dropped to slightly more than 40% of the items.
Exhibit 38 shows the weighted average bundle scores for the employment/education/skills, transition, and health services bundles, by group and data collection wave. As can be seen, the highest levels of expressed need are for employment/
31 It is interesting to note that the weighted and unweighted averages
are the same, reflecting how well balanced (similar) the two groups were even prior to the development and application of the propensity score weights.
Exhibit 37. Weighted average super bundle scores by group for Waves 1 through 4
SVORI and non-SVORI subjects were similar on the level of reported need.
Overall need dropped following release.
Average need was similar at 3, 9, and 15 months post-release.

Prisoner reentry experiences of adult males
70
Exhibit 38. Weighted average service bundle scores by type (Employment/Education/Skills, Transition Services, Health Services), group (SVORI, non-SVORI), and wave (1, 2, 3, 4)
28
26
24
32
49
49
49
64
64
62
60
74
29
27
25
34
50
49
50
62
63
63
60
74
0 10 20 30 40 50 60 70 80 90 100
Health services bundle-4
Health services bundle-3
Health services bundle-2
Health services bundle-1
Transition services bundle-4
Transition services bundle-3
Transition services bundle-2
Transition services bundle-1
Employment/education/skills bundle-4
Employment/education/skills bundle-3
Employment/educationskills bundle-2
Employment/educationskills bundle-1
Bundle Score
SVORI
Non-SVORI
education/skills programming and services. On average, prior to release, SVORI and non-SVORI respondents reported needing nearly three quarters (74%) of the seven services included in this bundle. At the subsequent three time points, the level of expressed needs remains very high compared to the other bundles—in particular, at 15 months, respondents are still reporting needing nearly two thirds (about 63%) of these services. Finally, these relatively young men (average age of about 29 at release) expressed lower levels of need for the five health-related services, reporting on average a need for about one third of the five types of services included in this bundle prior to release and about one quarter post-release. For each of these three bundles, the pattern is similar to that observed in Exhibit 37 for the super bundle scores—higher levels of need expressed prior to release than observed at 3 months post-release, with reports remaining level in subsequent follow-up periods. It is interesting to note for health care services that although the differences are small, there appears to be an upward trend post-release.

Self-reported Service Needs
71
Exhibit 39 presents similar data for the remaining two needs bundles—child services and domestic violence services. As can be seen, the levels of expressed need for help with child-related issues among those with children is fairly high, with respondents suggesting the need for two or more of the five services prior to release. Although there is a decline in reported need post-release, this decline is smaller than for the other bundles. Few of the men reported needing help with domestic violence—either through domestic violence support groups or batterer intervention programs.
6
3
4
8
41
41
39
48
4
3
4
7
40
38
39
46
0 20 40 60 80 100
Domestic violence-4
Domestic violence-3
Domestic violence-2
Domestic violence-1
Child services-4
Child services-3
Child services-2
Child services-1
Bundle Score
SVORI
Non-SVORI
The following sections examine the patterns for the specific items in each of these service bundles.
EMPLOYMENT/EDUCATION/SKILLS SERVICES The service area for which the men consistently reported the greatest need was employment, education, and skills-related services (E/E/S). On average, as was seen in Exhibit 38, the men reported needing more than 60% of these six items throughout and there were no differences between the two groups.
Exhibit 39. Weighted average super bundle scores by type (Child Services, Domestic Violence, group (SVORI, non-SVORI), and wave (1, 2, 3, 4)

Prisoner reentry experiences of adult males
72
Exhibit 40 shows the weighted means for the bundle scores and individual items by group and wave. Included are the weighted means and the parameter estimate from the Proc Survey Regression (bundle scores) or Logistic (individual items), the test statistic (t-statistic for the regression models and Wald chi-square for the logistic regression models), and the associated p values; estimated odds ratios are also included for the individual items—indicating the odds of needing a specific item conditioned on SVORI status. As can be seen, none of the parameters was significant at the 0.05 level, indicating no differences in the expressed need for these services between the SVORI participants and the comparison subjects.
Exhibit 40 also includes entries for the percentage of subjects reporting at each wave to need ANY of the E/E/S services—virtually everyone indicated needing help in this domain—99% at Wave 1, about 95% at Waves 2 and 3, and more than 96% at Wave 4. Education was the area in which the greatest proportions of men indicated needing more. More than 90% said they needed additional education prior to release and between 80% and 90% stated the need for additional education post-release. A job followed education as the most frequently reported need. Majorities also indicated the need for programs to address money management and other life skills, as well as personal relationships. Overall, majorities reported a continuing need for these five services throughout the follow-up period.
Respondents were less likely over time to express the “need to change attitudes about criminal behavior.” Although about two thirds of subjects pre-release indicated a need to change their attitudes, this proportion diminished to 44% at 3 months following release and remained below 50% throughout the follow-up period.
TRANSITION SERVICES As shown in Exhibit 41, the men in the study also reported high levels of need for transition services, which included 10 forms of assistance with the reentry process. Self-reported need for these services was highest at the time of the pre-release interview (when the weighted bundle scores were 64 for the SVORI group and 62 for the non-SVORI group) and declined at the 3-month post-release interview to about 50 (where they remained for the following interview waves). As noted earlier, there was no

Self-reported Service Needs
73
Exhibit 40. Weighted means for employment/education/skills bundles and items, by group and wave
Variable S N
Non-SVORI
NS
Mean
Non-SVORIMean
Par. Est. SE
Test Stat. p Val. OR
Wave 1 Employ/Ed/Skills Score 863 834 74.40 73.60 0.80 1.25 0.64 0.52 NA
Need ANY E/E/S* 863 834 0.99 0.99 −0.52 0.49 1.12 0.29 0.60 Need job 862 834 0.79 0.77 −0.16 0.12 1.76 0.18 0.85 Need education 863 834 0.93 0.92 −0.15 0.19 0.65 0.42 0.86 Need money mgmt skills 863 833 0.71 0.68 −0.13 0.11 1.56 0.21 0.88 Need life skills 859 831 0.75 0.74 −0.04 0.11 0.12 0.73 0.96 Need work personal relationships
862 832 0.64 0.63 −0.05 0.10 0.26 0.61 0.95
Need change attitudes criminal behavior
860 833 0.65 0.69 0.16 0.11 2.41 0.12 1.18
Wave 2 Employ/Ed/Skills Score 529 455 59.73 60.04 −0.31 1.91 −0.16 0.87 NA
Need ANY E/E/S* 529 455 0.95 0.96 −0.34 0.32 1.17 0.28 0.71 Need job 527 455 0.61 0.63 0.06 0.13 0.19 0.67 1.06 Need education 529 455 0.85 0.85 0.06 0.18 0.13 0.72 1.07 Need money mgmt skills 529 455 0.54 0.57 0.12 0.13 0.77 0.38 1.12 Need life skills 529 455 0.60 0.58 −0.10 0.13 0.52 0.47 0.91 Need work personal relationships
529 455 0.54 0.53 −0.04 0.13 0.12 0.73 0.96
Need change attitudes criminal behavior
527 454 0.44 0.44 0.00 0.13 0.00 0.99 1.00
Wave 3 Employ/Ed/Skills Score 564 469 63.17 62.04 1.12 1.88 0.60 0.55 NA
Need ANY E/E/S* 564 469 0.95 0.95 −0.05 0.30 0.02 0.88 0.96 Need job 564 469 0.58 0.62 0.18 0.13 1.96 0.16 1.20 Need education 564 469 0.87 0.88 0.05 0.19 0.06 0.80 1.05 Need money mgmt skills 563 469 0.63 0.59 −0.15 0.13 1.41 0.23 0.86 Need life skills 562 468 0.66 0.64 −0.12 0.13 0.74 0.39 0.89 Need work personal relationships
563 469 0.58 0.56 −0.08 0.13 0.39 0.53 0.92
Need change attitudes criminal behavior
562 469 0.48 0.44 −0.16 0.13 1.66 0.20 0.85
Wave 4 Employ/Ed/Skills Score 582 531 63.15 64.16 −1.01 1.80 −0.56 0.57 NA
Need ANY E/E/S* 582 531 0.96 0.97 −0.42 0.34 1.52 0.22 0.66 Need job 582 531 0.59 0.62 0.15 0.13 1.48 0.22 1.16 Need education 582 530 0.88 0.89 0.10 0.19 0.25 0.62 1.10 Need money mgmt skills 582 530 0.62 0.62 0.02 0.13 0.03 0.85 1.02 Need life skills 581 530 0.64 0.68 0.19 0.13 2.26 0.13 1.21 Need work personal relationships
581 530 0.59 0.56 −0.15 0.12 1.42 0.23 0.86
Need change attitudes criminal behavior
580 531 0.48 0.48 0.02 0.12 0.03 0.87 1.02
Note: NA = Not applicable. E/E/S = employment/education/skills bundle. OR = odds ratio. Par. Est. = parameter estimate. p Val = probability value. S = SVORI. SE = standard error. Wave 1 = 30 days pre-release; Wave 2 = 3 months post-release; Wave 3 = 9 months post-release; Wave 4 = 15 months post-release.
*Included for information; not included in bundle calculations.
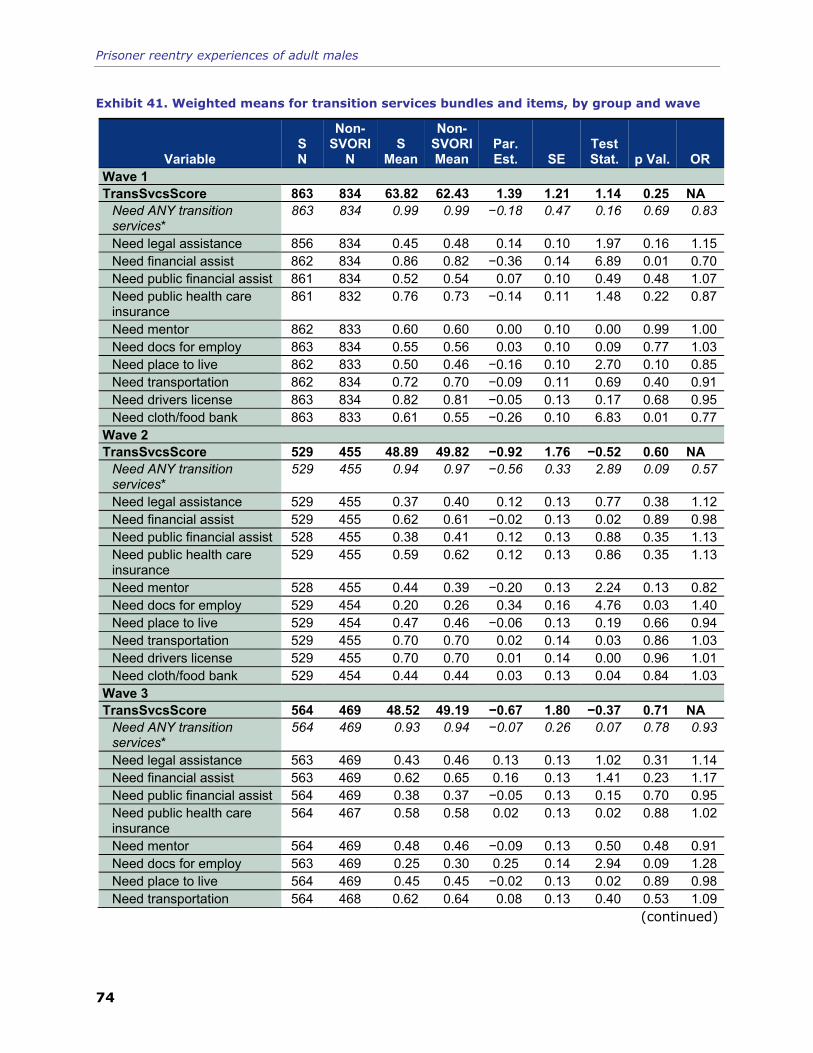
Prisoner reentry experiences of adult males
74
Exhibit 41. Weighted means for transition services bundles and items, by group and wave
Variable S N
Non-SVORI
N S
Mean
Non-SVORIMean
Par. Est. SE
Test Stat. p Val. OR
Wave 1 TransSvcsScore 863 834 63.82 62.43 1.39 1.21 1.14 0.25 NA
Need ANY transition services*
863 834 0.99 0.99 −0.18 0.47 0.16 0.69 0.83
Need legal assistance 856 834 0.45 0.48 0.14 0.10 1.97 0.16 1.15Need financial assist 862 834 0.86 0.82 −0.36 0.14 6.89 0.01 0.70Need public financial assist 861 834 0.52 0.54 0.07 0.10 0.49 0.48 1.07Need public health care insurance
861 832 0.76 0.73 −0.14 0.11 1.48 0.22 0.87
Need mentor 862 833 0.60 0.60 0.00 0.10 0.00 0.99 1.00Need docs for employ 863 834 0.55 0.56 0.03 0.10 0.09 0.77 1.03Need place to live 862 833 0.50 0.46 −0.16 0.10 2.70 0.10 0.85Need transportation 862 834 0.72 0.70 −0.09 0.11 0.69 0.40 0.91Need drivers license 863 834 0.82 0.81 −0.05 0.13 0.17 0.68 0.95Need cloth/food bank 863 833 0.61 0.55 −0.26 0.10 6.83 0.01 0.77
Wave 2 TransSvcsScore 529 455 48.89 49.82 −0.92 1.76 −0.52 0.60 NA
Need ANY transition services*
529 455 0.94 0.97 −0.56 0.33 2.89 0.09 0.57
Need legal assistance 529 455 0.37 0.40 0.12 0.13 0.77 0.38 1.12Need financial assist 529 455 0.62 0.61 −0.02 0.13 0.02 0.89 0.98Need public financial assist 528 455 0.38 0.41 0.12 0.13 0.88 0.35 1.13Need public health care insurance
529 455 0.59 0.62 0.12 0.13 0.86 0.35 1.13
Need mentor 528 455 0.44 0.39 −0.20 0.13 2.24 0.13 0.82Need docs for employ 529 454 0.20 0.26 0.34 0.16 4.76 0.03 1.40Need place to live 529 454 0.47 0.46 −0.06 0.13 0.19 0.66 0.94Need transportation 529 455 0.70 0.70 0.02 0.14 0.03 0.86 1.03Need drivers license 529 455 0.70 0.70 0.01 0.14 0.00 0.96 1.01Need cloth/food bank 529 454 0.44 0.44 0.03 0.13 0.04 0.84 1.03
Wave 3 TransSvcsScore 564 469 48.52 49.19 −0.67 1.80 −0.37 0.71 NA
Need ANY transition services*
564 469 0.93 0.94 −0.07 0.26 0.07 0.78 0.93
Need legal assistance 563 469 0.43 0.46 0.13 0.13 1.02 0.31 1.14Need financial assist 563 469 0.62 0.65 0.16 0.13 1.41 0.23 1.17Need public financial assist 564 469 0.38 0.37 −0.05 0.13 0.15 0.70 0.95Need public health care insurance
564 467 0.58 0.58 0.02 0.13 0.02 0.88 1.02
Need mentor 564 469 0.48 0.46 −0.09 0.13 0.50 0.48 0.91Need docs for employ 563 469 0.25 0.30 0.25 0.14 2.94 0.09 1.28Need place to live 564 469 0.45 0.45 −0.02 0.13 0.02 0.89 0.98Need transportation 564 468 0.62 0.64 0.08 0.13 0.40 0.53 1.09
(continued)

Self-reported Service Needs
75
Exhibit 41. Weighted means for transition services bundles and items, by group and wave (continued)
Variable S N
Non-SVORI
N S
Mean
Non-SVORIMean
Par. Est. SE
Test Stat. p Val. OR
Need drivers license 564 468 0.65 0.63 −0.07 0.13 0.30 0.58 0.93Need cloth/food bank 564 469 0.40 0.38 −0.07 0.13 0.27 0.61 0.94
Wave 4 TransSvcsScore 582 531 48.89 50.04 −1.15 1.80 −0.64 0.52 NA
Need ANY transition services*
582 531 0.94 0.92 0.32 0.24 1.84 0.17 1.38
Need legal assistance 582 528 0.46 0.46 0.03 0.12 0.05 0.82 1.03Need financial assist 582 529 0.64 0.64 0.02 0.13 0.02 0.89 1.02Need public financial assist 582 529 0.36 0.39 0.09 0.13 0.55 0.46 1.10Need public health care insurance
582 528 0.54 0.58 0.17 0.12 1.99 0.16 1.19
Need mentor 582 530 0.51 0.49 −0.10 0.12 0.71 0.40 0.90Need docs for employ 581 530 0.31 0.34 0.12 0.13 0.81 0.37 1.13Need place to live 581 531 0.45 0.45 0.01 0.12 0.00 0.97 1.01Need transportation 582 531 0.60 0.62 0.06 0.13 0.22 0.64 1.06Need drivers license 582 531 0.64 0.65 0.05 0.13 0.15 0.70 1.05Need cloth/food bank 582 531 0.37 0.40 0.11 0.13 0.72 0.40 1.11
Note: NA = Not applicable. OR = odds ratio. Par. Est. = parameter estimate. p Val. = probability value. S = SVORI. SE = standard error. Wave 1 = 30 days pre-release; Wave 2 = 3 months post-release; Wave 3 = 9 months post-release; Wave 4 = 15 months post-release.
*Included for information; not included in bundle calculations.
significant difference in SVORI and non-SVORI subjects with respect to the transition services bundle scores. Need for at least one of these services was high prior to release, with 99% reporting that they needed at least one of the services, and expressed need remained above 90% throughout the subsequent interviews.
The most commonly reported needs remained fairly constant across the waves, although the percentages expressing those needs diminished some over time. More than half reported needing all forms of assistance except legal assistance prior to release, with financial assistance (such as short-term loans or housing deposits) identified as a need by the largest percentage and with a driver’s license, transportation, and public health care identified as needs by more than 70%.

Prisoner reentry experiences of adult males
76
HEALTH SERVICES Self-reported needs for health services declined slightly between the pre-release and 3-month post-release interviews and then increased slowly for both the SVORI and non-SVORI groups. Exhibit 42 shows the bundle scores for health service needs at each interview wave. Prior to release, subjects reported needing about one third of the five health services. At the time of the 15-month post-release interview, men reported needing about 28% of the services. The most commonly reported need was for medical treatment. Unlike items in previously discussed service bundles, SVORI and non-SVORI subjects differed on one of the health services items. In particular, non-SVORI subjects were more likely to report needing mental health treatment than were SVORI program participants. Prior to release, 28% of the comparison subjects reported needing mental health treatment in comparison to 23% of the SVORI program participants. The percentages expressing need for mental health treatment dropped to 18% and 23% for SVORI and non-SVORI subjects at 3 months following release—fewer overall, but still a significant difference between the two groups. Interestingly, the numbers reporting a need for mental health treatment increased at 9 and 15 months following release, such that the proportions reporting a need for treatment at 15 months was essentially the same as those observed at the time of the Wave 1 interview.
DOMESTIC VIOLENCE SERVICES As shown in Exhibit 43, domestic violence services were a low-ranked service need among the adult male sample. Only about 10% of the men reported prior to release needing either domestic violence support groups or batterer intervention programming. Following release, the percentages dropped to about 5%. There were no differences between the SVORI and non-SVORI groups.

Self-reported Service Needs
77
Exhibit 42. Weighted means for health services bundles and items, by group and wave
Variable S N
Non-SVORI
N S
Mean
Non-SVORIMean
Par. st. SE
Test Stat. p Val. OR
Wave 1 Health Services Score 863 834 31.55 33.65 −2.10 1.21 −1.73 0.08 NA
Need ANY health services* 863 834 0.80 0.80 −0.02 0.12 0.03 0.85 0.98 Need medical tx 862 834 0.57 0.57 0.01 0.10 0.02 0.89 1.02 Need MH tx 861 832 0.23 0.28 0.26 0.11 5.36 0.02 1.30 Need substance use tx 862 834 0.38 0.42 0.16 0.10 2.47 0.12 1.17 Need group for abuse victims
863 834 0.04 0.04 −0.14 0.25 0.33 0.57 0.87
Need anger mgmt program 861 833 0.36 0.37 0.07 0.10 0.48 0.49 1.07 Wave 2 Health Services Score 529 455 23.55 25.37 −1.82 1.52 −1.20 0.23 NA
Need ANY health services* 529 455 0.68 0.69 −0.04 0.14 0.07 0.80 0.96 Need medical tx 529 455 0.53 0.56 0.11 0.13 0.72 0.39 1.12 Need MH tx 529 453 0.18 0.23 0.33 0.16 3.98 0.05 1.39 Need substance use tx 529 455 0.22 0.23 0.07 0.16 0.22 0.64 1.08 Need group for abuse victims
529 455 0.03 0.02 −0.08 0.41 0.04 0.85 0.93
Need anger mgmt program 529 455 0.22 0.22 0.00 0.16 0.00 0.99 1.00 Wave 3 Health Services Score 564 469 25.57 26.56 −0.99 1.55 −0.64 0.52 NA
Need ANY health services* 564 469 0.68 0.71 −0.17 0.14 1.52 0.22 0.84 Need medical tx 564 469 0.52 0.53 0.07 0.13 0.31 0.58 1.07 Need MH tx 564 468 0.19 0.24 0.26 0.16 2.87 0.09 1.30 Need substance use tx 563 469 0.29 0.30 0.04 0.14 0.08 0.78 1.04 Need group for abuse victims
564 469 0.03 0.02 −0.18 0.39 0.21 0.65 0.84
Need anger mgmt program 564 469 0.25 0.23 −0.09 0.15 0.33 0.57 0.92 Wave 4 Health Services Score 582 530 27.86 28.65 −0.79 1.53 −0.52 0.60 NA
Need ANY health services* 582 530 0.71 0.72 −0.06 0.14 0.18 0.67 0.94 Need medical tx 582 530 0.54 0.56 0.09 0.12 0.48 0.49 1.09 Need MH tx 580 530 0.23 0.27 0.23 0.14 2.59 0.11 1.26 Need substance use tx 582 530 0.32 0.32 0.02 0.13 0.03 0.86 1.02 Need group for abuse victims
582 529 0.03 0.02 −0.35 0.40 0.78 0.38 0.70
Need anger mgmt program 582 530 0.28 0.26 −0.11 0.14 0.64 0.42 0.90 Note: NA = Not applicable. MH = mental health. OR = odds ratio. Par. Est. = parameter estimate. p Val. = probability
value. S = SVORI. SE = standard error. Wave 1 = 30 days pre-release; Wave 2 = 3 months post-release; Wave 3 = 9 months post-release; Wave 4 = 15 months post-release.
*Included for information; not included in bundle calculations.

Prisoner reentry experiences of adult males
78
Exhibit 43. Weighted means for domestic violence services bundles and items, by group and wave
Variable S N
Non-SVORI
N S
Mean
Non-SVORIMean
Par.Est. SE
Test Stat. p Val. OR
Wave 1 DomViolScore 862 834 6.82 8.17 −1.35 1.15 −1.17 0.24 NA
Need ANY DV services* 862 834 0.09 0.11 −0.20 0.16 1.50 0.22 0.82 Need batterer intervention program
861 833 0.08 0.08 0.00 0.18 0.00 0.99 1.00
Need DV support group 862 833 0.06 0.09 0.40 0.19 4.42 0.04 1.49 Wave 2 DomViolScore 529 455 4.35 4.37 −0.03 1.18 −0.02 0.98 NA
Need ANY DV services* 529 455 0.06 0.06 −0.05 0.27 0.03 0.87 0.96 Need batterer intervention program
527 455 0.05 0.06 0.09 0.28 0.10 0.75 1.10
Need DV support group 529 455 0.04 0.03 −0.14 0.36 0.15 0.70 0.87 Wave 3 DomViolScore 564 469 3.06 3.47 −0.41 1.01 −0.41 0.68 NA
Need ANY DV services* 564 469 0.04 0.05 −0.24 0.30 0.62 0.43 0.79 Need batterer intervention program
564 468 0.04 0.04 0.19 0.33 0.34 0.56 1.21
Need DV support group 564 468 0.03 0.03 0.04 0.40 0.01 0.91 1.04 Wave 4 DomViolScore 582 529 3.81 5.76 −1.95 1.22 −1.60 0.11 NA
Need ANY DV services* 582 529 0.05 0.07 −0.43 0.26 2.69 0.10 0.65 Need batterer intervention program
582 529 0.04 0.06 0.37 0.27 1.85 0.17 1.45
Need DV support group 582 529 0.03 0.05 0.51 0.31 2.73 0.10 1.67 Note: NA = Not applicable. DV = domestic violence. OR = odds ratio. Par. Est. = parameter estimate. p Val. =
probability value. S = SVORI. SE = standard error. Wave 1 = 30 days pre-release; Wave 2 = 3 months post-release; Wave 3 = 9 months post-release; Wave 4 = 15 months post-release.
*Included for information; not included in bundle calculations
CHILD SERVICES More than 60% of the men reported having children (62% of SVORI and 64% of non-SVORI respondents), and nearly all of those with children reported having children under the age of 18 years (96% SVORI and 95% non-SVORI). Among those who had minor children, the expressed need for child-related services (which included instruction in parenting skills, child care, child support payments, modifications in the child support debt they owed, and modifications in the custody of their children) decreased somewhat over the follow-up period. As shown in Exhibit 44, the men reported needing about half of
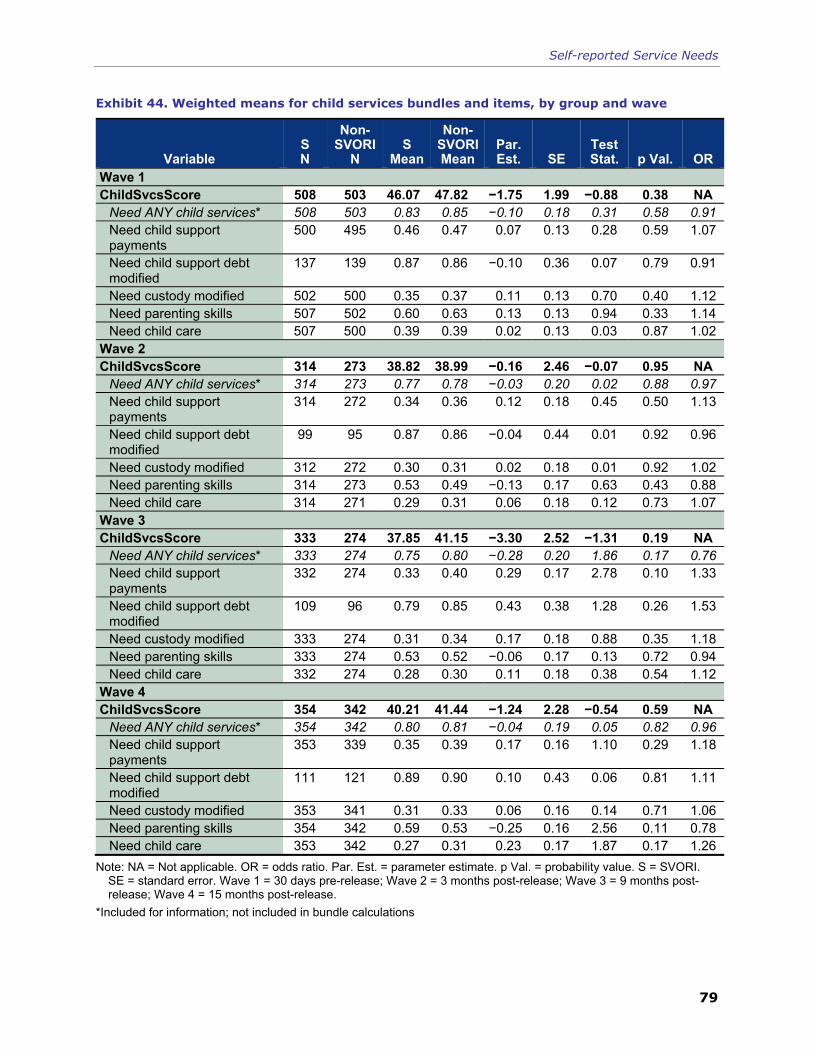
Self-reported Service Needs
79
Exhibit 44. Weighted means for child services bundles and items, by group and wave
Variable S N
Non-SVORI
N S
Mean
Non-SVORIMean
Par.Est. SE
Test Stat. p Val. OR
Wave 1 ChildSvcsScore 508 503 46.07 47.82 −1.75 1.99 −0.88 0.38 NA
Need ANY child services* 508 503 0.83 0.85 −0.10 0.18 0.31 0.58 0.91 Need child support payments
500 495 0.46 0.47 0.07 0.13 0.28 0.59 1.07
Need child support debt modified
137 139 0.87 0.86 −0.10 0.36 0.07 0.79 0.91
Need custody modified 502 500 0.35 0.37 0.11 0.13 0.70 0.40 1.12 Need parenting skills 507 502 0.60 0.63 0.13 0.13 0.94 0.33 1.14 Need child care 507 500 0.39 0.39 0.02 0.13 0.03 0.87 1.02
Wave 2 ChildSvcsScore 314 273 38.82 38.99 −0.16 2.46 −0.07 0.95 NA
Need ANY child services* 314 273 0.77 0.78 −0.03 0.20 0.02 0.88 0.97 Need child support payments
314 272 0.34 0.36 0.12 0.18 0.45 0.50 1.13
Need child support debt modified
99 95 0.87 0.86 −0.04 0.44 0.01 0.92 0.96
Need custody modified 312 272 0.30 0.31 0.02 0.18 0.01 0.92 1.02 Need parenting skills 314 273 0.53 0.49 −0.13 0.17 0.63 0.43 0.88 Need child care 314 271 0.29 0.31 0.06 0.18 0.12 0.73 1.07
Wave 3 ChildSvcsScore 333 274 37.85 41.15 −3.30 2.52 −1.31 0.19 NA
Need ANY child services* 333 274 0.75 0.80 −0.28 0.20 1.86 0.17 0.76 Need child support payments
332 274 0.33 0.40 0.29 0.17 2.78 0.10 1.33
Need child support debt modified
109 96 0.79 0.85 0.43 0.38 1.28 0.26 1.53
Need custody modified 333 274 0.31 0.34 0.17 0.18 0.88 0.35 1.18 Need parenting skills 333 274 0.53 0.52 −0.06 0.17 0.13 0.72 0.94 Need child care 332 274 0.28 0.30 0.11 0.18 0.38 0.54 1.12
Wave 4 ChildSvcsScore 354 342 40.21 41.44 −1.24 2.28 −0.54 0.59 NA
Need ANY child services* 354 342 0.80 0.81 −0.04 0.19 0.05 0.82 0.96 Need child support payments
353 339 0.35 0.39 0.17 0.16 1.10 0.29 1.18
Need child support debt modified
111 121 0.89 0.90 0.10 0.43 0.06 0.81 1.11
Need custody modified 353 341 0.31 0.33 0.06 0.16 0.14 0.71 1.06 Need parenting skills 354 342 0.59 0.53 −0.25 0.16 2.56 0.11 0.78 Need child care 353 342 0.27 0.31 0.23 0.17 1.87 0.17 1.26
Note: NA = Not applicable. OR = odds ratio. Par. Est. = parameter estimate. p Val. = probability value. S = SVORI. SE = standard error. Wave 1 = 30 days pre-release; Wave 2 = 3 months post-release; Wave 3 = 9 months post-release; Wave 4 = 15 months post-release.
*Included for information; not included in bundle calculations
Prisoner reentry experiences of adult males
80
the child-related services at the time of the pre-release interview, but only about 40% at the follow-up interviews. The greatest need across all waves was for modification to child support debt—a need expressed by most of those with children. However, a majority also indicated that they needed services to improve their parenting skills.
LEVELS OF NEED ACROSS SERVICES Overall, the men reported high needs in the days immediately before release and somewhat lower needs at each of the follow-up interviews. Among the various service bundles, services related to education, employment, and skill building consistently were reported the most frequently. In terms of individual services, the ones most consistently identified as a need by the largest proportion of men were more education, employment, public health care insurance, and financial assistance.
At each interview wave, in addition to self-reporting whether a particular service was needed, respondents were also asked to report their “top two” service needs. According to this measure, two employment/education/skills services ranked among the top five most commonly reported. Specifically, among the services that were most commonly reported in the top two across all waves were a job (24–38% of the men) and more education (18–22%). Other services reported were a driver’s license (19–28%), financial assistance (11–16%), and a place to live (12–15%).
Importantly, very few differences in self-reported needs were observed between the SVORI program participants and the non-SVORI comparison subjects at any interview wave. Given that SVORI programming was supposed to identify and provide services to address individual needs, these findings at first glance might be considered disappointing and might seems to suggest either that needs weren’t addressed or that the services were ineffective. An alternative and plausible explanation, however, is that many of these needs are ongoing—regardless of whether they are addressed or not. Even if someone receives education or medical treatment, the need for these two types of services can persist—more education will be helpful, and treatment for a new illness or injury may be needed. Additionally, former prisoners may
The most commonly reported service needs in the top two across all waves were a job (24–38%) and more education (18–22%).
Self-reported Service Needs
81
struggle with low-paying jobs that threaten on an ongoing basis their ability to attain and retain housing, meet child support obligations, etc.
Findings presented in the following section show that SVORI programs were, in fact, successful in increasing the numbers and types of services provided to program participants.


83
SSeellff--rreeppoorrtteedd SSeerrvviiccee RReecceeiipptt
In addition to collecting extensive information on subjects’ needs, the Multi-site Evaluation of SVORI collected analogous information on service receipt to determine whether SVORI programs were successful in increasing participants’ access to services. In the report Pre-release Characteristics and Service Receipt among Adult Male Participants in the SVORI Multi-site Evaluation (Lattimore, Visher, & Steffey, 2008), extensive findings were presented that suggest that the SVORI programs substantially increased access to pre-release services for program participants. For all service areas, men enrolled in SVORI programs reported significantly higher service receipt during their periods of incarceration than comparable men not enrolled in SVORI.
Service receipt bundle scores were calculated analogous to the calculations of the service need bundle scores: the number of “yes” responses to items in a bundle was divided by the number of bundle items and multiplied by 100. Individual bundle scores were averaged to get site-level scores, which were averaged to get overall scores. Child services receipt bundle scores were generated only for those respondents who reported having children under the age of 18.
In addition to the five service need bundles, a sixth service receipt bundle was developed consisting of coordination items. The service receipt bundles measured receipt of specific items since the last interview32 and are as follows:
32 Individuals who did not complete the previous interview were asked
about the comparable time period for the 9- and 15-month interviews (i.e., in the past 6 months rather than since the last interview).

Prisoner reentry experiences of adult males
84
coordination services (4 items: received a needs assessment, met with a case manager, worked with anyone to reintegrate; currently on probation or parole; Wave 1 did not include currently on probation or parole, but did include two additional items: received needs assessment specific for release and reentry plan developed);
transition services (10 items: received legal assistance, financial assistance, public financial assistance, assistance with public health care insurance, mentoring, documents for employment, place to live, transportation, drivers license, clothes/food bank);
health care services (6 items: received any medical treatment, dental services, mental health treatment, substance abuse treatment, group for abuse victims, anger management services);
employment, education, and skills services (6 items: received any employment services, any educational services, money management assistance, life skills training, assistance with personal relationships, training to change attitudes on criminal behavior);
domestic violence-related services (2 items: participated in batterer intervention program, domestic violence support group); and
child-related services (5 items: received assistance getting child support payments, modifying child support debt, modifying custody, parenting skills classes, finding child care).
Exhibit 45 shows the pre-release service receipt bundle scores for all SVORI and non-SVORI respondents and clearly demonstrates that SVORI programs were successful in increasing access to a wide range of services and programming.33 In all cases, SVORI respondents were significantly more likely than non-SVORI respondents to report receiving more services across the six bundles. However, the exhibit also shows that, with the exception of the coordination services bundle that includes assessments and reentry planning, SVORI respondents reported receiving 40% or less of the items in the service receipt bundles. Further, the levels of service receipt are substantially lower than the levels of need
33 Note that the items included in the health services and
employment/education/skills bundles differ slightly from those that were included in the bundles reported in Lattimore, Visher, and Steffey (2008).
SVORI programs were successful in increasing access to a wide range of services and programming.
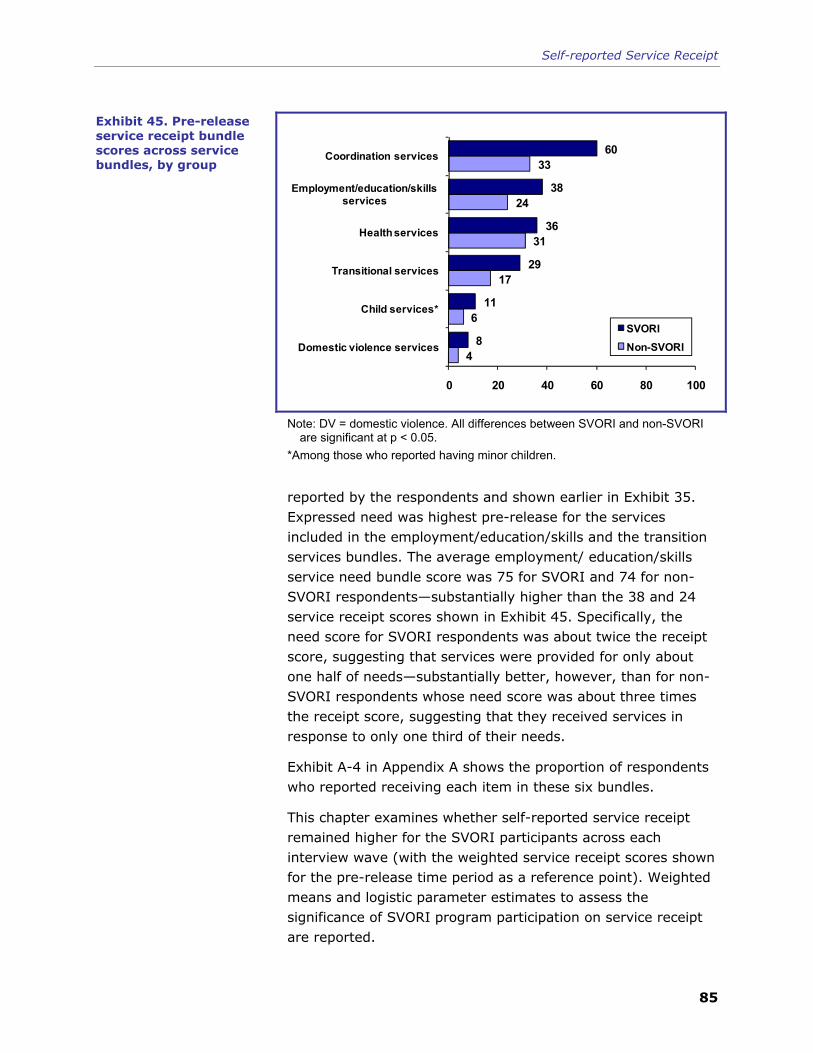
Self-reported Service Receipt
85
4
6
17
31
24
33
8
11
29
36
38
60
0 20 40 60 80 100
Domestic violence services
Child services*
Transitional services
Health services
Employment/education/skills services
Coordination services
SVORINon-SVORI
Note: DV = domestic violence. All differences between SVORI and non-SVORI are significant at p < 0.05.
*Among those who reported having minor children.
reported by the respondents and shown earlier in Exhibit 35. Expressed need was highest pre-release for the services included in the employment/education/skills and the transition services bundles. The average employment/ education/skills service need bundle score was 75 for SVORI and 74 for non-SVORI respondents—substantially higher than the 38 and 24 service receipt scores shown in Exhibit 45. Specifically, the need score for SVORI respondents was about twice the receipt score, suggesting that services were provided for only about one half of needs—substantially better, however, than for non-SVORI respondents whose need score was about three times the receipt score, suggesting that they received services in response to only one third of their needs.
Exhibit A-4 in Appendix A shows the proportion of respondents who reported receiving each item in these six bundles.
This chapter examines whether self-reported service receipt remained higher for the SVORI participants across each interview wave (with the weighted service receipt scores shown for the pre-release time period as a reference point). Weighted means and logistic parameter estimates to assess the significance of SVORI program participation on service receipt are reported.
Exhibit 45. Pre-release service receipt bundle scores across service bundles, by group

Prisoner reentry experiences of adult males
86
WEIGHTED SERVICE NEED BUNDLE SCORES ACROSS WAVES 1 THROUGH 4 Exhibit 46 summarizes information on average reported service receipt for each group across the four waves of interview data. As noted previously, the averages were generated using the propensity-score weights. The “super bundle” scores that are shown in Exhibit 46 reflect all of the services and were generated by summing across reports of receipt for all service items and dividing by the total number of service items.
34
1813 9
2212 10 8
0102030405060708090
100
Wave 1 Wave 2 Wave 3 Wave 4
SVORI
Non-SVORI
Note: Differences between groups at Waves 1, 2, and 3 were significant at the 0.0001 level.
For Wave 1, the results suggest that on average about 30 days before release the SVORI subjects reported receiving about a third (34%) of the various service items and the non-SVORI comparison subjects reported receiving about one quarter (24%) of the items. (This difference and the differences at Waves 2 and 3 are significant at the p < .0001 level.) Exhibit 46 suggests three findings: (1) SVORI program participants received substantially more services pre-release than non-SVORI subjects; (2) service receipt dropped substantially at release (at 3 months post-release the average subject reported receiving roughly half as many services as 30 days prior to release); (3) reported service receipt continued to drop as the time since release lengthened; and (4) there was little difference in average receipt at 15 months following release—with both groups reporting receiving less than 10% of the service items.
Exhibit 46. Weighted average service receipt super bundle scores by group for Waves 1 through 4
SVORI program participants received substantially more services pre-release.
Service receipt dropped following release.
Service receipt continued to decline as the time since release increased.
By 15 months following release, there was little difference in receipt with both groups reporting receipt of less than 10% of service items.

Self-reported Service Receipt
87
Recall that the reported needs also dropped between the pre-release interview (Wave 1) and the 3-month post-release interview (Wave 2), but the decline was not as dramatic as that in Exhibit 46. Exhibit 47 combines the data from Exhibits 37 and 46. As can be seen, need exceeds receipt at all waves and the decline in receipt is steeper than the decline in reported need.
54
42 43 4454
43 43 45
0102030405060708090
100
Wave 1 Wave 2 Wave 3 Wave 4
SVORI-Neednon-SVORI-NeedSvori-Receiptnon-SVORI-Receipt
Note: S = SVORI. Differences between groups for service receipt at Waves 1, 2, and 3 were significant at the 0.0001 level; no other difference is significant at the 0.05 level. Wave 1 = 30 days pre-release; Wave 2 = 3 months post-release; Wave 3 = 9 months post-release; Wave 4 = 15 months post-release.
Exhibit 48 shows the weighted average bundle scores for the coordination, employment/education/skills, and transition services bundles, by group and data collection wave. As can be seen, the average proportion of services being received post-release drops rapidly for the employment/education/skills and the transition services. The coordination services bundle scores deviate from the pattern of substantial drops between 30 days prior to release (Wave 1) and 3 months following release (Wave 2) that were observed for the super bundle scores. One explanation is that for this one bundle the items contained in the Wave 1 and Wave 2 bundles differ somewhat (i.e., Wave 1 includes received needs assessment specific for release and reentry plan developed; Wave 2–4 does not include these items but includes probation/parole status). But, more likely the explanation is that most of the study participants were released to supervision and thus received a minimum of one of the four coordination services included in the post-
Exhibit 47. Weighted average service need and receipt super bundle scores by group for Waves 1 through 4

Prisoner reentry experiences of adult males
88
Exhibit 48. Weighted average service receipt bundle scores by type, group, and wave
6
7
9
17
6
8
8
24
24
31
40
33
6
9
13
28
8
11
14
38
30
43
57
60
0 10 20 30 40 50 60 70 80 90 100
Transition services bundle-4
Transition services bundle-3
Transition services bundle-2
Transition services bundle-1
Employment/education/skills bundle-4
Employment/education/skills bundle-3
Employment/education/skills bundle-2
Employment/education/skills bundle-1
Coordination bundle-4
Coordination bundle-3
Coordination bundle-2
Coordination bundle-1
Bundle Score
SVORI
Non-SVORI
Note: CoS = coordination bundle. E/E/S = employment/education/skills bundle. TS = transition services bundle. All differences between SVORI and non-SVORI are significant at the .01 level except for the TS-4, where there is no significant difference between the two groups.
release bundles. The contributions of individual items to the coordination bundle are explored in more detail in the following section.
Exhibit 48 clearly shows the dramatic drop in receipt of employment/education/skills and transition services following release. The decline occurred for both SVORI and non-SVORI subjects and continued over time such that by 15 months post-release there was no difference between SVORI and non-SVORI in terms of the average number of transition services received (6%). Since there are 10 items in this bundle, the findings suggest that at 15 months following release, these men were receiving very little assistance—less than one of the 10 different services.
Exhibit 49 shows the weighted average bundle scores for the remaining three bundles—health services, child services and domestic violence services. As can be seen, there was a substantial decline between pre-release and post-release

Self-reported Service Receipt
89
Exhibit 49. Weighted average service receipt bundle scores by type, group, and wave
2
1
1
5
8
10
12
22
12
13
11
31
1
1
1
7
9
13
18
34
11
13
13
35
0 10 20 30 40 50 60 70 80 90 100
Domestic violence services bundle-4
Domestic violence services bundle-3
Domestic violence services bundle-2
Domestic violence services bundle-1
Child services bundle-4
Child services bundle-3
Child services bundle-2
Child services bundle-1
Health services bundle-4
Health services bundle-3
Health services bundle-2
Health services bundle-1
Bundle Score
SVORI
Non-SVORI
Note: HS = Health services bundle. CS = Child services bundle. DV = Domestic violence services bundle. Wave 1 differences between SVORI and non-SVORI were significant at the 0.05 level; difference for CS-2 was also significant at the 0.05 level; other differences were not statistically significant at the 0.05 level.
values. Virtually no one reported receiving domestic violence treatment or batterer intervention post-release—a finding that is consistent with very low reports of need.
The following sections examine the patterns for the specific items in each of these service bundles, presenting the results of the weighted means and regression analyses for each service bundle (and individual item) across waves.
COORDINATION SERVICES The coordination services bundle measures the receipt of services associated with developing a treatment plan, preparing for release, and monitoring the offender’s status. Because the various dimensions of service coordination differed for incarcerated and released individuals, the coordination services bundle was scored differently for post-release measures. Specifically, the pre-release coordination services bundle (as described previously) included (1) whether a needs assessment
Prisoner reentry experiences of adult males
90
had been conducted, (2) whether a needs assessment specifically designed to help the individual prepare for release had been conducted, (3) whether any case management had been provided, (4) whether a reentry plan had been developed, and (5) whether the inmate had worked with anyone to help plan for release. The post-release coordination services included (1) whether a needs assessment had been conducted, (2) whether any case management had been provided, (3) whether the individual had worked with anyone to help reintegrate him or her back into the community, and (4) whether the individual was currently on post-release supervision. Although the bundle scores were standardized on the basis of the number of items in the score, comparing the bundle score values from Wave 1 with those from the subsequent waves was nonetheless difficult since they reflect different services.
Exhibit 50 shows the weighted means for the SVORI and non-SVORI groups, as well as the parameter estimate, standard error, test statistic, p value, and odds ratio for the coordination services bundles for each of the four waves. The men reported higher levels of coordination services than the other service areas considered in the evaluation, and this pattern was true at all time periods. Further, higher proportions of the SVORI group reported receipt of every service item for every wave, but there was no significant difference in the proportions of the two groups who reported being on probation/parole.
Focusing first on the Wave 1 data, SVORI program participants were more likely to report receiving services related to reentry while they were incarcerated. Specifically, 49% of SVORI program participants, compared to 23% of the non-SVORI comparisons, reported receiving a needs assessment specifically related to their pending release and 66% of SVORI, compared to only 31% of the non-SVORI comparison subjects, reported working with anyone to plan for release. A somewhat surprising finding concerns the proportion of subjects who reported that they had a reentry plan at the time of the interview—only 57% of the SVORI program participants (compared with 25% of the non-SVORI subjects) reported having a reentry plan.
SVORI program participants were more likely to report receiving coordination services than non-SVORI comparisons at all four interviews
Although more likely to report having a reentry plan, only 57% of the SVORI program participants reported that they had a reentry plan about 30 days prior to their release.

Self-reported Service Receipt
91
Exhibit 50. Weighted means for coordination services bundles and items, by group and wave
Variable S N
Non-SVORI
N S
Mean
Non-SVORIMean
Par.Est. SE
Test Stat. p Val OR
Wave 1 Coordination Score 863 834 59.52 33.00 26.52 1.66 15.96 0.00 NA
Rcvd ANY coordination services*
863 834 0.88 0.66 1.27 0.13 97.57 0.00 3.57
Rcvd needs assessment 860 830 0.63 0.46 0.69 0.10 47.03 0.00 2.00 Met with case manager 860 834 0.66 0.41 1.06 0.10 107.24 0.00 2.89 Rcvd needs assessment specific for release
852 826 0.49 0.23 1.14 0.11 108.66 0.00 3.12
Reentry plan developed 843 820 0.57 0.25 1.38 0.11 160.58 0.00 4.00 Worked with anyone to plan for release
861 834 0.66 0.31 1.42 0.11 181.59 0.00 4.14
Wave 2 Coordination Score 529 455 57.42 39.56 17.87 1.90 9.40 0.00 NA
Rcvd ANY coordination services*
529 455 0.92 0.89 0.34 0.22 2.35 0.00 1.40
Rcvd needs assessment 528 455 0.44 0.18 1.31 0.15 72.11 0.00 3.69 Met with case manager 527 455 0.58 0.34 1.02 0.14 56.71 0.00 2.77 Worked with anyone to reintegrate
529 454 0.46 0.22 1.08 0.15 54.95 0.00 2.94
Currently on probation or parole
528 454 0.82 0.85 −0.22 0.17 1.54 0.21 0.81
Wave 3 Coordination Score 565 469 43.17 30.98 12.19 1.97 6.19 0.00 NA
Rcvd ANY coordination services*
565 470 0.81 0.72 0.54 0.15 12.69 0.00 1.72
Rcvd needs assessment 537 443 0.29 0.18 0.59 0.16 13.65 0.00 1.80 Met with case manager 539 441 0.42 0.24 0.85 0.14 34.93 0.00 2.35 Worked with anyone to reintegrate
540 443 0.36 0.20 0.78 0.15 26.95 0.00 2.19
Currently on probation or parole
564 468 0.70 0.65 0.25 0.14 3.25 0.07 1.28
Wave 4 Coordination Score 580 529 29.76 24.41 5.35 1.79 2.99 0.00 NA
Rcvd ANY coordination services*
582 531 0.63 0.58 0.20 0.13 2.57 0.11 1.22
Rcvd needs assessment 476 443 0.24 0.15 0.55 0.17 9.83 0.00 1.73 Met with case manager 476 444 0.31 0.22 0.43 0.15 7.79 0.01 1.54 Worked with anyone to reintegrate
476 446 0.27 0.16 0.64 0.17 14.58 0.00 1.89
Currently on probation or parole
579 529 0.53 0.53 0.00 0.12 0.00 1.00 1.00
Note: NA = Not applicable. OR = odds ratio. Par. Est. = parameter estimate. p Val. = probability value. S = SVORI. SE = standard error. Wave 1 = 30 days pre-release; Wave 2 = 3 months post-release; Wave 3 = 9 months post-release; Wave 4 = 15 months post-release.
*Included for information; not included in bundle calculations

Prisoner reentry experiences of adult males
92
The Wave 2, 3, and 4 data indicate that most subjects reported being on probation or parole at the time of the interview and that SVORI and non-SVORI were equally likely to report being on parole. The proportion on parole did decline steadily over time, dropping from more than 80% at 3 months post-release, to 65% to 70% at 9 months, and to 53% at 15 months following release.
EMPLOYMENT/EDUCATION/SKILLS SERVICES The service area for which the men consistently reported the greatest need was employment, education, and skills-related services. On average, as shown in Exhibit 38, the men reported needing more than 60% of the six items throughout, and there were no differences between the two groups. Exhibit 51 shows the weighted means for the service receipt bundle scores and individual items by group and wave. Greater proportions of SVORI program participants than non-SVORI comparison subjects reported receiving most items. Pre-release, 79% of SVORI and 69% of non-SVORI comparison subjects reported that they had received at least one of the six services that included any employment service, any education, money management, life skills, relationship building, and training to change their attitudes about criminal behavior. These percentages dropped to 50% for SVORI and 31% for non-SVORI subjects 3 months following release and declined at each successive interview until only 26% of SVORI participants and 19% of non-SVORI subjects reported receiving any of these services at 15 months following release.
The most commonly reported services pre-release were education (51% SVORI, 44% non-SVORI) and training to change criminal behavior attitudes (51% SVORI, 36% non-SVORI). Following release, few reported receiving either education or training to change criminal attitudes—only about 10% reported receiving any education following release, substantially less than the 85% or so who indicated that they needed more education. SVORI participants were more likely than non-SVORI respondents to report receiving training to change criminal attitudes at 3 and 9 months following release, but the percentages were small (18% and 16% at 3 and 9 months for SVORI compared to 10% for non-SVORI).
The most commonly reported services received pre-release were education and training to change criminal behavior attitudes.
Employment-related services were the most commonly reported post-release.

Self-reported Service Receipt
93
Exhibit 51. Weighted means for employment/education/skills service receipt bundles and items, by group and wave
Variable S N
Non-SVORI
N S
Mean
Non-SVORIMean
Par.Est. SE
Test Stat. p Val. OR
Wave 1 Employ/Ed/Skills Score 863 834 38.16 24.33 13.83 1.39 9.92 0.00 NA
Received ANY E/E/S * 863 834 0.79 0.69 0.51 0.11 20.23 0.00 1.67 Rcvd any employment 863 833 0.37 0.20 0.87 0.12 56.72 0.00 2.38 Rcvd any education 863 834 0.51 0.44 0.29 0.10 8.79 0.00 1.34 Rcvd money mgmt training 862 834 0.23 0.08 1.28 0.15 68.33 0.00 3.59 Rcvd life skills 861 832 0.42 0.21 0.97 0.11 76.28 0.00 2.65 Rcvd help with personal relationships
863 834 0.25 0.17 0.48 0.12 15.09 0.00 1.62
Rcvd training to change attitudes criminal behavior
863 834 0.51 0.36 0.60 0.10 35.54 0.00 1.83
Wave 2 Employ/Ed/Skills Score 529 455 14.40 8.25 6.15 1.09 5.66 0.00 NA
Received ANY E/E/S* 529 455 0.50 0.31 0.79 0.14 34.03 0.00 2.21 Rcvd any employment 528 455 0.34 0.20 0.76 0.15 25.11 0.00 2.14 Rcvd any education 529 455 0.11 0.08 0.44 0.23 3.66 0.06 1.55 Rcvd money mgmt training 529 455 0.05 0.02 0.75 0.37 4.17 0.04 2.12 Rcvd life skills 529 455 0.11 0.05 0.76 0.25 8.96 0.00 2.14 Rcvd help with personal relationships
529 455 0.07 0.04 0.58 0.28 4.24 0.04 1.79
Rcvd training to change attitudes criminal behavior
529 455 0.18 0.10 0.64 0.19 10.95 0.00 1.89
Wave 3 Employ/Ed/Skills Score 540 444 11.48 7.75 3.74 1.05 3.56 0.00 NA
Received ANY E/E/S* 565 470 0.38 0.28 0.45 0.14 10.72 0.00 1.56 Rcvd any employment 540 444 0.21 0.14 0.49 0.18 7.57 0.01 1.63 Rcvd any education 540 444 0.11 0.10 0.12 0.21 0.32 0.57 1.13 Rcvd money mgmt training 540 444 0.04 0.02 0.80 0.42 3.61 0.06 2.23 Rcvd life skills 540 443 0.08 0.05 0.66 0.28 5.59 0.02 1.94 Rcvd help with personal relationships
540 444 0.09 0.06 0.44 0.26 2.87 0.09 1.55
Rcvd training to change attitudes criminal behavior
540 444 0.16 0.10 0.48 0.20 5.87 0.02 1.62
Wave 4 Employ/Ed/Skills Score 476 445 8.47 5.88 2.59 0.93 2.80 0.01 NA
Received ANY E/E/S* 582 531 0.26 0.19 0.40 0.15 7.17 0.01 1.49 Rcvd any employment 476 445 0.14 0.10 0.44 0.22 4.19 0.04 1.55 Rcvd any education 476 445 0.10 0.07 0.41 0.25 2.73 0.10 1.51 Rcvd money mgmt training 476 445 0.03 0.02 0.60 0.47 1.67 0.20 1.83 Rcvd life skills 476 445 0.06 0.03 0.72 0.34 4.40 0.04 2.06 Rcvd help with personal relationships
476 445 0.07 0.06 0.25 0.27 0.83 0.36 1.28
Rcvd training to change attitudes criminal behavior
476 445 0.10 0.08 0.24 0.24 1.01 0.31 1.27
Note: NA = Not applicable. E/E/S = employment/education/skills bundle. OR = odds ratio. Par. Est. = parameter estimate. p Val. = probability value. S = SVORI. SE = standard error. Wave 1 = 30 days pre-release; Wave 2 = 3 months post-release; Wave 3 = 9 months post-release; Wave 4 = 15 months post-release.
*Included for information; not included in bundle calculations

Prisoner reentry experiences of adult males
94
Employment-related services (e.g., help with resume, job referrals) were the most commonly reported at each post-release interview; however, the overall percentage of individuals reporting receiving employment-related services was small. Only 34% of SVORI program participants reported receiving any employment-related services 3 months following release—significantly higher than the 20% of non-SVORI respondents who reported employment services, but substantially below 100%, which one might have expected for programs with an employment focus.
TRANSITION SERVICES As was shown in Exhibit 41, the men in the study reported high levels of need for transition services, which included various forms of assistance with the reentry process. Nearly all reported needing at least 1 of the 10 services at each interview, and a majority reported in the pre-release interview that they needed help with all of the items except legal assistance. Among the top needs identified were large services (financial assistance, public health care insurance) and small (drivers license, documents for employment). A need for housing was identified by about half of the respondents pre-release; this need persisted as about 45% continued to identify housing as a need in each of the three post-release interviews. Finally, more than half prior to release and about half following release said that they needed a mentor, a service that has been linked to transforming criminal behavior.
Exhibit 52 shows the reported receipt of transition services by group. SVORI program participants were more likely than non-SVORI respondents to report receiving transition services and to report receiving more transition services from pre-release through the 9-month post-release interview (Wave 3). The likelihood and amount declined following release, and the differences between the two groups diminished over time until there was no difference at 15 months following release. Most SVORI participants reported participating in programs (75%) or classes (65%) to prepare for release, significantly more than non-SVORI respondents (52% reported participating in programs, 38% reported participating in classes).
Most SVORI program participants reported participating in programs (75%) or classes (65%) to prepare for release.

Self-reported Service Receipt
95
Exhibit 52. Weighted means for transition services receipt bundles and items, by group and wave
Variable S N
non-SVORI
N S
Mean
Non-SVORIMean
Par.Est. SE
Test Stat. p Val. OR
Wave 1 TransSvcsScore 863 834 28.40 16.77 11.63 0.95 12.20 0.00 NA
Rcvd ANY transition services* 863 834 0.87 0.73 0.89 0.13 47.80 0.00 2.44 Rcvd programs for release 863 833 0.75 0.52 1.01 0.11 90.62 0.00 2.76 Rcvd classes for release 862 833 0.65 0.38 1.11 0.10 115.94 0.00 3.03 Rcvd legal assistance 863 834 0.12 0.08 0.39 0.17 5.28 0.02 1.47 Rcvd financial assist 863 834 0.13 0.04 1.25 0.21 35.50 0.00 3.48 Rcvd public financial assist 862 834 0.14 0.11 0.27 0.15 3.20 0.07 1.31 Rcvd public health care insurance
861 834 0.13 0.09 0.42 0.16 7.07 0.01 1.53
Rcvd mentor 863 834 0.19 0.08 0.93 0.16 36.11 0.00 2.54 Rcvd docs for employ 859 834 0.41 0.26 0.66 0.11 37.59 0.00 1.93 Rcvd place to live 863 834 0.28 0.13 0.94 0.13 51.53 0.00 2.55 Rcvd transportation 862 834 0.19 0.12 0.56 0.14 16.06 0.00 1.76 Rcvd drivers license 862 834 0.22 0.08 1.15 0.16 54.76 0.00 3.17 Rcvd cloth/food bank 862 834 0.21 0.11 0.74 0.14 28.42 0.00 2.10
Wave 2 TransSvcsScore 529 455 13.43 8.87 4.56 0.95 4.80 0.00 NA
Rcvd ANY transition services* 529 455 0.59 0.43 0.66 0.13 25.31 0.00 1.94 Rcvd legal assistance 529 455 0.04 0.03 0.24 0.36 0.47 0.49 1.28 Rcvd financial assist 529 455 0.07 0.04 0.58 0.31 3.55 0.06 1.79 Rcvd public financial assist 529 455 0.20 0.16 0.29 0.17 2.90 0.09 1.34 Rcvd public health care insurance
528 455 0.11 0.08 0.26 0.22 1.35 0.25 1.30
Rcvd mentor 528 455 0.14 0.04 1.32 0.26 25.39 0.00 3.75 Rcvd docs for employ 529 455 0.25 0.16 0.59 0.17 12.52 0.00 1.80 Rcvd place to live 529 455 0.12 0.11 0.09 0.21 0.18 0.68 1.09 Rcvd transportation 529 455 0.15 0.12 0.30 0.19 2.40 0.12 1.35 Rcvd drivers license 529 455 0.12 0.07 0.52 0.23 5.07 0.02 1.68 Rcvd cloth/food bank 528 455 0.16 0.08 0.74 0.21 12.62 0.00 2.10
Wave 3 TransSvcsScore 540 444 9.23 6.73 2.50 0.81 3.08 0.00 NA
Rcvd ANY transition services* 565 470 0.45 0.31 0.58 0.13 19.12 0.00 1.79 Rcvd legal assistance 539 444 0.06 0.07 −0.25 0.26 0.94 0.33 0.78 Rcvd financial assist 540 444 0.07 0.02 1.29 0.36 12.57 0.00 3.64 Rcvd public financial assist 540 444 0.12 0.10 0.20 0.21 0.88 0.35 1.22 Rcvd public health care insurance
540 444 0.09 0.07 0.20 0.24 0.71 0.40 1.22
Rcvd mentor 540 444 0.13 0.06 0.91 0.24 14.13 0.00 2.50 Rcvd docs for employ 540 444 0.13 0.09 0.43 0.21 4.09 0.04 1.54 Rcvd place to live 540 444 0.07 0.06 0.08 0.27 0.09 0.76 1.09 Rcvd transportation 540 444 0.10 0.07 0.36 0.24 2.30 0.13 1.44 Rcvd drivers license 540 444 0.08 0.05 0.58 0.29 4.14 0.04 1.79 Rcvd cloth/food bank 540 444 0.07 0.07 −0.07 0.25 0.08 0.78 0.93
(continued)

Prisoner reentry experiences of adult males
96
Exhibit 52. Weighted means for transition services receipt bundles and items, by group and wave (continued)
Variable S N
non-SVORI
N S
Mean
Non-SVORIMean
Par.Est. SE
Test Stat. p Val. OR
Wave 4 TransSvcsScore 476 445 6.00 6.01 −0.01 0.76 −0.02 0.98 NA
Rcvd ANY transition services* 582 531 0.27 0.26 0.07 0.14 0.26 0.61 1.07 Rcvd legal assistance 476 444 0.06 0.08 −0.31 0.27 1.30 0.25 0.73 Rcvd financial assist 476 445 0.05 0.02 0.69 0.38 3.32 0.07 2.00 Rcvd public financial assist 476 445 0.07 0.11 −0.47 0.24 3.99 0.05 0.62 Rcvd public health care insurance 476 445 0.06 0.07 −0.16 0.26 0.35 0.56 0.86 Rcvd mentor 476 445 0.09 0.04 0.79 0.28 8.03 0.00 2.20 Rcvd docs for employ 476 445 0.07 0.06 0.09 0.27 0.11 0.74 1.10 Rcvd place to live 476 445 0.04 0.05 −0.28 0.32 0.76 0.38 0.76 Rcvd transportation 476 445 0.06 0.05 0.10 0.30 0.12 0.73 1.11 Rcvd drivers license 476 445 0.05 0.05 0.12 0.31 0.15 0.70 1.13 Rcvd cloth/food bank 476 445 0.05 0.06 −0.18 0.29 0.37 0.54 0.84
Note: NA = Not applicable. OR = odds ratio. Par. Est. = parameter estimate. p Val. = probability value. S = SVORI. SE = standard error. Wave 1 = 30 days pre-release; Wave 2 = 3 months post-release; Wave 3 = 9 months post-release; Wave 4 = 15 months post-release.
*Included for information; not included in bundle calculations
SVORI participants were much more likely to report receiving help pre-release obtaining drivers licenses (22%) and documents for employment (41%) than non-SVORI respondents (8% and 26%), although at levels substantially below the more than the 80% who said they needed help obtaining drivers licenses and the 55% who said they needed documents for employment. The percentages reporting having a mentor pre-release were substantially less than the 60% of both groups who said they needed a mentor. SVORI participants were 2.5 times more likely to report having a mentor, but only 19% of SVORI participants (compare 8% non-SVORI) reported having a mentor.
While most members of both groups reported receiving at least one of the transition services prior to release, the proportions declined dramatically following release. Only 59% of SVORI program participants and 43% of non-SVORI comparison subjects reported receiving ANY transition services during the first 3 months following their release from prison. The most commonly reported service across the four waves was assistance obtaining documents for employment (e.g., Social Security card, birth certificate). Perhaps the most surprising
The most commonly reported service received across the four interviews was assistance obtaining documents for employment.

Self-reported Service Receipt
97
finding in Exhibit 52 is how few of these men received support as they transitioned back into the community. Although SVORI participants received significantly more help—at least pre-release and immediately after release—less than 50% reported receiving any of these services at the 9- and 15-month interviews.
HEALTH SERVICES Exhibit 42 showed the bundle scores for health service needs at each interview wave. Prior to release, subjects reported needing about one third of the five health services. At the time of the 15-month post-release interview, men reported needing about 28% of the services. The most commonly reported need was for medical treatment, with substantial minorities also indicating a need for substance use treatment and anger management programs.
Exhibit 53 provides the means and test statistics for the receipt of various health services, including medical, dental, mental health, and substance abuse treatment; included in this bundle is victims’ group counseling and anger management. Most subjects indicated that they had received health services while they were incarcerated, with medical and dental treatment being the most commonly reported. Not surprisingly, as medical treatment is mandated by law, there was no difference in the receipt of medical and dental services while subjects were incarcerated. There was also no difference in mental health treatment, although non-SVORI subjects were slightly more likely than SVORI program participants (19% to 16%) to report receiving mental health treatment while incarcerated; this finding is consistent with non-SVORI subjects having been more likely to report needing mental health treatment (see Exhibit 42). SVORI program participants were much more likely to report receiving substance abuse treatment while they were incarcerated—48% of SVORI and 38% of non-SVORI reported receiving substance abuse treatment while incarcerated—and anger management programming (33% SVORI, 26% non-SVORI).
Following release, the respondents were less likely to receive any service; they also reported receiving many fewer services. The health services bundle scores declined from about one third pre-release (35.28 SVORI, 31.21 non-SVORI) to about one

Prisoner reentry experiences of adult males
98
Exhibit 53. Weighted means for health services receipt bundles and items, by group and wave
Variable S N
Non-SVORI
N S
Mean
Non-SVORIMean
Par.Est. SE
Test Stat. p Val. OR
Wave 1 Health Services Score 863 834 35.28 31.21 4.08 1.09 3.75 0.00 NA
Rcvd ANY health services* 863 834 0.88 0.83 0.40 0.14 7.87 0.01 1.49 Rcvd medical tx 861 830 0.58 0.55 0.14 0.10 1.98 0.16 1.15 Rcvd dental tx 863 833 0.50 0.47 0.11 0.10 1.30 0.25 1.12 Rcvd MH tx 854 821 0.16 0.19 −0.22 0.13 2.72 0.10 0.81 Rcvd substance use tx 862 834 0.48 0.38 0.42 0.10 17.14 0.00 1.52 Rcvd group for abuse victims 862 834 0.07 0.03 0.91 0.26 12.41 0.00 2.48 Rcvd anger mgmt program 863 833 0.33 0.26 0.33 0.11 9.50 0.00 1.40
Wave 2 Health Services Score 529 455 12.75 11.06 1.69 0.95 1.77 0.08 NA
Rcvd ANY health services* 529 455 0.53 0.45 0.32 0.13 5.89 0.02 1.37 Rcvd medical tx 525 450 0.25 0.23 0.10 0.15 0.41 0.52 1.10 Rcvd dental tx 526 452 0.05 0.07 −0.26 0.27 0.95 0.33 0.77 Rcvd MH tx 524 449 0.09 0.08 0.12 0.24 0.26 0.61 1.13 Rcvd substance use tx 529 455 0.28 0.23 0.27 0.15 3.30 0.07 1.31 Rcvd group for abuse victims 529 455 0.01 0.01 0.35 0.58 0.36 0.55 1.42 Rcvd anger mgmt program 529 455 0.08 0.05 0.52 0.26 3.98 0.05 1.68
Wave 3 Health Services Score 541 444 12.70 12.50 0.20 0.95 0.21 0.83 NA
Rcvd ANY health services* 565 470 0.50 0.50 0.02 0.13 0.03 0.87 1.02 Rcvd medical tx 537 440 0.30 0.29 0.04 0.14 0.09 0.77 1.04 Rcvd dental tx 540 443 0.08 0.08 −0.09 0.24 0.13 0.72 0.92 Rcvd MH tx 535 439 0.08 0.07 0.14 0.25 0.34 0.56 1.15 Rcvd substance use tx 541 443 0.22 0.23 −0.04 0.16 0.07 0.79 0.96 Rcvd group for abuse victims 540 444 0.01 0.01 −0.55 0.75 0.54 0.46 0.58 Rcvd anger mgmt program 540 444 0.08 0.07 0.14 0.25 0.33 0.57 1.15
Wave 4 Health Services Score 476 445 10.86 11.93 −1.07 0.96 −1.12 0.26 NA
Rcvd ANY health services* 582 531 0.37 0.41 −0.14 0.12 1.34 0.25 0.87 Rcvd medical tx 472 442 0.27 0.27 −0.02 0.15 0.01 0.91 0.98 Rcvd dental tx 473 443 0.09 0.10 −0.09 0.22 0.17 0.68 0.91 Rcvd MH tx 470 440 0.07 0.09 −0.31 0.25 1.56 0.21 0.73 Rcvd substance use tx 474 443 0.18 0.21 −0.19 0.17 1.26 0.26 0.83 Rcvd group for abuse victims 476 445 0.02 0.00 2.08 1.06 3.81 0.05 7.99 Rcvd anger mgmt program 476 445 0.03 0.05 −0.41 0.35 1.38 0.24 0.66
Note: NA = Not applicable. MH = mental health. OR = odds ratio. Par. Est. = parameter estimate. p Val. = probability value. S = SVORI. SE = standard error. Wave 1 = 30 days pre-release; Wave 2 = 3 months post-release; Wave 3 = 9 months post-release; Wave 4 = 15 months post-release.
*Included for information; not included in bundle calculations

Self-reported Service Receipt
99
eighth at 3 months post-release (12.75 SVORI, 11.06 non-SVORI). The most commonly reported health service was medical treatment (23% to 30%), with similar percentages reporting receipt between the two groups. A slightly smaller percentage (18% to 28%) reported receiving substance abuse treatment since the previous interview. Less than 10% reported receiving dental care. Anger management programming was also reported to have been received by less than 10% following release, although more than 25% of respondents said they needed anger management programming.
DOMESTIC VIOLENCE SERVICES Subjects were asked about their participation in domestic
violence support groups or batterer intervention programs—
services that were ranked as low-need by most of the men (see
Exhibit 54). About 10% of respondents (9% SVORI, 11% non-
SVORI) reported needing domestic violence support groups or
batterer intervention programs at the pre-release interview (see
Exhibit 43), about the same percentage who reported receiving
services. Exhibit 54 shows the proportion of subjects who
reported participating in these two programs. SVORI program
participants were more likely pre-release to have participated in
a domestic violence group (10% versus 6%), but post-release
few subjects reported participating and there were no
differences between the two groups.
CHILD SERVICES More than 60% of the men reported having children, as noted
earlier. The most commonly reported child-related needs were
help with modifying child support payments, but many also
indicated a need to improve their parenting skills. As shown in
Exhibit 55, 34% of SVORI program participants and 22% of non-
SVORI comparison subjects reported receiving any child-related
services while they were in prison. The most commonly reported
services were assistance modifying child support debt and
participation in parenting skills classes. SVORI participants were
significantly more likely to report receiving these two services.

Prisoner reentry experiences of adult males
100
Exhibit 54. Weighted means for domestic violence services receipt bundles and items, by group and wave
Variable S N
Non-SVORI
N S
Mean
Non-SVORIMean
Par.Est. SE
Test Stat. p Val. OR
Wave 1 DomViolScore 863 834 7.43 4.72 2.71 1.00 2.71 0.01 NA
Rcvd ANY DV services* 863 834 0.11 0.07 0.53 0.18 9.02 0.00 1.70 Rcvd batterer intervention program
862 834 0.05 0.04 0.28 0.25 1.29 0.26 1.33
Rcvd DV support group 863 834 0.10 0.06 0.60 0.19 10.02 0.00 1.82 Wave 2 DomViolScore 529 455 0.97 1.17 −0.21 0.60 −0.35 0.73 NA
Rcvd ANY DV services* 529 455 0.01 0.02 −0.19 0.54 0.12 0.72 0.83 Rcvd batterer intervention program
529 455 0.01 0.01 0.04 0.68 0.00 0.96 1.04
Rcvd DV support group 529 455 0.01 0.02 −0.35 0.56 0.40 0.53 0.70 Wave 3 DomViolScore 540 444 1.35 1.40 −0.05 0.64 −0.07 0.94 NA
Rcvd ANY DV services* 565 470 0.02 0.02 −0.10 0.44 0.05 0.83 0.91 Rcvd batterer intervention program
540 444 0.01 0.01 −0.40 0.77 0.27 0.60 0.67
Need DV support group 540 444 0.02 0.02 0.11 0.47 0.05 0.82 1.11 Wave 4 DomViolScore 476 445 1.02 1.64 −0.62 0.67 −0.92 0.36 NA
Rcvd ANY DV services* 582 531 0.01 0.02 −0.76 0.51 2.24 0.13 0.47 Rcvd batterer intervention program
476 445 0.01 0.01 −0.31 0.74 0.18 0.67 0.73
Rcvd DV support group 476 445 0.01 0.02 −0.57 0.53 1.15 0.28 0.57 Note: NA = Not applicable. OR = odds ratio. Par. Est. = parameter estimate. p Val. = probability value. S = SVORI.
SE = standard error. Wave 1 = 30 days pre-release; Wave 2 = 3 months post-release; Wave 3 = 9 months post-release; Wave 4 = 15 months post-release.
*Included for information; not included in bundle calculations
Receipt of child-related services dropped dramatically following
release. Only 8% of SVORI and 3% of non-SVORI subjects
reported receiving any child-related services at the 3-month
post-release interview, and the percentages declined in
subsequent interviews.
SUMMARY AND CONCLUSIONS Overall, the examination of service receipt shows that the men who enrolled in SVORI programming received substantially higher levels of services than men who received “treatment as usual.” Although programming was concentrated on the pre-release phase (i.e., levels of service receipt were dramatically
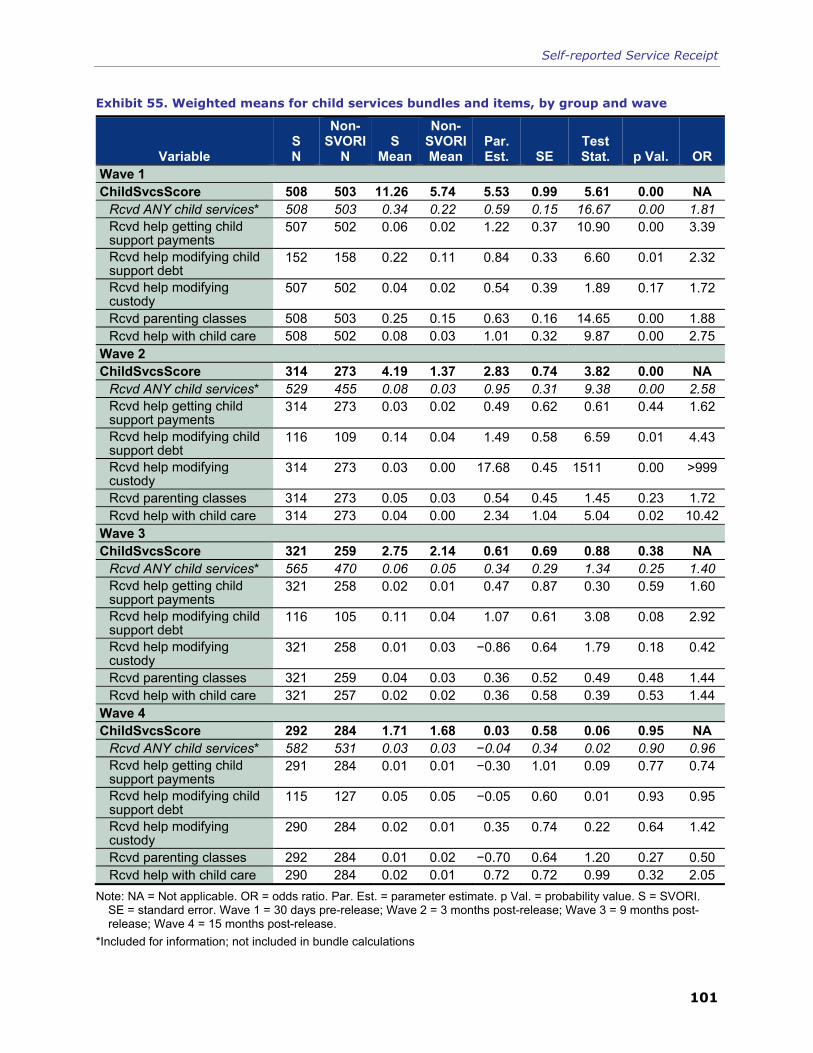
Self-reported Service Receipt
101
Exhibit 55. Weighted means for child services bundles and items, by group and wave
Variable S N
Non-SVORI
N S
Mean
Non-SVORIMean
Par.Est. SE
Test Stat. p Val. OR
Wave 1 ChildSvcsScore 508 503 11.26 5.74 5.53 0.99 5.61 0.00 NA
Rcvd ANY child services* 508 503 0.34 0.22 0.59 0.15 16.67 0.00 1.81 Rcvd help getting child support payments
507 502 0.06 0.02 1.22 0.37 10.90 0.00 3.39
Rcvd help modifying child support debt
152 158 0.22 0.11 0.84 0.33 6.60 0.01 2.32
Rcvd help modifying custody
507 502 0.04 0.02 0.54 0.39 1.89 0.17 1.72
Rcvd parenting classes 508 503 0.25 0.15 0.63 0.16 14.65 0.00 1.88 Rcvd help with child care 508 502 0.08 0.03 1.01 0.32 9.87 0.00 2.75
Wave 2 ChildSvcsScore 314 273 4.19 1.37 2.83 0.74 3.82 0.00 NA
Rcvd ANY child services* 529 455 0.08 0.03 0.95 0.31 9.38 0.00 2.58 Rcvd help getting child support payments
314 273 0.03 0.02 0.49 0.62 0.61 0.44 1.62
Rcvd help modifying child support debt
116 109 0.14 0.04 1.49 0.58 6.59 0.01 4.43
Rcvd help modifying custody
314 273 0.03 0.00 17.68 0.45 1511 0.00 >999
Rcvd parenting classes 314 273 0.05 0.03 0.54 0.45 1.45 0.23 1.72 Rcvd help with child care 314 273 0.04 0.00 2.34 1.04 5.04 0.02 10.42
Wave 3 ChildSvcsScore 321 259 2.75 2.14 0.61 0.69 0.88 0.38 NA
Rcvd ANY child services* 565 470 0.06 0.05 0.34 0.29 1.34 0.25 1.40 Rcvd help getting child support payments
321 258 0.02 0.01 0.47 0.87 0.30 0.59 1.60
Rcvd help modifying child support debt
116 105 0.11 0.04 1.07 0.61 3.08 0.08 2.92
Rcvd help modifying custody
321 258 0.01 0.03 −0.86 0.64 1.79 0.18 0.42
Rcvd parenting classes 321 259 0.04 0.03 0.36 0.52 0.49 0.48 1.44 Rcvd help with child care 321 257 0.02 0.02 0.36 0.58 0.39 0.53 1.44
Wave 4 ChildSvcsScore 292 284 1.71 1.68 0.03 0.58 0.06 0.95 NA
Rcvd ANY child services* 582 531 0.03 0.03 −0.04 0.34 0.02 0.90 0.96 Rcvd help getting child support payments
291 284 0.01 0.01 −0.30 1.01 0.09 0.77 0.74
Rcvd help modifying child support debt
115 127 0.05 0.05 −0.05 0.60 0.01 0.93 0.95
Rcvd help modifying custody
290 284 0.02 0.01 0.35 0.74 0.22 0.64 1.42
Rcvd parenting classes 292 284 0.01 0.02 −0.70 0.64 1.20 0.27 0.50 Rcvd help with child care 290 284 0.02 0.01 0.72 0.72 0.99 0.32 2.05
Note: NA = Not applicable. OR = odds ratio. Par. Est. = parameter estimate. p Val. = probability value. S = SVORI. SE = standard error. Wave 1 = 30 days pre-release; Wave 2 = 3 months post-release; Wave 3 = 9 months post-release; Wave 4 = 15 months post-release.
*Included for information; not included in bundle calculations

Prisoner reentry experiences of adult males
102
higher at that time period than at any of the post-release time periods), SVORI appeared to increase access to services well beyond release. Even 15 months after release, the SVORI group still reported significantly higher rates of service receipt than the non-SVORI group in many service areas.
The services that men were most likely to receive pertained to the coordination of services, including post-release supervision, case management, and working with someone to reintegrate into society. SVORI participants were more likely to receive transition services pre-release and through 9 months post-release. Prior to release, most SVORI participants participated in programs or classes to prepare for release and were also significantly more likely than non-SVORI respondents to report receiving the 10 services included in the transition bundle, with help obtaining documents for employment being the most likely service reported.
Although most adult SVORI programs listed employment as one of their priorities and most men reported needing help finding employment, most men enrolled in SVORI programs did not report receiving employment-related services. Prior to release, only 37% of SVORI program participants (compared to 20% of non-SVORI respondents) reported that they had received any employment-related services while incarcerated—about the same as the 34% of SVORI participants who reported having received employment-related services during the 3 months following release.
SVORI program participants were also much more likely than non-SVORI respondents to report having received programs such as cognitive behavior therapy that were directed at changing their attitudes about criminal behavior—change that some have suggested is a prerequisite to affecting recidivism. About half (51%) of SVORI participants reported participating in such programs prior to release compared to 36% of non-SVORI respondents.
Despite the increase in access to services afforded to those participating in SVORI programs, the proportions of SVORI program participants who received the service items were usually substantially less than 100%. Although need clearly should drive the receipt of services in the sense that individuals should not receive unneeded services, need exceeded service receipt for most service items. Overall, aggregate levels of
SVORI program participation greatly increased the likelihood of receiving a wide range of services, but levels of participation were less than reported needs.

Self-reported Service Receipt
103
service receipt were substantially lower than aggregate levels of service need (across all bundles and time periods, and among both groups). For example, most men reported needing employment, education, and skills services, and only about half (51%) of SVORI participants reported receiving any education-related services and only 37% reported receiving any employment-related services while they were incarcerated. These levels were much higher, however, than what was observed post-release, as only 34% of SVORI program participants reported receiving any employment services during the 3 months following release.
The chapter that follows reports the impact of SVORI programming on several key domains. Detailed findings for housing, employment, family/peer/community outcomes, substance abuse and physical and mental health, and criminal behavior/recidivism are presented.

105
OOuuttccoommeess
The purpose of the multi-site evaluation was to identify the impact of SVORI program participation on a range of post-release outcomes, with a primary goal of examining the impact of SVORI program participation on recidivism. The SVORI programs were intended to affect a range of outcomes that have been linked to recidivism, including housing, employment, and substance use, using a case managed or wraparound approach to provide integrated services based on individual needs assessments.
The implicit SVORI program model linking inputs, services, and outcomes is shown in Exhibit 56. This presentation of the program model makes clear that most services are intended to affect intermediate outcomes which, in turn, are then assumed to be correlated with improvements in criminal behavior. (Only programs directed at changing attitudes towards criminal behavior were envisioned to directly affect post-release criminal behavior). Under this model, the outputs (services) directly affect the intermediate outcomes that, in turn, impact the criminal behavior outcomes. For example, suppose employment services increase the likelihood of employment by 20% and being employed reduces the likelihood of recidivism by 20%, then receiving employment services would be associated with a 4% reduction in recidivism. Of course, the SVORI program participants (and, to a lesser extent, the non-SVORI respondents) received a variety of different services, each of which could impact one or more intermediate outcomes that could impact recidivism. There is little theoretical or empirical guidance for the correct specification of such a complex recidivism model and, thus, the approach to the outcome analyses was to test first-order effects of SVORI program participation on each of the identified outcomes.
…the approach to the outcome analyses was to test first-order effects of SVORI program participation on each of the identified outcomes.

Prisoner reentry experiences of adult males
106
Exhibit 56. SVORI Program Model
The previous chapter showed that SVORI program participants were more likely than non-participants to report receiving a wide range of reentry services, although the levels of service provision were less than reported needs. Further, most service provision was concentrated in the incarceration phase of the program and diminished following release. In this chapter, a wide range of outcomes are examined across the domains of interest to the SVORI—housing, family and community, employment, physical and mental health (including substance use), and criminal behavior.
The effect of SVORI program participation on individual outcomes was assessed by estimating a series of models in which the outcome variables were regressed on the dichotomous SVORI indicator variable (see the Introduction to this report and Lattimore & Steffey, 2009). Weights to control for observed differences between the SVORI and non-SVORI groups were applied in the estimation of these outcome models. The weights were based on propensity scores that provided individual-level estimates of the probability of

Outcomes
107
assignment to a SVORI program.34 The weights were incorporated into the regression models using the survey procedures in SAS® 9.1. Proc Survey Means was used to generate weighted group means by group. This procedure produces weighted means but not weighted standard errors. So, to provide tests of significance of the effect of SVORI program participation on outcomes, a second set of models was estimated in which the outcome variables were regressed on the dichotomous SVORI indicator variable using Proc Survey Logistic or Regression for dichotomous or continuous dependent variables, respectively. The odds ratios from the logistic regressions provide one measure of treatment effects. The percentage difference between SVORI and non-SVORI weighted means provides another.
The following sections address the impact of SVORI program participation on outcomes in the following domains: housing; employment; family, peers, and community involvement; substance use and physical and mental health; and criminal behavior and recidivism.
HOUSING As reported in the Introduction, the SVORI PDs said that 54% of SVORI participants would receive housing placements or referrals pre-release and 66% would be assisted post-release (see Exhibit 3). The SVORI evaluation participants were much less likely to report receiving help with housing. Pre-release, 28% of SVORI participants (compared to 13% of non-SVORI respondents) reported help with housing, a percentage that declined to 12% 3 months post-release (compared to 11% of non-SVORI; see Exhibit 52). Thus, most of SVORI respondents reported receiving no help with housing. Three “core” housing outcomes were housing independence, housing stability, and the extent of challenges faced in locating housing after release. Prior to discussing these outcomes, data are presented on the housing experiences of these men prior to and following incarceration.
34 The propensity score model used observed characteristics to model
the likelihood that an individual with specified characteristics would be selected or assigned to treatment, in this case to a SVORI program. A logit model was estimated in SAS® 9.1.3 using PROC MI and PROC MIANALYZE to accommodate item missingness, which was relatively rare. Thirty-one independent variables were included in this model. See Lattimore and Steffey (2009) for details.

Prisoner reentry experiences of adult males
108
In the 6 months prior to their current incarceration, 13% of the men reported that they were homeless, staying in a shelter, or had no set place to stay. Following release, most were not homeless—less than 5% of either group reported homeless status during the periods since the previous interview. Exhibit 57 shows the percentage of each group reporting being homeless, living in a shelter, or without a set place to live in the 6 months prior to incarceration (Wave 1 interview conducted 30 days prior to release) or since the previous interview35 (Waves 2 through 4 interviews conducted 3, 9, and 15 months post-release). Thus, self-reported housing difficulties were lower following release than prior to incarceration, although it is possible that there was higher nonresponse for unhoused individuals in the post-release interviews.
13%
1% 1% 3%13%
1% 3% 4%0%
20%
40%
60%
80%
100%
Wave 1 Wave 2 Wave 3 Wave 4
SVORI
Non-SVORI
Note: Differences between SVORI and non-SVORI were not significant at the 0.05 level. (Wave 3 difference was significant at the 0.06 level.)
The respondents also reported with whom they were living. Depending on the interview wave, 7% to 11% of the men reported that they were living alone. The most common categories of people with whom the men reported living were
35 Individuals who missed the previous follow-up interview were asked
about the 6 months prior to the current interview. Individuals who were reincarcerated were asked about the period immediately prior to their current incarceration. Individuals who had been incarcerated for the entire period since the last interview were coded as missing on housing questions.
Exhibit 57. Self-reported homeless, living in a shelter, or without a set place to live, by group and wave

Outcomes
109
their mother/stepmother and boy/girlfriend/fiancé.36 Exhibit 58 shows the percentages of each group that reported living with their mother/stepmother or father/stepfather. More than one third of the men were living with their mothers during the period immediately following their release from prison, and about half that percentage reported living with their fathers. These percentages declined over time such that by 15 months post-release only about one quarter reported living with their mothers.
35
18
33
15
30
17
29
14
26
13
27
14
0%
20%
40%
60%
80%
100%
Mother/stepmother Father/stepfather
SVORI-2 Non-SVORI-2SVORI-3 Non-SVORI-3SVORI-4 Non-SVORI-4
Note: Differences between SVORI and non-SVORI were not significant at the 0.05 level.
Exhibit 59 shows the percentages of each group that reported living with partners, spouses, or children over the 15 months following their release. As can be seen, the number reporting living with spouses increased over time, as did the number reporting living with children. The complete responses to the questions related to with whom the respondent was living are included as Exhibit A-5 in Appendix A.
The co-residence patterns were similar for the SVORI and non-SVORI groups, with the only significant differences being that the non-SVORI group was significantly more likely to report living with a boyfriend/girlfriend/fiancé at the 9-month
36 Subjects were allowed to select as many as applied; for example,
someone could indicate that they were living with their mother, father, and brother(s). On average, the respondents indicated they were living with individuals in less than two categories.
Exhibit 58. Percentages living with mothers or fathers post-release, by group (SVORI and non-SVORI) and post-release follow-up wave (2, 3, and 4)

Prisoner reentry experiences of adult males
110
18
713
19
913
23
917
29
1017
27
1018
26
1219
0%
20%
40%
60%
80%
100%
Boy/girlfriend,fiance Husband/wife Child/step
SVORI-2 Non-SVORI-2SVORI-3 Non-SVORI-3SVORI-4 Non-SVORI-4
Note: Non-SVORI comparisons were more likely to report living with a boy/girlfriend/fiancé at the 9 month interview; other differences between SVORI and non-SVORI were not significant at the 0.05 level
interview and significantly more likely to report living with a grandparent at the 15-month interview.
Three dimensions of housing—housing independence, housing stability, and the extent of challenges faced in locating housing—were examined as reentry outcomes. The SVORI and non-SVORI groups were compared on these outcomes at 3, 9, and 15 months post-release. Exhibit 60 shows the weighted proportion of men in each group (with estimates, standard errors, and odds ratios from the logistic regression models) who
were classified as “housing independent” (defined as living in their own house or apartment, contributing to the costs of housing, or having their name on the lease or mortgage of the place where they currently lived);
were classified as having stable housing (defined as having lived in only one place during the reference period or two places if the move was to secure their own place or a nicer place); and
did not experience housing challenges (respondents were classified as not having housing challenges if they were not homeless, reported that they did not have trouble finding a place to live, and reported that their current living situation was better or about the same as their last one).
Exhibit 59. Percentages living with partners, spouses, or children post-release, by group (SVORI and non-SVORI) and post-release follow-up wave (2, 3, and 4)
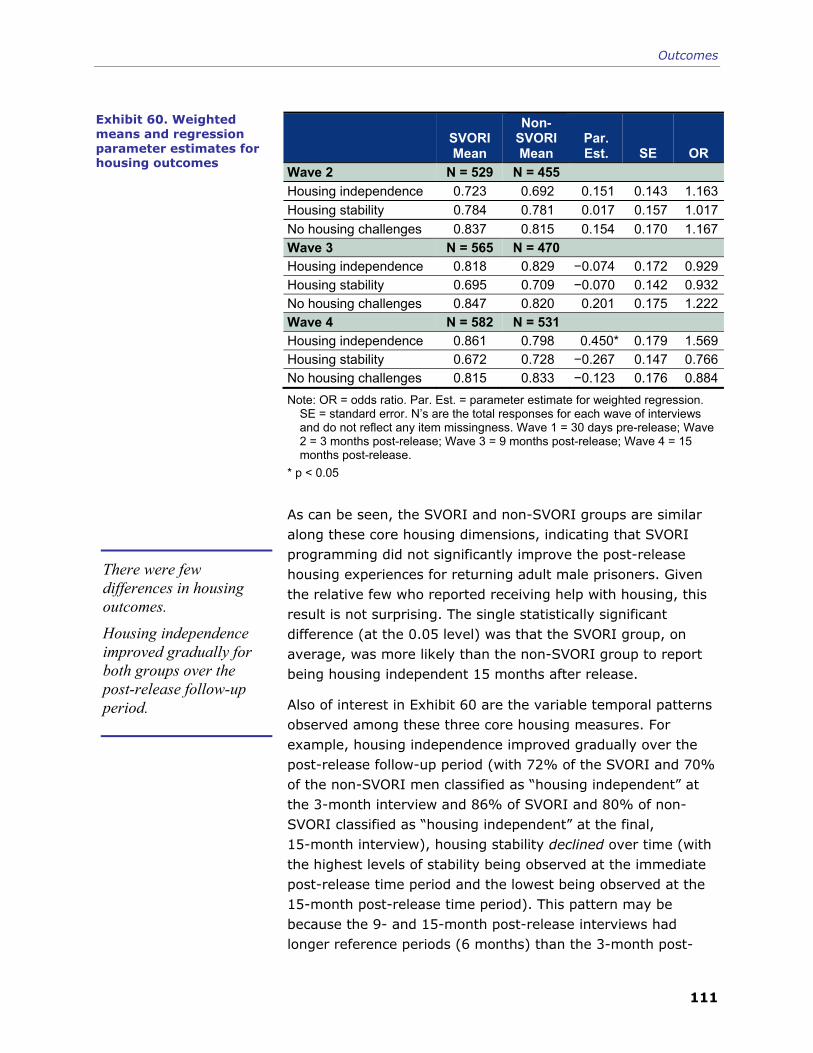
Outcomes
111
SVORI Mean
Non-SVORI Mean
Par. Est. SE OR
Wave 2 N = 529 N = 455 Housing independence 0.723 0.692 0.151 0.143 1.163Housing stability 0.784 0.781 0.017 0.157 1.017No housing challenges 0.837 0.815 0.154 0.170 1.167Wave 3 N = 565 N = 470 Housing independence 0.818 0.829 −0.074 0.172 0.929Housing stability 0.695 0.709 −0.070 0.142 0.932No housing challenges 0.847 0.820 0.201 0.175 1.222Wave 4 N = 582 N = 531 Housing independence 0.861 0.798 0.450* 0.179 1.569Housing stability 0.672 0.728 −0.267 0.147 0.766No housing challenges 0.815 0.833 −0.123 0.176 0.884Note: OR = odds ratio. Par. Est. = parameter estimate for weighted regression.
SE = standard error. N’s are the total responses for each wave of interviews and do not reflect any item missingness. Wave 1 = 30 days pre-release; Wave 2 = 3 months post-release; Wave 3 = 9 months post-release; Wave 4 = 15 months post-release.
* p < 0.05
As can be seen, the SVORI and non-SVORI groups are similar along these core housing dimensions, indicating that SVORI programming did not significantly improve the post-release housing experiences for returning adult male prisoners. Given the relative few who reported receiving help with housing, this result is not surprising. The single statistically significant difference (at the 0.05 level) was that the SVORI group, on average, was more likely than the non-SVORI group to report being housing independent 15 months after release.
Also of interest in Exhibit 60 are the variable temporal patterns observed among these three core housing measures. For example, housing independence improved gradually over the post-release follow-up period (with 72% of the SVORI and 70% of the non-SVORI men classified as “housing independent” at the 3-month interview and 86% of SVORI and 80% of non-SVORI classified as “housing independent” at the final, 15-month interview), housing stability declined over time (with the highest levels of stability being observed at the immediate post-release time period and the lowest being observed at the 15-month post-release time period). This pattern may be because the 9- and 15-month post-release interviews had longer reference periods (6 months) than the 3-month post-
Exhibit 60. Weighted means and regression parameter estimates for housing outcomes
There were few differences in housing outcomes.
Housing independence improved gradually for both groups over the post-release follow-up period.

Prisoner reentry experiences of adult males
112
release interview (3 months) so that respondents had more opportunities to experience instability during the 9- and 15-month interviews. There was little difference over time in the measure of housing challenges, which is perhaps the broadest measure of difficulty in finding quality housing. Specifically, the percentages of men in both groups indicating they had experienced housing challenges ranged from 81% to 84% across the three follow-up interviews.
In addition to the three core housing measures, several other dimensions of housing were measured that provide insight into the men’s overall post-release housing experiences. For example, one of the individual measures that was included in the “housing independence” measure was whether the respondent lived in his own house or apartment, lived in someone else’s house or apartment, or was homeless, living in a shelter, or without a set place to live. Exhibit 61 shows the percentage of men in each group who reported that they were living in their own homes at each follow-up. As can be seen, SVORI program participants were more likely than non-SVORI comparison subjects to report that they were living in their own house or apartment, although differences (as measured by the significance of the logistic regression parameter estimate) were not significant at the 0.05 level (p values were 0.1, 0.15 and 0.08, for Waves 2, 3, and 4). Further, the percentages of both groups reporting living in their own places increased over time.
2536 37
2131 32
0%
20%
40%
60%
80%
100%
Wave 2 Wave 3 Wave 4
SVORI
Non-SVORI
Note: Wave 1 = 30 days pre-release; Wave 2 = 3 months post-release; Wave 3 = 9 months post-release; Wave 4 = 15 months post-release.
Exhibit 61. Percentage reporting living in own house or apartment; weighted means by group and follow-up wave

Outcomes
113
Another individual component of housing independence also showed improvement (for both the SVORI and non-SVORI groups) during the post-release follow-up period. Specifically, the percentage of men who contributed to housing costs increased for SVORI program participants from 70% at 3 months to 79% at 9 months to 85% at 15 months. The percentages also increased for non-SVORI comparison subjects, rising from 67% at 3 months post-release to 81% at 9 months before dropping to 78% at 15 months post-release. SVORI program participants were more likely to report having their name on the mortgage or lease at 3 months post-release—22% versus 16%. Smaller, but insignificant differences persisted at 9 and 15 months (29% versus 25% at 9 months and 35% and 31% at 15 months).
Neighborhood quality was a final relevant dimension of housing. At each post-release interview the men were asked a series of questions about the quality of the neighborhoods in which they lived. The following items were combined to create a score measuring neighborhood quality:
“It is hard to stay out of trouble in your neighborhood.”
“Drug selling is a major problem in your neighborhood.”
“You think your neighborhood is a good place to live.”
“You think your neighborhood is a good place to find a job.”
“Living in your neighborhood makes it hard to stay out of incarceration.”
When the mean neighborhood quality scores at the three post-release time periods were examined, little variability over time was found (weighted means on the 15-point scale ranged from 9.3 to 10 across the groups and follow-up periods), indicating that the men in both groups had similar perceptions of the neighborhoods in which they were living at each time period at which they were interviewed.
EMPLOYMENT Employment was a primary focus of many of the SVORI programs, and all 12 adult impact site Program Directors felt that it would be fair to determine program effectiveness by examining employment (see Exhibit 2). Employment was also of considerable importance to the subjects, who consistently

Prisoner reentry experiences of adult males
114
indicated high levels of need for services to improve their employment, education, and other skills (see Exhibit 40). As was shown in the previous chapter, the SVORI programs were successful in increasing the likelihood that individuals received employment-related services during confinement and during the first few months following release (see Exhibit 51). However, levels were far less than reported need, which neared 100% for all respondents. Specifically, only 37% of SVORI program participants (compared with 20% of non-SVORI) reported receiving, during their incarcerations, any employment-related services (such as employment readiness classes, help preparing a resume, advice about interviewing, or names of potential employers). Further, only 25% of SVORI program participants (compared with 16% of non-SVORI) received help obtaining documents related to employment such as Social Security cards or birth certificates.
Most of the respondents (64% SVORI, 68% non-SVORI; t-statistic = −2.04) reported working in the 6 months prior to incarceration and about 60% (59% SVORI, 62% non-SVORI; t-statistic = −0.87) reported that they had supported themselves with jobs during that same period. Of those working, three quarters (75% SVORI, 73% non-SVORI; t-statistic = 0.65) indicated the job was permanent. More than half (57%) of those who had worked expected to be able to return to a previous job.
Extensive data were collected from respondents to assess their post-release employment experiences. Of these measures, several core employment outcomes were identified:
current support of oneself with a job;
the number of months worked during the reference period;
worked for each month during the reference period;
the number of months at which the same job was held;
receipt of formal pay from a job; and
whether the job provided benefits (a summary measure indicating whether the job provided health insurance or paid leave).
The results for these outcomes at 3, 9, and 15 months post-release are shown in Exhibit 62.

Outcomes
115
SVORI Mean
Non-SVORI Mean
Par. Est.
p Value OR
Wave 2 N = 529 N = 455 Support self with job 0.64 0.59 0.230 0.086 1.258Number months worked 2.04 1.96 0.079 0.420 NA Worked each month 0.38 0.39 −0.056 0.716 0.945Received formal pay 0.84 0.74 0.604 0.001 1.829Job benefits 0.47 0.39 0.337 0.028 1.400Wave 3 N = 565 N = 470 Support self with job 0.68 0.68 0.027 0.848 1.027Number months worked 3.83 3.73 0.102 0.536 NA Worked each month 0.43 0.44 −0.033 0.823 0.968Received formal pay 0.80 0.77 0.178 0.310 1.195Job benefits 0.53 0.42 0.472 0.001 1.602Wave 4 N = 582 N = 531 Support self with job 0.71 0.60 0.481 0.001 1.617Number months worked 3.70 3.50 0.197 0.252 NA Worked each month 0.44 0.42 0.045 0.772 1.046Received formal pay 0.78 0.74 0.183 0.306 1.201Job benefits 0.52 0.44 0.326 0.034 1.386Note: OR = odds ratio. Par. Est. = parameter estimate for weighted regression.
NA = not applicable, since model was a regression. p value = probability value of test statistic. N’s are the total responses for each wave of interviews and do not reflect any item missingness. Wave 1 = 30 days pre-release; Wave 2 = 3 months post-release; Wave 3 = 9 months post-release; Wave 4 = 15 months post-release.
The results in Exhibit 62 suggest that SVORI program participants had better post-release employment experiences than the non-SVORI comparison subjects—if only moderately so. They were more likely to report that they were currently supporting themselves with a job at 3 and 15 months post-release. They reported working about the same number of months on average—about two thirds of the available months (2 of 3 months immediately following release, and about 4 of 6 months at the 9- and 15-month interviews)—and were equally likely to have reported working all months in the reference period.
SVORI participants appear to have secured better jobs—jobs that provided formal pay and benefits. A breakdown of the benefits measure, which includes insurance and paid leave, is shown in Exhibit 63. As can be seen, SVORI program participants were more likely than non-SVORI respondents to
Exhibit 62. Weighted means and regression parameter estimates for employment outcomes
Although SVORI program participation was not associated with increased likelihood of having a job, SVORI program participants were more likely to report supporting themselves with a job and having a job with formal pay and benefits.

Prisoner reentry experiences of adult males
116
36 3529 33
44 4133 32
474036 37
0%
20%
40%
60%
80%
100%
Insurance Paid leave
SVORI-2 NON-SVORI-2SVORI-3 NON-SVORI-3SVORI-4 NON-SVORI-4
report having formal pay and benefits across all waves, but the most substantial differences are in having a job that provides insurance. Differences between SVORI and non-SVORI in reported insurance is significant at p < 0.1 at 3 months and p < 0.05 at 9 and 15 months. The difference in paid leave is significant at the p < 0.05 level at 9 months.
Another measure of potential interest is hours worked. SVORI program participants who reported working reported more hours worked at 3 and 15 months post-release (39.6 for SVORI, 37.9 for non-SVORI at 3 months; 42.5 for SVORI, 41.4 for non-SVORI at 15 months). There was no difference at 9 months (40.9 for SVORI, 40.4 for non-SVORI). Additionally, SVORI program participants were more likely to report not having problems finding a job (30% versus 25% at 3 months; 35% versus 32% at 9 months; and 37% versus 30% at 15 months; the latter difference was significant at the .05 level).
Program effects were identified, and men’s post-release employment situations were compared to their preincarceration employment experiences. Exhibit 64 shows the percentage of each group who reported supporting themselves with a job in the preceding period (6 months prior to incarceration or since the last interview or equivalent time period). As can be seen, supporting oneself with a job was reported at a higher rate than in the pre-release interview at all post-release interviews (Waves 2 through 4) for SVORI program participants, whereas non-SVORI respondents were about equally as likely as their
Exhibit 63. Weighted means for self-report that job provides insurance or paid leave, by group (SVORI, non-SVORI) and data collection wave (2, 3, or 4)

Outcomes
117
5964 68 71
62 5968
60
0%
20%
40%
60%
80%
100%
Wave 1 Wave 2 Wave 3 Wave 4
SVORI
Non-SVORI
Note: Wave 1 = 30 days pre-release; Wave 2 = 3 months post-release; Wave 3 = 9 months post-release; Wave 4 = 15 months post-release.
preincarceration experience to report supporting themselves with jobs at 3 and 15 months.
Finally, very few men reported receiving money from illegal activities across all three post-release time periods, in contrast to the 6 months prior to incarceration. About 5% of both groups reported receiving money from illegal activity during the 3 months post-release, a percentage that increased to about 10% for both groups at 9 and 15 months post-release. These percentages are in comparison to the more than half (56% SVORI, 54% non-SVORI) who reported receiving money from illegal activity during the 6 months prior to incarceration.
In summary, SVORI program participation led to modest increases in employment-related services. Although SVORI program participation appeared to have had little impact on whether someone was working, program participation was associated with modest improvements in several employment-related outcomes.
FAMILY, PEERS, AND COMMUNITY INVOLVEMENT
Family Relationships
Family relationships have been shown to be extremely influential for returning prisoners. However, because none of the adult SVORI programs focused on family services, no
Exhibit 64. Weighted means for self-report of supporting self with a job, by group and data collection wave

Prisoner reentry experiences of adult males
118
family-related measures were identified as key outcomes. However, several aspects of family relationships, including family emotional support, family instrumental support, quality of intimate-partner relationships, and quality of relationship with children were examined. Not surprisingly, given the lack of emphasis on family-related services among the SVORI programs, few differences between the SVORI and non-SVORI groups were observed in these measures at any of the post-release time periods. In addition, for both groups, the levels of family emotional support, family instrumental support and the quality of intimate-partner relationships declined over the three post-release time periods; little variation was observed (for both groups) over the three post-release time periods in the scale measuring the quality of relationship with their children (for those with children).
Exhibit 65 shows the percentage of men at each interview who reported (1) being married and (2) being married or in a steady relationship. Although the proportions of men who reported being currently married (9–13%) were similar across all time periods, the men were more likely to report intimate partnerships at all post-release time periods than during the preincarceration time period. Interestingly, the percentages reporting being in a steady relationship or married declined from the 9-month to the 15-month period, perhaps reflecting the fact that substantial numbers of these subjects were reincarcerated by 15 months, as reported later in this chapter.
Somewhat fewer than two thirds of the men reported having children (62% of SVORI, 64% of non-SVORI) at the pre-release interview—percentages that remained fairly constant over the three post-release interviews. Only about one third of those who reported having children said that they had been required to pay child support prior to their incarceration. Following release, about two thirds of those required to make payments said that they were making the required child support payments.

Outcomes
119
Exhibit 65. Marital status and intimate partnerships by group and wave
9
39
10
40
9
58
11
57
10
64
11
64
11
56
13
58
0%
20%
40%
60%
80%
100%
Married Married/Steady Relationship
SVORI-1 Non-SVORI-1 SVORI-2Non-SVORI-2 SVORI-3 Non-SVORI-3
Peer Relationships
Peer relationships may be influential for returning prisoners. Importantly, as with family relationships, peer relationships may be both positive and negative. For example, receiving critical instrumental support from peers, such as help with rides to appointments, may be beneficial. On the other hand, if one’s peers are criminally involved, such relationships may be detrimental to reentry success.
Because many SVORI programs included cognitive-behavioral components intended to teach inmates to change criminal behavior by modifying which individuals they associated with (among other topics), it was appropriate to measure the “negative exposure” reported by the men both from friends with whom they spent time and from individuals with whom they lived. A summary measure of negative exposure was developed that included indicators of the extent to which the respondent reported the following:
living with people who had ever been incarcerated, used illegal drugs, engaged in any other illegal activity, or used alcohol in their presence
Prisoner reentry experiences of adult males
120
spending time with friends who were not employed, got them “in trouble,” had been incarcerated, had assaulted someone, had committed theft, or had sold drugs
The composite measure has a range of from 0 to 14 and is coded such that higher values indicate less negative exposure. The results for this measure suggested that there was little difference between groups or across the post-release time periods, as weighted averages ranged between 10.8 and 11.3.
Most men (81%) reported that prior to incarceration they had friends who had been incarcerated. They were asked in the follow-up interviews whether they had close friends who had been incarcerated. Most said they did, although the percentage declined over time—from about 74% (both groups) at 3 months to less than 70% at 15 months.
Positive peer support was also measured. Specifically, the men were asked about the following types of instrumental support from their friends:
help or advice on finding a place to live;
help or advice on finding a job;
support for dealing with a substance abuse problem;
transportation to work or other appointments, if needed; and
financial support.
There was little variation across post-release time periods or between groups in this measure, which could have values of from 0 to 15, with higher scores indicating more instrumental support. Across the three waves, weighted average scores ranged from 9.3 to 9.9, with no difference between the groups.
Community Involvement
To assess the extent to which men became involved in their communities after release, they were asked whether they had (1) done volunteer work in any programs in the community (e.g., youth groups, programs for the elderly); (2) done mentoring with peers, youth, or other community members; (3) participated in any local organizations like clubs, sports teams, ethnic or racial pride groups, political organizations, or other community groups; (4) voted in any political election (including general elections, primary elections, and special referendums); or (5) served in a Neighborhood Watch or tenant

Outcomes
121
patrol program.37 A dichotomous measure was developed that was equal to 1 if the respondent reported doing any of the activities in the period since the previous interview.
As shown in Exhibit 66, civic action was low for both groups, although it increased over time—particularly for SVORI program participants such that by 15 months post-release SVORI participants were significantly more likely to report participating in one or more of the civic measures than the non-SVORI comparison subjects.
25 2934
24 27 28
0%
20%
40%
60%
80%
100%
Wave 2 Wave 3 Wave 4
SVORI
Non-SVORI
Note: Difference at Wave 4 is significant at p < 0.05. Wave 1 = 30 days pre-release; Wave 2 = 3 months post-release; Wave 3 = 9 months post-release; Wave 4 = 15 months post-release.
SUBSTANCE USE AND PHYSICAL AND MENTAL HEALTH
Substance Use
At the pre-release interview, about 95% of the men in this study reported having used drugs during their lifetimes and about two thirds reported having used drugs during the 30 days prior to their current incarceration. Drug use has been identified as a correlate of recidivism, and reducing drug use has been the focus of many interventions. For the 12 SVORI impact programs, PDs reported that less than half of SVORI program participants were participating in either comprehensive drug
37 The question initially included “participated in the activities of a
church, mosque, temple, or other religious group” in this measure, but later excluded the option to better capture the other measures (most participants participated only in church services).
Exhibit 66. Percentage reporting civic action since release/last interview
Prisoner reentry experiences of adult males
122
treatment programs or programs like Alcoholics Anonymous or Narcotics Anonymous (see Exhibit 3). These estimates were loosely consistent with the self-reports of the evaluation respondents: 48% of SVORI program participants reported receiving alcohol or drug treatment while incarcerated, significantly more than the 38% of non-SVORI respondents (see Exhibit 53). SVORI program participants were also somewhat more likely to report treatment in the immediate months following release (28% compared with 23%).
Substance use outcomes were measured both by self-report during all three follow-up interviews and by oral fluids drug tests administered to nonincarcerated respondents at the 3- and 15-month interviews. The results for the core substance use outcomes are shown in Exhibit 67. This exhibit shows abstinence measures, for example “no self-reported drug use.” Thus, higher percentages are better because they suggest less use.
Self-reported abstinence was generally higher for the SVORI group than for the non-SVORI group across all follow-up waves; in several cases these differences were statistically significant. Similar results obtained for the measure that combined either self-reported drug use over the past 30 days or confirmed (by drug tests) drug use, although these differences are not statistically significant.
The patterns for substance use, based on the combined self-report and drug test measures, are shown graphically in Exhibits 68 and 69. Exhibit 68 shows the percentages of both groups who reported no drug use since release (Wave 2) or the last interview (Wave 4) and who did not refuse or test positive on the drug test. Only about half of both groups reported no drug use or had a negative drug test at 30 days post-release. This proportion dropped to 40% or less at 15 months post-release.38 Exhibit 69 shows the percentages of each group who reported no drug use in the past 30 days and who did not refuse or test positive on the drug test. The results are similar to those in Exhibit 68 and suggest high levels of drug use by both groups.
38 Individuals who were incarcerated for the 6 months prior to the 15-
month interview were not asked about drug use, nor did they take a drug test.
Self-reported abstinence was generally higher for the SVORI group than for the non-SVORI group
Only about half of both groups reported no drug use or had a negative drug test at 30 days post-release.

Outcomes
123
Exhibit 67. Weighted means and regression parameter estimates for substance use outcomes
SVORI Mean
Non-SVORI Mean
Par. Est. p Value OR
Wave 2 N = 529 N = 455 No self-reported drug use 0.74 0.70 0.170 0.243 1.185 No self-reported drug use other than marijuana or steroids
0.85 0.85 −0.030 0.868 0.970
No self-reported drug use past 30 days 0.79 0.77 0.160 0.313 1.174 No self-reported drug use other than marijuana or steroids past 30 days
0.88 0.89 −0.066 0.747 0.936
No self-reported drug use past 30 days or positive drug test
0.54 0.52 0.093 0.475 1.098
Wave 3 N = 565 N = 470 No self-reported drug use 0.57 0.52 0.201 0.125 1.223 No self-reported drug use other than marijuana or steroids
0.74 0.71 0.177 0.227 1.194
No self-reported drug use past 30 days 0.69 0.62 0.301 0.028 1.351 No self-reported drug use other than marijuana or steroids past 30 days
0.81 0.79 0.088 0.589 1.092
No self-reported drug use past 30 days or positive drug test
— — — — —
Wave 4 N = 582 N = 531 No self-reported drug use 0.58 0.50 0.337 0.012 1.401 No self-reported drug use other than marijuana or steroids
0.78 0.72 0.311 0.045 1.365
No self-reported drug use past 30 days 0.66 0.62 0.1512 0.2784 1.163 No self-reported drug use other than marijuana or steroids past 30 days
0.82 0.80 0.168 0.326 1.182
No self-reported drug use past 30 days or positive drug test
0.46 0.43 0.118 0.381 1.126
Note: Par. Est. = parameter estimate for weighted regression. p value = probability value of test statistic. OR = odds ratio. N’s are the total responses for each wave of interviews and do not reflect any item missingness. Wave 1 = 30 days pre-release; Wave 2 = 3 months post-release; Wave 3 = 9 months post-release; Wave 4 = 15 months post-release.

Prisoner reentry experiences of adult males
124
5141
49
35
0%
20%
40%
60%
80%
100%
Wave 2 Wave 4
SVORI
Non-SVORI
Note: Difference at Wave 4 is significant at p < 0.1. Wave 1 = 30 days pre-release; Wave 2 = 3 months post-release; Wave 3 = 9 months post-release; Wave 4 = 15 months post-release.
5446
5243
0%
20%
40%
60%
80%
100%
Wave 2 Wave 4
SVORI
Non-SVORI
Note: Wave 1 = 30 days pre-release; Wave 2 = 3 months post-release; Wave 3 = 9 months post-release; Wave 4 = 15 months post-release.
Marijuana was by far the most common drug reported used in the self-reports of specific drug use. Additionally, over time, non-SVORI comparison subjects were less likely to report having not used marijuana such that the difference was significant at 15 months. At the 3-month post-release interview, 80% of SVORI and 76% of non-SVORI subjects reported no marijuana use. At 9 months post-release, 68% of SVORI and 63% of non-SVORI subjects reported no marijuana use. At the final follow-up interview, 66% of SVORI and 59% of non-SVORI subjects reported no marijuana use. Cocaine use was also reported—particularly during the later interviews. At 3
Exhibit 68. Percentages of each group who reported no drug use since release/last interview and had no positive drug test
Exhibit 69. Percentages of each group who reported no drug use in the past 30 days and had no positive drug test
Outcomes
125
months, 93% of both groups reported no cocaine use. At 9 months, 84% of SVORI and 87% of non-SVORI subjects reported no cocaine use. At 15 months, 88% of SVORI and 85% of non-SVORI subjects reported no cocaine use.
The results suggest that SVORI program participants were doing somewhat better with respect to drug use but that all men continued to be at high risk for continuing drug use.
Physical Health
Physical health services were not a major programmatic focus among the SVORI programs; therefore, no core physical health outcomes were identified as relevant for analysis of program effects in the evaluation. Of interest, however, is the physical health status of the men during the post-release time period. Several dimensions were measured in the post-release interviews, including specific physical health conditions experienced by the respondents (including asthma, chronic back pain, high blood pressure, arthritis, hepatitis B or C, heart trouble, diabetes, tuberculosis, and HIV/AIDS) and the SF-12 physical health scale, which measures five dimensions of physical health functioning (including moderate activities such as moving a table, climbing several flights of stairs, accomplishing less than one would have like to accomplished because of physical health, being limited in the kind of work or activities done as a result of physical health, and pain that interferes with normal work).
Based on a composite measure that summed the number of physical health conditions experienced by the men, the results suggest that members of both groups on average had less than one of the nine conditions, with no differences evident between the SVORI and non-SVORI groups and no temporal trend apparent during the post-release follow-up period. Likewise, the SVORI and non-SVORI groups scored similarly on the SF-12 physical health scale, with no evidence of temporal trends. The SF-12 is normed to an average of 50 (range of 0 to 100), with higher scores indicating better results. Across the three follow-up interviews, both groups averaged about 52. The post-release scores were slightly lower than the 53 that the groups scored on the Wave 1 interview. These findings suggest that no major differences in physical health status occurred throughout the entire observation period.

Prisoner reentry experiences of adult males
126
Mental Health
Two core mental health outcomes were identified: the SF-12 mental health scale (a measure of mental health functioning) and the GSI (an index of mental health status that ranges from 45 to 225, with higher scores indicating better status). There was no difference between the two groups at Wave 1 on either of these two scales. At Wave 1, the SVORI group averaged 48.9 on the SF-12 and 66.6 on the GSI; the non-SVORI group averaged 48.5 on the SF-12 and 68.1 on the GSI. These results suggest that pre-release, the non-SVORI group had slightly worse scores, but the differences were not significantly different. It is important to remember, however, that the non-SVORI group was more likely at Wave 1 to report needing mental health services a little or a lot (29% versus 22%) and also more likely to report needing mental health services a lot (10% versus 6%). The non-SVORI group was also more likely pre-release to report having received mental health treatment while they were incarcerated (20% versus 16%).
Exhibit 70 shows the results for the post-release interviews. As can be seen, SVORI group members had slightly better mental functioning as indicated by the SF-12 at 3 and 15 months post-release. Results were also better for SVORI group members at 15 months on the GSI-45.
SVORI Mean
Non-SVORI Mean Par. Est. p Value
Wave 2 N = 529 N = 455 SF-12 mental health 51.01 49.80 1.211 0.078 GSI-45 164.13 162.76 1.363 0.285
Wave 3 N = 565 N = 470 SF-12 mental health 48.82 48.13 0.692 0.332 GSI-45 160.56 160.82 −0.257 0.859
Wave 4 N = 582 N = 531 SF-12 mental health 48.82 47.15 1.666 0.018 GSI-45 161.06 158.25 2.810 0.046
Note: Par. Est. = parameter estimate for weighted regression. p value = probability value of test statistic. N’s are the total responses for each wave of interviews and do not reflect any item missingness. Wave 1 = 30 days pre-release; Wave 2 = 3 months post-release; Wave 3 = 9 months post-release; Wave 4 = 15 months post-release.
Exhibit 70. Weighted means and regression parameter estimates for mental health outcomes

Outcomes
127
Focusing on these key outcomes, there is some evidence that SVORI program participation had an impact on the mental health status of men. In addition, as in the pattern observed for physical health, the mental health status of men remained fairly stable over time although weighted average scores diminished slightly over time.
CRIMINAL BEHAVIOR AND RECIDIVISM The SVORI logic model suggests that services that are responsive to needs will result in improvements in intermediate outcomes including housing, employment, and substance abuse. Improvements in these outcomes, in turn, are hypothesized to result in improvements in criminal behavior. Results presented here suggest that participants in SVORI programs were more likely to report receipt of a variety of services, although service receipt was far less than universal. Further, the SVORI program participants registered modest improvements in many measures of the intermediate outcomes. At issue is whether the observed differences in intermediate outcomes are sufficient to generate measurable differences in recidivism, even if the research hypothesis is correct.
Because of the importance of recidivism, multiple measures were included in the evaluation to determine program effects on desistance from criminal activity. These measures include self-reported and official measures of criminal behavior. Core criminal behavior/recidivism outcomes based on “unofficial” (i.e., self-reported) data sources are shown in Exhibit 71.
The first measure listed in the exhibit does not directly measure criminal behavior, but rather perpetration of violence. Respondents were asked about several specific types of violence: threatening to hit, throwing, pushing/grabbing/ shoving, slapping/kicking/biting/hitting, and threatening to use or using a weapon. The measure was scored 1 if the respondent answered yes to any of these queries and 0 otherwise. The men in the SVORI group were slightly less likely to report having perpetrated violence than the men in the comparison group at each post-release time period, but none of the differences was statistically significant. Interestingly, a measure parallel to the perpetration measure (but which assessed victimization) also

Prisoner reentry experiences of adult males
128
Exhibit 71. Weighted means and regression parameter estimates for core self-report recidivism outcomes
SVORI Mean
Non-SVORI Mean Par. Est. p Value OR
Wave 2 N = 529 N = 455 No perpetration of violence 0.73 0.71 0.117 0.422 1.124 Complied with conditions of supervision 0.78 0.78 0.005 0.977 1.005 No criminal behavior 0.79 0.73 0.327 0.034 1.386 No violent or weapons crimes 0.90 0.91 −0.076 0.732 0.927 Not reincarcerated at follow-up 0.93 0.92 0.235 0.352 1.265
Wave 3 N = 565 N = 470 No perpetration of violence 0.64 0.60 0.178 0.175 1.195 Complied with conditions of supervision 0.69 0.70 −0.025 0.881 0.975 No criminal behavior 0.64 0.59 0.207 0.112 1.230 No violent or weapons crimes 0.85 0.82 0.222 0.199 1.249 Not reincarcerated at follow-up 0.73 0.74 −0.067 0.641 0.935
Wave 4 N = 582 N = 531 No perpetration of violence 0.69 0.67 0.069 0.595 1.072 Complied with conditions of supervision 0.66 0.57 0.398 0.023 1.489 No criminal behavior 0.66 0.61 0.189 0.136 1.208 No violent or weapons crimes 0.84 0.83 0.073 0.654 1.076 Not reincarcerated at follow-up 0.64 0.66 −0.065 0.612 0.937
Note: Par. Est. = parameter estimate for weighted regression. p value = probability value of test statistic. OR = odds ratio. N’s are the total responses for each wave of interviews and do not reflect any item missingness. Wave 1 = 30 days pre-release; Wave 2 = 3 months post-release; Wave 3 = 9 months post-release; Wave 4 = 15 months post-release.
showed no evident differences between the two groups (data not shown).
The second core measure of criminal behavior/recidivism was compliance with conditions of supervision. This outcome is important because the majority of men reported being under post-release supervision throughout the follow-up period. As shown in Exhibit 71, among the men who were under post-release supervision, the results were mixed. There was no difference in reports of compliance at 3 months—on average 78% of both groups reported complying with supervision conditions. At 9 months, slightly fewer members of the SVORI group reported complying (69% versus 70%). However, at 15 months, a significantly higher percentage of the SVORI group reported that they had complied with the conditions of their supervision (66% versus 57%).

Outcomes
129
Self-reported criminal behavior is another important dimension of recidivism to capture because it includes criminal behavior that may not have been detected (and that, therefore, is not reflected in official measures of criminal activity). Two outcomes reflecting self-reported criminal behavior are shown in Exhibits and 72 and 73: any self-reported criminal behavior (which includes violent crimes, carrying a weapon, other crimes against people, drug possession crimes, drug sales crimes, DWI/DUI, property crimes, and lesser types of crimes, such as prostitution, soliciting, shoplifting, or disorderly conduct) and self-reported involvement in violent or weapons offenses.
As shown in Exhibit 72, SVORI program participants were more likely than non-SVORI comparison subjects to report committing no crimes since release/last interview. This difference is statistically significant at the 3-month interview (p < 0.05), but not for subsequent follow-up periods.
79
64 6673
59 61
0%
20%
40%
60%
80%
100%
Wave 2 Wave 3 Wave 4
SVORI
Non-SVORI
Note: Wave 1 = 30 days pre-release; Wave 2 = 3 months post-release; Wave 3 = 9 months post-release; Wave 4 = 15 months post-release.
Exhibit 73 shows the weighted average means of self-reports of committing any violent crime or carrying a weapon. As can be seen, about 9–10% of both groups reported committing a violent crime and/or carrying a weapon in the 3 months following their release from prison. In subsequent periods, greater numbers reported either committing a violent crime or carrying a weapon in the average of 6 months since the previous interview. None of the differences was statistically significant (the p value for the Wave 3 SVORI to non-SVORI difference was 0.2).
Exhibit 72. Weighted average reports of committing no crimes since release/last interview

Prisoner reentry experiences of adult males
130
90 85 8491
82 83
0%
20%
40%
60%
80%
100%
Wave 2 Wave 3 Wave 4
SVORINon-SVORI
Note: Wave 1 = 30 days pre-release; Wave 2 = 3 months post-release; Wave 3 = 9 months post-release; Wave 4 = 15 months post-release.
The final core criminal behavior/recidivism outcome based on self-reported data is whether the respondent was not reincarcerated at the time of his follow-up interview. Exhibit 74 shows the weighted average means and suggests a high reincarceration rate for these serious and violent offenders (most of whom were on supervision at release). Somewhat more than 90% had not been reincarcerated within 3 months of release—a percentage that declined to less than two-thirds by the 15 month interview. These percentages imply that by the time of the 9-month interview more than a quarter had been reincarcerated and, by the 15-month interview, more than one third had been reincarcerated.
Exhibit 75 presents an even more sobering picture. This exhibit shows a composite measure reflecting whether the respondent was not reincarcerated at the time of the follow-up interview and reported that he had not been booked into jail or prison (for 24 hours or more) during the reference period. This measure is obviously more inclusive because it reflects any (self-reported) incarceration during the reference period—not just the point at which the interview was conducted. This exhibit shows that there is no significant difference on this outcome between SVORI and comparison men for any follow-up period. In other words, SVORI and comparison men appeared equally likely to have been reincarcerated during the follow-up periods. What is perhaps most surprising, however, are the
Exhibit 73. Weighted average reports of committing no violent crimes/no weapons since release/last interview

Outcomes
131
93
7364
92
7466
0%
20%
40%
60%
80%
100%
Wave 2 Wave 3 Wave 4
SVORINon-SVORI
Note: Wave 1 = 30 days pre-release; Wave 2 = 3 months post-release; Wave 3 = 9 months post-release; Wave 4 = 15 months post-release.
82
5951
81
5949
0%
20%
40%
60%
80%
100%
Wave 2 Wave 3 Wave 4
SVORINon-SVORI
Note: Wave 1 = 30 days pre-release; Wave 2 = 3 months post-release; Wave 3 = 9 months post-release; Wave 4 = 15 months post-release.
percentages of individuals indicating that they had not been reincarcerated. Only about 80% were NOT reincarcerated between release and the 3-month interview, a percentage that drops to about 60% at 9 months, and 50% at 15 months.
The remaining set of criminal recidivism measures were based on official data sources and therefore reflect criminal behavior detected by authorities. These measures include both rearrest (obtained from the National Crime Information Center [NCIC], as described in Lattimore and Steffey (2009) and reincarceration in state prisons (obtained from the state Departments of
Exhibit 74. Weighted average reports of not reincarcerated at interview
Exhibit 75. Weighted average reports of not reincarcerated at interview and no jail/prison stay of more than 24 hours since release/interview

Prisoner reentry experiences of adult males
132
Corrections). The rearrest data reflect all data reported to the NCIC and, thus, may include arrests in states other than the states in which the evaluation subjects were identified. In contrast, the reincarceration data reflect only reincarceration into the same state system (e.g., if one of the SC subjects was incarcerated in NC or GA, that incarceration is not captured in the data). Unlike the self-report measures, data were obtainable for almost all subjects. As with the self-report measures, the reported means are weighted using the propensity scores, and the parameter estimates are for the SVORI indicator variable in the weighted logistic regression models. These core recidivism measures based on official records are shown in Exhibit 76.
The findings for rearrest are shown graphically in Exhibit 77. The findings suggest (1) members of the SVORI group were less likely to be rearrested across the 24 months following release than the non-SVORI group, but the differences were not statistically significant; and (2) rearrest rates for these serious and violent offenders were quite high, with about 70% having had at least one new arrest within 24 months of release.
The SVORI program participants were less likely than the non-SVORI comparison subjects to have a new arrest for all crime types (i.e., the slightly lower rearrest rate did not obscure higher arrest rates for certain types of crimes). The difference between SVORI and non-SVORI was significant at the 0.05 level for other crimes at 21 and 24 months and at the 0.10 level for public order crimes at 21 and 24 months, including arrest for a parole or probation violation.
The findings for reincarceration (shown in Exhibit 78) indicate that the SVORI and non-SVORI groups were equally likely to be reincarcerated throughout the 24 month follow-up period—and rates are actually higher for SVORI participants (albeit not significantly so) after 3 months. These results are somewhat at odds with both the self-report data and the arrest data, which consistently, if weakly, suggest less criminal activity by the SVORI participants.

Outcomes
133
Exhibit 76. Official measures of recidivism
SVORI Mean
Non-SVORI Mean Par. Est. SE OR
Rearrest 1st rearrest within 3 months of release 16% 18% −0.163 0.136 0.849 1st rearrest within 6 months of release 28% 32% −0.191 0.111 0.826 1st rearrest within 9 months of release 41% 44% −0.129 0.104 0.879 1st rearrest within 12 months of release 49% 51% −0.089 0.102 0.915 1st rearrest within 15 months of release 55% 56% −0.036 0.103 0.964 1st rearrest within 21 months of release 64% 66% −0.089 0.107 0.914 1st rearrest within 24 months of release 68% 71% −0.131 0.112 0.877 Rearrest within 21 months for violent crime 19% 21% −0.112 0.129 0.894 Rearrest within 21 months for property crime 23% 24% −0.080 0.120 0.923 Rearrest within 21 months for drug crime 28% 30% −0.118 0.114 0.889 Rearrest within 21 months for public order crime 41% 45% −0.175 0.104 0.839 Rearrest within 21 months for other crime 3% 6% −0.560 0.250 0.571 Rearrest within 24 months for violent crime 20% 23% −0.142 0.127 0.867 Rearrest within 24 months for property crime 26% 27% −0.054 0.117 0.948 Rearrest within 24 months for drug crime 30% 32% −0.117 0.112 0.890 Rearrest within 24 months for public order crime 44% 49% −0.189 0.104 0.828 Rearrest within 24 months for other crime 3% 6% −0.585 0.249 0.557
Reincarceration 1st reincarceration within 3 months of release 3% 4% −0.163 0.280 0.849 1st reincarceration within 6 months of release 11% 10% 0.062 0.160 1.064 1st reincarceration within 9 months of release 19% 17% 0.113 0.128 1.120 1st reincarceration within 12 months of release 25% 25% −0.023 0.114 0.977 1st reincarceration within 15 months of release 30% 29% 0.033 0.108 1.033 1st reincarceration within 21 months of release 39% 36% 0.135 0.102 1.145 1st reincarceration within 24 months of release 42% 39% 0.128 0.102 1.137
Note: Par. Est. = parameter estimate for weighted regression. OR = odds ratio. SE = standard error. For rearrest, SVORI N = 806 for all periods except N = 787 for 24 month measures; non-SVORI N = 775 for all periods except N = 759 for 24 month measures. For reincarceration, SVORI N = 863 for all periods; non-SVORI N = 834 except for N = 817 for 24 month measure.
*p < 0.05 for test of significant difference between SVORI and non-SVORI.

Prisoner reentry experiences of adult males
134
16
28
4149
5564 68
18
32
4451
5666
71
0%
20%
40%
60%
80%
100%
3 6 9 12 15 21 24Months since release
SVORI
Non-SVORI
311
1925
3039 42
410
1725 29
36 39
0%
20%
40%
60%
80%
100%
3 6 9 12 15 21 24Months since release
SVORINon-SVORI
TAKING A BROAD VIEW: OUTCOMES OVER DOMAINS AND TIME In this chapter, the findings suggest that for a variety of specific outcomes in each domain men who participated in SVORI programs had better outcomes, if only moderately so. This section presents a broader view, looking across about 100 outcomes across the domains for each wave of data collection. Odds ratios for 98 outcomes for the Wave 2 and Wave 4 data and 91 outcomes for the Wave 3 data (the difference is due to outcomes from drug tests conducted at Waves 2 and 4). In all
Exhibit 77. Cumulative rearrest rates by group
Exhibit 78. Cumulative reincarceration rates by group

Outcomes
135
cases, the outcomes were coded such that a positive difference meant the SVORI group performed better on that outcome (e.g., arrested was reverse coded to no arrest).
Exhibit 79 shows the odds ratios for 98 dichotomous outcomes measured 3 months following release. Most of these ratios are greater than 1, signifying that SVORI participants had even or higher odds of having these positive outcomes. Specifically, 75 of 98 odds ratios are 1 or more, and 11 of these are significant at the 0.10 or better level. If SVORI were ineffective, roughly the same number of positive as negative outcomes would be expected for SVORI participants in comparison to non-SVORI subjects. Instead, roughly three out of four outcomes are neutral or better.
0.0
0.5
1.0
1.5
2.0
2.5
Exhibit 80 provides similar if somewhat weaker results for Wave 3 data. There were 93 9-month outcomes because drug tests weren’t conducted in conjunction with these interviews. Here, Of the 93 odds ratios, 65 are 1 or larger and 13 are significant at the 0.10 level or better.
Exhibit 81 presents similar results for the 98 outcomes at Wave 4. For the 15-month data, 81 of the 99 outcomes have odds ratios of 1 or larger, and 22 are significant at the 0.10 level or better.
Exhibit 79. Odds ratios from propensity score weighted logistic regressions of 98 Wave 2 (3-month) outcomes as a function of SVORI program participation

Prisoner reentry experiences of adult males
136
0.0
0.5
1.0
1.5
2.0
2.5
0.0
0.5
1.0
1.5
2.0
2.5
Exhibit 82 summarizes the findings presented in Exhibits 79 through 81. As noted earlier, if SVORI program participation had no impact on outcomes, SVORI outcomes would be better than non-SVORI outcomes about 50% of the time; in this case, however, for each follow up, the percentage of odds ratios greater than 1 exceeds 70% (specifically, 76% at 3 months, 70% at 9 months, and 82% at 15 months). The probability of these outcomes if SVORI were not effective (i.e., if the odds of a better outcome for SVORI over non-SVORI was 50:50) is effectively zero (binomial distribution).
Exhibit 80. Odds ratios from propensity score weighted logistic regressions of 93 Wave 3 (9-month) outcomes as a function of SVORI program participation
Exhibit 81. Odds ratios from propensity score weighted logistic regressions of 98 Wave 4 (15 month) outcomes as a function of SVORI program participation

Outcomes
137
Follow-up
3
Months 9
Months15
MonthsNumber of outcomes 98 93 98 SVORI better than non-SVORI (OR > 1) 75 65 80 SVORI better than non-SVORI (p < 0.05) 4 10 16 SVORI better than non-SVORI (p < 0.1) 11 13 21 non-SVORI better than SVORI (OR > 1) 23 28 18 non-SVORI better than SVORI (p < 0.05) 3 1 1 non-SVORI better than SVORI (p < 0.1) 0 4 2
Note: OR = odds ratio.
Exhibit 82. Summary results of odds ratios from propensity score weighted logistic regressions of three waves of outcomes as a function of SVORI program participation


139
CCoonncclluussiioonnss,, PPoolliiccyy IImmpplliiccaattiioonnss,, aanndd FFuuttuurree WWoorrkk
In 2003, the U.S. DOJ, DOL, DOEd, HUD, and HHS provided more than $100,000,000 in grant funds to states to develop, enhance, or expand programs to facilitate the reentry of adult and juvenile offenders returning to communities from prisons or juvenile detention facilities. The $500,000 to $2,000,000 3-year grants were used to establish programs that were to span the periods before release, in the community on supervision, and post-supervision. In addition to the funding, SVORI encouraged agencies to coordinate with correctional and community partners and services; these activities were mentioned by SVORI program directors as a significant—and, for most, sustained—change from business as usual. The initiative responded to emerging research findings that suggested that providing individuals with comprehensive, coordinated services based on needs and risk assessments could result in improved post-release outcomes.
The multi-site evaluation was designed to determine whether participation in SVORI programs resulted in increased service receipt and better post-release outcomes. The findings in this report provided information on the characteristics and experiences of adult male SVORI program participants and comparison subjects in 12 states who were released from prison between July 2004 and November 2005. Many of the services were intended to improve intermediate outcomes that have been correlated with recidivism—for example, employment services to improve employment, substance abuse treatment to reduce use, and cognitive programs to address
Prisoner reentry experiences of adult males
140
criminal thinking. The underlying model suggests that improvements in these outcomes will lead to reductions in criminal behavior. The SVORI program participants (and, to a lesser extent, the non-SVORI respondents) received a variety of different services, each of which could impact one or more intermediate outcomes that could impact recidivism. There is little theoretical or empirical guidance for the correct specification of such a complex recidivism model and, thus, the approach to the outcome analyses was to test first-order effects of SVORI program participation on each of the identified outcomes including recidivism.
The findings substantiate previous research that male prisoners returning to their communities after serving more than 2 years in prison comprise a population with extremely high needs and that their expressed needs remained high (if somewhat diminished from pre-release) up to 15 months following release from prison. Overall, the men in the study had weak educational and employment histories, extensive substance abuse histories, substantial experience with the criminal justice system, and extensive exposure to drug or criminally involved family members and peers. In particular, most had used drugs in the past—including two thirds who reported using in the 30 days prior to their incarceration. Most had been previously incarcerated. A majority had been treated for mental health or substance use problems.
Results from the impact study suggest that SVORI programs were successful in significantly increasing access to a variety of services and programming—particularly services related to transitioning to the community and employment/education/ skills, as well as to substance abuse treatment. For example, 75% of SVORI program participants, in contrast to 51% of non-SVORI comparison subjects, reported involvement in programs while in prison to prepare for release (see Exhibit 52).39 This approximately 50% increase in the likelihood of reentry program participation that was observed for the SVORI program participants was seen more broadly in the super bundle scores, which summarized service receipt at each of the four interviews. SVORI program participants reported service receipt while in prison across all domains, resulting in a super
39 Values are propensity score weighted means unless otherwise
noted.
SVORI program participation increased the likelihood of receiving a wide range of services, but levels of receipt were generally much less than reported needs.

Conclusions, Policy Implications, and Future Work
141
bundle score that was 34–55% higher than the 22 score calculated for non-SVORI respondents (see Exhibit 46). These findings add to emerging research regarding the feasibility of improving service receipt across broadly conceived reentry programs.
Although the SVORI programs were successful in increasing the types and amounts of needs-related services provided prior to and after release from prison, the proportion of individuals who reported receiving services was less than reported need (sometimes much less) and, generally, less than the expectations of the SVORI program directors. Thus, respondents in both groups reported needs that generated super bundle service need scores of 54 at the time of the pre-release interview (see Exhibit 37). The super bundle scores calculated from program director survey data showed that the program directors expected that their programs on average were providing services that resulted in an average pre-release bundle score of 52 and 36 for SVORI and non-SVORI, respectively (Winterfield et al., 2006).40 These findings suggest that, on average, respondents reported needing more than half of all services (54%)—much greater than the receipt of 34%, on average, for SVORI program participants and 22% for non-SVORI respondents. Similarly, in a 2005 survey, program directors reported that on average about 52% of SVORI program participants were expected to receive each service (compared to 36% for non-SVORI). Thus, the expressed needs of the participants and the expectations for SVORI program service delivery by the program directors both exceeded the reported levels of service receipt. This finding is consistent with the fact that SVORI programs were still developing and implementing their programs and provides a substantial reminder that starting up complex programs may require a sustained effort over several years to reach full implementation.
Service delivery declined substantially, on average, following release. Thus, overall, the programs were unable to sustain
40 The components and calculations of bundle scores for the program
director data are analogous to, but differ somewhat from, the components and calculations for the offender interview data. One interpretation of the program director scores is that it identified the average percentage of offenders who received each service included in the bundle (in this case all services). See Winterfield et al. (2006) for details.
… on average, respondents reported needing more than half of all services (54%)—much greater than the receipt of 34%, on average, for SVORI program participants and 22% for non-SVORI respondents.
Prisoner reentry experiences of adult males
142
providing support to individuals during the critical, high risk period immediately following release. This decline may be attributable to the difficulty programs experienced early on in their efforts to identify and coordinate services for individuals released across wide geographic areas and, again, suggests the need for sustained effort to reach full implementation.
The level of services received diminished quickly over time following release, regardless of expressed need. For example, 85% or more of both groups reported at all interviews that they needed more education. While 51% of SVORI program participants (44% of non-SVORI) reported receiving educational services while in prison, this percentage dropped to 11% for SVORI (8% for non-SVORI subjects) during the 3 months following release and remained essentially unchanged over the next 12 months (10% SVORI and 7% non-SVORI at the 15-month interview). Similar results were seen overall. The service need super bundle scores ranged between 42 and 45 for the two groups over the three follow-up interviews—relatively stable following about a 10 point drop from the 54 score estimated from pre-release data. As shown in Exhibit 46, reported service receipt scores declined for SVORI participants from 34 at the pre-release interview to 18 at 3 months post-release, 13 at 9 months, and 9 at 15 months post-release. SVORI participants’ scores were significantly higher than those for non-SVORI respondents (22 pre-release and 12, 10, and 8 in the three post-release waves) through 9 months post-release. However, these scores demonstrated that the programs were unable to sustain levels of service provision to respondents with high levels of expressed needs following release.
As previous research suggests the importance of after care to successful reintegration, the failure of the programs to provide sustained support during the critical, high-risk period immediately following release may have contributed to the modest impact findings. The failure to provide substantial levels of services following release, however, may also point to the difficulty of implementing broadly based reentry programs to provide services across a wide range of domains—a difficulty exacerbated for programs that released SVORI program participants across multiple geographic areas or even statewide. These considerations suggest that ample time should be provided for development and implementation and that
SVORI programs were unable to sustain levels of service provision to respondents with high levels of expressed needs following release.

Conclusions, Policy Implications, and Future Work
143
there may be a need for a sustained, multi-year effort to reach full implementation.
The significant—albeit less-than-universal—increase in service receipt associated with participation in SVORI programs was associated with moderately better outcomes with respect to housing, employment, substance use, and self-reported criminal behavior. For example, SVORI program participants were more likely to report living in their own house or apartment at each interview. Further, although SVORI and non-SVORI respondents were equally likely to report having worked since the last interview, SVORI program participants were more likely to report currently supporting themselves with a job at 3 and 15 months post-release and to report that they were working at a job that offered formal pay and provided benefits (health insurance or paid leave). Additionally, SVORI program participants were more likely to have abstained from drug use—with more reporting no drug use since the last interview or in the last 30 days. Similar results were found when self-report measures were combined with drug test results. However, overall, abstinence from illegal drugs was disappointing. For example, at 15 months following release, only 46% of SVORI program participants and 43% of non-SVORI comparison subjects reported no drug use in the previous 30 days and tested negative on an oral swab drug test. As many of the previous evaluations of reentry programs have focused primarily on recidivism and substance use, this evaluation has extended knowledge about the potential impacts of reentry programming on an array of other important indicators of successful reintegration, including housing and employment.
The recidivism results were mixed—with SVORI program participants less likely to report criminal activity (significantly so at 3 months post-release, when 79% of SVORI and 73% of non-SVORI reported no crimes since release). The differences remained about 6 percentage points over successive time points (64% versus 59% at 9 months and 66% versus 61% at 15 months), implying that about 10% more SVORI program participants reported no crimes during the previous 6 months than non-SVORI comparisons. SVORI program participants were also less likely to have an officially recorded arrest at a variety of points during the 24-month period following release, although these differences were small and not significant. Rearrest rates, overall, were high for both groups—by 24
SVORI program participation was associated with moderately better outcomes in housing, employment, substance use, and self-reported criminal behavior.
SVORI program participants had lower arrest rates but the differences were not statistically significant.

Prisoner reentry experiences of adult males
144
months following release, 68% of the SVORI program participants and 71% of the non-SVORI comparisons had a new arrest recorded at NCIC.
Although self-reported criminal behavior and official arrest records were consistent in supporting somewhat lower criminal activity among SVORI program participants, this was not associated with lower reincarceration rates—and, in fact, by 21 months post-release the reincarceration rate for SVORI program participants was about 10% higher than the non-SVORI rate (39% versus 36%). The reincarceration findings would be consistent with self-reported compliance with conditions of supervision, which was similar for SVORI and non-SVORI subjects at 3 and 9 months post-release in that noncompliance could lead to revocation. However, SVORI program participants were more likely to report complying with conditions of supervision at 15 months (66% versus 57%). Additional investigation is needed to determine whether supervision is in some way associated with the reincarceration findings.
From a policy perspective, the multi-site SVORI evaluation adds to the sparse reentry evaluation literature that addresses the effect of broad-based (wraparound) programmatic efforts on high risk individuals. Specifically, much of the reentry literature to date presents findings from single-focus interventions, such as drug treatment or cognitive behavior therapy, which have been implemented with low-risk offenders. SVORI was initiated as consensus began to build that programs needed to address the multiplicity of needs of offenders and that interventions were likely to be more successful when focused on high-risk (or higher risk) offenders. The scale of the evaluation—including programs in 12 states and enrolling nearly 1,700 men—provided an opportunity to develop a comprehensive portrait of high-risk individuals as they attempted to reintegrate into communities following prison release, providing insight into their post-release circumstances.
The gaps between reported service needs and receipt for SVORI program participants may be attributable to the early stage of implementation when these subjects were enrolled in the evaluation. Further, most of the SVORI impact programs were deployed in multiple prisons and enrolled participants who returned to multiple communities. Developing and
There was little difference in reincarceration rates, although by 21 months post-release 39% of SVORI program participants versus 36% of non-SVORI comparison subjects had been reincarcerated.

Conclusions, Policy Implications, and Future Work
145
implementing the panoply of services for a comprehensive reentry program within multiple prisons and identifying and enlisting community programs and resources are complex tasks that could easily take several years to fully realize. Thus, for example, although “only” 57% of SVORI participants reported having a reentry plan 30 days prior to release, this is a 138% increase over the percentage of non-SVORI respondents who reported having a plan. The 57% finding suggests an opportunity for continued program improvement and more complete implementation. Indeed, many states appear to have viewed their program development and implementation with SVORI funds as a foundation upon which to build better programs—by enhancing services and expanding the reach of the services. As reported in Winterfield, Lindquist, and Brumbaugh (2007), most SVORI program directors said in response to a 2006 survey that their states were continuing to build on the programs that they established with SVORI grant funds.
Importantly, service delivery was not sustained during the critical, high risk period immediately following release. The treatment literature suggests that 90 to 270 days of continued care is optimal (Friedmann, Taxman, & Henderson, 2007; Taxman, Perdoni, & Harrison, 2007). Larger program effects would be expected with continuous service delivery after release—which was one of the primary features of the SVORI.
The modest improvements in intermediate outcomes observed in the evaluation of SVORI are consistent with findings from several meta-analyses of single-program efforts. These analyses suggest treatment effects from 10% to 20% across a wide range of types of programming for offenders (e.g., Aos et al., 2006). Whether a multi-focus reentry program can lead to significantly greater treatment effects of 30% to 50% is unknown. Results from the SVORI evaluation suggest that programs will need to be given sufficient time to implement multi-component, multi-phase programs before this hypothesis can be tested.
The evaluation was designed to address the question of whether SVORI programs—enhanced reentry programs—could impact the post-release outcomes of high-risk offenders. In other words, the goal was to answer the question “Did SVORI work?” SVORI programs were “black boxes” that under the

Prisoner reentry experiences of adult males
146
SVORI model were assumed to contain the need-based services appropriate for each individual. Thus, although the programs differed across sites, all programs conformed to this higher-order definition of program. Deficiencies in service delivery are, thus, ascribed to development or implementation shortcomings. Of course, this is not wholly satisfactory. Indeed, the extensive data collection on service receipt was intended to allow examination of other evaluation questions that were beyond the scope of this evaluation.
Additional evaluation questions will be addressed in future work, answers to which may help guide policy. This research will address “what worked?” (Were some SVORI programs more successful than others? Can the effects of specific program components be disentangled?); “for whom?” (Are there identifiable characteristics that are associated with better outcomes?); “for how long?” (How are study participants faring 5 years after release from prison?); and “at what cost?” (Are there long-term cost savings associated with the SVORI programs?). For example, one related hypothesis to be tested involves the question of whether services directed at proximal outcomes (e.g., substance abuse treatment) are sufficient to effect changes in criminal behavior or whether programs targeted directly at changing criminal thinking may be needed as well. Additional examination of site-level differences is also needed to determine whether the characteristics of the sites (e.g., parole revocation policies, economic climate) have an impact on “what works” independent of local program and participant characteristics. The extensive SVORI dataset provides an opportunity for future research to explore these questions, as well as related questions such as which services were helpful, what factors led to reincarceration, and what factors were associated with remaining out of prison.

147
RReeffeerreenncceess
Adams, K., Bennett, K. J., Flanagan, T. J., Marquart, J. W., Cuvelier, S. J., Fritsch, E., et al. (1994). A large-scale multidimensional test of the effect of prison education programs on offenders' behavior. Prison Journal, 74(4), 443-449.
Andrews, D. A. (2006). Enhancing adherence to risk-need-responsivity: Making quality a matter of policy. Criminology and Public Policy, 5, 595-602.
Andrews, D. A., & Bonta, J. (2006). The psychology of criminal conduct (4th ed.). Newark, NJ: Lexis/Nexis/Matthew Bender.
Andrews, D. A., Ziner, I., Hoge, R. D., Bonta, J., Gendreau, P., & Cullen, F. T. (1990). Does correctional treatment work: A clinically-relevant and psychologically-informed meta-analysis. Criminology, 28, 369-404.
Aos, S. (2006). Options to stabilize prison populations in Washington--Interim report. Steve Aos. #06-01-1202.
Aos, S., Miller, M., & Drake, E. (2006). Evidence-based adult corrections programs: What works and what does not. Olympia, WA: Washington State Institute for Public Policy.
Beck, A., Gilliard, D., Greenfeld, L., Harlow, C., Hester, T., Jankowski, L., et al. (1993). Survey of state prison inmates, 1991 (NCJ 136949). Washington, DC: U.S. Bureau of Justice Statistics.
Bonczar, T. P., & Beck, A. J. (1997). Lifetime likelihood of going to state or federal prison. Bureau of Justice Statistics Special Report No. NCJ 1600092. Washington, DC: U.S. Bureau of Justice Statistics.
Boudin, K. (1993). Participatory literacy education behind bars. Harvard Educational Review, 63(2), 207-232.

Prisoner reentry experiences of adult males
148
Buck, M. L. (2000). Getting back to work: Employment programs for ex-offenders. Field report series. Philadelphia: Public/Private Ventures.
Bushway, S., & Reuter, P. (2002). Labor markets and crime. In J. Q. Wilson & J. Petersilia (Eds.), Crime: Public policies for crime control (Rev. ed., pp. 191-224). San Francisco, CA: ICS Press.
Byrnes, M., Macallair, D., & Shorter, A. (2008). Aftercare as afterthought: Reentry and the California Youth Authority. In R. G. Shelden & D. Macallair (Eds.), Juvenile justice in America: Problems and prospects (pp. 83-114). Long Grove, IL: Waveland Press.
Chalfin, A., Tereshchenko, B., Roman, J., Roman, C., & Arriola, C. (2007). Cost-benefit analysis of building bridges. Washington, DC: Urban Institute.
Clear, T. R., Rose, D. R., & Ryder, J. A. (2001). Incarceration and the community: The problem of removing and returning offenders. Crime & Delinquency, 47, 335-351.
Cowell, A., Roman, J., & Lattimore, P. K. (2009). An economic evaluation of the Serious and Violent Offender Reentry Initiative. Research Triangle Park, NC: RTI International.
Cullen, F. T., & Gendreau, P. (2000). Assessing correctional rehabilitation: Policy, practice, and prospects. In J. Horney (Ed.), Criminal justice 2000: Policies, processes, and decisions of the criminal justice system (Vol. 3, pp. 109-175). Washington, DC: National Institute of Justice.
D'Agostino, R. B., Jr. (1998). Tutorial in biostatistics: Propensity score methods for bias reduction in the comparison of a treatment to a non-randomized control group. Statistics in Medicine, 17, 2265-2281.
Finn, P. (1998). Successful job placement for ex-offenders: The center for employment opportunities. Washington, DC: National Institute of Justice.
Franz, J. (2003). Wraparound: A primer. Retrieved December 23, 2009, from http://www.paperboat.com/.
Friedmann, P. D., Taxman, F. S., & Henderson, C. (2007). Evidence-based treatment practices for drug-involved adults in the criminal justice system. Journal of Substance Abuse Treatment, 32(3), 267-277.
References
149
Gaes, G. G., Flanagan, T. J., Motiuk, L. L., & Stewart, L. (1999). Adult correctional treatment. In M. Tonry & J. Petersilia (Eds.), Prisons (pp. 361-426). Chicago: University of Chicago Press.
Gerber, J., & Fritsch, E. (1994). The effects of academic and vocational program participation on inmate misconduct and reincarceration: Prison education research project: Final report. Huntsville, TX: Sam Houston State University.
Glueck, S., & Glueck, E. (1974). Of delinquency and crime. Springfield, IL: Thomas.
Glynn, R. J., Schneeweiss, S., & Sturmer, T. (2006). Indications for propensity scores and review of their use in pharmacoepidemiology. Basic Clinical Pharmacology and Toxicology, 98(3), 253-259.
Gottfredson, M. R., & Hirschi, T. (1990). A general theory of crime. Stanford, CA: Stanford University Press.
Greifinger, R. B., Bick, J. A., & Goldenson, J. (2007). Public health behind bars: From prisons to communities. Dobbs Ferry, NY: Springer-Verlag.
Hagan, J., & Coleman, J. P. (2001). Returning captives of the American war on drugs: Issues of community and family reentry. Crime & Delinquency, 47(3), 352-267.
Hagan, J., & Dinovitzer, R. (1999). Collateral consequences of imprisonment for children, communities, and prisoners. In J. Petersilia & M. Tonry (Eds.), Prisons (pp. 121-162). Chicago: University of Chicago Press.
Harer, M. D. (1995). Prison education program participation and recidivism: A test of the normalization hypothesis. Washington, DC: Federal Bureau of Prisons Office of Research and Evaluation.
Harrison, P. (2000). Total sentenced prisoners released from state or federal jurisdiction, National Prisoners Data Series (NPS-1). Washington, DC: U.S. Bureau of Justice Statistics. Available at: http://www.ojp.usdoj.gov/bjs/data/corpop22.csv.
Hawkins, S., Dawes, D., Lattimore, P. K., & Visher, C. A. (2009). Detainee reentry experiences of juvenile males: Characteristics, service receipt, and outcomes of participants in the SVORI Multi-site Evaluation. Research Triangle Park, NC: RTI International.
Prisoner reentry experiences of adult males
150
Healy, K., Foley, D., & Walsh, K. (1999). Parents in prison and their families. Queensland, Australia: Catholic Prison Ministry.
Holsinger, A. M., Lurigio, A. J., & Latessa, E. I. (2001). Practitioner's guide to understanding the basis of assessing offender risk. Federal Probation, 65(1), 46-50.
Holzer, H. J., & Martinson, K. (2005). Can we improve job retention and advancement among low-income working parents? Washington, DC: Urban Institute.
Holzer, H. J., Raphael, S., & Stoll, M. A. (2006). Perceived criminality, criminal background checks, and the racial hiring practices of employers. Journal of Law & Economics, 49(2), 451-480.
James, D. J., & Glaze, L. E. (2006). Mental health problems of prison and jail inmates. Washington, DC: U.S. Bureau of Justice Statistics.
Karberg, J. C., & James, D. J. (2005). Substance dependence, abuse, and treatment of jail inmates 2002. Washington, DC: U.S. Department of Justice.
Lattimore, P. K. (2007). The challenges of reentry. Corrections Today, 69(2), 88-91.
Lattimore, P. K., Brumbaugh, S., Visher, C., Lindquist, C. H., Winterfield, L., Salas, M., et al. (2004). National portrait of the Serious and Violent Offender Reentry Initiative. Research Triangle Park, NC: RTI International.
Lattimore, P. K., & Steffey, D. M. (2009). The Multi-Site Evaluation of SVORI: Methodology and analytic approach. Research Triangle Park, NC: RTI International.
Lattimore, P. K., Steffey, D. M., & Visher, C. A. (2009). Prisoner reentry experiences of adult males: Characteristics, service receipt, and outcomes of participants in the SVORI Multi-site Evaluation. Research Triangle Park, NC: RTI International.
Lattimore, P. K., & Visher, C. A. (2009). The Multi-site Evaluation of SVORI: Summary and synthesis. Research Triangle Park: RTI International.
Lattimore, P. K., Visher, C. A., & Steffey, D. M. (2008). Pre-release characteristics and service receipt among adult male participants in the SVORI Multi-site Evaluation. Research Triangle Park, NC: RTI International.

References
151
Lattimore, P. K., Visher, C. A., Winterfield, L., Lindquist, C., & Brumbaugh, S. (2005). Implementation of prisoner reentry programs: Findings from the Serious and Violent Offender Reentry Initiative Multi-site Evaluation. Justice Research and Policy, 7(2), 87-109.
Laub, J. H., Nagin, D. S., & Sampson, R. J. (1998). Trajectories of change in criminal offending: Good marriages and the desistance process. American Sociological Review, 63(2), 225-238.
Laub, J. H., & Sampson, R. J. (1993). Turning points in the life course: Why change matters to the study of crime. Criminology, 31, 301-326.
Laub, J. H., & Sampson, R. J. (2001). Understanding desistance from crime. In M. H. Tonry (Ed.), Crime and Justice: A Review of Research. Chicago: University of Chicago Press.
Laub, J. H., & Sampson, R. J. (2003). Shared beginnings, divergent lives: Delinquent boys to age 70. Cambridge, MA: Harvard University Press.
Lawrence, S., Mears, D. P., Dubin, G., & Travis, J. (2002). The practice and promise of prison programming. Washington, DC: Urban Institute.
Lindquist, C. (2005). Reentry research in action: Implementation of SVORI programs. Research Triangle Park, NC: RTI International.
Lindquist, C., & Winterfield, L. (2005). Reentry research in action: Characteristics of prisoner reentry programs. Research Triangle Park, NC: RTI International.
Lindquist, C. H., Barrick, K., Lattimore, P. K., & Visher, C. A. (2009). Prisoner reentry experiences of adult females: Characteristics, service receipt, and outcomes of participants in the SVORI Multi-site Evaluation. Research Triangle Park, NC: RTI International.
Lipsey, M. W., & Cullen, F. T. (2007). The effectiveness of correctional rehabilitation: A review of systematic reviews. Annual Review of Law and Social Science, 3, 297-320.
Lowenkamp, C. T., Latessa, E. J., & Smith, P. (2006). Does correctional program quality really matter? The impact of adhering to the principles of effective intervention. Criminology and Public Policy, 5, 575-608.

Prisoner reentry experiences of adult males
152
Lynch, J., & Sabol, W. (2001). Prisoner reentry in perspective. Washington, DC: Urban Institute.
MacKenzie, D. L. (2006). What works in corrections: Reducing the criminal activities of offenders and delinquents. New York: Cambridge University Press.
Marlowe, D. B. (2006). When "what works" never did: Dodging the "scarlet M" in correctional rehabilitation. Criminology and Public Policy, 5(2), 339-346.
Maruna, S. (2001). Making good: How ex-offenders reform and reclaim their lives. Washington, DC: American Psychological Association Books.
Mauer, M. (2000). Race to incarcerate. Washington, DC: The Prison Project.
Moore, G. E., & Mears, D. P. (2003). A meeting of the minds: Researchers and practitioners discuss key issues in corrections-based drug treatment. Washington, DC: Urban Institute.
National Research Council (2007). Parole, desistance from crime, and community integration. Washington, DC: National Academy Press.
Petersilia, J. (2003). When prisoners come home: Parole and prisoner reentry. New York: Oxford University Press.
Petersilia, J. (2004). What works in prisoner reentry? Reviewing and questioning the evidence. Federal Probation, 68(2), 4-8.
Petersilia, J. (2005). Hard time: Ex-offenders returning home after prison. Corrections Today, 155, 66-71.
Pew Center on the States (2009). Maximum impact: Targeting supervision on higher-risk people, places, and times. Public Safety Policy Brief. Retrieved December 28, 2009, from http://www.pewcenteronthestates.org/uploadedFiles/ Maximum_Impact_web.pdf
Piehl, A. M. (1998). Economic conditions, work, and crime. In M. Tonry (Ed.), Handbook on crime and punishment (pp. 302-319). Oxford, England: Oxford University Press.
Re-entry Policy Council (2005). Report of the Re-entry Policy Council: Charting the safe and successful return of prisoners to the community. New York: Council of State Governments.

References
153
Rhine, E., Mawhorr, T., & Parks, E. C. (2006). Implementation: The bane of effective correctional programs. Criminology and Public Policy, 5(2), 347-358.
Roman, J., Brooks, L. E., Lagerson, E., Chalfin, A., & Tereshchenko, B. (2007). Impact and cost-benefit analysis of the Maryland reentry partnership initiative. Washington, DC: Urban Institute.
Rosenbaum, P., & Rubin, D. B. (1983). The central role of the propensity score in observational studies for causal effects. Biometrika, 70, 41-55.
Rosenbaum, P., & Rubin, D. B. (1985). The bias due to incomplete matching. Biometrics, 41, 103-116.
Rossman, S. B., & Roman, C. G. (2003). Case-managed reentry and employment: Lessons from the Opportunity to Succeed Program. Justice Research and Policy, 5(2), 75-100.
Rubin, D. B. (1997). Estimating causal effects from large data sets using propensity scores. Annals of Internal Medicine, 127, 757-763.
Rubin, D. B. (2006). Matched sampling for causal effects. New York: Cambridge University Press.
Sampson, R. J., & Laub, J. H. (1990). Crime and deviance over the life course: The salience of adult social bonds. American Sociological Review, 55(5), 609-627.
Sampson, R. J., & Laub, J. H. (1993). Crime in the making: Pathways and turning points through life. Cambridge, MA: Harvard University Press.
Seiter, R. P., & Kadela, K. R. (2003). Prisoner reentry: What works, what does not, and what is promising. Crime & Delinquency, 49(3), 360-388.
Stillman, J. (1999). Working to learn: Skills development under "Work First." Philadelphia, PA: Public/Private Ventures.
Strategic Advantages (2000). Symptom Assessment-45 Questionnaire (SA-45). New York: Multi-Health Systems.
Sung, G. (2001). Rehabilitation felony drug offenders through job development: A look into a prosecutor-led diversion program. Prison Journal, 81(2), 271-286.
Taxman, F. S., Perdoni, M., & Harrison, L. (2007). Treatment for adult offenders: A review of the state of the state. Journal of Substance Abuse Treatment, 32(3), 239-254.

Prisoner reentry experiences of adult males
154
Travis, J. (2002). Invisible punishment: An instrument of social exclusion. In M. Mauer & M. Chesney-Lind (Eds.), Invisible punishment: The collateral consequence of mass imprisonment (pp. 15-36). New York: New Press.
Travis, J. (2005). But they all come back: Facing the challenges of prisoner reentry. Washington, DC: Urban Institute Press.
Visher, C. A. (2006). Effective reentry programs [Editorial introduction]. Criminology and Public Policy, 5(2), 299-302.
Visher, C. A. (2007). Returning home: Emerging findings and policy lessons about prisoner reentry. Federal Sentencing Reporter, 20(2), 93-102.
Visher, C. A., Debus, S., & Yahner, J. (2008). Employment after prison: A longitudinal study of releasees in three states. Washington, DC: Urban Institute.
Visher, C. A., & Mallik-Kane, K. (2007). Reentry experiences of men with health problems. In R. Greifinger (Ed.), Public health is public safety: Improving public health through correctional health care (pp. 432-447). London: Spinger-Verlag.
Visher, C. A., & Travis, J. (2003). Transitions from prison to community: Understanding individual pathways. Annual Review of Sociology, 29, 89-113.
Visher, C. A., Winterfield, L., & Coggeshall, M. B. (2005). Ex-offender employment programs and recidivism: A meta-analysis. Journal of Experimental Criminology, 1(3), 295-316.
Ware, J. E., Jr., Kosinski, M., Turner-Bowker, D. M., & Gandek, B. (2002). How to score version 2 of the SF-12 health survey (with a supplement documenting version 1). Lincoln, RI: QualityMetric.
Warr, M. (1998). Life-course transitions and desistance from crime. Criminology, 36, 183–216.
West, H. C., Sabol, W. J., & Cooper, M. (2009). Prisoners in 2008 (NCJ-228417). U.S. Bureau of Justice Statistics. Retrieved December 27, 2009, from http://bjs.ojp.usdoj.gov/index.cfm?ty=pbdetail&iid=1763.
References
155
Western, B. (2007). The penal system and the labor market. In S. Bushway, M. A. Stoll, & D. F. Weiman (Eds.), Barriers to re-entry? The labor market for released prisoners in postindustrial America. New York: Russell Sage Foundation.
Wiebush, R. G., McNulty, B., & Le, T. (2000). Implementation of the intensive community-based aftercare program. Washington, DC: Office of Juvenile Justice and Delinquency Prevention.
Wilson, D. B., Gallagher, C. A., & MacKenzie, D. L. (2000). A meta-analysis of corrections-based education, vocation, and work programs for adult offenders. Journal of Research on Crime and Delinquency, 37(4), 347-368.
Wilson, J. A., & Davis, R. C. (2006). Good intentions meet hard realities: An evaluation of the project greenlight reentry program. Criminology and Public Policy, 5(2), 303-338.
Winterfield, L., & Brumbaugh, S. (2005). Reentry research in action: Overview of the Serious and Violent Offender Reentry Initiative. Research Triangle Park, NC: RTI International.
Winterfield, L., & Castro, J. (2005). Matching drug treatment to those in need: An analysis of correctional service delivery in Illinois and Ohio. Justice Research and Policy, 7(2), 30-55.
Winterfield, L., Lattimore, P. K., Steffey, D. M., Brumbaugh, S., & Lindquist, C. (2006). The Serious and Violent Offender Reentry Initiative: Measuring the effects on service delivery. Western Criminology Review, 7(2), 3-19.
Winterfield, L., & Lindquist, C. (2005). Reentry research in action: Characteristics of prisoner reentry programs. Research Triangle Park, NC: RTI International.
Winterfield, L., Lindquist, C., & Brumbaugh, S. (2007). Sustaining adult reentry programs after SVORI. The Multi-site Evaluation of the Serious and Violent Offender Reentry Initiative: Reentry research in action. Retrieved December 18, 2009, from http://www.svori-evaluation.org/ %5Cdocuments%5Creports%5CRRIA_2007_Adult_Sustainability.pdf
Young, D. (2004). First count to ten: Innovation and implementation to juvenile reintegration programs. Retrieved December 15, 2009, from http://www.uscourts. gov/fedprob/September_2004/juvenile.html


A-1
AAppppeennddiixx AA.. DDaattaa TTaabblleess Exhibit A-1. Adult male case disposition—Wave 1 (pre-release)
SVORI Non-SVORI All Cases N % N % N % TOTAL ALL CASES 1,406 43.92% 1,795 56.08% 3,201 100.00% SVORI Non-SVORI All Cases
Case Disposition—Eligible Cases N
% of EligibleSVORI N
% of Eligible
non-SVORI
N % of
Eligible Completed
Interview completed 863 73.70% 834 59.87% 1,697 66.19% Released Early
R released prior to Wave 1 interview 169 14.43% 369 26.49% 538 20.98% Refused
Final refusal by R, guardian or other 126 10.76% 166 11.92% 295 11.51% Access Denied
Access to R denied by prison 6 0.51% 8 0.57% 14 0.55% Other Noninterview
R absconded 2 0.17% 3 0.22% 5 0.20% Private setting not available 2 0.17% 1 0.07% 3 0.12% R deceased 1 0.09% 0 0.00% 1 0.04% Language barrier—Spanish 1 0.09% 5 0.36% 6 0.23% Language barrier—Other 0 0.00% 1 0.07% 1 0.04% Physically/mentally incapable 1 0.09% 2 0.14% 3 0.12% Other noninterview 0 0.00% 1 0.07% 1 0.04%
TOTAL ELIGIBLE CASES 1,171 100.00% 1,393 100.00% 2,564 100.00% SVORI Non-SVORI All Cases
Case Disposition—Ineligible Cases N
% of Ineligible
SVORI N
% of Ineligible
non-SVORI
N % of
IneligibleIneligible Cases
R transferred to non-study facility 21 8.94% 56 13.93% 77 12.09% R releasing to non-study area 7 2.98% 37 9.20% 41 6.44% R not releasing during data collection
period 100 42.55% 92 22.89% 192 30.14%
Date of release unknown 2 0.85% 25 6.22% 32 5.02% Case fielded incorrectly 5 2.13% 158 39.30% 163 25.59% R ineligible to participate 86 36.60% 12 2.99% 98 15.38% Site dropped from study 4 1.70% 18 4.48% 28 4.40% Other ineligible 10 4.26% 4 1.00% 6 0.94%
TOTAL INELIGIBLE CASES 235 100.00% 402 100.00% 637 100.00%
Note: R = respondent. Wave 1 = 30 days pre-release.

Prisoner reentry experiences of adult males
A-2
Exhibit A-2. Respondent characteristics, by group (pre-release)
Characteristic N SVORI
Mean (SD) Non-SVORI Mean (SD) t-statistic
Demographics and Housing Age at incarceration 1,697 26.13 (7.49) 27.06 (7.41) −2.57 Age at pre-release (Wave 1) interview 1,697 28.89 (7.14) 29.30 (7.48) −1.17 White 1,694 0.32 (0.46) 0.37 (0.48) −2.30 Black 1,694 0.57 (0.50) 0.50 (0.50) 2.74 Hispanic 1,694 0.04 (0.20) 0.04 (0.20) −0.13 Multiracial/other 1,694 0.08 (0.27) 0.09 (0.29) −0.89 Born in United States 1,697 1.00 (0.07) 0.98 (0.13) 2.59 English is primary language 1,697 0.98 (0.13) 0.97 (0.16) 1.59 Homeless/shelter/no set place to live prior
to incarceration 1,695 0.12 (0.33) 0.12 (0.33) 0.18
Employment History Ever held a job 1,696 0.89 (0.31) 0.92 (0.27) −2.21 Employed during 6 months prior to
incarceration 1,696 0.64 (0.48) 0.68 (0.47) −2.04
Source of support 6 months prior to incarceration: Family 1,693 0.32 (0.47) 0.31 (0.46) 0.15
Source of support 6 months prior to incarceration: Friends 1,693 0.16 (0.37) 0.14 (0.35) 1.40
Source of support 6 months prior to incarceration: Government 1,693 0.11 (0.31) 0.10 (0.30) 0.48
Source of support 6 months prior to incarceration: Illegal income 1,693 0.45 (0.50) 0.43 (0.50) 0.99
Source of support 6 months prior to incarceration: Other 1,693 0.07 (0.25) 0.10 (0.30) −2.14
Last job: Hours worked per week 1,107 41.72 (13.86) 41.76 (14.07) −0.04 Last job: Hourly salary 1,083 10.91 (8.51) 10.13 (6.87) 1.67 Last job: Was permanent 1,117 0.75 (0.43) 0.73 (0.44) 0.65 Last job: Received formal pay 1,120 0.74 (0.44) 0.72 (0.45) 0.64 Last job: Health insurance provided 1,094 0.37 (0.48) 0.34 (0.47) 0.93 Completed 12th grade or GED/other high
school equivalent 1,695 0.61 (0.49) 0.58 (0.49) 0.88
Currently in school 1,697 0.15 (0.35) 0.13 (0.34) 0.83 Ever served in the military 1,697 0.05 (0.22) 0.05 (0.21) 0.39
Family and Peers Married 1,697 0.09 (0.28) 0.10 (0.30) −1.05 Involved in steady relationship 6 months
prior to incarceration 1,693 0.68 (0.47) 0.69 (0.46) −0.28
Currently married or in steady relationship 1,690 0.39 (0.49) 0.40 (0.49) −0.33 Lived with spouse/partner before
incarceration 670 0.59 (0.49) 0.67 (0.47) −2.15
(continued)

Appendix A – Data Tables
A-3
Exhibit A-2. Respondent characteristics, by group (pre-release; continued)
Characteristic N SVORI
Mean (SD) Non-SVORI Mean (SD) t-statistic
Family and Peers (continued) Have any living children 1,684 0.62 (0.49) 0.64 (0.48) −0.88 Number of children (only respondents with
children) 1,056 2.22 (1.63) 2.29 (1.60) −0.65
Number of children (respondents with and without children) 1,684 1.37 (1.67) 1.46 (1.69) −1.07
Have child(ren) under 18 1,684 0.59 (0.49) 0.61 (0.49) −0.59 Primary care responsibilities for any
children under 18 6 months prior to incarceration
1,009 0.47 (0.50) 0.49 (0.50) −0.59
Number of children under 18 supported 6 months prior to incarceration 527 1.17 (1.18) 1.19 (1.18) −0.23
Required to pay child support 6 months prior to incarceration 1,007 0.30 (0.46) 0.32 (0.47) −0.56
Made court-ordered child support payments 6 months prior to incarceration 312 0.59 (0.49) 0.56 (0.50) 0.51
Court order for support changed while incarcerated 283 0.26 (0.44) 0.27 (0.44) −0.01
Owe back child support 301 0.93 (0.25) 0.91 (0.29) 0.73
Dollar amount of back child support owed 234 9127.02 (11281.27)
10728.93 (12558.94) −1.03
State has forgiven/decreased back child support 253 0.05 (0.21) 0.09 (0.28) −1.21
Have people in life that are considered family 1,697 0.97 (0.16) 0.97 (0.17) 0.27
Have a family member who has been convicted of a crime 1,574 0.75 (0.43) 0.76 (0.43) −0.22
Have a family member who has been in a correctional facility 1,602 0.75 (0.44) 0.74 (0.44) 0.21
Have a family member who has had problems with drugs/alcohol 1,591 0.72 (0.45) 0.74 (0.44) −0.99
Family emotional support scale (0–30: >more support) 1,615 21.63 (4.87) 21.35 (4.71) 1.18
Had a friend (before incarceration) who has been convicted of a crime 1,540 0.83 (0.37) 0.83 (0.37) −0.07
Had a friend (before incarceration) who has been in a correctional facility 1,556 0.81 (0.39) 0.81 (0.39) 0.03
Had a friend (before incarceration) who has had problems with drugs or alcohol 1,572 0.82 (0.39) 0.83 (0.38) −0.42
Physical and Mental Health Physical health scale (>better) 1,673 53.63 (9.23) 53.34 (9.19) 0.64 Mental health scale (>better) 1,673 48.93 (10.54) 48.51 (10.65) 0.80 Received treatment for mental health
problem prior to this incarceration 1,693 0.24 (0.43) 0.25 (0.44) −0.52
Global Severity Index (45–225: >worse) 1,697 66.64 (21.43) 68.09 (23.07) −1.34 Positive Symptom Total (0–45: >worse) 1,697 12.62 (9.77) 13.33 (10.07) −1.47
(continued)
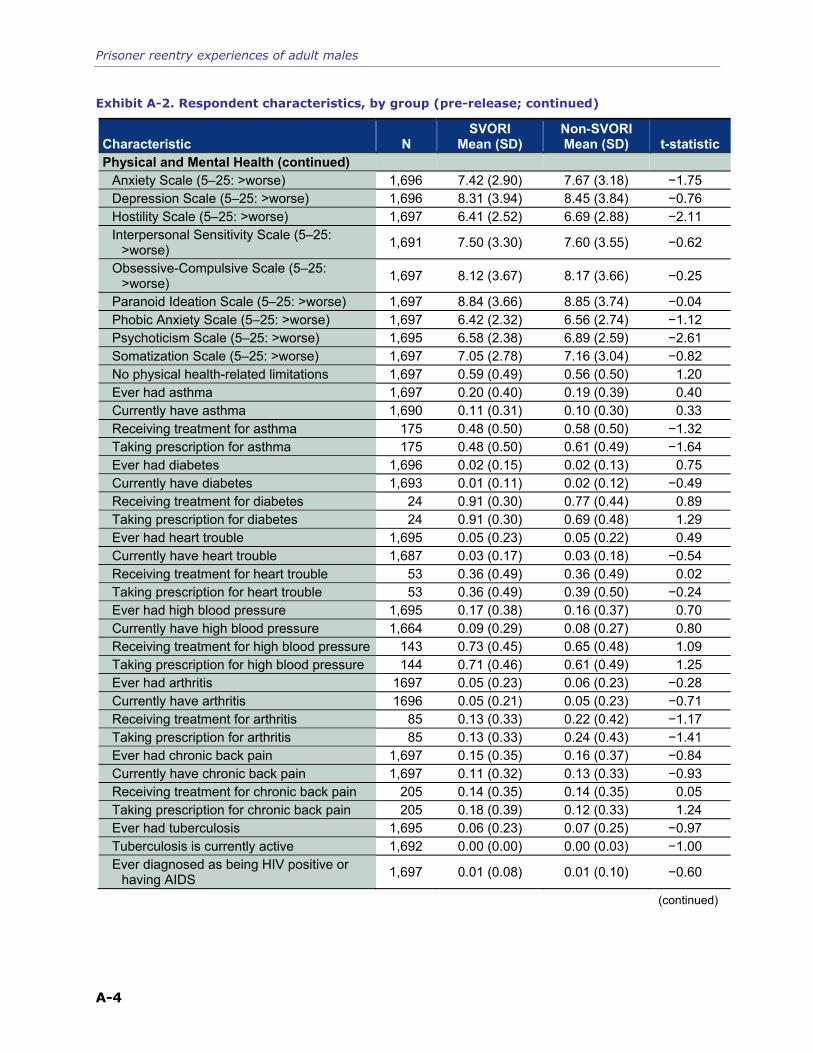
Prisoner reentry experiences of adult males
A-4
Exhibit A-2. Respondent characteristics, by group (pre-release; continued)
Characteristic N SVORI
Mean (SD) Non-SVORI Mean (SD) t-statistic
Physical and Mental Health (continued) Anxiety Scale (5–25: >worse) 1,696 7.42 (2.90) 7.67 (3.18) −1.75 Depression Scale (5–25: >worse) 1,696 8.31 (3.94) 8.45 (3.84) −0.76 Hostility Scale (5–25: >worse) 1,697 6.41 (2.52) 6.69 (2.88) −2.11 Interpersonal Sensitivity Scale (5–25:
>worse) 1,691 7.50 (3.30) 7.60 (3.55) −0.62
Obsessive-Compulsive Scale (5–25: >worse) 1,697 8.12 (3.67) 8.17 (3.66) −0.25
Paranoid Ideation Scale (5–25: >worse) 1,697 8.84 (3.66) 8.85 (3.74) −0.04 Phobic Anxiety Scale (5–25: >worse) 1,697 6.42 (2.32) 6.56 (2.74) −1.12 Psychoticism Scale (5–25: >worse) 1,695 6.58 (2.38) 6.89 (2.59) −2.61 Somatization Scale (5–25: >worse) 1,697 7.05 (2.78) 7.16 (3.04) −0.82 No physical health-related limitations 1,697 0.59 (0.49) 0.56 (0.50) 1.20 Ever had asthma 1,697 0.20 (0.40) 0.19 (0.39) 0.40 Currently have asthma 1,690 0.11 (0.31) 0.10 (0.30) 0.33 Receiving treatment for asthma 175 0.48 (0.50) 0.58 (0.50) −1.32 Taking prescription for asthma 175 0.48 (0.50) 0.61 (0.49) −1.64 Ever had diabetes 1,696 0.02 (0.15) 0.02 (0.13) 0.75 Currently have diabetes 1,693 0.01 (0.11) 0.02 (0.12) −0.49 Receiving treatment for diabetes 24 0.91 (0.30) 0.77 (0.44) 0.89 Taking prescription for diabetes 24 0.91 (0.30) 0.69 (0.48) 1.29 Ever had heart trouble 1,695 0.05 (0.23) 0.05 (0.22) 0.49 Currently have heart trouble 1,687 0.03 (0.17) 0.03 (0.18) −0.54 Receiving treatment for heart trouble 53 0.36 (0.49) 0.36 (0.49) 0.02 Taking prescription for heart trouble 53 0.36 (0.49) 0.39 (0.50) −0.24 Ever had high blood pressure 1,695 0.17 (0.38) 0.16 (0.37) 0.70 Currently have high blood pressure 1,664 0.09 (0.29) 0.08 (0.27) 0.80 Receiving treatment for high blood pressure 143 0.73 (0.45) 0.65 (0.48) 1.09 Taking prescription for high blood pressure 144 0.71 (0.46) 0.61 (0.49) 1.25 Ever had arthritis 1697 0.05 (0.23) 0.06 (0.23) −0.28 Currently have arthritis 1696 0.05 (0.21) 0.05 (0.23) −0.71 Receiving treatment for arthritis 85 0.13 (0.33) 0.22 (0.42) −1.17 Taking prescription for arthritis 85 0.13 (0.33) 0.24 (0.43) −1.41 Ever had chronic back pain 1,697 0.15 (0.35) 0.16 (0.37) −0.84 Currently have chronic back pain 1,697 0.11 (0.32) 0.13 (0.33) −0.93 Receiving treatment for chronic back pain 205 0.14 (0.35) 0.14 (0.35) 0.05 Taking prescription for chronic back pain 205 0.18 (0.39) 0.12 (0.33) 1.24 Ever had tuberculosis 1,695 0.06 (0.23) 0.07 (0.25) −0.97 Tuberculosis is currently active 1,692 0.00 (0.00) 0.00 (0.03) −1.00 Ever diagnosed as being HIV positive or
having AIDS 1,697 0.01 (0.08) 0.01 (0.10) −0.60
(continued)
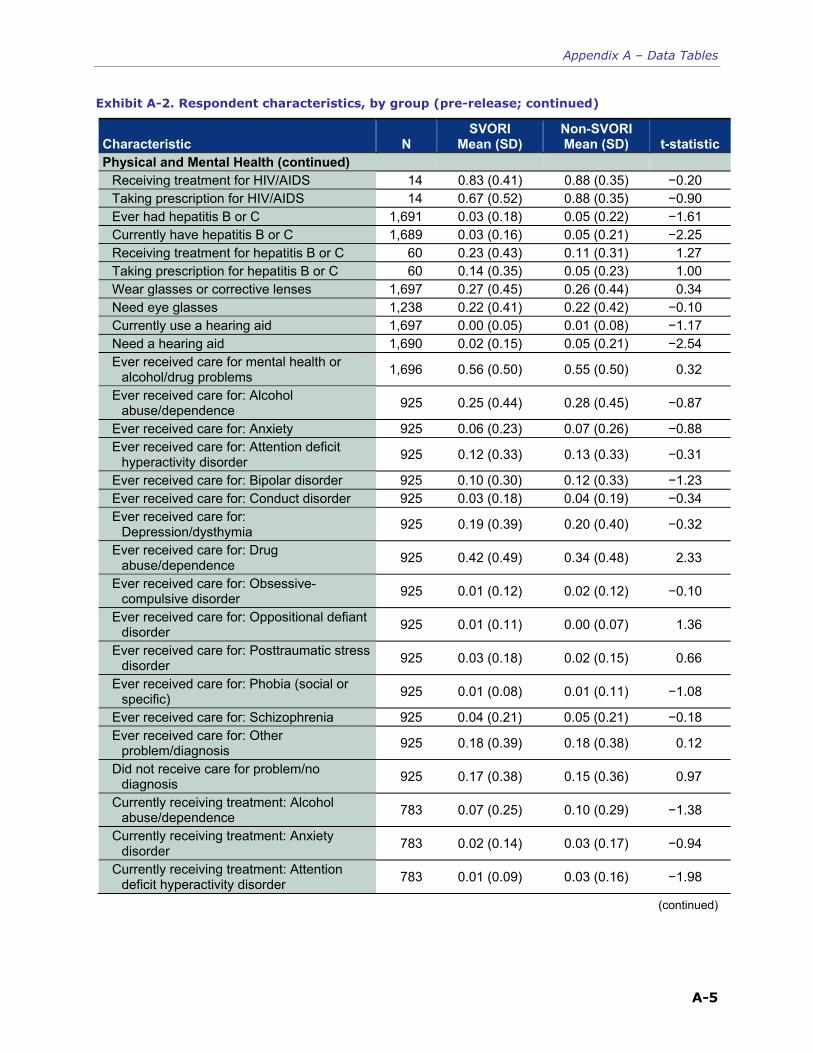
Appendix A – Data Tables
A-5
Exhibit A-2. Respondent characteristics, by group (pre-release; continued)
Characteristic N SVORI
Mean (SD) Non-SVORI Mean (SD) t-statistic
Physical and Mental Health (continued) Receiving treatment for HIV/AIDS 14 0.83 (0.41) 0.88 (0.35) −0.20 Taking prescription for HIV/AIDS 14 0.67 (0.52) 0.88 (0.35) −0.90 Ever had hepatitis B or C 1,691 0.03 (0.18) 0.05 (0.22) −1.61 Currently have hepatitis B or C 1,689 0.03 (0.16) 0.05 (0.21) −2.25 Receiving treatment for hepatitis B or C 60 0.23 (0.43) 0.11 (0.31) 1.27 Taking prescription for hepatitis B or C 60 0.14 (0.35) 0.05 (0.23) 1.00 Wear glasses or corrective lenses 1,697 0.27 (0.45) 0.26 (0.44) 0.34 Need eye glasses 1,238 0.22 (0.41) 0.22 (0.42) −0.10 Currently use a hearing aid 1,697 0.00 (0.05) 0.01 (0.08) −1.17 Need a hearing aid 1,690 0.02 (0.15) 0.05 (0.21) −2.54 Ever received care for mental health or
alcohol/drug problems 1,696 0.56 (0.50) 0.55 (0.50) 0.32
Ever received care for: Alcohol abuse/dependence 925 0.25 (0.44) 0.28 (0.45) −0.87
Ever received care for: Anxiety 925 0.06 (0.23) 0.07 (0.26) −0.88 Ever received care for: Attention deficit
hyperactivity disorder 925 0.12 (0.33) 0.13 (0.33) −0.31
Ever received care for: Bipolar disorder 925 0.10 (0.30) 0.12 (0.33) −1.23 Ever received care for: Conduct disorder 925 0.03 (0.18) 0.04 (0.19) −0.34 Ever received care for:
Depression/dysthymia 925 0.19 (0.39) 0.20 (0.40) −0.32
Ever received care for: Drug abuse/dependence 925 0.42 (0.49) 0.34 (0.48) 2.33
Ever received care for: Obsessive-compulsive disorder 925 0.01 (0.12) 0.02 (0.12) −0.10
Ever received care for: Oppositional defiant disorder 925 0.01 (0.11) 0.00 (0.07) 1.36
Ever received care for: Posttraumatic stress disorder 925 0.03 (0.18) 0.02 (0.15) 0.66
Ever received care for: Phobia (social or specific) 925 0.01 (0.08) 0.01 (0.11) −1.08
Ever received care for: Schizophrenia 925 0.04 (0.21) 0.05 (0.21) −0.18 Ever received care for: Other
problem/diagnosis 925 0.18 (0.39) 0.18 (0.38) 0.12
Did not receive care for problem/no diagnosis 925 0.17 (0.38) 0.15 (0.36) 0.97
Currently receiving treatment: Alcohol abuse/dependence 783 0.07 (0.25) 0.10 (0.29) −1.38
Currently receiving treatment: Anxiety disorder 783 0.02 (0.14) 0.03 (0.17) −0.94
Currently receiving treatment: Attention deficit hyperactivity disorder 783 0.01 (0.09) 0.03 (0.16) −1.98
(continued)

Prisoner reentry experiences of adult males
A-6
Exhibit A-2. Respondent characteristics, by group (pre-release; continued)
Characteristic N SVORI
Mean (SD) Non-SVORI Mean (SD) t-statistic
Physical and Mental Health (continued) Currently receiving treatment: Bipolar
disorder 783 0.05 (0.21) 0.06 (0.24) −0.69
Currently receiving treatment: Conduct disorder 783 0.01 (0.07) 0.01 (0.09) −0.47
Currently receiving treatment: Depression/dysthymia 783 0.06 (0.23) 0.10 (0.29) −2.10
Currently receiving treatment: Drug abuse/dependence 783 0.10 (0.31) 0.09 (0.28) 0.90
Currently receiving treatment: Obsessive-compulsive disorder 783 0.00 (0.00) 0.01 (0.09) −1.74
Currently receiving treatment: Oppositional defiant disorder 783 0.00 (0.00) 0.00 (0.00)
Currently receiving treatment: Posttraumatic stress disorder 783 0.01 (0.11) 0.01 (0.10) 0.31
Currently receiving treatment: Phobia (social or specific) 783 0.00 (0.05) 0.00 (0.05) −0.01
Currently receiving treatment: Schizophrenia 783 0.04 (0.19) 0.03 (0.18) 0.15
Currently receiving treatment: Other problem/diagnosis 783 0.05 (0.22) 0.06 (0.24) −0.68
Currently not receiving treatment for any condition 783 0.72 (0.45) 0.67 (0.47) 1.48
Doctor prescribed medication for emotional/psychological problem during this incarceration
1,697 0.13 (0.34) 0.19 (0.39) −3.23
Received the prescribed medication 268 0.95 (0.23) 0.96 (0.21) −0.33 Any victimization (6 months prior to
incarceration) 1,696 0.59 (0.49) 0.58 (0.49) 0.61
Victimization severity prior to incarceration (0–30: >worse) 1,696 3.87 (5.61) 3.75 (5.49) 0.47
Any victimization (during incarceration) 1,696 0.55 (0.50) 0.54 (0.50) 0.47 Victimization severity during incarceration
(0–36: >worse) 1,696 2.71 (3.64) 2.88 (4.05) −0.93
Substance Use Ever drank any type of alcoholic beverage 1,696 0.96 (0.19) 0.97 (0.17) −0.80 Age at first drink 1,616 13.71 (3.85) 13.64 (3.76) 0.34 Used alcohol 30 days prior to this
incarceration 1,693 0.68 (0.47) 0.67 (0.47) 0.43
Age at last drink if no alcohol 30 days prior 479 24.18 (7.41) 25.66 (7.86) −2.11 Ever used drugs 1,697 0.94 (0.24) 0.96 (0.21) −1.67 Number of drugs used in lifetime 1,697 3.39 (2.78) 3.84 (2.93) −3.26 Used drugs 30 days prior to this
incarceration 1,696 0.66 (0.48) 0.69 (0.46) −1.56
Number of drugs used 30 days prior to this incarceration 1,697 1.37 (1.56) 1.58 (1.75) −2.63
(continued)
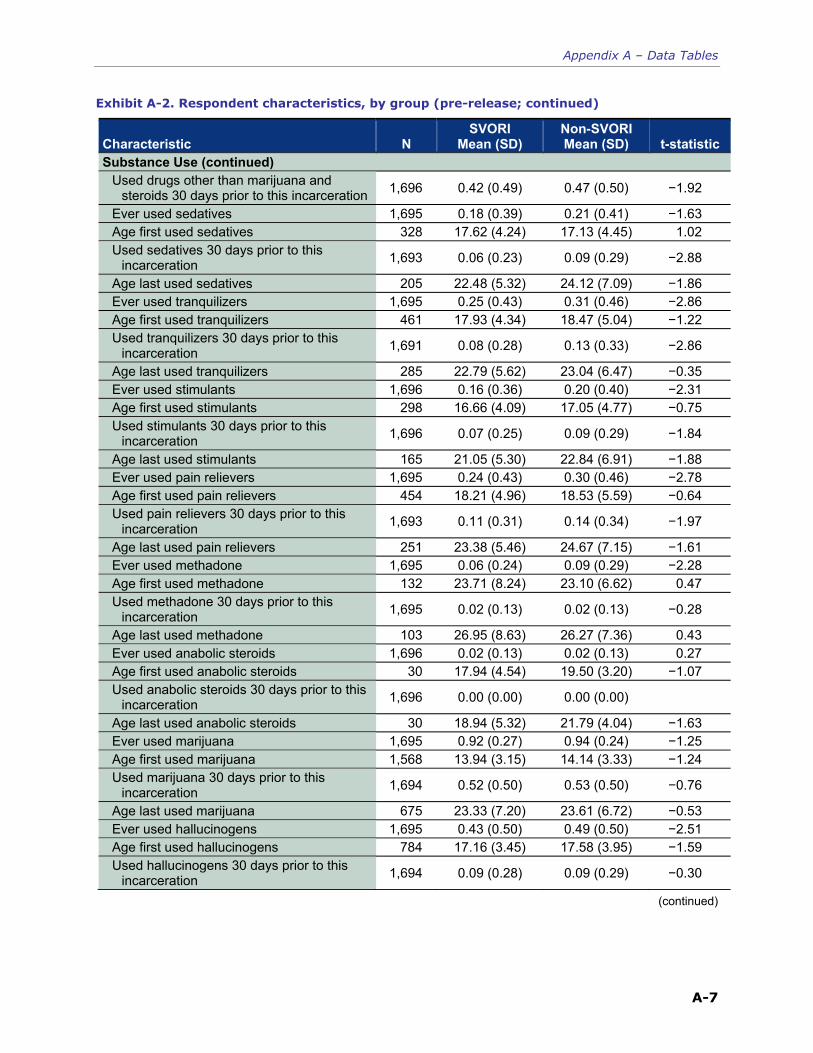
Appendix A – Data Tables
A-7
Exhibit A-2. Respondent characteristics, by group (pre-release; continued)
Characteristic N SVORI
Mean (SD) Non-SVORI Mean (SD) t-statistic
Substance Use (continued) Used drugs other than marijuana and
steroids 30 days prior to this incarceration 1,696 0.42 (0.49) 0.47 (0.50) −1.92
Ever used sedatives 1,695 0.18 (0.39) 0.21 (0.41) −1.63 Age first used sedatives 328 17.62 (4.24) 17.13 (4.45) 1.02 Used sedatives 30 days prior to this
incarceration 1,693 0.06 (0.23) 0.09 (0.29) −2.88
Age last used sedatives 205 22.48 (5.32) 24.12 (7.09) −1.86 Ever used tranquilizers 1,695 0.25 (0.43) 0.31 (0.46) −2.86 Age first used tranquilizers 461 17.93 (4.34) 18.47 (5.04) −1.22 Used tranquilizers 30 days prior to this
incarceration 1,691 0.08 (0.28) 0.13 (0.33) −2.86
Age last used tranquilizers 285 22.79 (5.62) 23.04 (6.47) −0.35 Ever used stimulants 1,696 0.16 (0.36) 0.20 (0.40) −2.31 Age first used stimulants 298 16.66 (4.09) 17.05 (4.77) −0.75 Used stimulants 30 days prior to this
incarceration 1,696 0.07 (0.25) 0.09 (0.29) −1.84
Age last used stimulants 165 21.05 (5.30) 22.84 (6.91) −1.88 Ever used pain relievers 1,695 0.24 (0.43) 0.30 (0.46) −2.78 Age first used pain relievers 454 18.21 (4.96) 18.53 (5.59) −0.64 Used pain relievers 30 days prior to this
incarceration 1,693 0.11 (0.31) 0.14 (0.34) −1.97
Age last used pain relievers 251 23.38 (5.46) 24.67 (7.15) −1.61 Ever used methadone 1,695 0.06 (0.24) 0.09 (0.29) −2.28 Age first used methadone 132 23.71 (8.24) 23.10 (6.62) 0.47 Used methadone 30 days prior to this
incarceration 1,695 0.02 (0.13) 0.02 (0.13) −0.28
Age last used methadone 103 26.95 (8.63) 26.27 (7.36) 0.43 Ever used anabolic steroids 1,696 0.02 (0.13) 0.02 (0.13) 0.27 Age first used anabolic steroids 30 17.94 (4.54) 19.50 (3.20) −1.07 Used anabolic steroids 30 days prior to this
incarceration 1,696 0.00 (0.00) 0.00 (0.00)
Age last used anabolic steroids 30 18.94 (5.32) 21.79 (4.04) −1.63 Ever used marijuana 1,695 0.92 (0.27) 0.94 (0.24) −1.25 Age first used marijuana 1,568 13.94 (3.15) 14.14 (3.33) −1.24 Used marijuana 30 days prior to this
incarceration 1,694 0.52 (0.50) 0.53 (0.50) −0.76
Age last used marijuana 675 23.33 (7.20) 23.61 (6.72) −0.53 Ever used hallucinogens 1,695 0.43 (0.50) 0.49 (0.50) −2.51 Age first used hallucinogens 784 17.16 (3.45) 17.58 (3.95) −1.59 Used hallucinogens 30 days prior to this
incarceration 1,694 0.09 (0.28) 0.09 (0.29) −0.30
(continued)

Prisoner reentry experiences of adult males
A-8
Exhibit A-2. Respondent characteristics, by group (pre-release; continued)
Characteristic N SVORI
Mean (SD) Non-SVORI Mean (SD) t-statistic
Substance Use (continued) Age last used hallucinogens 626 20.92 (4.07) 21.56 (5.35) −1.69 Ever used cocaine 1,694 0.53 (0.50) 0.58 (0.49) −2.09 Age first used cocaine 935 19.39 (5.32) 19.52 (4.90) −0.39 Used cocaine 30 days prior to this
incarceration 1,694 0.22 (0.42) 0.26 (0.44) −1.77
Age last used cocaine 528 24.65 (7.31) 24.62 (6.95) 0.04 Ever used heroin 1,695 0.18 (0.38) 0.23 (0.42) −2.59 Age first used heroin 343 20.90 (6.13) 21.34 (5.62) −0.68 Used heroin 30 days prior to this
incarceration 1,695 0.08 (0.27) 0.09 (0.28) −0.83
Age last used heroin 206 26.19 (8.70) 24.75 (6.65) 1.30 Ever used amphetamines 1,692 0.26 (0.44) 0.30 (0.46) −1.86 Age first used amphetamines 473 17.10 (3.76) 18.47 (4.81) −3.47 Used amphetamines 30 days prior to this
incarceration 1,690 0.13 (0.33) 0.14 (0.34) −0.55
Age last used amphetamines 251 22.58 (5.97) 23.74 (6.49) −1.45 Ever used inhalants 1,694 0.15 (0.36) 0.16 (0.37) −0.63 Age first used inhalants 267 15.83 (3.91) 15.76 (3.34) 0.16 Used inhalants 30 days prior to this
incarceration 1,693 0.01 (0.10) 0.01 (0.08) 0.71
Age last used inhalants 252 18.06 (4.87) 17.34 (4.17) 1.26 Received alcohol/drug treatment before this
incarceration 1,696 0.42 (0.49) 0.41 (0.49) 0.42
Current Incarceration and Criminal Historya Duration of incarceration at Wave 1
interview (years) 1,697 2.76 (2.46) 2.26 (2.63) 4.10
Wave 1 conviction offense(s) category: Person/violent crime 1,688 0.42 (0.49) 0.40 (0.49) 0.92
Robbery 1,688 0.15 (0.36) 0.13 (0.33) 1.28 Assault 1,688 0.19 (0.39) 0.16 (0.36) 1.88 Lethal crime 1,688 0.04 (0.21) 0.03 (0.17) 1.68 Sex offense 1,688 0.05 (0.22) 0.07 (0.25) −1.51 Other person/violent crime 1,688 0.03 (0.18) 0.06 (0.24) −2.46
Wave 1 conviction offense(s) category: Property crime 1,688 0.24 (0.43) 0.27 (0.44) −1.35
Burglary 1,688 0.11 (0.31) 0.12 (0.32) −0.71 Theft 1,688 0.08 (0.28) 0.08 (0.27) 0.43 Car theft 1,688 0.03 (0.16) 0.03 (0.18) −0.55 Fraud/forgery 1,688 0.02 (0.15) 0.05 (0.21) −2.52 Other property crime 1,688 0.04 (0.20) 0.05 (0.21) −0.50
(continued)

Appendix A – Data Tables
A-9
Exhibit A-2. Respondent characteristics, by group (pre-release; continued)
Characteristic N SVORI
Mean (SD) Non-SVORI Mean (SD) t-statistic
Current Incarceration and Criminal Historya (continued) Wave 1 conviction offense(s) category:
Drug crime 1,688 0.36 (0.48) 0.31 (0.46) 2.36
Drug dealing/manufacturing 1,688 0.21 (0.41) 0.15 (0.36) 3.34 Drug possession 1,688 0.22 (0.41) 0.21 (0.41) 0.65 Other drug offense 1,688 0.01 (0.11) 0.01 (0.10) 0.16
Wave 1 conviction offense(s) category: Public order crime 1,688 0.17 (0.37) 0.22 (0.42) −2.92
Wave 1 conviction offense(s) category: Other crime 1,688 0.02 (0.13) 0.01 (0.10) 1.21
Current incarceration for probation or parole violation 1,695 0.27 (0.44) 0.35 (0.48) −3.71
Current incarceration for probation violation 1,695 0.05 (0.22) 0.06 (0.25) −1.42 Current incarceration for parole violation 1,695 0.22 (0.41) 0.29 (0.45) −3.18 Parole violation: Technical violation 459 0.59 (0.49) 0.64 (0.48) −1.05 Parole violation: New crime 459 0.42 (0.49) 0.37 (0.48) 1.03 Age at first arrest 1,685 15.92 (4.78) 16.03 (5.09) −0.47 Number of lifetime arrests 1,586 12.42 (11.45) 13.14 (11.39) −1.25 Number of lifetime convictions 1,658 5.48 (6.05) 5.70 (6.26) −0.73 Number of lifetime convictions/age at
incarceration 1,658 0.21 (0.24) 0.22 (0.25) −0.25
Ever locked up in a juvenile correctional facility for committing a crime 1,696 0.51 (0.50) 0.49 (0.50) 1.07
Number of times in juvenile lockup (only those who reported ever being locked up) 833 3.58 (3.89) 3.49 (3.64) 0.35
Number of times in juvenile lockup (all respondents) 1,680 1.82 (3.30) 1.69 (3.07) 0.86
Ever been in jail/prison more than 24 hours at one time 1,694 0.83 (0.38) 0.87 (0.33) −2.42
Number of times sent to prison (only those who reported ever having been in prison) 1,434 1.45 (1.82) 1.69 (2.05) −2.35
Number of times sent to prison (all respondents) 1,688 1.20 (1.74) 1.47 (1.99) −2.97
Any disciplinary infractions during this incarceration 1,694 0.65 (0.48) 0.56 (0.50) 3.50
One disciplinary infraction during this incarceration 1,694 0.17 (0.38) 0.17 (0.37) 0.36
Two or more disciplinary infractions during this incarceration 1,694 0.47 (0.50) 0.40 (0.49) 3.17
Placed in administrative segregation during this incarceration 1,692 0.45 (0.50) 0.40 (0.49) 2.41
(continued)

Prisoner reentry experiences of adult males
A-10
Exhibit A-2. Respondent characteristics, by group (pre-release; continued)
Characteristic N SVORI
Mean (SD) Non-SVORI Mean (SD) t-statistic
Current Incarceration and Criminal Historya (continued) Current gang member 1,688 0.05 (0.21) 0.06 (0.24) −1.45 Considers gang to be family 92 0.53 (0.51) 0.52 (0.50) 0.05 Relatives are members of the gang 92 0.55 (0.50) 0.58 (0.50) −0.26 Any perpetration of violence (6 months
prior to incarceration) 1,697 0.69 (0.46) 0.67 (0.47) 0.80
Current Gang Member Have institution job 1,697 0.63 (0.48) 0.61 (0.49) 0.95 Have prison service job 1,692 0.60 (0.49) 0.57 (0.50) 1.40 Have prison industry job 1,692 0.04 (0.19) 0.04 (0.21) −0.77 Hours per week at institution job 1,035 23.78 (16.95) 22.29 (16.12) 1.45 Have work release job 1,697 0.03 (0.17) 0.04 (0.20) −1.31 Hours per week at work release job 59 39.92 (14.28) 30.97 (11.91) 2.63
Note: GED = general educational development. SD = standard deviation. Wave 1 = 30 days pre-release. a Results for W1 Conviction Offenses may not sum to 100% because some respondents reported multiple conviction
offenses.

Appendix A – Data Tables
A-11
Exhibit A-3. Proportion of respondents who reported needing specific services, by group (pre-release)
Service N SVORI
Mean (SD) Non-SVORI Mean (SD) t-statistic
Transition Services Legal assistance 1,690 0.45 (0.50) 0.48 (0.50) −1.38 Financial assistance 1,696 0.86 (0.35) 0.82 (0.39) 2.61 Public financial assistance 1,695 0.52 (0.50) 0.54 (0.50) −0.94 Public health care insurance 1,693 0.75 (0.43) 0.73 (0.45) 1.19 Mentor 1,695 0.60 (0.49) 0.61 (0.49) −0.37 Documents for employment 1,697 0.55 (0.50) 0.56 (0.50) −0.15 Place to live 1,695 0.49 (0.50) 0.46 (0.50) 1.32 Transportation 1,696 0.72 (0.45) 0.71 (0.46) 0.59 Driver’s license 1,697 0.83 (0.38) 0.81 (0.39) 1.02 Access to clothing/food banks 1,696 0.60 (0.49) 0.55 (0.50) 2.30
Health Services Medical treatment 1,696 0.56 (0.50) 0.57 (0.50) −0.19 Mental health treatment 1,693 0.22 (0.42) 0.29 (0.45) −3.09 Substance use treatment 1,696 0.37 (0.48) 0.43 (0.50) −2.64 Victims’ group for abuse 1,697 0.04 (0.20) 0.04 (0.20) 0.22 Anger management program 1,694 0.36 (0.48) 0.38 (0.48) −0.82
Employment/Education/Skills Services Job 1,696 0.80 (0.40) 0.76 (0.43) 1.94 Job training 1,696 0.82 (0.39) 0.76 (0.43) 2.62 More education 1,697 0.94 (0.24) 0.92 (0.27) 1.23 Money management skills 1,696 0.71 (0.45) 0.68 (0.47) 1.38 Life skills 1,690 0.75 (0.43) 0.73 (0.44) 0.96 Work on personal relationships 1,694 0.64 (0.48) 0.64 (0.48) 0.15 Change attitudes on criminal behavior 1,693 0.64 (0.48) 0.69 (0.46) −2.12
Domestic Violence Services Batterer intervention program 1,694 0.08 (0.27) 0.08 (0.27) −0.02 Domestic violence support group 1,695 0.06 (0.24) 0.09 (0.28) −2.23
Child Services Child support payments 995 0.45 (0.50) 0.48 (0.50) −1.04 Modification of child support debt 276 0.88 (0.33) 0.86 (0.35) 0.48 Modification of child custody 1,002 0.35 (0.48) 0.38 (0.49) −0.97 Parenting skills 1,009 0.60 (0.49) 0.63 (0.48) −1.11 Child care 1,007 0.39 (0.49) 0.39 (0.49) 0.08
SD = standard deviation.
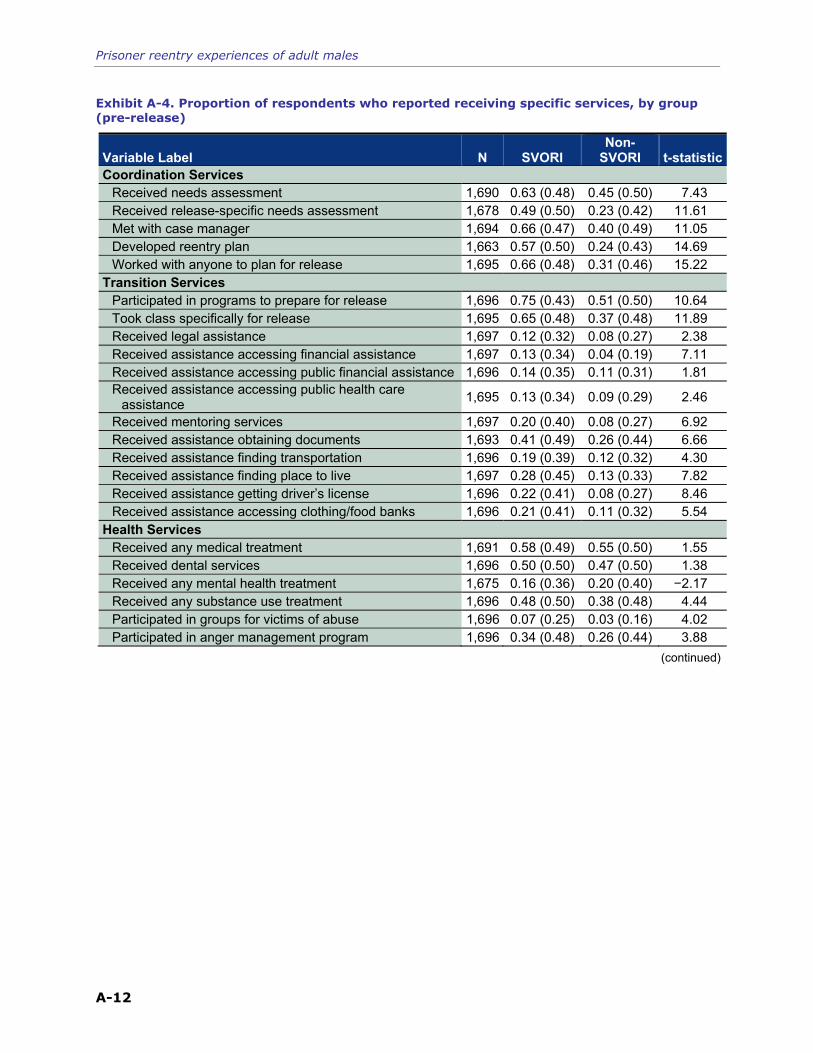
Prisoner reentry experiences of adult males
A-12
Exhibit A-4. Proportion of respondents who reported receiving specific services, by group (pre-release)
Variable Label N SVORI Non-
SVORI t-statisticCoordination Services
Received needs assessment 1,690 0.63 (0.48) 0.45 (0.50) 7.43 Received release-specific needs assessment 1,678 0.49 (0.50) 0.23 (0.42) 11.61 Met with case manager 1,694 0.66 (0.47) 0.40 (0.49) 11.05 Developed reentry plan 1,663 0.57 (0.50) 0.24 (0.43) 14.69 Worked with anyone to plan for release 1,695 0.66 (0.48) 0.31 (0.46) 15.22
Transition Services Participated in programs to prepare for release 1,696 0.75 (0.43) 0.51 (0.50) 10.64 Took class specifically for release 1,695 0.65 (0.48) 0.37 (0.48) 11.89 Received legal assistance 1,697 0.12 (0.32) 0.08 (0.27) 2.38 Received assistance accessing financial assistance 1,697 0.13 (0.34) 0.04 (0.19) 7.11 Received assistance accessing public financial assistance 1,696 0.14 (0.35) 0.11 (0.31) 1.81 Received assistance accessing public health care
assistance 1,695 0.13 (0.34) 0.09 (0.29) 2.46
Received mentoring services 1,697 0.20 (0.40) 0.08 (0.27) 6.92 Received assistance obtaining documents 1,693 0.41 (0.49) 0.26 (0.44) 6.66 Received assistance finding transportation 1,696 0.19 (0.39) 0.12 (0.32) 4.30 Received assistance finding place to live 1,697 0.28 (0.45) 0.13 (0.33) 7.82 Received assistance getting driver’s license 1,696 0.22 (0.41) 0.08 (0.27) 8.46 Received assistance accessing clothing/food banks 1,696 0.21 (0.41) 0.11 (0.32) 5.54
Health Services Received any medical treatment 1,691 0.58 (0.49) 0.55 (0.50) 1.55 Received dental services 1,696 0.50 (0.50) 0.47 (0.50) 1.38 Received any mental health treatment 1,675 0.16 (0.36) 0.20 (0.40) −2.17 Received any substance use treatment 1,696 0.48 (0.50) 0.38 (0.48) 4.44 Participated in groups for victims of abuse 1,696 0.07 (0.25) 0.03 (0.16) 4.02 Participated in anger management program 1,696 0.34 (0.48) 0.26 (0.44) 3.88
(continued)

Appendix A – Data Tables
A-13
Exhibit A-4. Proportion of respondents who reported receiving specific services, by group (pre-release; continued)
Variable Label N SVORI Non-
SVORI t-
statisticEmployment/Education/Skills Services
Received any employment services 1,696 0.37 (0.48) 0.19 (0.39) 8.71 Participated in employment readiness program 1,693 0.23 (0.42) 0.09 (0.28) 8.06 Participated in job training program 1,696 0.17 (0.38) 0.04 (0.20) 9.16 Talked to potential employer 1,696 0.15 (0.35) 0.06 (0.23) 6.37 Given advice about job interviewing 1,696 0.32 (0.47) 0.14 (0.35) 9.01 Given advice about answering questions about criminal
history 1,695 0.30 (0.46) 0.13 (0.34) 8.53
Given advice about how to behave on the job 1,696 0.31 (0.46) 0.13 (0.34) 9.12 Given names of people to contact in community to find
job 1,695 0.27 (0.44) 0.13 (0.33) 7.37
Put together a resume 1,696 0.24 (0.43) 0.10 (0.30) 8.01 Received any educational services 1,697 0.53 (0.50) 0.43 (0.50) 4.06 Received money management services 1,696 0.24 (0.43) 0.08 (0.27) 9.28 Received other life skills training 1,693 0.42 (0.49) 0.21 (0.41) 9.84 Received assistance with personal relationships 1,697 0.25 (0.43) 0.17 (0.37) 4.32 Received training to change criminal behavior attitudes 1,697 0.52 (0.50) 0.36 (0.48) 6.76
Domestic Violence Services Participated in batterer intervention programs 1,696 0.05 (0.22) 0.03 (0.18) 1.44 Participated in domestic violence support groups 1,697 0.11 (0.31) 0.06 (0.23) 3.91
Child Services Received assistance making child support payments 1,009 0.07 (0.25) 0.02 (0.14) 3.70 Received assistance modifying child support debt 310 0.22 (0.42) 0.11 (0.31) 2.77 Received assistance modifying child custody 1,009 0.04 (0.19) 0.02 (0.15) 1.29 Participated in parenting classes 1,011 0.25 (0.43) 0.15 (0.36) 4.04 Received assistance finding child care 1,010 0.08 (0.27) 0.03 (0.16) 3.73

Prisoner reentry experiences of adult males
A-14
Exhibit A-5. Proportion of respondents who reported living with the indicated individuals in the period since the last interview
Wave 2 Wave 3 Wave 4
Variable Label SVORI Non-
SVORI tstat SVORINon-
SVORI tstat SVORI Non-
SVORI tstat Mother/stepmother 0.35 0.33 0.6984 0.30 0.29 0.4019 0.26 0.27 −0.4099Boy/girlfriend/fiancé 0.18 0.19 −0.4843 0.23 0.29 −2.0785 0.27 0.26 0.2058Father/stepfather 0.18 0.15 1.1948 0.17 0.14 1.0535 0.13 0.14 −0.2771Sister/stepsister 0.16 0.12 1.8106 0.13 0.09 1.9282 0.11 0.12 −0.1980Child/stepchild 0.13 0.13 −0.1810 0.17 0.17 −0.2178 0.18 0.19 −0.2829Nobody 0.11 0.07 1.6992 0.10 0.08 0.9764 0.10 0.07 1.5907Brother/stepbrother 0.11 0.09 0.5784 0.10 0.10 0.3645 0.10 0.08 1.2370Someone else 0.09 0.10 −0.6759 0.10 0.10 0.0836 0.13 0.11 1.1021Niece/nephew 0.08 0.07 0.4181 0.06 0.06 0.4632 0.05 0.04 0.6577Husband/wife 0.07 0.09 −0.9268 0.09 0.10 −0.7288 0.10 0.12 −1.2257Friend 0.05 0.07 −1.3948 0.08 0.09 −0.5302 0.09 0.09 −0.1815Aunt/uncle 0.05 0.05 −0.2640 0.06 0.05 0.7254 0.05 0.05 −0.0921Grandparent 0.05 0.08 −1.9078 0.07 0.06 0.5972 0.05 0.08 −2.0237Facility/shelter residents
0.04 0.04 −0.0205 0.02 0.03 −1.0485 0.04 0.04 0.2925
Cousin 0.03 0.03 0.6960 0.04 0.03 1.4518 0.04 0.03 0.4846In-laws 0.02 0.03 −0.7852 0.02 0.03 −1.2500 0.02 0.02 −0.2261Foster parent 0.01 0.00 1.7353 0.00 0.01 −1.0064 0.00 0.00 0.5025Ex-husband/wife 0.00 0.00 NA 0.00 0.00 −0.1271 0.01 0.00 0.9270
Note: NA = not applicable. S = SVORI.