princples and practice - thevor · pdf filechapter one: ionictherapy ... diabetes and liver...
TRANSCRIPT

Homoeopathic Ionictherapy
Principles and Practice
A Practitioners Guide
Dr Douglas Jesse
the vortex of light and healing.net

Copyright Notice
Copyright © 1993, 1996, 2000.2006
All rights reserved by: Dr. Douglas Jesse
Electronic edition © the vortex of light and healing.net 2015
This book is protected by copyright. No part of it may be reproduced, electronically copied, stored in a retrieval system, or transmitted in any form
or by any means, without written permission.
All information in this book is for research and is not meant to be used for self medication or treatment. We recommend that anyone having personal health
problems should contact their Health Practitioner.

TABLE OF CONTENTS
HOMOEOPATHIC IONICTHERAPY.......................................................................................................................... 1
PRINCIPLES AND PRACTICE..................................................................................................................................... 1
A PRACTITIONERS GUIDE ......................................................................................................................................... 1
DR DOUGLAS JESSE ........................................................................................................................................................ 1 Chapter One: IONICTHERAPY................................................................................................................................ 5
Micronage................................................................................................................................................................................6 Glossary of Terms....................................................................................................................................................................7 Frequency ................................................................................................................................................................................7 Micronage................................................................................................................................................................................7 Milli Micronage.......................................................................................................................................................................7 Milli Milli Micronage ..............................................................................................................................................................7 Anion .......................................................................................................................................................................................7 Cation ......................................................................................................................................................................................7 Atom........................................................................................................................................................................................7 Molecule ..................................................................................................................................................................................8 Compound ...............................................................................................................................................................................8 Ion............................................................................................................................................................................................8 pH. ...........................................................................................................................................................................................8 Summary..................................................................................................................................................................................8
Chapter Two: THE LIVING EQUATION ............................................................................................................... 10 Metabolism............................................................................................................................................................................10 Grass Roots............................................................................................................................................................................11 Dr Charles Northern ..............................................................................................................................................................11 The Equation of Carey Reams ...............................................................................................................................................14
Chapter Three: THE IMPACT OF WESTERN MEDICINE.................................................................................... 17 Vitalism versus Mechanism...................................................................................................................................................17 Mechanism ............................................................................................................................................................................19 The Vital Force......................................................................................................................................................................20 The Holistic Approach...........................................................................................................................................................20 The Birth of Homoeopathy ....................................................................................................................................................21 Samuel Hahnemann ...............................................................................................................................................................23
Chapter Four: PROCEDURES............................................................................................................................... 27 The Analysis ..........................................................................................................................................................................27 Treatment...............................................................................................................................................................................27 The Equation..........................................................................................................................................................................27 Step 1: PATIENT DETAILS REQUIRED ............................................................................................................................32
Conducting a Test.............................................................................................................................................................32 Step 2: CONDUCTING THE TEST......................................................................................................................................33
(1) The Sugar Test - Total Carbohydrates. .......................................................................................................................33 Measuring the Urinary Sugars ..........................................................................................................................................35
Urine pH Measurement..........................................................................................................................................................35 Procedure..........................................................................................................................................................................35 Measuring the Saliva pH ..................................................................................................................................................35 Measuring Conductivity or Salt........................................................................................................................................36 Measuring the Albumen ...................................................................................................................................................36 Measuring the Urea ..........................................................................................................................................................36 Procedure..........................................................................................................................................................................37
Step 3: ENERGY MEASUREMENTS..................................................................................................................................39 Energy In ..........................................................................................................................................................................39 Energy Out .......................................................................................................................................................................39
Step 4: CALCULATE THE ENERGY SWING OF BODY CHEMISTRY..........................................................................40 Step 5: STAGES OF DEGENERATION ..............................................................................................................................43 Step 6: THE RANGE NUMBERS ........................................................................................................................................45
The Range Chart...............................................................................................................................................................46 How to Use the Range Chart ............................................................................................................................................46 Energy Loss:.....................................................................................................................................................................47 Body Swing: .....................................................................................................................................................................47
Step 7: THE ZONES .............................................................................................................................................................47 Step 8: THE RANGES ..........................................................................................................................................................49
Chapter Five: THE DISEASE PATTERNS AND ANALYSIS .................................................................................. 51

Disease Pattern One...............................................................................................................................................................51 Disease Pattern Two ..............................................................................................................................................................53 Disease Pattern Three ............................................................................................................................................................54 Disease Pattern Four ..............................................................................................................................................................55
Summary of Sugar Related Patterns .................................................................................................................................55 Disease Pattern Five ..............................................................................................................................................................56
pH Conditions ..................................................................................................................................................................58 Disease Pattern Six ................................................................................................................................................................58 Disease Pattern Seven............................................................................................................................................................59 Disease Pattern Eight.............................................................................................................................................................59 Disease Pattern Nine..............................................................................................................................................................60 Disease Pattern Ten ...............................................................................................................................................................60 Disease Pattern Eleven...........................................................................................................................................................61
Chapter Six.............................................................................................................................................................. 63 Step 9: SPEED OF DECLINE...............................................................................................................................................63 Step 10: MAJOR ORGAN OF ENERGY LOSS...................................................................................................................64
Major Organ Chart ...........................................................................................................................................................64 Step 11: THE BALANCED TEST ........................................................................................................................................65
Balanced Sugar.................................................................................................................................................................65 Balanced pH .....................................................................................................................................................................65 Balanced Salt....................................................................................................................................................................65
Step 12: CALCULATING THE ENERGIES ........................................................................................................................77 Balanced Test Example ....................................................................................................................................................78
Chapter Seven ......................................................................................................................................................... 80 Step 13: NUTRITION ...........................................................................................................................................................80
Urine Colours and their Meaning .....................................................................................................................................80 Turbidity...........................................................................................................................................................................82 The Saliva.........................................................................................................................................................................82 The Brain and Blood Sugar ..............................................................................................................................................83 Diabetes and Liver Function.............................................................................................................................................83 Important Factors Regarding Urinary Sugars ...................................................................................................................88
Chapter Eight: URINE AND SALIVA PH............................................................................................................... 90 Urine pH Ranges ...................................................................................................................................................................91 Urine pH Analysis .................................................................................................................................................................92 Saliva pH Ranges...................................................................................................................................................................93 Mineral Salts..........................................................................................................................................................................94 Mineral Salt Ranges...............................................................................................................................................................95 Nutritional Needs...................................................................................................................................................................97 Recent Heart Mal-function ....................................................................................................................................................97 Irregular Heart Stress .............................................................................................................................................................97 Patient Age and the Salt Ranges ............................................................................................................................................98
Chapter Nine: CELL DEBRIS............................................................................................................................... 101 The Urea Ranges .................................................................................................................................................................102 Urea Factors.........................................................................................................................................................................104
5
Chapter One: IONICTHERAPY
Ionization is considered as being the ability of the electrical potential of
charged particles of matter, called ions, to release energy when breaking down, building up, and in the formation of new cellular materials.
Ionization represents the basic energy factor of life. The primary substance
where ionization takes place is water. In the human body, as well as all animal bodies, the ionization process magnetises the mineral elements from the food,
providing that this ionization proceeds unhindered. This ionization process must follow the path of least resistance to actively proceed.
If there is a high resistance, the energy exchange or ionization will not occur.
If there is no resistance, over ionization occurs. In both instances, the energy
needs, as well as the health status of the organism, will rapidly decline.
Ionictherapy, or bio-energy, is based on Dr. Albert Einstein’s Theory of Relativity. Einstein mathematically demonstrated that energy was equal to
mass times conversion squared.
E = MC2 = Energy.
This equation states that matter, which is burned, either by heat from bacteria, fungus, or fire, is energy. Any chemical change that breaks matter into heat
molecules is energy. Therefore, the Base Exchange between matter, decay, and fire, is energy.
M = E – C2 (Electrical)
Matter is a solid state between electricity and heat. From this equation, we find that any object will equal its own weight in heat, plus the un-harnessed
potential of the total electrical force. Nothing in any chemical reaction is ever lost, only altered.
C2 (Electricity) = E - M
Electricity is the medium between heat and matter, and since all matter is
composed of anions and cations of heat through ionization, we can view the evolutionary cycle of all existence.
Einstein's equation is electrical energy or frequency energy.
Every part of the creation has a specific frequency pattern that is termed Q-
frequency. This Q-frequency denotes the kind or individual species, and in
Ionictherapy, this is called Micronage.

6
Micronage
Micronage means the species, whether it is a human, dog, horse, etc. However, the Q-frequency or micronage remains the same for all the same
species regardless of colour or race.
Dr. Carey Reams stated that if you know the frequency of a particular
individual, you know the diet they need, and it follows that all illness is due to energy imbalance.
To determine resistance in the ionization process of the digestive tract you
must understand the pH, or potential hydrogen ion imbalance. By measuring the resistance between the cations (acids) and anions (bases) you determine
this. The resistance factor is the probable energy factor.
Einstein gave the world the key equation of molecular energy, E = MC2.
However, resistance was not expressed in meaningful mathematical terms until Reams developed the Living Equation below.
SUGAR URINE
Ph SALIVA pH
SALINE
ALBUMIN NITRATE
AMMONIA
1.5% 6.40 6.40 6.6C 40,000ppm
3% 3%
To understand the equation, you need to learn the terminology related to
Ionictherapy. Whereas Albert Einstein formulated an equation for energy, Reams applied this information in an equation measuring ionization and
resistance applied to soil and human nutrition.
When assessing the equation you can map the individual's body chemistry by comparing their present test equation with the perfect test equation seen
above. The variables determined by this comparison allow you to locate the
exact area causing energy loss in the body.
All diseases stem from mineral deficiencies or the lack of ionization which creates energy loss, and this factor eliminates the need for naming diseases.
Cells are not correctly rebuilt, because physical decay results from mineral deficiencies, which in turn, is either due to a loss of frequency, or an alteration
in the resistance factor. Decaying tissue gives up more energy than healthy tissue. Unhealthy tissues give mathematical chemical readings either above or
below the normal ranges.

7
In the study of Ionictherapy, the following terminology is used:
Glossary of Terms
Frequency
Q-Frequency denotes the kind.
Micronage
This denotes the species. All members of the same species have the same Q-frequency. The physical and psychological processes such as colour, race,
personality, reflexes, etc. are determined by the milli-micronage and milli-milli-micronage. This allows recognition of a separate group within the species.
Milli Micronage
This means the colour and form, which distinguishes the differences between
the races, and it, must be taken into account when making specific diets for individuals.
Milli Milli Micronage
This is the individuality and personality differences in people. It is that factor
which rejects tissues when the energy structure is incompatible, seen with some organ transplants.
To enlarge on Reams' statement, we can say that the frequency of the foods
must harmonise with the individual’s frequency. If you know the frequency,
you know the diet energy requirements in patterns. If the diet fits the individual frequency patterns, you have health.
Anion
An anion is the smallest unit of energy, and is a negatively charged particle of
energy.
Cation
A cation is a positively charged particle of energy. Element
An element is any substance with the same atomic number that cannot be reduced to any simpler substance.
Atom
An atom is the smallest particle of matter that retains the properties of that
matter. It is composed of protons, neutrons, and electrons.
A proton carries a positive charge, which need not be constant.
A neutron is a proton and an electron that have fused and nullified their
respective energy fields.

8
An electron is an orbital particle responsible for the nuclear envelope. Its rotation determines its charge. It has a negative charge when rotating in a
clockwise direction relative to the spatial plane. If rotating counter- clockwise, it has a positive charge.
Molecule
A molecule is a complex atomic configuration composed of two or more atoms
in a definite energy ratio to each other.
Compound
A compound is two or more elements that when found together show
properties dissimilar from the properties of the individual parts.
Ion
An ion is a charged atomic particle. It may be either positive or negative depending on its nuclear atmosphere and the atomic energy balance. As
additional energy is applied to it, it may change its electrical energy potential and reverse its charges.
Isotope Has the same atomic number but a different atomic weight than its parent
element. An isotope can change directions when subjected to a powerful enough energy field. It tends to follow the greatest amount of energy pull.
pH.
pH is a logarithmic expression of the free hydrogen radicals in a given
substance or solution. The pH of the human blood ranges from 7.35 to 7.40. A
neutral pH is in pure distilled water. Above 7.00 is alkaline and below 7.00 is acid. With Ionictherapy, when the pH is above 6.4 the substance is anionic,
and below 6.4, cationic.
Since pH is a logarithmic expression, it is figured in powers of 10. A pH of 7.0 is 10-7, and the difference between a pH of 7.0 and 6 is 10. A pH of 8.0 is one
hundred times more than that of a pH of 6.0 (10 x 10). The lower the pH the faster the electrons will travel around the nucleus and the higher the pH, the
slower the electrons travel.
pH is a measure of the resistance between the cations and anions. The greater the resistance, the greater the heat is produced by this interaction. This is heat
energy. The resistance produced also produces the frequency or Q-frequency.
Summary
Most of the food you eat is cationic in its structure. When this food mixes with the anionic liver bile, the interaction between the food cations and the anionic
bile causes friction, producing energy. This energy is controlled or modified by enzyme systems.

9
The energy taken from the food is carried to the cells of the body. Through enzyme reactions the cells modify the energy frequencies to a level acceptable
to the Q-frequency of the body. The energy produced is used to build, replace, restructure, or repair existing body cells.
Health is the ratio and proportion of energy and no two people receive the
same amount of energy from the exact same amount of food. The living
equation shows the pH as being 6.4 /6.4, and when the electrons are moving at the speed necessary to produce 6.4 pH, you receive the most energy from
your food. Health is a series of pluses and minuses.
This book will teach you to evaluate those health factors, and apply them to your own health, and the health of others.

10
Chapter Two: THE LIVING EQUATION
The greatest problem I experienced in practice was conveying the healing
concepts of Ionictherapy to a patient, especially how it related to their illness. This procedure is necessary and takes time; however, if you are going to
practice Ionictherapy correctly, then you must first understand these concepts to successfully convey them to your patient in the simplest manner.
In the previous chapter, I stated that no one actually heals another person.
Medical practice has the opinion that through the use of drugs and invasive procedures, this heals those who consult them. However, the basis of true
healing follows the premise that every individual has within them the power that initiates healing. It is innate energy within the cells and tissues of the
body that produce the correct energy flow for perfect function.
Unless you accept the concept of innate energy, you will practice healing on a
hit or miss basis. More importantly, by not working with this innate healing energy you will not influence the healing response in your patient.
Often the concept of innate is a primary hurdle for those patients who have not
been previously exposed to receiving natural treatment. The patient faces a psychological change of attitude for them to embrace true inner healing. In
some instances, they are cannot leave behind the entrenched medical model they presume to be the only way. Often it requires more persuasion on your
part to alter this attitude.
The equation is broken down into seven different sections; however, the ratio of the sections determines the health and ionization factors within the body.
Metabolism
The equation measures the body’s metabolism. Metabolism is the body’s ability to efficiently utilise the nutrients from the food eaten, and the elimination of
waste products, often termed end products.
Most people you treat have no knowledge of the digestive tract’s metabolic process, and how the metabolism’s smooth and efficient function generates
good health. Metabolism is a dual process, one of building up and breaking down, cationic and anionic.
To lead a healthy life, you must gain more energy from the food that you eat,
than you use to eliminate waste products.
The first day you burn more energy than you gain, is the first day your reserve energy levels fall, and ageing and sickness begin.

11
When you assess the equation, you assess the energy potential an individual has gained from their food, less that energy expended on the elimination of
the waste products.
Grass Roots
There has been a mountain of documentation compiled on the history of medicine, as well as on those luminaries who in the past have pioneered the
changes. Bernard Aschner, M.D. in, The Art of the Healer, wrote that the
progress in medicine was made of a series of surging motions followed by periods of stagnation and or retrogression. He wrote:
‘The reason for this is that every so often when a new and important
contribution was made to the science of medicine, the profession hailed it as the solution of all medical problems.
‘Then there would be a period in which physicians discounted all former
knowledge and practiced a strict obedience to the newly organised routine.
‘After that, for a time, the progress of medical science would be at a standstill. Then inevitably there would appear one of the great leaders among physicians
those masters of medicine who would by their own wide vision, free their fellow workers from the narrow bonds of dogmatism and lead them again on
the road of progress.
(Aschner, Bernard. "The Age of the Healer" The Dial Press, Burton C. Hoffman. New York 1942 pp.11, 12.)
Moreover, Dr. Carey Reams was one such luminary!
There is not a lot of documentation on the life and teachings of Carey Reams.
He only wrote one known book, Choose Life or Death, in association with Cliff Dudley, which possibly is now out of print, and most, if not all of his concepts
on ionization and health, were taught by word of mouth. Carey Reams (? 1903 - 1985) introduced a system of healing based on the principles of ionization.
He is credited as being the originator of The Biological Theory of Ionization.
Some of his early mentors were Dr's Northrup and Northern who provided him with the information about anions and cations. He began to develop his theory
in 1929, which was based upon the minerals in food necessary for both life and
health. Ionization refers to what occurs to health when the necessary mineral elements become deficient in the diet, or in the soil.
Dr Charles Northern
There is little documentation regarding the life and work of Dr Charles
Northern. The most significant piece of information regarding his work stems from an article published in Cosmopolitan in June 1936, in an article titled,
Modern Miracle Man, relating to Proper Food Mineral Balance.
12
‘This quiet, unballyhooed pioneer and genius in the field of nutrition demonstrates that countless human ills stem from the fact that the improvised
soil of America no longer plant foods with the mineral elements essential to human nutrition and health! To overcome this alarming condition he doctors
sick soils, by seeming miracles, raises truly healthy and health giving fruits and vegetables.’
Dr. Charles Northern was a practicing physician specialising in diseases of the stomach, and nutritional disorders. When considering food values relative to
the treatment of disease, he realised that illness was attributed to food deficiencies and he traced the deficiency back to the soil. It was he who first
voiced the surprising assertion that we must make the soil building the basis for food building in order to accomplish human building.
He wrote in Cosmopolitan:
‘Bear in mind that minerals are vital to human metabolism and health, and
that no plant or animal can appropriate to itself any mineral which is not present in the soil upon which it feeds. When I first made this statement I was
ridiculed, for up to that time people had paid little attention to food deficiencies and even less to soil deficiencies. Men eminent in medicine denied that there
was any such thing as vegetables and fruits that did not contain sufficient
minerals for human needs. Eminent agricultural authorities insisted that all soil contained all the necessary minerals. They reasoned that plants take what they
need, and that is the function of the human body to appropriate what it requires. Failure to do so, they said, was a symptom of disorder.
‘We know that vitamins are complex chemical substances which are
indispensable to nutrition, and that each of them is of importance for the normal function of some special structure of the human body. Disorder and
disease result from vitamin deficiency.
‘It is not commonly realized that vitamins control the body’s appropriation of minerals, and in the absence of minerals they have no function to perform.
Lacking vitamins, the system can make some use of minerals, but lacking minerals, vitamins are useless.
‘The more I studied nutritional problems, and the effects of mineral deficiencies upon disease, the more plainly I saw that here lay the most direct approach to
better health, and more important it became in my mind to find a method of restoring the missing minerals in our food’.
Thus became the impetus for the nutritional system of analysis and treatment
procedures termed Biological Ionization. Northern concluded his article stating:
‘Disease preys most surely and most viciously on the undernourished and unfit plants, animals and human beings alike, and when the importance of these
obscure mineral elements is fully realized, the chemistry of life will have to be

13
rewritten. No man knows his mental or bodily capacity, how he can feel or how long he can live, for we are all cripples and weaklings. It is a disgrace to
science.’
From the research and investigation of soil to food, the fertile mind of Carey Reams quickly followed Northern's research with the soil and applied it to
human nutrition.
Regarding Reams' research, his pupil, Dan Skow, in Mainline Farming for
Century 21, wrote:
‘Translating the secrets of the universe into formulae suitable for farm application became workday activity when Einstein, Le Motte and Reams
discussed the problem. The chemical compounds and fertilizers might be easier to handle mentally, but in the final analysis the fullest measure of success in
crop production depends on understanding the abstractions Einstein gave to La Motte and Reams, and using the arithmetic of anions and cations to calculate
fertilization of crops for the growing season’. (Skow Dan Mainline Farming for Century 21 Acres USA. 1991. Missouri, pp
47.61)
In the same book, Charles Walters Jr. appended a note about Reams:
‘Carey Reams also endured the flight from reason that held sway for most of
his active years. Only in the twilight of his career did he write anything down for his most serious student, Dan Skow D.V.M. We are standing on the
shoulders of giants when we distribute knowledge at the feet of Masters. Cary Reams was such a Master’.
The equation has proved to be successful in assessing deficiencies in both soil
and human nutrition. The genius of Reams was to successfully adapt the equation from soil testing to testing the human organism, which provided the
analysis of mineral deficiency and the measure of the energy potential by understanding the metabolic process. This insight when applied by the
physician reverses many disease states inflicting the human race.
After reading Carey Reams' only book, one begins to feel the spirit of the
principles that he wrote. It is obvious that he was not a writer in the classical sense, and also many of his students agree that he was not a teacher.
However, he had a strong message that surpassed, nutritionally speaking, anything currently taught.

14
The Equation of Carey Reams
1 2 3 4 5 6 7 1.5 6.4 6.4 6.6C 0.04M 3 3
Where:
1.5 = Total Carbohydrate or Sugar Number
This is the total carbohydrate spilling into the urine and is measured on the Brix scale using a refractometer.
This number reflects the blood sugar range, and the oxygen potential in the blood.
The urinary sugars may be compared with the blood sugar as
follows. 1.5 to 2 mg of sugar to 100 ml of urine is comparative 80 t0 90
mg of glucose per 100 ml of blood.
6.4 = Urine pH
pH is a measure of the hydrogen ion concentration in a solution. It is not a qualitative or quantitative measure; rather it is a measure
of resistance. In other words, ionization is the resistance occurring between the cations and the anions, cations and cations and
anions and anions, and not the acid-alkaline balance.
We consider the electromagnetic reactions of the various ions in the digestive tract relative to pH balance. As the pH moves away
from 6.40 the resistance level is altered.
On the general pH scale, a pH of 7.00 is neutral, and all numbers above 7 are considered as alkaline, whereas, numbers below 7 are
acid. Because Ionictherapy relates to energy balance, pH is regarded in
terms of being anionic or cationic, rather than alkaline and acid. Above 6.40 equals anionic
Below 6.40 equals cationic. In the digestive tract6.40 is the balance point between anionic and
cationic. The pH of the urine reflects the functioning of the digestive tract
and in particular the stomach, small intestines and colon. It also reflects the mineral balance of the body.
6.4 = the pH of the Saliva
The saliva pH reflects the strength of the liver bile as well as the
function of the pancreas, spleen and lymph systems.

15
6.6C = Conductivity or salt level
High salt retention and spillage reflect problems with the absorption of fats and the build-up of cholesterol, as well as the
potential stress on the circulatory system and colon. Low salt affect the electrolyte balance and the nervous system.
0.04M = Albumin or Cell Debris
Albumen is produced by the liver and circulates through the blood
where it collects wastes and dead blood cells.
3 = urea and in particular Nitrate Nitrogen
This number affects the right side of the body and is an anionic
substance which is produced by the liver and represents undigested protein.
3 equals Urea and in particular Ammonia Nitrogen
This is a cationic substance and affects the left side of the body
and is the result of the faulty breakdown of protein and is stored in the bloodstream.
Essentially, the equation involves the measure of the potential hydrogen in the body, and the hydrogen ion. Broadly speaking, pH is used as the measurement
of the degree of acidity within a chemical compound. Ionictherapy views pH as the electromagnetic effects of ionization, or the resistance level of energy flow
due to the reactions between the anions and cations, cations and cations and anions and anions in the digestive tract.
Most of the foods that we eat are high in mineral elements, which are required
for correct cell rebuilding. These mineral elements are ionic, that is they carry
an electric charge, which may be either positive or negative. Most minerals in our food are cationic, that is they carry a positive charge.
In order that the mineral elements may be utilised by the body, the digestive
tract must function at an optimal level of pH. The pH balance of the digestive tract requires the balanced ratio of three major factors. First, the liver must
produce bile of the correct strength, which is highly anionic. Secondly, the pancreas must supply anionic digestive enzymes, and lastly, the parietal cells
of the gastric glands produce hydrochloric acid that is cationic.

16
It is important that these three factors of digestion be maintained in a specific ratio of strength in order that the resistance level of the pH is maintained when
the food enters the digestive tract. Reactions occur between the acids, the bile, and the enzymes which breakdown the electron bonds of the food, converting
the mineral elements into useable substances for cellular rebuilding. At the same time, energy is released for the life cycle of the body.
It is seen from the above that if any one of the digestive juices are deficient, or too strong, then the level of pH is out of balance, altering the resistance factor.
As such, the energy requirements of the body become depleted.
pH is a reverse mathematical log which allows us to map the metabolic function correctly for the individual.
The majority of wastes from digestion are measured by their excretion in the
urine. These wastes indicate whether the body is spilling them out excessively, or retaining them in the form of toxic materials. Thus, the urine provides an
indication of what has occurred in the digestive tract.
Ionictherapy does not rely on symptoms for analysis, rather, it views the patterns of digestion as reflected by the test numbers, which represent the
body’s' own language in health and disease. These are not words, but rather
symbols in mathematical terms.

17
Chapter Three: THE IMPACT OF WESTERN MEDICINE
Generally, when viewing the practice of healing, and in particular Western
medicine, we can see that the essence of their teaching has not changed to any extent over the centuries. The earth has always provided those elements
necessary to support life. However, it is only by expanding consciousness that man has been able to respond to the continual healing entities available.
Throughout the existence of mankind on this planet, man has subjected
himself to the law of contraries. These are seen as opposites, such as left and right, light and dark, positive and negative, etc. This has often been viewed as
a dual expression, and likened to the pendulum as it swings from side to side. In the science of health, this has been expressed as vitalism and mechanism.
There are many misconceptions involved with the understanding of the principles of vitalism and mechanism. However, the continuing arguments
between the adherents of each system never provide any answers to the legitimacy of one above the other. This discourse will attempt to present to the
student the relative information on each system in their historical growth.
Vitalism versus Mechanism
The thoughts that shaped Western thinking and medicine
The philosophy and science that has dominated Western thinking and action
can be traced to ancient Greece. The most notable luminary was Socrates.
Socrates was tried for corrupting the young and showing disrespect for religious traditions. He is reputed to have founded the Socratic Sect. Being a
skeptic, he did not force his opinions on others, but through the method of
questioning, caused each person to give expression to their own philosophy.
Vitalism had its roots in history and was given greater impetus in the Greek Schools. It was, and still forms, the basis of almost all Western religions, and is
related to Socrates and his pupil Plato. Their concept of vitalism was the idea of supernatural forms or ideals from which all tangible objects and creatures
derived their individual characteristics.
He believed that although individual people or things vary, and are constructed differently, the definitions of how they are similar remain constant. For
example, individual dogs differ in shape, colour, and size, yet there are common characteristics by which we identify these animals as dogs, not as
cats or horses. Such characteristics of any given thing are universal and it is to these which people must turn when they judge anything. The variations are
due to the principle of micronage.

18
In ancient Greece, there were three major schools of medicine. They were the Pythargorians, the Aesculapians, and Hippocrates. The Pythargorian School
was based on mysticism; the Aesculapian believed in the healing power of snakes; and Hippocrates advocated the nature knows the best approach.
The front line of Western medicine and thought began with Pythagoras (? 582 -
500 BC). His student, Empedocles, (? 500 - 430 BC) recognised that
everything that Pythagoras accomplished involved numbers. He established a religion based on the premise that numbers were the building blocks of the
universe, and that by their mystical and external relationships, those numbers controlled all humans, including their health.
From the geometrical forms, they developed a system of explaining the
relationships of atoms in the form of geometrical shapes. They likened their triangular shaped atoms to each of the four elements - earth, water, air and
fire. They also assigned human values to them such as love and strife. Much of this has survived, as we shall see, for nearly 2000 years.
Empedocles, who followed as Pythagoras' pupil, passed the concept of the four
humors down to the minds of two great physicians, Hippocrates and Galen. This philosophy led Western medicine off the track for many years that
followed, and continued into the Dark Ages.
Of all the great minds which shaped and produced a model for future
generations it was that of Aristotle (? 384 - 322 BC) who accepted without any evidence many of the theories of the construction of the Universe that had
been passed on from Pythagoras to Empedocles, to Plato, (Aristotle's teacher), and to himself.
Aristotle believed in the burning log assessment of the elements. This involved
a log that contained fire, earth, water, and air. When burnt, the four elements ascended into the heavens, and the ashes (the earth) remained.
However, Aristotle conceived that animals were different from a log that is
they have a fifth essence that he called the quintessence. This quintessence was assigned the nature of an atom in the form of a dodecahedron, and placed
above all other atoms. He called this atom the Primum Mobile, or the source of
motion of the Universe. This prime motion or force was the introduction to the theory of vitalism that has continued to some degree to permeate Western
medicine. It formed a grid, which locked the thoughts, actions and research of man in an unbroken chain for the following 2000 years.
Up to the year AD1500, the scientific framework of this organic world-view
rested on two great authorities, Aristotle and the Church.
Thomas Aquinas (AD1225 - 1274) combined Aristotle's comprehensive system of nature with Christian theology and ethics. His system, Thomism, sought to

19
reconcile the various factors of the scholastic schools of that time. Thomism was Aristotlism with the added concept that faith is a projection of reason.
He was hailed as the new Aristotle, and he made it a fact in the minds of the
following generations that Aristotle's Primum Mobile was a force at the end of the Universe. This was his teaching, the proof for the existence of God.
He established a conceptual framework that remained unquestioned throughout the Middle Ages. The scientists of the Middle Ages continued to
seek the purposes underlying nature in their relationship to God, the human soul, and ethics.
Mechanism
During the Sixteenth and Seventeenth centuries the concept of a World
Machine replaced that of an organic, living, and spiritual universe. This began with Copernicus and ended with Newton.
Galileo postulated that all scientific research should study the essential
properties of the natural bodies, shapes, numbers and movement, which could be measured and quantified - even God.
Francis Bacon set forth the empirical method of science. He used the inductive
system of reasoning where facts are arrived at by the process of observation,
and verified by experimentation. In other words, he set forth the inductive procedure, that of making experiments and drawing general conclusions from
them, which were to be tested through performing further experiments. This cleared the way for the schools of modern medicine.
The concept of the Earth Mother disappeared as the scientific revolution
replaced the organic view of nature with the metaphor of the world as a machine.
Rene Descartes was regarded as the founder of modern philosophy and
replaced Aristotle's concepts, which had dominated thought for the previous 2000 years.
He wrote, ‘All sciences contain certain evident knowledge. We reject all
knowledge which is merely probable, and judge that only those things should
be believed which are perfectly known about which there can be no doubts.’
Isaac Newton developed a complete mathematical formulation of the mechanistic view of nature, thereby accomplishing the synthesis of the works
of Copernicus, Kepler, Bacon, Galileo and Descartes.
However, during the following centuries there was a constant attempt at the revival of the vitalistic concept challenging the mechanistic view.

20
The Vital Force
In fact the two concepts ran parallel at times each vying for acceptance among
the scholars and the establishment. An example was recorded in the eighteenth century.
George Earnst Stahl (1660 - 1724) was an ardent vitalist. The majority of the
medical world in the Seventeenth and Eighteenth centuries had followed the
Cartesian world machine view.
Unlike many of his contemporaries, Stahl rejected outright Descartes' philosophy. In his view, Stahl stated that the Cartesian system suppressed an
understanding of all forms of life which were pressed into concepts of organised matter, with little or no reference to outer forces.
Stahl saw that the causative power of man resided in the soul or anima.
Sickness was the effort of the anima to re-establish the normal tone or harmony of disordered organs.
The large and important medical school in Montpellier adapted his theories,
and formed the basis of medical teaching in the Paris School of Medicine. In Montpellier, the "anima" concept saw the principle of life as "The Vital Force",
which they believed to be the power, which organised and supported the whole
of matter, as distinguished from physical forces, either mechanical or chemical.
Thus, the divisions in philosophy remained well into the Twentieth Century.
The Holistic Approach
In the early part of the Twentieth Century Albert Einstein promoted the Theory of Relativity. In contrast to the mechanistic Cartesian view, as well as the
vitalistic view, a merging of the essences of both systems was achieved under the banner of Quantum Science.
Quantum involves the understanding of the energy behind the atom and its
manifestation in the solid state as observed in the environment, as being one continuum of energy to matter and its return back to energy. It is more
commonly expressed by the terms, organic, biological, holistic or ecological, which replace the older terms of world machine and vitalism. In other words,
the world is now viewed as dynamic wholes, which parts are interrelated, and
can be understood as patterns of the cosmic process.
As history has continually shown growth from ideas and concepts, the current holistic methods will not grow out of any one individual mind or one particular
group, but from the interaction and understanding of many individuals forming the integrated quantum of humankind and matter.

21
Of course, the chain of understanding just outlined relates solely to Western philosophy, and as such only represents about a quarter of the population of
the world.
It is also important that you study the underlying philosophies behind the healing systems of India, China, Tibet and many other nations in order to
realise that what they have taught over many centuries matches conceptually
what we call quantum. With our exposure to acupuncture and other ancient health practices, it is hard for us to understand why Western medicine for so
long clung to a philosophy of healing that was based solely on the philosophies of Judean and Christian mysticism.
However, there have been many who have worked within the bounds of their
Western system, who were able to break free through the recognition of the underlying energy levels, needed for healing. Two such luminaries were
Paracelsus and Hahnemann.
The Birth of Homoeopathy
Many researchers have sought to link a common bond with the teachings of Paracelsus and Hahnemann. It is not possible to state that Hahnemann had not
studied the works of Paracelsus, just as any academic today would not have studied the writings of past scholars. The homoeopathic principles of
Hahnemann do seem to supply the missing ingredient that Paracelsus did not
achieve, that is the alchemy of using the energy of the substance in healing.
‘The art of medicine is rooted in the heart. If your heart is false, you will also be a false physician; if your heart is just, you also will be a true physician.
No one requires greater love of the heart, than he physician. For him the
ultimate instance is man’s distress. Privilege and lineage pale to nothingness – only distress has meaning.’ — Paracelsus.
Paracelsus (1493 - 1541) introduced a new era of iatro-chemistry or alchemy
in the service of medicine. This great achievement for alchemy lay not in the introduction of revolutionary theoretical ideas or practical advances, but in his
determined attempt to liberate it from the narrow and sordid domination of the "multipliers" and "bellow-blowers" of his time. He gave the alchemy of healing
a new orientation and endowed it with a fresh stimulus, ridding medicine of the
shackles and misinterpretations of the ancients, as he so stated,
‘Since medicine alone among all branches of learning is necessarily accredited the commendable title of a divine gift by the suffrage of writers both sacred
and profane, and yet very few doctors deal with it felicitously at this day, it has seemed expedient to restore it to its former illustrious dignity, and to purge it,
as much as possible, from the dross o the barbarians, and from the most serious errors. We do not concern ourselves with the precepts of the ancients,
but with those things which we have discovered, partly by the indications

22
found in the nature of things, and partly by our own skill, which also have been tested by use and experience.
‘For those who do not know that very many doctors at this time, to the great
peril of their patients, have disgracefully failed, having blindly adhered to the dictates of Hippocrates, Galen, Avicenna and others, just as though these
preceded as oracles from the tripod of Apollo, and wherefrom they dared not
diverge a finger’s breadth. From these authorities, where the Gods please, they indeed are begotten persons of prodigious learning, but by no means
physicians.
‘It is not a degree of eloquence, not a faculty for language, nor the reading of many books, although these are of no small adornment, that are required in a
physician, but the fullest acquaintance with subjects and with mysteries, which one thing easily supplies the place of all the rest.
‘For it is indeed the part of the rhethoritician to discourse learnedly, persuade,
and bring over the judge to his opinion, but it behooves the physician to know the genra, cause and symptoms and affections, to apply his remedies into the
same sagacity and industry, and use all according to the best of his ability.’ (Paracelsus, "The Hermetic and Alchemical Writing of Paracelsus" ed. Arthur
Waite - London, 1894, Volume 2, pp. 169.170. Shambala. Berkley, 1976.)
Paracelsus taught that the universe could be understood in the terms of
chemical philosophy, as he believed the creation itself to be a Divine chemical process. He saw that disease was a chemical reaction within the body. Thus,
different diseases were seen as those different interactions of three fundamental principles with the four elements - sulphur, mercury, salt with
earth, air, water, and fire.
Paracelsus realised that inherent in the disease process was also the nature of the cure, pointing to his understanding of the inner vitality of man as a healing
force, and to the similarity of the manifestation of the disease to the method of cure. About this he wrote,
‘There, where diseases arise, there also, can one find the roots of health. For
health must grow from the same root as disease, and wither health goes,
wither also disease must go. Never a hot illness has been cured by something cold, nor a cold one by something hot, but has happened that “like has cured
like”.’
This we see expressed by Paracelsus as the beginnings of the principles well proven by homeopathy as "like has cured like".
One of the major contributions to medicine made by Paracelsus was the
introduction of metals and minerals into practice. Up to this point they had not been considered to be of any value to healing.
23
Paracelsus provided those ideas about medicine that began to change medical thinking during the following years. There was the power of cure by the law of
similars; his insistence on small, single remedies correctly prescribed, and fashioned into correct dosage; and, as well, he also understood that a
physician must always match the exact dosage to a particular individual's malaise; and his introduction of metals and minerals into the pharmacopoeia
had beneficial results.
Samuel Hahnemann
Samuel Hahnemann (AD1755 — 1843) is the founder of the homoeopathic
principle. It is impossible to believe as outlined earlier in the history of Western medicine, that his work was that of one great man in a vacuum. Hahnemann
spent a great part of his early years translating past medical texts, and enquiring into the structure of medicine that had been taught at the university.
Hahnemann himself quoted Hippocrates as having written the law of similars.
Hahnemann, like anyone in the present century, was aware of, and studied medical, scientific, and philosophical works from the Renaissance up to his
lifetime, and was undoubtedly influenced by them. The seeds of experience planted by those preceding him would have presented a pattern linking various
traditions into practical expression when added to the overall experience.
Hahnemann's childhood was influenced by his father's example. Richard Hael
in his biography of Hahnemann wrote that his father brought his children up by the educative principles of Rousseau, ideas that were widely accepted amongst
cultured Europeans at that time.
In 1791 Hahnemann wrote of his father’s influence, ‘To act and live without persistence or show was his most noteworthy precept,
which impressed me more by his example than by words. He was frequently present, though unobserved, when something good was to be accomplished.
Should I not follow him? In his deeds he differentiated between noble and ignoble to so fine a degree of correctness and practical delicacy of feeling as to
be highly creditable to him; in this way he was my teacher. His ideas on the first principles of creation, that dignity of mankind, and its lofty destiny,
seemed consistent in every way with his mode of life. This was the foundation of my moral training.’
(Richard Hael, Samuel Hahnemann, His Life and Works, London, Homoeopathic
Publishing Co. 1922. pp10.)
Disillusioned with the theories and practice of medicine at that time, Hahnemann retired from practice in 1772 and spent the next fourteen years
doing chemical research, writing, and translating medical texts. It was obvious during these years that he began to formulate his growing concepts for
homoeopathy. Whilst translating William Cullen's Materia Medica, he added a footnote disagreeing with Cullen's conclusions that the basis of Chinchona
bark's effectiveness was its bitter and astringent qualities.

24
Chinchona, quinine, was used in the treatment of malaria and intermittent fevers. Cullen had written that there were several drugs in common usage that
in smaller doses had greater bitter astringent qualities, yet had no specific action on fevers. Hahnemann experimented on himself by taking four drachms
of chinchona twice daily, and soon developed the paroxysmal symptom characteristic of intermittent fevers.
The duplication of symptoms was a revelation, and resulted in the concept of determining the properties of a medicine by studying its effects on healthy
humans.
This became his chief method of testing the properties of medicines, and was called provings.
In 1796, Hahnemann published, in Hyland's Journal, the results of his
investigations in an article with a long heading, "Essay on a New Principle for Ascertaining the Curative Power of Drugs, with a Few Glances at those Hitherto
Employed."
‘Every powerful medicinal substance produces in the human body a kind of peculiar disease; the more powerful the medicine, the more peculiar, marked
and violent the disease. We should imitate Nature which sometimes cures a
chronic disease by superadding another, and employ in the (especially chronic) disease we wish to cure, that medicine which is able to produce another very
similar artificial disease, and the former will be cured, Similar Similibus.’
On provings, he continues:
‘We only require to know, on the one hand, the pure effect of drugs, that is the essential characteristic of the specific artificial disease they usually excite,
together with the accidental symptoms caused by the difference of dose, form, etc., and by choosing a remedy for a given natural disease as shall be able to
cure the most obstinate diseases.’ (Samuel Hahnemann, Lesser Writings, London, W. Headland. 1851. pp.311,
331.)
Hahnemann's greatest dissatisfaction was with medicine of his day. This he
choose to call allopathic medicine from the Greek allo meaning other, to designate curing with opposites, that is, the medicine being practiced by the
orthodox schools of his day.
Oliver Wendell Holmes, in 1842, was continuously outspoken in his criticism of homoeopathy, and even today, his essays seem to be the only allopathic works
still quoted to denigrate the homeopathic system.
On Hahnemann, he wrote:

25
“He (Hahnemann) has therefore been writing at intervals on his favourite subject for nearly half a century. The one great doctrine which constitutes the
basis of homeopathy as a system is expressed by the Latin aphorism, Similia Similibus Curantur, or like cures like, that is diseases are cured by agents
capable of producing symptoms resembling those found in the disease under treatment. A disease for Hahnemann consists essentially in a group of
symptoms when given to a healthy person.
“It is of course necessary to know what are the strains of symptoms excited by
different substances, when administered to a person in health, if any such can exist. Hahnemann and his disciples give catalogues of symptoms that they
affirm were produced upon themselves, or others, by la large number of drugs, which they submitted to experiment.
“It is true, notwithstanding, that throughout most of their writings which I
have not seen; there runs a prevailing tone of great deference to Hahnemann’s opinions, a constant reference to his authority, a general agreement with
minor points of his belief, and a pretense of harmonious union in a common faith.”
(Homeopathy and its Kindred Delusions – Lectures 1842.)
Such criticisms were easily come from one who had little understanding of
homeopathy as Hahnemann’s own writings so clearly demonstrate, and they had little effect on the outcome of homeopathy. However homeopathy still has
allopathic critics. Early in the Twentieth Century the allopathic name tag used by Hahnemann continued to inflame the medical people of that time. In 1902
in a popular guide for the young doctor entering the profession, received the following warning.
“Remember that the term allopathic is a false nickname not chosen by regular
physicians at all, but cunningly coined, and put in wicked use, in his venomous crusade against regular medicine by its enemy Hahnemann…. And ever since
applied to us by our enemies, with all the insinuations and derisive use the term affords. Allopathy applied to regular medicine is both untrue and
offensive, and is no more accepted by us than the term heretics are accepted by Protestants, or niggers by blacks!”
(D.W. Cathell and William Cathell. “Book on the Physician Himself”.
Philadelphia. Davis. 1902 pp300-301.)
While homeopathy offers a deep and unified evaluation of the treatment of chronic diseases, it gained most of its early reputation from the treatment of
acute and epidemic diseases. An interesting story emanated from a treatment of cholera in Cincinnati in 1849. Two German homeopaths were treating an
outbreak of cholera with camphor and other remedies. They published in the newspaper statistics indicating that only 35 of their 1,116 treated cases died.
During the Nineteenth Century, 33 to 50 percent of patients with cholera who received allopathic care died. In the 1879 epidemic of yellow fever, New
Orleans homeopaths treated 1,945 cases with a mortality rate of 5.6%, while
26
allopathic doctors were losing 16%. These and similar statistics had a profound effect on the public.
Constantine Herring established the first homeopathic medical school in the
United States in 1835 at Allentown in Pennsylvania.
Throughout the world homeopathy has maintained a consistent tradition.
Frederick Harvey Foster Quinn introduced homeopathy into England in the 1840's. Since then homeopaths have been engaged by the Royal Family as
personal physicians over the last four generations.
Homeopathy is widely practiced in Europe, India, Australia, South Africa, Argentina and Mexico, and is now experiencing a renaissance in the United
States of America.
Paracelsus and Hahnemann were two centuries apart, but there are many parallels in the work of each. To each man's discovery there was a very specific
logic and it was left to Hahnemann to perform the synthesizing of a true system of healing.
27
Chapter Four: PROCEDURES
Ionictherapy is a combination of the nutritional analysis of the pH of the
digestive tract together with the use of specific homoeopathic complex remedies that have been developed to assist the stabilisation of the body
chemistry. It requires two stages, the analysis, and treatment.
The Analysis
The analysis is based on the electromagnetic function of the digestive tract, which is measured by the equation.
It is also a measurement of the energy potential of the body, and from the
equation, we are able to develop the nutritional picture for the individual.
Treatment
Treatment procedures involve the use of specific homoeopathic remedies
developed expressly for Ionictherapy, as well as preparing a nutritional program for the individual patient.
Generally the analysis is aided by the use of a computer program; however it
is necessary for the student to have a thorough understanding of the basic principles before using a computer printout. It must be realised that even
when using a computer analysis, the human assessment is essential for correct assessment.
The Equation
In this book, we will be studying two equations, namely, The Actual Test, and
The Balanced Test.
The Actual Test is the equation produced from the fresh samples of urine and saliva.
The Balanced Test numbers are produced mathematically from the Actual Test. The Actual test equation provides us with that information required for the
analysis of the metabolism, as well as those remedies required for its correction.
The Balanced test equation indicates the need for nutritional changes needed
to maintain the altered metabolism.
We shall now begin to study those stages required to make an effective
assessment of a patient's test equation. It is important that you do not skip any one of the steps as you will not make an effective analysis, which will be to
the detriment of the patient’s successful return to health.

28
The Stages
STEP ONE: PATIENT DETAILS REQUIRED
STEP TWO: CONDUCTING THE TEST
STEP THREE: NUTRITIONAL ENERGY ASSESSMENT
STEP FOUR: CALCULATE THE SWING OF THE BODY CHEMISTRY
STEP FIVE: STAGE OF DEGENERATION CALCULATION
STEP SIX: RANGE NUMBERS
STEP SEVEN: ZONES OF DEGENERATION
STEP EIGHT: AGGRAVATIONS-ADVERSE RELATIONSHIPS
STEP NINE: CALCULATE SPEED OF DECLINE
STEP TEN: MAJOR ORGAN OF ENERGY LOSS
STEP ELEVEN: PATTERNS OF ENERGY LOSS
STEP TWELVE: CALCULATE THE BALANCED TEST
STEP THIRTEEN: CALCULATE THE ENERGY
STEP FOURTEEN: NUTRITION
29
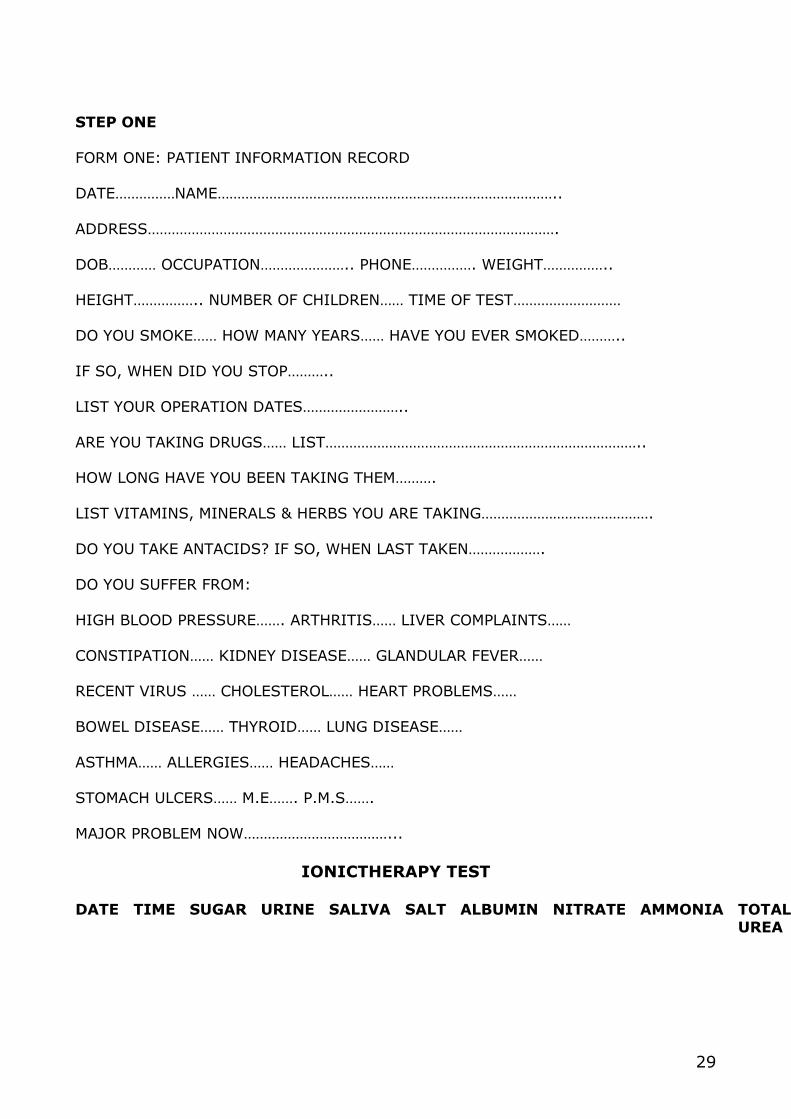
STEP ONE
FORM ONE: PATIENT INFORMATION RECORD
DATE……………NAME…………………………………………………………………………..
ADDRESS………………………………………………………………………………………….
DOB………… OCCUPATION………………….. PHONE……………. WEIGHT…………….. HEIGHT…………….. NUMBER OF CHILDREN…… TIME OF TEST………………………
DO YOU SMOKE…… HOW MANY YEARS…… HAVE YOU EVER SMOKED………..
IF SO, WHEN DID YOU STOP………..
LIST YOUR OPERATION DATES……………………..
ARE YOU TAKING DRUGS…… LIST…………………………………………………………………….. HOW LONG HAVE YOU BEEN TAKING THEM……….
LIST VITAMINS, MINERALS & HERBS YOU ARE TAKING…………………………………….
DO YOU TAKE ANTACIDS? IF SO, WHEN LAST TAKEN……………….
DO YOU SUFFER FROM:
HIGH BLOOD PRESSURE……. ARTHRITIS…… LIVER COMPLAINTS……
CONSTIPATION…… KIDNEY DISEASE…… GLANDULAR FEVER…… RECENT VIRUS …… CHOLESTEROL…… HEART PROBLEMS……
BOWEL DISEASE…… THYROID…… LUNG DISEASE……
ASTHMA…… ALLERGIES…… HEADACHES……
STOMACH ULCERS…… M.E……. P.M.S…….
MAJOR PROBLEM NOW………………………………...
IONICTHERAPY TEST DATE TIME SUGAR URINE SALIVA SALT ALBUMIN NITRATE AMMONIA TOTAL
UREA

30
FORM TWO
WORK SHEET Test Number…….. Smoking…… Drugs……………. Operations…………….. Age….. Weight…… Height…..
Patient Name…………………………………… Address………………………………………………………
…………………………………………………………………………………………………………….
STEP TWO
DATE TIME SUGAR URINE SALIVA ALBUMIN NITRATE AMMONIA TOTAL
UREA
STEP THREE
NUTRITIONAL ENERGY COMPUTATIONS
SUGAR + UpH + SpH =........ SALTS + NITRATE + AMMONIA =..............
TOTAL LOSS = ...........................NUTRITIONAL UNITS OF ENERGY
STEP FOUR:
BODY ENERGY SWING Add: UpH + SpH + SpH =........... Divide this by 3 and swing is ..................
(if above 6.40 the swing is anionic: if below 6.40 the swing is cationic.)
STEP FIVE
CALCULATE THE STAGE OF DEGENERATION. (Refer to the appropriate chart.)
STEP SIX
RANGES SUGAR UpH SpH SALTS NITRATE AMMONIA TOTAL UREAS
R=……. R=… R=…. R=….. R=………. R=………… R=……………….
STEP SEVEN
ZONES OF DEGENERATION

31
STEP EIGHT
LIST THE AGGRAVATIONS (ADVERSE RELATIONSHIPS) ……………………………………………………………………………………
…………………………………………………………………………………… …………………………………………………………………………………… ……………………………………………………………………………………
STEP NINE
CALCULATE THE SPEED OF DECLINE. (NUMBER FROM 1 TO 4) ..................…
STEP TEN
MAJOR ORGAN OF ENERGY LOSS
First determine the pH worst aspected, and whether it is anionic or cationic. Then select the Zone of the sugar, salt or total ureas which is furthest from normal. Write your answer here:
....................................................................................................
STEP ELEVEN BALANCED TEST NUMBERS (REFER TO CHARTS FOR CALCULATION)
SUGAR UpH SpH SALT ALBUMIN TOTAL
UREA
STEP TWELVE CALCULATE THE ENERGY PATTERNS FROM THE AR'S
STEP THIRTEEN CALCULATE THE ENERGIES AND MARK DOWN THE FOLLOWING
EM=.................. RE=.................. RE%=....................
STEP FOURTEEN
NUTRITIONAL NEEDS AS ASSESSED BY THE BALANCED TEST
…………………………………………………………………………………………….

32
Step 1: PATIENT DETAILS REQUIRED
Fill out the patient record form. You must complete every section on this form,
especially those questions that refer to the time of the test, the patient’s history on smoking, operations and drug use. Also make sure that you fill in
the weight, age and height of the patient.
Conducting a Test
As the test reflects a patient's overall lifestyle for the last six months, it is
assumed that during the 24 hours prior to the test, this individual has followed their normal pattern of living and eating. The test should not be conducted if a
person has varied in any way from their normal pattern of living and eating during the week prior to their test. For instance, they may have been to a
party the night before, or traveled a long distance prior to the test, or may not have followed their normal daily regimen.
Once these factors have been eliminated, the Ionictherapy test can be
conducted. The following rules must be applied to all patient tests:
RULE 1
The patient must have their normal breakfast, providing they normally eat breakfast. If they do not normally eat breakfast, they should not be tested less
than three hours after rising. If the test is provided after lunch, then it should
be their normal lunch. Wait three hours before testing.
RULE 2
A patient must not eat any food or chew gum, or drink any fluids except plain water for at least three hours before their test, in order that the regular
metabolism is recorded.
RULE 3
They must be prepared to provide a fresh sample of both urine and saliva at their appointment time.
RULE 4
They must not wear lipstick when attending their test.
RULE 5
No antacid type tablets or preparations should be taken at least 24 hours prior to being tested.
33
RULE 6
All subsequent tests should be conducted at a similar time of day as the first test time.
Fill out all information under step 1, on the work sheet. Take the age, weight,
height, smoking habits, drug use (medicinal or street), and operations.
It is important to follow the above rules because we are measuring the
nutritional deficiencies of the patient. It is essential that the patient gain the greatest benefit from their test by having an accurate assessment. Some
people think that they should supply the first specimen of the day. The first specimen is worthless for our test because it has been stored over night and is
highly concentrated, and there is a bacterial build up in the bladder that alters the pH reading.
Make sure you have the Patient Record Sheet present when conducting the
test.
When recording the time, make sure it’s a 24 hour time frame.
Step 2: CONDUCTING THE TEST
To conduct a test you will need the following equipment. Depending upon which country you are living in we shall provide you with the appropriate
address of the nearest supplier.
(a). Brix refractometer ATC-1. (Auto temperature compensated)
(b). pH Ion Meter, digital readout, hydrogen ion activity tester.
(c). Digital conductivity meter. 0-200; 2000; 200,000. uS.
(d). Urea kit which includes reagents and colour card.
(f). Lab beakers etc.
(1) The Sugar Test - Total Carbohydrates.
(see next page for procedure chart)
You will require a refractometer, preferably the Atago ATC-1 which has automatic temperature compensation. Make sure that you read carefully the
manufacturer's instructions for correct calibration of the instrument.

34
The calibration of the instrument should be checked frequently.

35
Measuring the Urinary Sugars
1. Hold the refractometer in the left hand with its jaw open. Take a clean
pipette and place two drops of urine on the open surface of the prism. Close the daylight plate gently.
2. Look into the eyepiece. Adjust the lens to suit your eye. Hold the
refractometer toward a strong light source. Read the scale where the boundary
line intercepts it.
3. Place the refractometer on the lab table and enter the number in the box on your form for sugar.
4. Open the jaw of the refractometer and clean the prism with a full pipette of
distilled water, as well as the jaw plate. It is more convenient to use a spray bottle. Dry the instrument with clean tissues for further use.
It is important to keep your lab equipment for accurate measurements.
Urine pH Measurement
The pH of both the urine and saliva is measured using an electronic pH meter
with a probe.
The instrument should be checked daily for accuracy using specific buffers
having a pH value of 4 and 7. These procedures will be outlined in the manufacturer’s manual which comes with your equipment. The instrument that
you purchase must always be automatically temperature compensated, if not, then it should have a temperature probe.
When not in use, the pH probe should be kept moist by storing it in a beaker of
distilled water with a small amount of buffer solution added.
Procedure
Take the probe out of the solution and flick it to remove excess moisture. Insert it into the beaker or vial containing the urine sample. If your instrument
has a temperature probe, then insert this into the sample with the pH probe.
Have the unit set on pH measurement. When the number to be read stabilises, write the pH reading in the appropriate box on your form. Remove the probe,
clean it with distilled water, and return it to the beaker containing the pH
buffer solution.
Measuring the Saliva pH
Using the same pH probe, flick it free of excess moisture and insert it into the saliva specimen. Make sure that there is sufficient saliva to cover the end of
the probe. Stir the probe in a circular movement within the specimen. Hold it steady.
36
When the number of the saliva reading becomes stationary on the metre, write it on your form.
Clean the probe as outlined in the urine test procedure.
Measuring Conductivity or Salt
Using the conductivity meter, this should also be checked for correct
calibration, set the dial to 200 uS. Place the probe into the urine specimen.
When the number is steady, record it on the patient form.
Clean the probe as you did with the pH probe.
Measuring the Albumen
Dr. Reams stated that a perfectly healthy person, drinking the normal amount
of water should throw out 400,000 carcinoma cells per quart of urine. Normal is 0.04M per 100 lbs of body weight. In one litre this would be 40,000 drops.
Count the particles in the specimen and multiply by 20,000.
This is a subjective test. Hold the beaker containing the urine sample to a natural light source. Stir the urine and look at the sample to gauge the
concentration of the particles.
Rate as follows:
4+++ if the numbers of particles are concentrated.
4M if the particles are easily seen floating around.
3M if the particles are hard to see.
2M if the particles are only seen after putting the specimen in a clean jar
and using a torch to check with.
1M if the particles are only seen with a magnifying glass.
Write your result in the appropriate box.
Measuring the Urea
For this part of the test you require:
1. Universal Extract solution.
2. Nitrate reagent. 3. Ammonia reagent.
4. One small glass cuplet. 5. One set of ceramic wells.
6. Colour card.

37
Procedure
Take a clean dry pipette. Place it in the urine sample and draw some urine.
Remove the pipette and allow the first drop to return to the urine sample.
Place one drop of the urine into the cuplet and return the rest to the specimen beaker. Clean the pipette.
Using a clean pipette, take six drops of universal extract solution and add them to the drop of urine in the cuplet. Use the same pipette mix the solution in the
cuplet and squeeze the rubber top of the pipette in and out for two minutes.
Now add one drop of this mixture to the upper well, and one drop to the lower well.
Squeeze the remaining liquid back into the cuplet and clean the pipette.
Using a clean pipette, take four drops of the nitrate solution and add one drop
to the well at four different points, namely, one drop at 12.00, one at 3.00, 6.00, 9.00, letting them slide into the mixture. Do not drop them directly into
the centre of the well.
Now using a clean pipette, take four drops of the ammonia reagent and place
one-drop at the required points as previously performed with the nitrate reagent.
The ammonia colour will show more quickly than the nitrate. Write the result
on your patient sheet.
Now stir the nitrate reagent with the pipette and allow it to settle and form its shape. Then record it on your sheet.
The reagents are highly volatile acids and bases that can burn the skin. Care
must be taken when handling these chemicals. When conducting a test always be clean and wear disposable gloves. Have clean utensils as well as a lab area.
Your results will depend on this.

38

39
When conducting a test always be clean and wear disposable gloves. Have clean utensils and a dedicated lab area. Your results depend on this.
Now transfer all the relevant information from your Patient Record to the Work
sheet and follow the steps.
Step 3: ENERGY MEASUREMENTS
This step allows us to determine the amount of energy which the patient is
able to assimilate from their food. Assessing the energy required to eliminate the wastes modifies this.
The energy that is gained from the diet should always be in excess of the
energy used in the process of elimination.
To assess the assimilation from the test number, we must add the sugar, urine pH and saliva pH numbers and convert these into energy.
Adding the salts, nitrate and ammonia numbers, and converting these into
energy units assesses elimination.
Energy In
To determine the energy from the assimilation process, add: Sugar Test Number + UpH Test Number + SpH Test Number
Energy Out
To determine the energy used from the elimination process, add: Salt Test Number + the Nitrate and Ammonia Test Numbers.
Subtract Energy Out from Energy In.
With the perfect equation the assessment is calculated as follows:
1.5 + 6.40 + 6.40 = 14.30
6.6 + 3 + 3 = 12.60 = + 1.70 units of energy.
By using the perfect test equation we can see that the body must always gain
some energy from assimilation, because if not, we won’t continually draw on our reserve energy and the immune system begins to suffer.
A typical test may be as follows: 5 5.20 / 7.30 25C 10 / 12 5 + 5.20 + 7.30 = 17.50
25 + 10 + 12 = 47.00
Minus 29.50 units of energy.
Remember, with this step we are looking at the energy requirements relative to the nutrition.
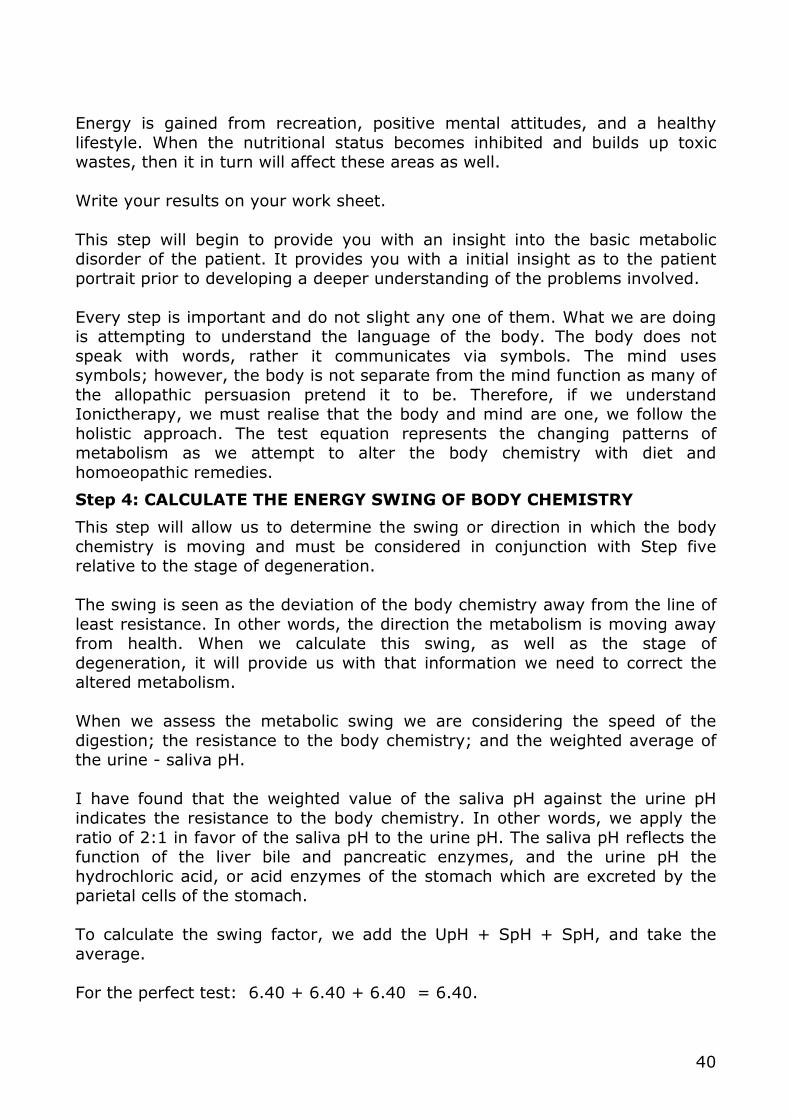
40
Energy is gained from recreation, positive mental attitudes, and a healthy
lifestyle. When the nutritional status becomes inhibited and builds up toxic wastes, then it in turn will affect these areas as well.
Write your results on your work sheet.
This step will begin to provide you with an insight into the basic metabolic disorder of the patient. It provides you with a initial insight as to the patient
portrait prior to developing a deeper understanding of the problems involved.
Every step is important and do not slight any one of them. What we are doing is attempting to understand the language of the body. The body does not
speak with words, rather it communicates via symbols. The mind uses symbols; however, the body is not separate from the mind function as many of
the allopathic persuasion pretend it to be. Therefore, if we understand Ionictherapy, we must realise that the body and mind are one, we follow the
holistic approach. The test equation represents the changing patterns of metabolism as we attempt to alter the body chemistry with diet and
homoeopathic remedies.
Step 4: CALCULATE THE ENERGY SWING OF BODY CHEMISTRY
This step will allow us to determine the swing or direction in which the body
chemistry is moving and must be considered in conjunction with Step five relative to the stage of degeneration.
The swing is seen as the deviation of the body chemistry away from the line of
least resistance. In other words, the direction the metabolism is moving away from health. When we calculate this swing, as well as the stage of
degeneration, it will provide us with that information we need to correct the altered metabolism.
When we assess the metabolic swing we are considering the speed of the
digestion; the resistance to the body chemistry; and the weighted average of the urine - saliva pH.
I have found that the weighted value of the saliva pH against the urine pH
indicates the resistance to the body chemistry. In other words, we apply the
ratio of 2:1 in favor of the saliva pH to the urine pH. The saliva pH reflects the function of the liver bile and pancreatic enzymes, and the urine pH the
hydrochloric acid, or acid enzymes of the stomach which are excreted by the parietal cells of the stomach.
To calculate the swing factor, we add the UpH + SpH + SpH, and take the
average.
For the perfect test: 6.40 + 6.40 + 6.40 = 6.40.

41
Example
5.4 5.2 / 7.50 30C 10 /9
5.20 + 7.50 + 7.50 = 20.20 / 3 = 6.70.
6.70 is anionic as it is greater than 6.40. This reflects that the body is moving
in an anionic direction and away from perfect. Tissues and organs are becoming anionic with a decreasing ionizing effect.
The reason we weight the value of the saliva as two, is because we are
measuring the liver bile as well as the enzymes from the pancreas.
The average function of the digestive tract requires three functions. 1. The hydrochloric acid secreted by the parietal cells of the stomach.
2. The strength of the liver bile. 3. The anionic enzymes from the pancreas.
The correct functioning requires that the line of least resistance is maintained.
This is seen when both pH are at 6.4. When this doesn’t occur a movement away from normal function is seen producing degeneration of the tissues,
organs and glands.
We must now join this result with Step Five to ascertain the depth of the
degeneration process of the body. To do this we will need to refer to the chart on the next page.
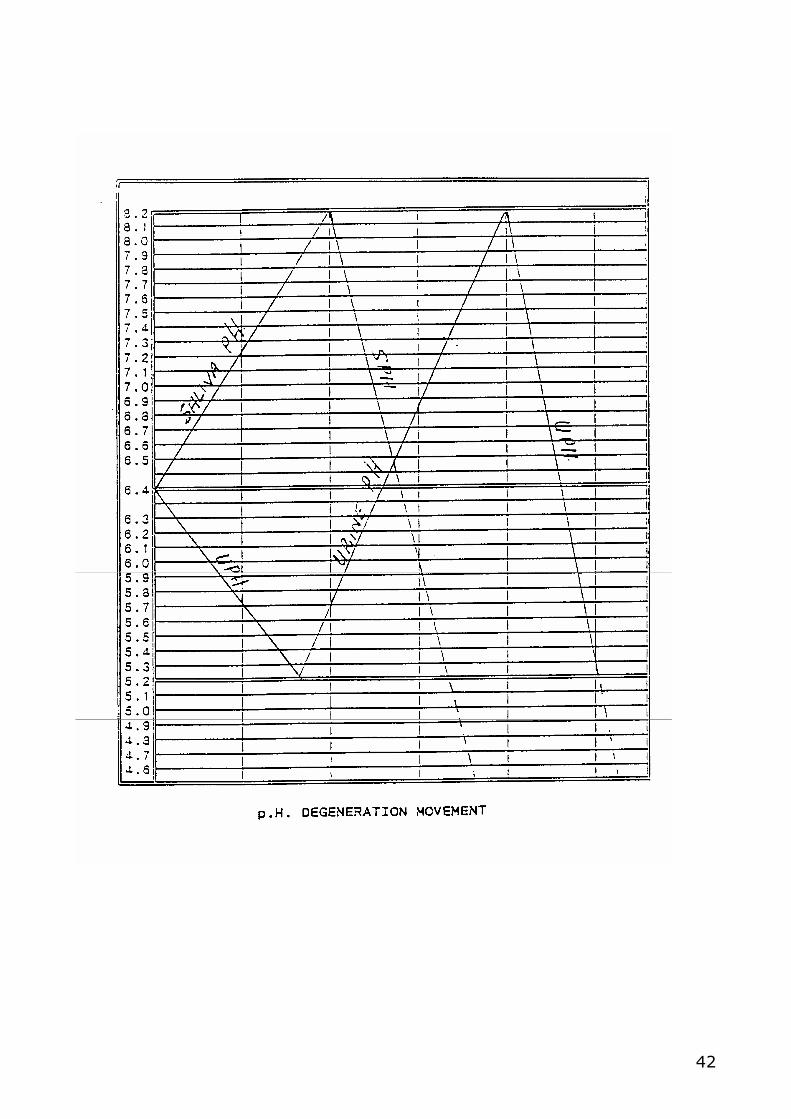
42

43
Step 5: STAGES OF DEGENERATION
As either pH moves away from perfect numbers, 6.40 / 6.40. the organs and tissues in the body begin to become demineralized and degenerate. This
degeneration movement is seen on the chart on the previous page.
Consult the chart and look at the line denoted by the urine pH. The urine pH
moves first in a cationic direction as it moves away from 6.40. It moves as far as 5.20, and proceeds toward an anionic level as far as 8.40. As the
degeneration rate increases the pH slides in a cationic swing well below 5.20.
The saliva pH line reflects the movement away from 6.40 in an anionic direction as far as 8.40. It then begins a downward slide as degeneration
increases and ends in a cationic level well below 5.20.
There are four major degeneration stages represented by pH movement.
Perfect: 6.40 / 6.40 Stage 1: Cationic / Anionic
Stage 2: Anionic / Anionic Stage 3: Anionic / Cationic
Stage 4: Cationic / Cationic
The individual cells in the body grow within an energy potential. During the
growth process the pH becomes more cationic. It reaches its full potential at pH 5.20. (98% E.)
At this point on the growth pattern declines and the pH becomes more anionic,
as it begins to ionize and give off anionic energy, leaving basically a cationic mass. The cationic motion of the cell slows down in direct ratio to its energy
decline.
At a pH of 8.40 (52% E.) the cell receives a directive from the brain to create a new cell. As the old cell has lost motor control, it begins a transmutation
process. Cell division occurs and the old cell dies becoming ash as the hydrogen is totally replaced by nitrogen and ammonia.
The new cell begins the building up stage once more.
The overall body swing follows this energy process and is charted for the whole cellular metabolism using the pH of both the urine and saliva as reference
numbers.
Review Steps 3, 4, and 5. Conduct some tests and apply this information. Become acquainted with the chemistry swings and apply it to the degeneration
patterns. You will be able to monitor these swings as to the relative improvement or decline as you work with your tests.

44
These three steps will also provide you with sufficient information to
understand your patient's general health status.
First, if, as seen in step 3, we are able to monitor the extent that the body is losing energy due to the elimination processes being slowed down by a high
level of toxic wastes. The patient will be tired and also drawing on their energy
reserves and stressing the immune system.
If the swing is toward either an anionic or cationic direction, degeneration stages 3 or 4, then other factors in the patient’s health will be apparent.
It is important not to gloss over these three steps as they will provide specific
information relative to the total patient portrait.
The subsequent steps will provide you with the additional information to complete your analysis.

45
Step 6: THE RANGE NUMBERS
The procedures that are outlined in this tutorial are required to present
efficient analysis in order that you are able to pin point your patient’s major problem area in the body. In order to establish the degree that the metabolism
has deviated from normal function, I have divided all the test numbers individually into ten ranges away from perfect. Effectively I have divided them
into ten steps, or each 10% progression away from the perfect test equation. You will appreciate that the higher the range number, the less energy will be
available. When using these ranges we are able to map the faulty metabolism, and plan those steps that will improve the efficiency of their metabolism.
This improvement is achieved through using specific homoeopathic remedies
that will alter the aberrant metabolism. It is useless to alter the patient's diet
without first improving the body chemistry. If the body chemistry is not altered, no diet will improve their overall health status. If those organs and
glands that are responsible for the production of the necessary enzymes, bile

46
etc., are not functioning correctly, no amount of good food will activate the necessary changes for health. It is important to use those homeopathics which
have been developed to alter dysfunction as revealed by the equation, for without them we will not achieve the return to good health of our patient.
These remedies are needed to produce a permanent cure.
The Range Chart
When you study the range chart you can see that it is divided into ten sections.
In other words they are rates from 1 to 10.These ranges reflect the degree of movement of the body chemistry away from normal function.
The higher the range numbers, the less energy is available to the patient. If
you take an average of all the range numbers for a particular test, you can ascertain just how far from the normal body chemistry the body is.
To improve the body chemistry you must select the appropriate homeopathic
remedy for that particular area of energy restriction as indicated by these range numbers.
How to Use the Range Chart
After completing stage two and entering the test numbers on your work sheet,
you must define the appropriate range numbers from the range chart. You will probably already realize that with all the test numbers, the body chemistry can
move in two directions, either above or below perfect.
For example:
Sugar UpH SpH Salts Alb Nit Amm Total
1.2 5.40/7.30 11C 4M 10 12 22
Consult the chart to determine the ranges:
R=3 R=5/R=4 R=2 R=8/R=7 R=3
To calculate the average movement, call the range numbers percentages: R=30% R=50% R=40% R=20% R=80% R=70%
Take the average of the six major numbers:
30+ 50 + 40 + 20 + 80 + 70 = 290% / 6 = 48%.
If we were using this test for a patient's analysis we would record that the body chemistry is 48% functioning away from normal, and that with future
tests we would expect that this would be reduced if the patient was following our instructions for their health needs.
47
Now consider the other steps relative to this equation:
Energy Loss:
1.2 + 5.4 + 7.3 = 13.9. 11 + 2 + 10 = 23.0
= minus 9.1 units
Body Swing:
5.4 + 7.3 + 7.3 = 20.00 / 3 = 6.66.
The stage of degeneration is seen as stage one. The swing is slightly anionic
(above 6.4) and this means that the body is now moving toward a stage two pattern, unless we can alter this. The energy loss of 9.1 units means that
approximately 10% of energy requirements are being drawn from the energy reserve. The metabolism is now 48% away from normal and beginning to
degenerate fast.
Step 7: THE ZONES
The zones are divided into five areas that are written as Zones A to E. The zones will tell you the depth of the degeneration occurring in the body.
Check the test numbers against the zone numbers and record them on your
work sheet. We will use the previous example:
1.2 5.4 / 7.3 11C 2 / 10 12
D E / C A D / D B
If all the test zones are in A and B then the body is functioning at a normal level.
Zone C will indicate a body swing.
Zones D and E will indicate that degeneration is occurring.
The following will list the zone combinations and their relationship to the
degeneration patterns.

48
Zone Zone Numbers Zone Functions
1 All numbers in zone A Very good function 2 All numbers in zone B Good Function
3 All numbers in Zone C Good Function 4 All Numbers in Zones A & B Very Good Function 5 All numbers in Zones B & C Rare – caution needed
6 All numbers in Zones C & D Very rare – Caution 7 All numbers in Zones A B & C Common occurrence
8 All numbers in Zones B C & D Rare occurrence – caution 9 All numbers in Zones C D & E Extremely rare – caution 10 All numbers Zones A to D Common
11 All numbers Zones B to E Common 12 All numbers in Zones A to E Common
13 All numbers in Zones D & E Dangerous – extreme caution
The above combinations cover all the zones that are found in the test. When considering these zones, always compare the results to the ranges. If the
average of the ranges is below 40% then the depth of the degeneration is not as severe as it would be above 40%.Adverse Relationships Chart.

49
Step 8: THE RANGES
A.R.1. Sugar Range # <Urine pH Range #
A.R.2. Sugar Range # >Saliva pH Range #
A.R.3. Sugar Range # >Salts Range #
A.R.4. Sugar Range # >Total Ureas Range #
A.R.5. Urine pH Range # >Saliva pH Range #
A.R.6. Urine pH Range # >Salts Range #
A.R.7. Urine pH Range # >Total Ureas Range #
A.R.8. Saliva pH Range # >Salts Range #
A.R.9. Saliva pH Range # >Total Ureas Range #
A.R.10. Salts Range # <Total Ureas Range #
A.R.11. (a) Nitrate Range # <Ammonia Range # by 2 Range #’s. or more.
(b) Nitrate Range # >Ammonia Range # by 4 Range #’s or more.
Use the Adverse Relationship chart above to determine those numbers in your
test that are out of ratio with the other test numbers. It is important to understand that with the perfect test equation all numbers are balanced in a
particular ratio with each other. When this ratio is unbalanced, disease states occur within the body.
After making your comparisons write the results on your work sheet. For
example:
SUGAR UpH / SpH SALT NIT AMM TOTAL UREA 1.2 5.4 / 7.3 11C 2 10 12
R=3 R=5 R=4 R=2 R=8 R=7 R=3
A.R.1
A.R.3 A.R.5
A.R.6 A.R.7
A.R.8 A.R.9
A.R.10 List the aggravations as above on your work sheet.

50
RELATIVE ORGANS AFFECTED BY THE A.R.'S.
A.R.1. THYMUS, KIDNEYS AND ADRENALS
A.R.2. PANCREAS AND SPLEEN
A.R.3. CENTRAL NERVOUS SYSTEM
A.R.4. STOMACH AND HCL LEVELS
A.R.5. ACID / ALKALINE BALANCE
A.R.6. THYROID
A.R.7. HEART
A.R.8. LUNGS
A.R.9. LIVER AND GALL BLADDER
A.R.10 COLON AND SMALL INTESTINES
A.R.11. TOXINS IN THE LIVER, KIDNEYS AND LYMPH
The total number of A.R.'s in any one test will indicate the depth of tissue
affected. Degeneration begins with denser tissue and moves toward finer tissue areas in the body.
We term this "A.R. Count". To ascertain, count the number of A.R.'s in your
test and apply the following scale.
Number of A.R.'s Organs Affected.
NIL Colon & Gallbladder.
1 Stomach.
2 Kidneys.
3 Bladder, Thyroid, Spleen, Pancreas & Liver.
4 Pituitary, Heart & Small Intestines.
5+ Lungs.
Use this relative to achieving a complete comparison with all other factors
learnt so far.

51
Chapter Five: THE DISEASE PATTERNS AND ANALYSIS
We will consider the disease patterns relative to the following:
1. The importance of understanding disease relationships relative to the metabolic dysfunction. For example, you must make a complete assessment of
the condition. Diseases and deficiencies require specific analysis for your success. The total patient Portrait is necessary for the Ionictherapist to
successfully treat any area of degeneration.
2. Disease pattern analysis is accomplished by comparison, as well as knowledge of the physiological aspects of metabolism.
3. The disease patterns relate to the Adverse Relationship Chart.
4. These patterns are divided into Major and Minor States.
Disease Pattern One
The Sugar Range # < The Urine pH #.
Example No.1:
5.0 5.20 / 7.20 25C 7 / 8
Sugar Range # R = 4 is less than Urine pH Range # R = 6
This may indicate that the body is not clearing carbohydrates; Demineralization is occurring; and oxygen replacement is sluggish.
Example No.2
1.5 6.80 / 7.20 24C 10 / 7
Sugar Range # R = 0 is less than Urine pH Range # R = 2
This reflects a lack of carbohydrate, and potential dehydration of the pancreas; diabetes.
POTENTIAL INDICATIONS WITH A.R.1
Any excess of carbohydrate in the diet that is not immediately oxidized or
stored as glycogen is converted into fat by the bio-synthesis of lipids.
High carbohydrate levels in the blood mean low levels of oxygen. Energy comes from carbohydrate.

52
Carbon comes from the carbohydrates ingested from food as well as from the carbon in the food.
The oxygen that transforms this carbon into cellular substance comes from the
air we breathe and the water we drink.
1.5 reflects the soluble oxygen in the blood, as well as the exact amount
required by the brain. If the blood carries too much carbohydrate then it cannot carry sufficient oxygen.
This pattern shows that the body is not clearing the excess of carbohydrates
from the body’s tissues.
The urine pH reflects the actual functioning of the digestive tract. A high cationic level will indicate demineralization and difficulty with oxygen
replacement. At 5.20 pH, which is an energy change level, the spleen ceases to manufacture red blood cells, breathing will be difficult, there will be a lack of
iron, and symptoms of anemia and emphysema will become apparent.
If the sugar number is close to normal, or perfect, this may just indicate a simple lack of unrefined carbohydrate. However, if the sugar falls too low, the
blood is unable to carry sufficient oxygen, the result can lead to diabetes.
You can have a high blood sugar with tissue starvation of glucose. This is
because the sugar is not pushed from the blood into the tissues for storage. A person in this situation will show symptoms of carbohydrate deficiency.
A.R.1. will over a period of time produce major disease states if not attended
to.
OTHER COMPLICATIONS RESULTING FROM A.R.1
A bad taste can occur when there are extreme swings of the pH and carbohydrate patterns. Often this taste is of a metallic nature. It is also more
pronounced when the salts and ureas are also in high ranges.
The skin may become itchy when the sugar level drops thereby increasing the
insulin level. Other factors also become involved when this occurs, especially when the salts are high also, the nerve sheaths become involved, causing a
short circuit effect on the sensory nerve endings in the skin. Generally when this occurs the pH is cationic.
When the pituitary function is stressed and this A.R. is present, the cholesterol
level will increase if the sugar range number is high.
This is often seen with A.R.1 when the pH is cationic, there will be a lack of both calcium and oxygen. The oxygen is required to produce liver bile at the
correct strength.

53
Disease Pattern Two
Sugar Range # > Saliva Range #
Example:
4.00 5.9 / 6.8 14C 10 / 6.
Sugar Range # R = 3 Saliva pH Range # R = 2.
A.R.2. involves the function of the liver, lymph and spleen. The saliva pH is an indicator of pancreas functioning. With this range the insulin is decreasing, so
this A.R. presents a pattern involving the blood sugar / insulin.
Whenever the liver is involved we see a potential problem which affects the immune system. We see with this pattern that the sugar number is showing a
high stress level. The lymph, pancreas and spleen are always involved.
It is essential to determine the major stress and which of the above organs are involved, and how they are affecting the health pattern generally.
Always look at the intensity of the range number. For instance, in the above
example, we have a range of 3 or 30% away from perfect, and a saliva range
of 2, or 20% away from perfect. You must always weigh up the intensity of the pattern by checking the total percentage of the test from normal. If below 40%
then the problem has not reached noticeable proportions. This does not mean that there is no degeneration. It still must be treated because, if left, it will
sooner or later develop into a full-blown disease state.
A.R.2 patterns will always reflect problems with pancreas functioning. It is very severe in those tests where the saliva number is above 7.00 on the first test.
When we see this we know that the problem has been there for some years. The insulin level will be increasing as there will be insufficient available to
move the excess sugar from the blood into the tissues. In other words there will be a tissue starvation of glucose. In such cases the patient will experience
mood swings, energy loss, and tiredness, as the body develops low tissue levels of sugar and a high blood glucose range.
When this occurs the patient will experience headaches, energy lapses and other major problems.
Symptoms of cold hands and feet may develop when a low blood sugar does
not allow the pancreas to produce sufficient alcohol, which in turn affects both body temperature and digestive speed. A low body temperature will ensue. In
cases such as this thyroid stress may develop. Check the salts, and if they are high they will reduce the stress.
54
Cirrhosis of the liver will worsen when the sugar is high and the saliva cationic. Excess of sugar will turn into alcohol which will cause calcium to precipitate
from the liver weakening the bile.
Disease Pattern Three
Sugar Range # > Salts Range #
Example:
4.00 5.90 / 6.80 12C 10 / 6
Sugar Range N. R = 3 & Salts Range No. R = 2
This is a major degeneration pattern. There is a shortage of fats which
presents a serious pattern. Incomplete oxidation is taking place, and there will be a mass of degeneration tissue present which is attracting the salts.
This pattern is the most serious which the equation reveals. It is only viewed in
this light when found in the first test, and continues in subsequent tests.
Initially it indicates that there are insufficient fats available for the body to completely utilise carbohydrates. Fats are the precursors of hormones in the
body. A shortage of fats creates a serious stress manifestation, which will
rapidly appear with this adverse relationship. Usually the patient is aware that something is wrong, and will consult you.
When we see high sugars, it may indicate that the patient is not consuming
excess carbohydrates; rather, the oxidation process is not completing its cycle. Inadequate breakdown of carbohydrate creates problems with the utilisation of
fats and proteins, with the incomplete oxidation of carbohydrates; there is a deficiency of both fats and carbohydrates even though ample quantities are
consumed daily.
The major problem seen with this adverse relationship is that of the mass of degenerative tissue. It is always advisable to look at the relationships of the
total test when considering this aggravation alone. However, no matter what the percentage away from normal function reveals, it always suggests a
potential development that may not manifest for several years, however it is
still there. It may be a cancerous growth, tumour, arthritis, cardiovascular problem or any other serious degenerative problem.
When balancing a test such as this, you will always find that the balanced salts
are greater than the actual salts. The balanced salts reflect the level of ionized salts being retained in the tissue mass.
This degenerative mass acts as a negative pole that is becoming ionized. This
is seen as lower levels of salts being spilt into the urine.

55
Disease Pattern Four
Sugar Range # > Total Ureas Range #
Example:
4.00 5.80 / 6.80 16C 6 / 4 10.
Sugar Range # R = 3 & Total Ureas Range # R = 2
This is usually considered as a minor pattern of degeneration, however in some areas it may develop into a major problem.
This adverse relationship is usually one that involves problems with the diet.
For example, there may be insufficient protein present to complete the oxidation of the carbohydrates. In this case you should check with the patient
as to the amount of protein usually taken in their diet.
When the total ureas are below 12, there is a potassium deficiency, provided that the patient is not overweight. If the patient is overweight then a
potassium deficiency will be seen when the total ureas fall below 16. However, if the sugar is low at the same time, then the deficiency will be more
pronounced as both the potassium and oxygen levels to the brain will be
reduced. Here patients will begin to suffer from memory lapses, feel tired and have headaches.
When the sugar number falls below 1.0, and the salts number is below 5C, and
the total ureas are lower than 7, we must suspect that there is a potential for a brain tumour development, especially if the nitrate number is 1. This pattern
should not be taken on an ad hoc basis. In some cases there may be just a body chemistry change occurring when the test is taken. If a similar pattern is
seen on a return test then you need to treat the condition accordingly.
Summary of Sugar Related Patterns
1. We are measuring the spillage of solid wastes into the urine due to the threshold in the blood being exceeded.
2. Disease patterns are related to the altered energy flow due to metabolic
dysfunction.
3. The first four disease patterns are sugar related and are A.R1 to A.R.4.
Refined sugars such as sucrose create harmful effects in the blood stream
which are easily measured by the test.
Always check the strength of the pancreas by comparison with the saliva number. By doing this we are able to spot a diabetic or hypoglycaemic patient.
Both situations will represent a different form of diabetes!

56
Disease Pattern Five
Urine pH # and Saliva pH # are out of balance
This is a Major Degeneration Pattern
Example:
1. Urine pH Range # > Saliva pH Range #.
4.0 5.40 / 6.80 12C 10 / 6
UpH Range # R = 5 & SpH Range # R = 2
The saliva ranges indicate the speed of decline of the body. When either pH is out of balance the liver function is involved. The above example reflects a lack
of iron especially because of the high cationic level of the urine pH. The spleen is stressed, and the patient is becoming anemic. At this cationic level of the
urine pH, breathing difficulties will become apparent over a period of time. This is a major pattern of degeneration and requires your study.
Dr. Reams wrote that the liver is rich in iron and iodine. The major
requirements for liver function for the energy needs of the body are water,
oxygen, calcium, iodine and vitamin A and Calcium is the mineral that the liver requires to make those six billion enzymes daily. If you can rebuild the liver, it
will be able to continue its own detoxification process. If you cannot rebuild the liver, then you cannot help the patient. You can tell when the liver is
strengthening because the total ureas number will begin to drop. It does not matter if they drop below 12 providing all the other numbers are in good
ranges and zones. Always check both of these areas in your follow up tests. Emphysema occurs when the liver is not getting sufficient oxygen. This is seen
when the urine pH is 5.20 or lower.
Drinking Distilled Water with lemon juice added daily will help to rebuild the liver. The liver uses the lemon as a base in forming some 5 billion different
enzymes daily with less chemical change than any other natural substance known to man. When your patient has aching under the left shoulder blade it is
indicative of liver stress, as this is where calcium deficiency is first seen in the
body.
Energy loss is seen when both pH range numbers are equal. Note well that it is the range numbers we are analysing, and not the test numbers. There are
several variations.

57
Example 2
(a) The pH spread is equal and opposite.
5.20 / 7.20. R=4 / R=4
The further the spread of pH the greater the movement from the line of least resistance. This may also be seen in reverse.
(b) 7.70 / 5.20
Example (a) is a first stage of degeneration. However, the high anionic saliva
pH number reflects a highly stressed immune system, which when compared with the rest of a test will point to major areas of ionization and degeneration.
Example (b) indicates a stage three degeneration pattern. Here the liver is in
real trouble. The anionic urine pH reflects liver torpidity, and the cationic saliva pH number reflects that the liver is shutting down, and the body is unable to
draw minerals from the food. This cationic saliva number means that the patient is not getting any energy from the food, and reserves are being heavily
drawn upon.
Therefore adverse relationship 5 indicates energy loss. These two examples
reflect pH that are equal and opposite and is a major pattern indicating energy loss. There is a blockage of energy, and cellular breakdown or catabolism is
occurring. There is a lack of the necessary cellular materials to combat the problem.
(c) 7.80 / 7.80
R=7 / R=7
The spread is locked and anionic.
(d) 5.60 / 5.60 R=4 / R=4
The spread is locked and cationic.
Patterns such as these indicate:
(c) Blockage to the flow of energy.
(d) Leakage of the energy flow.
In both instances the body is not utilising the energy.

58
A locked pH will produce the following resistance problems.
1. Complete lack of energy available. 2. Anionic means blocked; a lack of cationic materials.
3. Cationic means leakage and a lack of anionic materials.
A cationic urine pH reflects a serious stress factor involving the nervous and
skeletal systems.
A cationic saliva pH will involve those major organs such as the lungs, liver, pancreas, spleen and lymph system.
A cationic saliva pH always reflects chronic ill health.
When the urine pH is anionic and the saliva pH is cationic (stage 3) the body is
losing strength rapidly.
pH Conditions
1. With a high anionic range of both pH the caecum is stressed.
2. Also when this pattern occurs the colon is also affected. The digestion is slowed down and the faecal matter remains there too long causing
putrefaction. The slowdown in the bowel will alter the bacteria from aerobic to
anaerobic.
3. A double anionic pH pattern will push excess energy into the skin resulting in tissue thickening. This excess energy is unusable and will increase the toxic
levels in the body, which in turn will attempt to remove via the skin. This results in skin lesions such as acne, boils etc. This is the result of increased
toxicity due to improper elimination.
4. The appendix will show high stress when both pH are cationic and below 6.40. The appendix is a lymphatic organ, and as such you will find toxicity in
the overall lymphatic system.
Disease Pattern Six
Urine pH Range # > Salts Range #
Example:
5.0 5.20 / 7.20 25C 7 / 8
Here we have a high retention of mineral salts; a lack of oxygen in the
bloodstream; disruption to the energy flow; and an excess of salt and fats in the diet.
The adrenals will become stressed when the salts are high due to improper
hydration. High salts in the body will produce high electrical current, which in

59
turn stresses the nervous system. Check the ureas as the potassium may also be low. If this is the position, then that will be a blockage of the nerve
impulses for organ regulation.
Any time there is a high cationic pH in conjunction with high salts the anal canal will be affected. This means hard tissue is being congested, and
weakened due to excessive ionization. The older the patient, the worse the
condition. When the pH is anionic, and the salts increase, reverse osmosis occurs. The metabolism will slow down and a toxic buildup occurs. Cartilage is
affected in prolonged anionic states, and the long bones are affected when cationic, which tends to produce arthritis.
The sigmoid colon and rectal stress becomes affected when the pH is cationic
and salts are high. Anionic UpH, high salts and low sugar indicates sinus infections. Hot flushes worsen with anionic UpH, high sugars and salts.
Disease Pattern Seven
Urine pH # > Total Ureas #
Example:
2.0 5.20 / 7.10 12C 4 / 6 10
Urine pH Range R = 6 Total Ureas Range R = 2
This is a minor degeneration pattern. It usually occurs when the patient is not consuming sufficient protein. If the total urea range is higher than both the
sugar range and the salts range, it is safe to assume that the patient is consuming too much protein.
Often when the Urine pH is at a high cationic level such as this, and the ureas
range is also high, the heart will become stressed, especially if the salts number is above 20C. There will also be kidney stress, high blood pressure,
and a developing angina. When the range numbers are all high, this adverse relationship ceases to be a minor pattern.
A.R.1 and A.R.6 are also minor patterns, however this changes when the
ranges are high. A.R.1 may produce hypoglycaemia, and A.R.6 low electrolytes
with degeneration of the nervous system.
Disease Pattern Eight
Saliva pH Range # > Salts Range #
Example:
4.0 6.8 / 7.2 12C 9 / 4
Saliva pH Range R = 4 & Salts Range R = 2

60
This relationship suggests improper fat metabolism. It is not caused by
insufficient fats in the diet; rather, it indicates that there is a lack of minerals required for the organs of the body to process fats.
When the body is unable to utilise fats it suffers demineralization, including
cholesterol plaque in the arteries, and the development of tumours and cysts.
These develop due to the increase of toxic substances in the blood. The body cannot eliminate wastes in the normal manner.
This pattern may reflect gallbladder involvement.
Disease Pattern Nine
Saliva pH Range # > Total Ureas Range #
Example:
4.0 6.8 / 7.2 12C 9 / 4 13
Saliva pH Range R = 4 & Total Ureas Range R = 3
A pattern such as this indicates difficulty for the liver and the kidneys to
eliminate protein wastes. Should the nitrate range number be closest to
perfect, it will indicate that the liver is most affected due to the lack of the bile salts. Should the ammonia range number be the highest, then the kidneys are
stressed.
Faulty protein elimination may occur through any one of the following conditions:
1. Insufficient rest.
2. Not drinking sufficient energized distilled water. 3. A denatured diet.
Disease Pattern Ten
Salts Range # < Total Ureas Range #
Example:
1. Low Range: 3.1 6.20 / 7.10 20C 10 / 6 16
Salts Range R = 4 & Total Ureas Range R = 5
2. High Range 3.1 6.20 / 7.10 35C 10 / 14 24
Salts Range R = 7 & Total Ureas Range R = 9
This is a major disease pattern.

61
This pattern is similar to Adverse Relationship 3, but not as serious. Example 1
shows that the sloughing of tissue is occurring other than being excreted directly through the urine, which is very difficult and hard on the kidneys,
however toxins will be broken down by the liver and formed into urea wastes, which is seen by the high ureas.
The mineral salts will be minimal because they are being attracted to the sight of degeneration for the process of cleanup and rebuilding.
This situation is better than that seen with A.R.3 because the tissue is being
broken down and destroyed by the body instead of being stored.
Example 2 indicates an imbalance of fat and protein consumption, usually too many concentrated proteins and insufficient fats and oils for complete
oxidation.
Fat shortage will mean ineffective elimination of waste material from the blood, mainly because the fats are the precursors to the kidney's excretion of toxins.
When this happens, the body relies on the skin, lungs, and fatty tissue as channels for elimination.
It may also show colon congestion resulting in the inability of bile salts to be returned through the system for recycling. Bile salts are normally recycled
about twenty times. If they are not recycled, it will result in a serious shortage reflecting low mineral salts. This is a vicious cycle, as the bile salts stimulate
peristalsis and evacuation from the bowel.
Due to the high level of conductivity, indicating that the salts are being stored in the body, the bowel will weaken. Salts are being retained in the walls of the
colon as the salts are accumulated. This results in a weakness developing in the colon wall. Such weakness will distort the walls resulting in pockets of
debris being stored.
Arteries will become blocked due to the disposition of cholesterol caused by over ionization. Over ionization occurs when conductivity is increased due to
dehydration. The high ureas will thicken the blood because the high salts and
ureas cause the red blood cells to become sticky.
Disease Pattern Eleven
(a) Nitrate Range # < Ammonia Range # by 2 or more range #
(b) Nitrate Range # > Ammonia Range # by 4 or more range #
With (a) this shows an imbalance and it indicates that the nitrate urea is not clearing the blood. This will produce increased toxicity, as well as the
possibility of tumor formation.

62
When both nitrate and ammonia range numbers are low, a deficiency of potassium will occur. It also indicates a shortage of protein.
With (b) the nitrate range number should be higher than the ammonia
number, because ammonia is formed from the nitrate urea. When the spread exceeds four ranges, it will reflect high protein wastes in the body, and show
that it is having difficulty in excreting them. The nervous system will be
affected adversely. If the range is high, the circulation will be affected.

63
Chapter Six
Step 9: SPEED OF DECLINE
The speed of decline represents the rate of degeneration of the immune
system. It is computed from the eleven adverse relationships.
When considering the values of the eleven A.R.'s, we must note separately those, which involve the pH of the saliva.
There are four A.R.'s that involve the saliva pH, namely,
A.R.2 A.R.5
A.R.8 A.R.9
In any test that you record any of the above A.R.'s you give the value of 1 to each such A.R. In other words the highest speed number that you can apply to
any test is 4.
The pH of the saliva represents the liver function, and as such the immune system. When the speed is recorded as 1, being only one of the above A.R.'s in
the test, we are able to relate that the immune system is now functioning at 75% efficiency. The higher the liver stress the faster is the decline. Record the
speed number for your test on your worksheet for future use in your energy calculations.

64
Step 10: MAJOR ORGAN OF ENERGY LOSS
The following chart is used to determine the main organs which are showing the highest stress.
Procedure
1. Determine which of the pH are worst aspected, i.e., the highest zone.
2. List this pH.
3. Determine whether this pH is either cationic or anionic. 4. Select the highest zone from the sugar, salt and urea.
5. Use the chart to determine the major organ stressed. 6. Compare your result with the Test aggravations.
Major Organ Chart
pH Zone in
Adversity
Sugar Salt Urea
Cationic Urine pH Kidney, adrenals, reproductive
organs, hair and eyes
Thyroid, heart constriction,
autonomic nervous system,
pulse, blood pressure, metabolic rate
and cholesterol
Heart, blood vessels, tongue
and speech
Anionic Urine pH Bladder Pituitary, energy,
histamine balance,
respiration, circulation and lymph
Small Intestines
Cationic Saliva pH Pancreas, spleen and taste
Lungs, bronchial muscles, skin and
mouth
Liver and eye muscles
Anionic Saliva pH Stomach Colon Gall Bladder

65
Step 11: THE BALANCED TEST
The first test was the Actual Test. It represents the problems involved with the
body chemistry. We use the preceding steps to analyse this factor, and use the homoeopathic remedies to normalise the chemistry.
We now need to determine the nutritional requirements and to do this we now
create a Balanced Test.
The balanced test is formulated with calculations which involve comparisons
with the actual test numbers. The balanced test allows us to ascertain the nutritional corrections for the patient.
Balanced Sugar
This is arrived at from the comparison between the actual and balanced sugar
numbers and is represented by points. 0.10 = 1 point
If the actual sugar number is 5 and the balanced sugar number is 6.2, the difference is 1.2 or 12 points.
Balanced pH
The pH of the urine and saliva both move away from 6.40 at different times in
the day. The balanced pH numbers allow us to determine the degree of spread where we are able to see where the energy loss is occurring.
Balanced Salt
Similar to the sugar numbers, we use the points for determining the salt movement.
Balance Albumin and Urea follow procedures in the charts that follow.

66
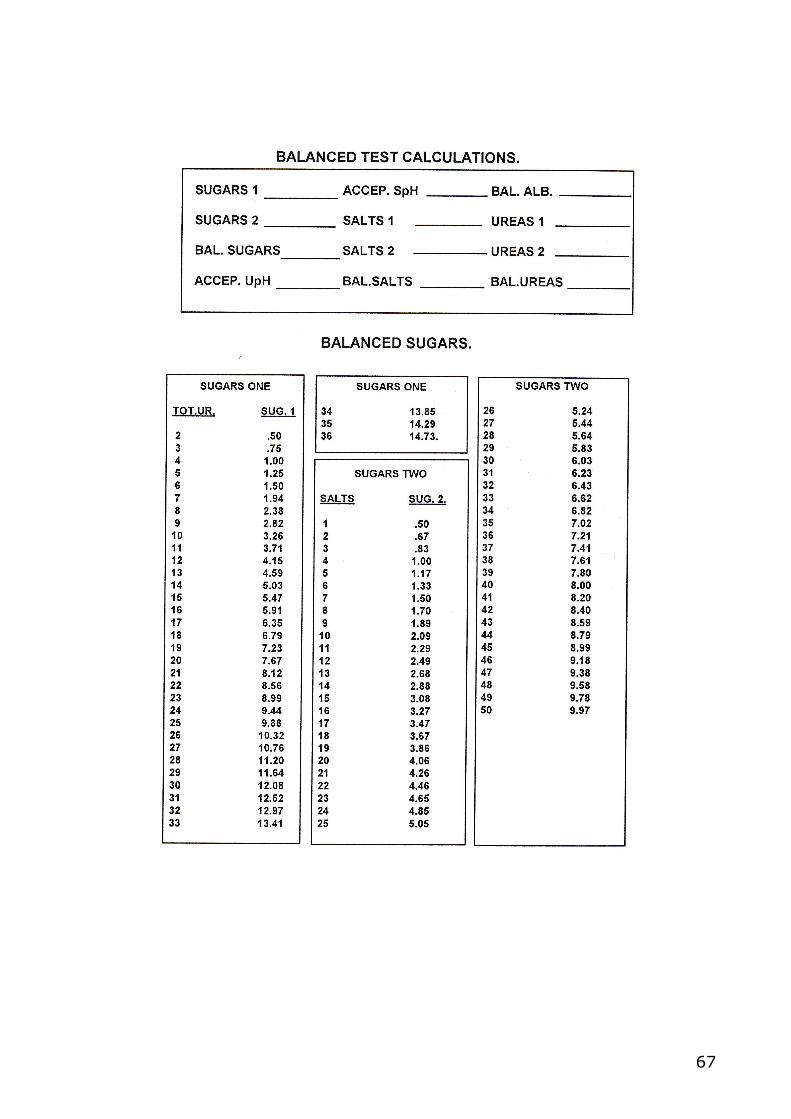
67

68

69

70

71

72

73

74
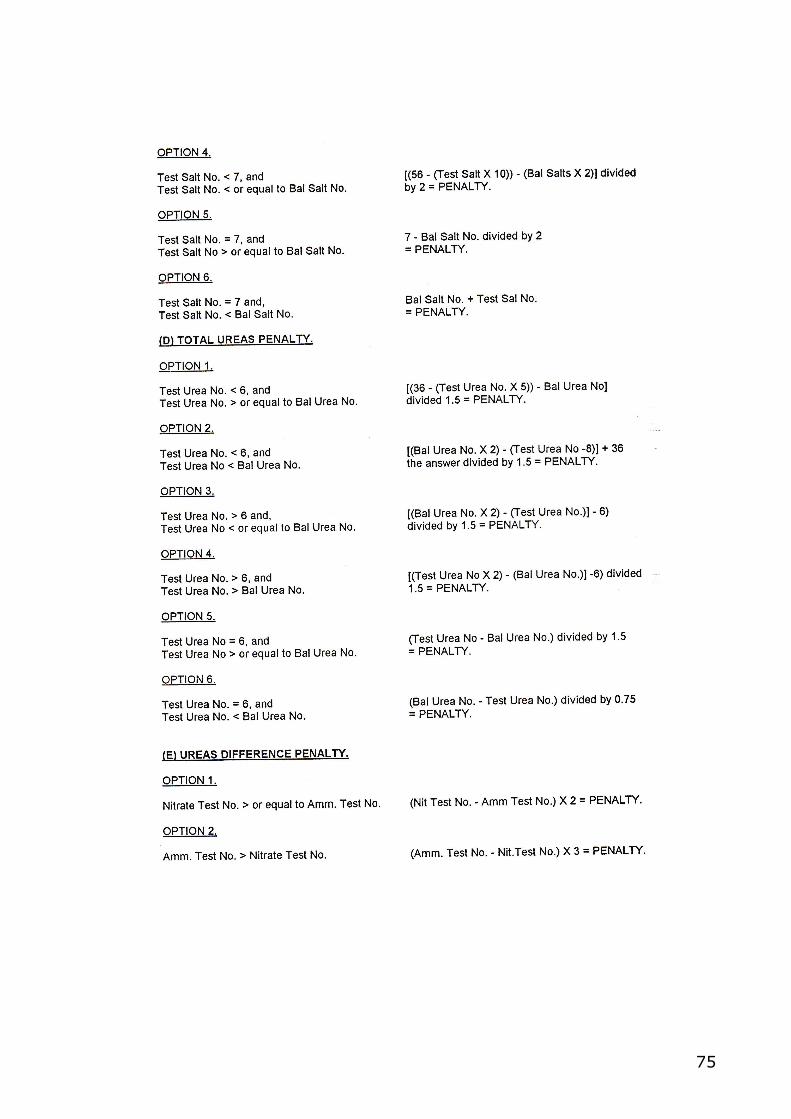
75

76

77
Step 12: CALCULATING THE ENERGIES
The mathematical computations for calculating the energy reserve and
metabolic efficiency are given in this chapter. Use the form on the last page to record your calculations. Use a calculator to work out these computations.
This is the information you are working to achieve.
E.M. Efficiency of Metabolism.
E.R. Energy Reserve
E.R. % % of Energy Reserve
E.R. % is gauged on the following figures.
0% to 24% = Danger Zone 25% to 48% = Reserve being used up
49% to 67% = Health is fair; the body is breaking down; Repair is difficult. 68% to 77% = Tired and health is deteriorating.
78% to 96% = Moderate good health and rebuilding process is occurring. 97% to 99% = Very good health.
EM 10% = Efficiency of Metabolism.
Metabolic energy reflects the efficient function of the digestive tract. It
represents the ability of the metabolism to convert food into energy.
The reserve energy represents the level of immunity, or the body’s resistance and ability to cope with stress, rehabilitation etc.
When the metabolic efficiency or “the pump” as it is often called, operates at
maximum efficiency, the maximum amount of energy is generated. The production of high energy is dependent on the quality of the food eaten and
water drank. High energy production is required for the following needs of the body to maintain homeostasis.
1. There is always some energy lost in conversion. In other words, it takes
energy to make energy. A certain amount of energy that is generated from the
food digested is used to convert that food into energy. 2. The organs use energy to function.
3. Energy is used to collect and excrete wastes, 4. Energy is used to store reserve energy.
As the test numbers move away from correct function, the body begins to draw
on the reserve. If the body is unable to make energy from the food, and the E.M. drops below 55%, the body begins to live off the reserve energy. At this
level the body may be gaining enough energy from the food on a day to day

78
basis. However, if a person overworks in this situation, or becomes stressed, they draw on their reserves.
As the metabolism becomes less efficient, there is insufficient energy to
remove the wastes because the organs are taking what little there is for their functions, when it gets to this stage health becomes fragile.
By balancing the energies there is no guesswork because we know what is happening with the body. When both energy levels are increasing we know
that we are treating the patient correctly.. No matter what symptoms the patient has, or whether there is a healing crisis, we know the energies are
responding. Always go by what the numbers say.
The metabolic efficiency varies according to the numbers balance. The metabolism converts the food into energy, and the greater the imbalance the
worse the metabolic efficiency. Often as the energies improve the E.M. drops.
To understand what occurs with energy balance we need to look at the phases involved in the conversion factor. When food enters the body the metabolism
converts it into energy because the body requires energy to convert energy. This is called “feed-back” energy that is sent back to the metabolism for its
purposes.
The body’s organs have the first call on the available energy produced by the
metabolism. The use of energy follows this sequence:-
1. The lymphatic system collects the wastes. 2. The eliminatory organs use further energy to carry away wastes.
3. Any remaining energy is stored as reserve used in the building resistance.
We will now learn how to determine the efficiency of metabolism following the following steps.
Balanced Test Example
In order to understand how to use the previous tables the following example is
the method you will follow with your tests.
Actual Test Numbers: Time: 10.30 5.40 5.67 / 7.31 30C 4M+ 10 / 12
Start with the sugars
SUGARS 1 = 8.56 TOTAL UREAS ARE 22
SUGARS 2 = 6.03 SALTS ARE 30
TOTAL OF 1 & 2 = 14.59
BALANCED SUGARS = 50% 0F 14.59 = 7.30

79
Now turn to the page on balanced salts.
SALTS 1 = 42.68 TOTAL UREAS ARE 22 SALTS 2 = 26.77 SALTS NUMBER IS 30
TOTAL OF SALTS 1 & 2 = 69.45
BALANCED SALTS = 50% 0F 1 & 2 = 34.72
Turn to the page to balance the ureas
UREAS 1 = 14.85 SUGAR NUMBER IS 5.40
UREAS 2 = 16.28 SALTS NUMBER IS 30C TOTAL OF UREAS 1&2 = 31.13
BALANCED TOTAL UREAS = 50% 0F UREAS 1&2 = 15.57
Turn to the page to balance albumen
5.40 + 30 + 22 = 57.4
Check the chart and mark down 4M. Turn to the page to balance pH.
TIME OF THE TEST WAS 10.30.
Check the pH scale of time reference.
BALANCED pH'S ARE 6.40 / 6.90
BALANCED TEST NUMBER IS: 7.30 6.40 / 6.90 34.72C 4M 15.57

80
Chapter Seven
Step 13: NUTRITION
When conducting the test certain observations of the urine and saliva
specimens will provide some important diagnostic information regarding the patient's metabolism without even referring to the actual test equation.
As the urine is the major substance used, we will discuss some of its
ramifications.
Urine is constantly changing, however, generally the three major constituents are:
1. Water.
2. Urea - nitrate and ammonia nitrogen.
3. Salts, such as: Sodium Chloride
Potassium Chloride Magnesium Chloride
Calcium Chloride Aluminium Chloride
Uric Acid Created detoxified substances
Other electrolytes
Urine is the principal medium by which waste products are excreted in the body. There are more solid wastes excreted from the body in the urine than by
any other route.
Urine Colours and their Meaning
When the body chemistry of an individual is working close to the perfect test
equation the colour of the urine should be colourless. Most urine, due to excessive wastes, urea, etc., will be found in amber to yellow colour.
1. Colourless Urine
This often results from drinking excessive amounts of water during the day which will wash out the pigment. It may also result from fasting.
2. Bright Yellow Urine.
Check and see if the patient is using Riboflavin, Vitamin B2. If they are taking more than 10 mg. daily, this will be responsible for the colour.
3. Amber to Red Colour
Light amber may indicate a concentration of left over proteins. With kidney disease the urine is usually an amber colour. It can also indicate blood
platelets in the urine, and is often seen during menstruation.

81
Amber colour may also indicate extra bile in the urine. Sometimes bile escapes from the blood into the urine via the liver.
Dark red urine may be associated with the pigment, beta cyanine which is
found in beetroot (red beet). A simple check is to see if the stool also contains red pigment.
Bright red urine may be blood.
4. Dark to Dark Brown
This usually accompanies severe jaundice, or reflects liver involvement. Bilirubin will be showing up in the urine. Dark colours are often seen with
various cancers.
5. Other Colours
Smoky colours indicate dried blood and are serious.
Burgundy urine may be due to the presence of prophyrins which are an intermediary in haemoglobin synthesis. It may also be due to lead poisoning,
or it may be congenital.
Drugs alter the colour of the urine. Light green occurs with some antibiotics;
sulphur drugs produce methylene blue.
Mucous strings may be related to infection.
Burning urine indicates bladder or urethra inflammations.
Sand in the urine means renal stones.
Cloudy urine may indicate high cell debris, albumins, bacteria or crystals.
Strong ammonia odor indicates infection in the bladder or urinary tract,
bacterial infection, low pH or a toxic system.
Absence of urine, or if the patient can only supply a very small amount often
indicates stressed kidney function.
Excessive flow can indicate diabetes, especially if it is very clear with a sweet honey like odour.
If you allow the urine to stand for excessive lengths of time it will gradually
darken in its colour. This is caused by the exposure to air, and its subsequent oxidation. You must not keep the urine longer than one hour before completing
the test. Stale urine may be greenish in colour.

82
The darker the intensity of the urine usually indicates a high sugar or
carbohydrate content.
Turbidity
With turbid alkaline urine there will be high levels of phosphates, whereas, with acid urine there will be high levels of urates. Occasionally turbid urine
results from urinary tract infection.
The Saliva
If the saliva is sticky and thick it can be the indication that there is a high level
of congestion of the lymph with a toxic system.
The saliva is the end product of the lymph system. The lymph has a function that is related to the mucous membranes which deposit nutrients into the
blood, and carries out wastes. Therefore the more acid and thicker the saliva, the more congested the lymph.
The pH of the saliva reflects the pH of the liver bile, and determines the acid
alkaline balance of the saliva. Basic Procedures
We will study some of the basic problems involved with the changing body chemistry as seen with the test numbers.
The Sugar Number - 1.5
1.5 is the measurement of the urinary sugars on the Brix scale. This represents the total carbohydrate spillage into the urine. Simple carbohydrates are
sucrose, whereas complex carbohydrates are long chains of sugar molecules linked together as starches.
The carbohydrates that we consume are broken down into a monosaccride
called glucose. Glucose has a molecular weight of 108, whereas our cells have a molecular weight of 100.
The process of osmosis is responsible for the transfer of nutrients through the
cell wall. Glucose requires a hormone, called insulin, to facilitate the transfer of glucose.
Insulin is made by the beta cells of the Islets of Langahans in the pancreas.
When eating normal carbohydrates in our diet, such as fresh fruit, potatoes and whole grains, these take up to 20 minutes to supply the blood with
glucose, and a further 20 minutes to gently move glucose into the tissues for energy production.

83
However, when someone uses orange juice, colas, soft drinks, chocolate drinks, or eats large quantities of ice cream, chocolates, etc., which contain up
to three teaspoons of sugar in the form of sucrose, which is a disaccride, it takes between 5 to 10 minutes to saturate the blood with sugar.
Such a high influx of sugar in so short a period of time forces the pancreas to
produce extra insulin to cope with the assault. It burns up these sugars rapidly
leaving only high levels of insulin in the blood. This creates a very serious situation as the individual will begin to feel faint. One of my patients told me
that she had to lay down several times during the afternoon at work. On questioning her I found that her lunch consisted only of refined sugars.
To avert this tiredness and weakness produced by excess insulin in the
bloodstream, the adrenals begin to produce adrenalin. Once this cycle intensifies, the patient becomes more tired due to overstressed adrenal
function.
The Brain and Blood Sugar
The brain cells require more ATP than any other cells in the body, however, the brain does not require insulin, but takes its glucose directly from the blood.
When there is a depletion of sugar in the blood, the brain also becomes more depleted, which results in such conditions as headaches, loss of memory etc.
If the brain cells are deprived of oxygen, which is conveyed there by the sugar, the brain cells will die within two minutes of oxygen depletion. The subject will
have headaches, spots before the eyes, vomiting etc.
Where there are high blood sugars, the blood is unable to transport and carry oxygen. In these instances, the extremities begin to lack oxygen, and with
these first stages, there will be bruising followed by anaerobic infections such as streptococci, similar to those which occur in diabetes.
In extreme cases gangrene develops and amputation is necessary.
Diabetes and Liver Function
Dr. Reams constantly stated that diabetes is a result of liver malfunction, and
when we see either high or low blood sugars, they are both different forms of diabetes.
It is interesting to note that some years ago researchers found that after surgical removal of 95% of the beta of the Islets of Langahans in the pancreas
that those animals did not produce low levels of insulin! They also found that most diabetics had ample insulin.
It appears that the liver uses about 30% of the blood sugar, and turns this into
fatty acids. However, it does not convert those sugars taken from fruit into fatty acids, only the sucrose.

84
Insulin is required to break down the large glucose molecules in order that they can be transported through the cell membrane for energy use. When the
glucose level in the blood is high, and the cellular glucose level is near zero, insulin - fat stress becomes apparent. The liver produces so much fat that the
pancreatic insulin can do nothing to overtake it. In other words, as the fatty acids are manufactured from the sugars, they inhibit the action of the insulin.
The greater the amount of sugar eaten, the less able the insulin is capable of
doing anything productive in the body.
The problem involved here is the continual building up of fatty acids which results in weight increase as well as triglyceride formation which has a similar
effect on the body as cholesterol.
When a person suffers from a liver mal-function such as this, the sugar that they eat cannot get into the cells because the osmotic pressure cannot handle
the large molecules. The molecular weight of the sugar is 180 which cannot pass through the cell membrane and the cells can only accept anything with a
molecular weight of 100 or less. Now the liver has to do something about this excess sugar. The person begins to grow fat, and must be taken off all sugars
and fats. If not, eventually he will be placed on insulin therapy.
We are able to measure the sugars through the spillage into the urine. When
the sugars in the blood become so high, the kidneys become overworked throwing out excesses of sugar. This in turn places stress on normal kidney
function.
Should the sugars continually rise; increases of pressure develop within the body, one of which produces ocular pressure which eventually produces
blindness.
Fruit (fructose) and glucose (dextrose) do not require insulin to remove them from the blood. Fructose is absorbed slowly and does not trigger
hypoglycaemia.
Cane sugar is 99% sucrose and is converted into fats. To whiten sugar and remove calcium and magnesium salts, it is percolated through beef bone char,
or mixed in an activated carbon solution.
Insulin is a salt, and therefore when measuring urinary sugars, there is a
problem with the refraction of the salt crystals. The chart relative to this is seen later. I do not recommend that you alter the actual sugar number relative
to this chart when calculating the sugars. The sugar - insulin levels are represented by the actual Brix measurement.
When consulting this chart, use it as a comparison with follow up tests to
monitor the intensity of the influence of the insulin.

85
The urinary sugar will provide a closer approximation of what the twenty four hour average is than will the blood serum. Serum glucose tests look at the
same glucose molecule, as does the urinary sugars, however the glucose serum test has nothing to do with the process by which the body obtains
oxygen from the air that we breathe.
Between 1.5 to 2.0 mg. per 100 ml. of urine (1.5% to 2%) will compare with
80 to 90 mg. of glucose per 100 ml. of blood, which is considered as being normal blood sugar.
Being crystals, salts in the urine will refract when doing the sugar reading.
The quantity of carbon dioxide moved out of the blood allows more oxygen to
enter. Elevated blood sugar produces an increase of the osmotic pressure in the blood and this does not increase the carbon dioxide. Therefore increased
osmotic pressure increases the density of the blood.
High and low blood sugar numbers both affect the supply of oxygen and potassium to the brain. The sugar number also reflects the correct functioning
of both the pituitary and pancreas glands.
The control of the cholesterol level in the blood is related to the degree of the
sugar in the blood. Sugars attract fats, increasing the level of the fats in both the tissues and blood, which in turn will increase the cholesterol.
Salts No. Sugar Correction
Salts No. Sugar Correction
14C 0.6 16C 0.7 18C 0.9
20C 1.0 22C 1.1
24C 1.3 26C 1.5 28C 1.6
32C 1.9
36C 2.2 40C 2.5 44C 2.8
48C 3.1 52C 3.4
56C 3.8 60C 4.4 65C 4.9
70C 5.4

86
We shall now look at the various sugar numbers and assess their general meaning. You should study this section relative to the sugar patterns as
outlined earlier. Note, I am also specifying the blood glucose percentage for each level discussed.
9.5 + (150% + Blood Glucose)
This is considered as being a dangerous sugar level, and you should not attempt to alter the level as the patient is probably diabetic and may require
insulin for stabilisation. They could also lapse into a coma. This will be dependent on their balanced sugar number. Look this up on your work sheet.
If the balanced sugar number is much lower than this recording you can safely assume that they are not diabetic. This is only if the balanced sugar number is
below 7.00, when the actual sugar number is 9.5+.
A small amount of sugar ingested at this level may send the level skyrocketing and deplete the available oxygen and cause unconsciousness. The liver will be
mal-functioning.
If a patient is on insulin do not tell them that they can get off of it with the help of diet. Without medical assistance, the reduction or elimination of insulin
will prove fatal. You can assist them with their diet, but allow their allopathic
doctor to monitor the insulin needs.
Dietary recommendations include no sugar or fats; use distilled water, one ounce (29 ml) for energy 2 pounds (kilo) of body weight daily in small amounts
during the day. Restrict fruit, increase wholegrain and fresh vegetables.
6.0 to 9.4 (120% to 150% Blood Glucose)
This is still a serious problem as the blood sugar is very high. In all these numbers check the balanced test number. These patients may exhibit
symptoms of unclear thinking, or have wounds that do not heal well. Their hands and feet may also tingle.
Anyone who is in this sugar range should not have any sugar or fats in their
diets. There should be no junk or take away foods or fatty food until their
sugar is normalised, both actual and balanced.
They must consume the appropriate amount of distilled water as outlined in the previous range. This should be maintained for four weeks. Once again
fruits are restricted and include whole grains and fresh vegetables.
4.0 to 5.9. (100% to 120% Blood Glucose)
This is a slightly high range and is in need of lowering to improve oxygen and potassium in the blood. It the Saliva pH number is also above 7.0, and then

87
this will indicate a raised blood fat level. This will worsen the problem by increasing pancreas stress.
People in this range should observe the same recommendations as for the 6.0
to 9.5 range. To help lower the level use unsweetened lemon distilled water. This is mixed in a ratio of one to nine of lemon juice to distilled water.
This patient should drink a glass of fresh green vegetable juice daily, eliminate sugar and fatty foods, and increase the use of wholegrain and fresh
vegetables.
2.0 to 3.9. (90% to 100% Blood Glucose)
Here the sugar is slightly high and should be lowered to just below 2.0 for optimum oxygen needs. Check the saliva pH number; if it is above 7.0 then
the correction should be speeded up, as the blood will be carrying high levels of fats.
Sugar should be avoided; however, protein and natural fats can be included in
the diet. These should not be overdone. They should increase their intake of unrefined carbohydrates, and include fruit in the diet. Use lemon water if the
saliva pH warrants it, otherwise use distilled water relative to body weight.
1.5 to 1.9. (80% to 90% blood glucose.)
This should be considered the ideal glucose level provided that all the other
test numbers are in the same zones. It indicates the smooth transference of glucose into the cells. To check on this number take the weight of the patient
and see if it fits the normal average for height. If so, then the insulin functioning will be at its optimum. Oxygenation of the blood will be perfect.
However, even the "perfect" zone can be upset when a person uses refined sugar.
1.0 to 1.4. (70% to 80% blood glucose.)
The blood sugar is dropping, and following tests will confirm the problem. This
person could probably feel weak, fatigued and irritable. Nervous symptoms will
be seen as potassium levels drop.
Dietary recommendations will be the same as for the following range 0 to 0.9 range.
0 to 0.9 (less then 70% blood glucose.)
This is a very low blood sugar and there may be an overproduction of insulin.
The symptoms of 1 to 1.4 will be accentuated, however at this level there may be other symptoms such as dizziness and fainting. It is the most serious of the
stages, as unconsciousness, brain damage and death can occur from the lack

88
of glucose in the brain. If pregnant, there will be the possibility of a miscarriage occurring.
0 to 1.4
This low blood sugar range has been traditionally treated by using high protein
snacks to keep the glucose level up. However, it has been found that this was
not the way to go as it created an overload of protein, increased urea, and created a greater problem for oxidation in the blood. Also potassium levels
were further decreased.
The best form of control is to have the patient consume small amounts of high natural carbohydrates regularly throughout the day, as these stabilise the
sugar more effectively.
All sweets should be avoided. The patient should eat many small meals of unrefined carbohydrates, fresh vegetables and low fat proteins. Fat and fruit
should be kept to a minimum. No specific water regimen is called for as this will only serve to lower the blood sugar. If the patient feels weak, then a small
amount of honey may be taken as an emergency measure. As the glycogen needs to be "trained" to convert itself into glucose, the honey should only be
used as an emergency. A high whole-carbohydrate snack is also good for
sustaining the appetite and sugar levels between meals.
Important Factors Regarding Urinary Sugars
A 1.5 sugar number is always perfect but only if all the other numbers are also perfect. Balanced numbers are also considered as providing correct energy
flow. For instance if all the test numbers are in Zone A only, then the body is maintaining a balanced flow of energy. It is only when the ratio is disturbed
that the energy is disrupted. The sugar number will go up when the mineral salts and Urea move into higher zones.
Blood glucose/urine levels will fluctuate throughout the day, but they are
usually higher during the morning and late at night. Naturally, they will vary after a meal, especially if it has a high source of carbohydrates. Also the
urinary glucose level will vary depending on the amount of fluids taken.
Be aware that there is such a test which we call a "NO PICTURE". You will
recognise this as follows:
Low sugar reading Low mineral salts
Low urea, with both the urine pH and saliva pH away from normal
Have the patient return the following day for a retest. Advise them that their body chemistry was changing when the test was done. You will occasionally
get tests such as these. They do not give any recognisable results regarding the patient, and do not fit into their health status.

89
If there is no insulin production, or if there is too much insulin, then there will
be little vitamin assimilation.

90
Chapter Eight: URINE AND SALIVA PH
pH tells us about the internal atmosphere of the body, and the pH of the urine and saliva reveals major functions of the process of digestion. It is an
indication of the acid alkaline balance of the body. When the pH is cationic, it reflects that certain anionic enzymes produced by the liver and pancreas are
not available. Only if the correct balance is achieved between the cationic hydrochloric acid, and the anionic enzymes can the full extraction of nutrients
be gained from the food. When the pH is deviated from normal some of the important nutrients will be excreted unassimilated. Ill health results from
deficiencies even though these are present in the food.
There is a pattern which indicates the precision at which the pH must be adhered to for mineral absorption. All elements are given an atomic number
and weight, which increases with their molecular complexity. The more
complex the element, or the higher its atomic number or weight, the more precise the pH is for its absorption. For instance, hydrogen, carbon, nitrogen,
oxygen and fluorine all have low atomic numbers between one and nine. These elements have a wide span of pH and can be assimilated when the urine pH is
anywhere between 5.40 to 7.60.
The next group with numbers, between eleven to fifteen, include sodium magnesium, silicon and phosphorous. There is still a wide range of absorption
occurring with these from 5.60 to 7.40.
As the atomic weights and numbers go up, such as with sulphur, chlorine, potassium and calcium, their ideal pH range narrows from 5.80 to 7.20. For
manganese and iron, the range is reduced even more from 6.0 to 7.0.
The decreasing urine pH range 6.10 to 6.80 is that of copper and zinc
absorption. Germanium necessitates 6.20 to 6.90, and iodine which has the highest atomic weight and number of the essential elements for the body
requires a near perfect pH of 6.40 to 6.60.
In other words, the higher the atomic number, the closer the pH must be to 6.40 for optimum absorption and utilization of the element. pH homeostasis is
not only important for the health of the digestive organs, but for all the other organs and glands of the body since they all rely on vitamins, minerals and
enzymes for correct functioning.
With the test equation, both the urine and saliva pH should be as close as possible. To be too far apart is not natural, as both depend on the same
enzymes. Adversities of both pH can occur if the test is taken too soon after eating, or if drugs are being taken.

91
Urine pH Ranges
The urine pH is representative of the balance of the acid alkaline enzymes in
the stomach and intestines.
7.8 +:
External symptoms will identify these people. The digestive tract will be very
sluggish, with weak enzymes and digestive juices. People are unable to break down and assimilate minerals and vitamins. They have very poor diets with too
many cooked items, which contain heavy rich foods. If male and over 45, they will have prostate problems and a low sex drive, and if over 40 will have lower
back pain. If female, the nerves will be affected and this will have problems with the reproductive organs, which are affected by the non absorption of
calcium and manganese. The colon will be very congested, and the digestion so slow that they will be deficient in just about all the major minerals. They will
not get enough iodine, germanium, zinc, copper or iron, all of which affect the nerves and reproductive organs. The adrenals will be under severe stress, as
well as deficiency of acid enzymes, and the potential for heavy metal poisoning.
The diet should include more cationic type foods.
7.4 to 7.6:
The same conditions as the previous range but less severe.
7.0 to 7.3:
The digestion is still too slow. They are not properly assimilating vitamins A, D, E or F. They are able to pick up the water soluble vitamins B and C to some
degree. Major minerals being missed out are copper, zinc, germanium and iodine. Some problems will be seen with the reproductive organs, and the
colon is becoming congested.
At this level a patient may have cranberry juice, unsweetened if the sugar is high, twice daily, 45ml for men and 30ml for women and children. Remember
all nutrients should be gauged for body weight and height. Fresh carrot juice
should also be used if the sugar index is not too high. Carrot juice is a preferred source of vitamin A.
The Ionictherapy Programme is designed to primarily move the urine pH
number first. Once the pH of the urine stabilises often the saliva pH will follow, but not always. I find that if the saliva is well out of balance the immune
system is at risk. As the saliva reflects the function of the liver, lymph, pancreas and spleen, it is necessary to treat their function to attain balance.

92
Urine pH Analysis
6.6 TO 6.9:
The digestion is slightly slower than it should be. It is picking up most of the
vitamins and minerals, but not doing quite so well with vitamins A,D,E,F or K, and missing the two elements with the highest atomic weights, germanium
and iodine.
6.3 to 6.5:
This is the ideal range. As the digestion is going at the proper rate in the
proper environment, all ingested minerals and vitamins should be optimally absorbed if the diet is supplying them.
6.1 to 6.2:
The digestion is beginning to be a little too fast. Once again germanium, iodine
and the water soluble vitamins, B and C are slightly deficient.
5.8 to 6.0:
The digestion is moving too fast and is losing its efficiency. Absorption of iron,
copper, zinc, germanium and manganese is occurring. The reproductive organs will become affected adversely. Vitamins B and C are also not assimilating well.
5.4 to 5.7:
With an increase in the speed of digestion, faulty absorption is still occurring. Calcium and potassium are not being assimilated. Deficiencies that will occur
will affect the nerves and bones. The adrenal glands are over stressed. Kidney function is overtaxed, and the heart is becoming stressed.
5.3 and below:
The digestion is extremely fast which may cause considerable stomach and
intestinal pain. The stomach lining will be highly irritated if the pH has been at this level for some time. The patient will be either constipated, or have loose
stools. The colon has pockets of congestion, and the patient will be experiencing a buildup of gas in both the stomach and bowel.
They will not be picking up the major minerals, and experience symptoms of
nervousness, tiredness, and irritability. The adrenals will be exhausted! The reproductive organs will be affected and they will experience lower back pain.
If the saliva pH is also cationic they will be experiencing stomach ulcers. Usually these people have a diet which includes excessive consumption of

93
meat and sweets. Their stools will have an offensive odor, and there will be a severe deficiency of alkaline enzymes. The liver function will be highly
stressed.
Saliva pH Ranges
The saliva pH is representative of the strength of the liver bile and pancreatic enzymes.
7.8 plus:
With this level of alkalinity, the gallbladder will be stressed adversely. The resultant bile is strong and slows down the digestion. It also indicates
problems with the pancreas, which will result in high blood sugar. Vitamin A is not absorbed and the white blood cell count rises, as the red blood cell count
drops. Anionic stress will produce muscle pain when the urine pH is at the same level, as well as either weight gain, or the inability to lose weight,
especially when the urine pH is also anionic. You may also suspect heavy metal poisoning.
A marked tendency toward high levels of stomach gas will be seen if the urine
pH is below 5.50. A condition of alkalinosis will occur which may be life threatening.
6.9 to 7.4:
There are the same basic symptoms as above, but they are less severe. They are starting to pick up vitamin A, and a high sugar will not be as serious.
6.7 to 6.8:
The saliva pH now indicates a slowing of the digestion. This is greatly
multiplied if the urine pH is also high.
6.4 to 6.6:
Like the urine pH, this is the ideal range for nutrient breakdown and absorption.
6.0 to 6.3:
The liver bile is weakening, and this may result from too much alcohol, coffee, tea, cigarettes or drugs.
5.7 to 5.9
The saliva, liver bile, and the pancreatic enzymes are speeding up the
digestive process. Necessary nutrients are being bypassed. Suspect heavy metal poisoning. Vital organs are dying.

94
5.2 to 5.6:
The liver is toxic, and the bile has become weak and ineffective. The digestion
is moving too fast, especially if the urine pH is low. Minerals and vitamins will not be effectively assimilated. Extreme nervousness is likely to be present. If
the urine pH is also cationic, the stomach, small intestines and colon will be
under extreme stress, with the possibility of bleeding. The patient will have difficulty in gaining weight, and may be even losing weight.
5.2 and below:
The same conditions as above will be seen, only more severe. There will be a
yellow cast in the eyes if the saliva pH stays at this level for a period of time. If the urine pH is also very cationic, there will be high acid stress which is likely
to lead to an early death within a short period of time. Check the reserve energy calculation.
Mineral Salts
Salt is a general heading for the 48 known circulating salts in the bloodstream,
most of which are formed when the elements of one nutrient disassociate and combine with other elements of other nutrients. Only about eight of these forty
eight are prevalent in the blood stream.
Sodium Chloride, common table salt, comprises about one half of the total
salts. Seven other salts also circulate, bringing the total to 90%. The remaining 10% consist of the other forty salts found in minute amounts. The
total of these salts varies according to the diet.
A diet high in preserved foods with many additives will also raise the mineral salts level, as they form salts. These unnatural salts are foreign to the body,
and as such must be treated as poisons by the body. As such they are eliminated from the blood through the kidneys, or they are stored in the
tissues.
Whether it is from excess sodium chloride or from processed foods, when salt is stored it causes many problems. If it just passes through, it still causes
problems, as extra salt is left behind as it passes through the body and its
excretory system.
Salt can be eliminated from the bloodstream by the immediate transfer to the surrounding connective tissue. If it is stored in the connective tissue around
the arteries and veins, these vessels harden and become less elastic. The blood flow is impaired and the liver responds by synthesizing cholesterol and
excreting triglycerides. This circulating fat greases the vessel linings to allow the blood to flow in spite of the hard non elastic passageways. This tends to
produce a condition called arteriosclerosis.

95
The mineral salts can also travel to the connective tissues that surround the joints and articulations, causing pain and stiffness. A high mineral salt deposit
may produce arthritic problems which can cause the joint to cease to function.
The heart is affected by high retention of mineral salts. The heart becomes overworked, and beats too hard for too long a period. The Ammonium salts
over stimulate the cardiac muscle.
Another area of stress is in the colon. The process of reabsorption occurs from
the colon, especially water, enzymes and essential salts. If the colon is the least bit congested, the salt has a hard time reaching the colon wall, and the
same thing that happens to the blood vessels is repeated in the colon. The large intestine becomes hard and thick, losing its elasticity. This can be
serious, as it causes irritation and inflammation of the colon. Constipation is often the result. Colitis and diverticulitis may also occur.
The ideal mineral salts number is reached by a number of measurements,
conversion factors and readings on a conductivity meter. Dr. Reams taught the following procedure which was used until the current meter was adjusted to
produce the correct reading.
The urine was required to be diluted at a ratio of 1.25cc of urine to 43.75cc of
distilled water. 45cc of solution resulted. For each cc of urine the mineral salts should weigh 17.5mg. In the solution there should be 22mg of salt (17.5 mg. X
1.25 cc), or 48 mg. per cc. of solution. A conductivity meter was then used, obtaining a reading of 150. 150 multiplied by 0.048 give the ideal mineral salt
rounded to 7C.
The present meter does these calculations for us. All you need to do is pour in the urine, and read the meter.
With a mineral salts reading above 7C, you will find, depending on the age of
the patient, symptoms of varying degrees affecting the blood vessels, heart, lungs and colon.
Mineral Salt Ranges
0 TO 6
This is an indication that the individual is low on electrolytes. This is a rare and
serious condition. The nervous system is weak, and the patient may have symptoms such as lethargy, slow and confused thinking.
7 to 10
The mineral salts are at an ideal level.
11 to 12 In this range the mineral salts are slightly high. Smooth muscle in the body is
affected, and the liver is beginning to synthesize cholesterol.

96
13 to 20 In this range there is a buildup of salts in the connective tissues, ligaments and
muscle tendons. The venous walls and colon are accumulating mineral salts. The heart is beginning to work harder.
21 to 24
This range indicates that the arteries and veins are starting to lose their
elasticity, and that the liver is starting to supply cholesterol to the circulatory system. The joints and articulations will display irritation in some cases, while
headaches and bruising are possible symptoms.
25 to 30 At this level of mineral salts the body becomes severely stressed. If the total
Urea is high, the patient will experience stress tension to the neck and chest, with occasional pain.
There may be some pain in the joints and limbs, however it will tend to move
around and be passing. There will be some vascular stress, and if the total Urea is high there will be cardiac stress.
The irritation to the walls of the colon may be serious enough at this level to
make it felt by the patient. If under 30 years of age, not much will be felt;
between 30 to 40 years of age it will be occasionally experienced; if over 40 the message is starting to get through; over 50 it will be at the point of
knowing that there some problems; and over 60 they know that they have problems.
31 to 40
In this range the stress caused by these salts is starting to put the pressure on, and the condition is becoming serious. The venous and capillary stress has
reached a point that cholesterol and tri-glycerides are presenting serious problems to the health and safety of the individual.
The cardiac and pulmonary stress is getting serious, with enormous tension
and pressure being experienced in the chest. The individual cannot relax, and always feels uptight and on the go. People usually misinterpret this to mean
energy, until their heart can no longer stand the stress. Those who are over 40
years of age with these numbers plus a total Urea over 20 will be in serious trouble. They will probably be experiencing some joint pain.
41 to 50
Anyone with salts this high is in extreme danger as the stress on the cardiovascular system is excessive. The cholesterol and tri-glycerides are
bound to be dangerously high, and the danger of a thrombus developing causing a severe reduction of blood to the brain or heart muscle can produce
severe damage or death.

97
If the total Urea is over 20, and if the ammonia number is above 10, the heart muscle may go into spasm or fibrillation at any moment.
The older the person the more serious and immediate is the danger; if over 30
it is serious; if over 40 it is major; and over 50 it is extreme.
This individual is probably having quite a bit of pain and discomfort and
possibly some loss of function with some of the articulations of the body, especially if they are over 30 or have been under high emotional stress.
This individual may have a colon that has walls that are tough and leathery,
especially if both pH are out of balance in either direction. Generally, they would be experiencing real discomfort in the area of the colon and the rectum.
Nutritional Needs
Drink 30ml of distilled water each hour on the hour until half the body weight
in kilograms has been taken. (120 ml per hour based on an intake of 30 ml per kilo of body weight.)
Eliminate all salt and meat from the diet. No junk food or take away food.
Often the salts may jump after being on the distilled water for ten to fifteen
days; this is because the stored salts in the tissues are being released. This
also occurs with those who have very high sugars. A rise in salts from drinking does not cause any problems however, a rise in flushed sugars may. If the
program is implemented correctly then the Urea and salts will drop simultaneously.
Recent Heart Mal-function
When the heart has been under great cardiac stress and as a result it mal-
functions, there will be changes in the equation to reflect this. When the combined Urea is over 20 and the ammonia number is two or three points
lower than the nitrate number, and the salts are too low for such a high urea total, then that is an indication that the individual may have recently
experienced a heart attack. The reason for this is, that when the heart muscle mal-functions, there is a consumption of ammonia salts which drops the salt
level considerably, and often the ammonia level between three to five points.
Irregular Heart Stress
When the total Urea are twenty or more, and one of the numbers is four or five
points higher than the other, there is an uneven stress on the heart and the individual may experience irregular heart beats. If the ammonia is quite a bit
higher than the nitrate number, then this may occur even below the combined twenty, especially if the salt number is high.
High Urea, as a result of cleansing the body, or the elimination of degenerating
tissue, does not create heart stress. This is not representative of high proteins

98
in the system. Only when the ammonia salts accumulate as a result of the digestive and metabolic processes does this put a stress on the heart.
Patient Age and the Salt Ranges
The salt ranges apply to different age groups with varying intensity. For
instance a twenty year old having a salt of 35 will not be experiencing symptoms of a fifty year old at the same level. To assist your analysis I am
setting out here a comparative index relative to age.
Age Ranges
#1 #2
10 40 to 60 20 30 to 50
30 25 to 40 40 20 to 30
50 15 to 20
COMPLAINT SALT NUMBER
Arterial, venous and capillary stress Moderate Salt #1
Serious Salt #2 Cholesterol Stress Moderate Salt #1
Serious Salt #2 Blood Pressure increasing Salt #2
Pain in the left side of the chest Salt #2
Neck and shoulder tension Salt #2 if Urea above 20 and
UpH plus or minus 1 Ringing in the Ear Salt #2
Chest tension and cannot get breath Salt #2 with Urea 20+ or With Ammonia + 10 and
UpH +/- 1.0
Hands and feet numb or tingling Salt #2 Sugar +5.5. SpH = 7
Joint stiffness and pain Salt #2 UpH +/- 1.0
Demineralization Salt #2 UpH +/- 1.0
Electrolytes too low Salt – 9 and Urea - 12

99
Important Points to Remember
• Salts which can be organic or inorganic are the regulators of the body's
fluid balance. Salts are the conductors of minute electrical currents.
• A mineral salt reading above 7C will indicate varying problems which affect the blood vessels, joints, heart, lungs and colon.
• There are 48 circulating salts found in the blood stream.
• Salts are formed when elements disassociate and combine with other
elements.
• Only eight of the forty eight are prevalent.
• Sodium chloride equals 50% of the mineral composition found in the
body. Seven other salts equal 40%, and all others are in a concentration of 10%.
• Salty diets are high in mineral salts. Preserved foods raise the mineral
salts level since they are essentially salts.
• Excess salts are eliminated from the blood stream by excretion through the kidney. With too much salt, electrical resistance is lowered allowing
excess currents to flow to the organs and glands.
• Salt causes blood vessels to dilate, and they are transferred to the
connective tissues making them harder and less elastic, thereby impairing blood flow.
• Cholesterol is synthesized by the liver which excretes tri-glycerides. This
fat greases the blood vessels to make them slippery. This can lead to arteriosclerosis.
• Mineral salts are also dumped into the connective tissue causing arthritic
conditions.
• The heart becomes overworked with too much salt in the blood stream. Ammonia salts over stimulate the cardiac muscle causing it to beat too
hard and too long.
• Low salts mean low electrolyte levels.
• A salt number above 10C indicates insufficient water drunk daily. The
salts are too concentrated. Note also that insulin is a salt.

100
• High salts tend to over stimulate the nerves of the stomach lining, and add to the causes of ulcers.
• High salts tend to over ionize the food that we eat causing it to cling to
the stomach wall.
• High salts tend to cause varicose veins and red blood vessels on the face
and nose.

101
Chapter Nine: CELL DEBRIS
Old cells must be eliminated so they do not block the blood vessels or accumulate and cause other problems. This breakdown is monitored by
phagocytic cells and other devices. Most of the consequent debris is eliminated in the urine. Old cells from all parts of the body can be present in the urine.
The amount of particles visible in the urine is a good indication of internal health.
When the urine is cloudy, this is not due to cell debris. It is generally due to
the fact of the individual's urine pH being on the alkaline side that is above 6.40, and the result being that calcium and magnesium phosphates are
precipitated out of solution creating the cloudy effect. Two other causes of cloudy urine are high albumin in the urine, and infections in the urinary tract,
which also causes precipitation of calcium and magnesium phosphates.
The Debris count and what it means:
Many studies and comparisons have designated the normal figure to be 0.04M
or 0.4 million parts per litre. This is a very slight amount of debris in the urine, indicating normal cell elimination and a little deterioration of tissue. A large
amount of debris can indicate accelerated tissue degeneration, which is characteristic of bad health.
The urine debris per litre count can be arrived at quite precisely. The measured
sample is viewed on a special grid slide through a microscope, and the amount is calculated mathematically. However, extensive observations have yielded a
correlation between one visible (to the naked eye) particle and 25,000 invisible (microscope) particles. In a 50-cc sample, one visible particle means that
under a microscope we would see an average of 25,000 more. To calculate the
total particles in a litre of urine, you must observe the number of visible particles in 50 cc of urine and multiply that by 20 (since 50 cc is 1/20th. of a
litre). That figure is multiplied by 25,000 (for the particles that are not visible). This gives the total urine debris count (visible and invisible particles).
For example, if there were five visible particles, we would multiply that by 20
to get the amount in one litre, and then multiply the result by 25,000 to include the particles not visible. The urine debris would be 2,500,000, or more
than five times the recommended level of 0.4 million. This 0.04M optimum is not easily attained. With a 0.04M reading, urine will be particle free to the
naked eye. In perfect health, the urine will be crystal clear.
Unlike the other numbers in the equation, the debris count does not have ranges. When we see 10 particles visible we write down 5M. This indicates that
there are at least 5,000,000 particles in one litre of an individual's urine. This
would indicate that there is cellular and tissue degeneration in that individual

102
at least ten times greater than desirable. To go any higher would be meaningless.
If the other numbers in that individual's metabolic balance are far away from
normal then the 5M would be normal for that test. However, if the other numbers are far out of balance and the debris count is 3M, then this would
reflect a problem with the nervous system, as well as tissue degeneration not
being accompanied by normal cell replacement. This would be an undesirable condition.
After a patient has gone through the Ionictherapy Programme, and cleansed
their system and changed their eating habits to those which are more nutritious, it is normal for the debris to drop to 2M or 3M. It is not normal to
see an individual over 30 years of age to get this number below 2M
Babies and small children in good health will often have debris counts of 1M and below. However, on today's diets, it is not uncommon to see small children
with a debris count of 5M.
The meaning of a low debris count is related to the age of the patient, and the rest of the numbers to the metabolic balance. If the other numbers are well
out of balance, then the debris count also should be high.
The Urea Ranges
The under mentioned values are the combination of the nitrate and ammonia
urea. The ideal 3 / 3 would have a value of 6. There should never be more than 3 points between the two numbers.
26 to 30
This shows extreme cardiac stress and indicates that the heart has been labouring for some time. The muscles of the heart are exhausted and the blood
supply is high in toxic nitrogenous compounds. Such an individual is susceptible to having his heart go into a spasm or fibrillation at any given
moment. This is an extremely dangerous condition. The patient will have an enormous amount of tension in the chest and cannot get their breath.
They will feel tense all the time, and cannot relax. They will not feel refreshed
when getting up in the morning because protein digestion is running in excess
of 24 hours a day. When they are sleeping the body is still working very hard. The seriousness of this condition is compounded by high mineral salts. The
blood will be clotting. They are probably experiencing chest pains as well as pain in the left arm, arm pit and shoulder area.
24 to 25
Moderate to serious cardiac stress. Protein digestion is still running close to 24 hours, and the blood is still clotting. The heart is laboring too hard. This person
is not getting adequate rest at night because the body is still working while the patient is sleeping. They will not experience the energy levels they are used to,

103
because of the energy drain caused by cardiac stress. They may also have tissue and organ degeneration especially if the pH is far out of balance.
22 to 23
Cardiac stress is present although the patient may not be aware of it. This level is highly characteristic of the person who suddenly has a heart attack
when over exerting in physical activity. Because the heart has to work so hard,
this person may feel tired, which is about the only external symptom. Sudden physical exertion, without a proper warm-up or without being in shape, can
result in mal-function of the already laboring heart muscle.
20 to 21 If this value includes a high ammonia number with high mineral salts there will
be mild heart stress. If the other numbers are normal, fatigue will not be noticed. An unbalanced equation in conjunction with this urea level will cause a
lack of energy. Once more, if the pH is unbalanced, cell degeneration may be progressing.
16 to 19
It is at this level that the patient will first start noting tiredness, fatigue and a worn out feeling. This is because their protein digestion is running nearly 18
hours a day and they are not getting the opportunity for energy build up. If
their other numbers show good energy levels, then they will not notice this energy loss. However, if the other numbers indicate poor energy utilisation,
then even at this level they will feel tired all the time. If both the ammonia and salt numbers are high this will compound the problem.
13 to 15
Here the direction changes because the cardiac system is not the main system under stress; the nervous system is stressed and is degenerating. This is a
very common range.
10 to 12 This level is indicative of a person on a diet high in meat, fats and sugar, and
low in complex carbohydrates. The amount of urea in the urine is reduced because it is deposited in the tissue spaces. The nervous system is stressed
and there is a potassium deficiency.
6 to 9
This is not a normal or average level because the Western diet upsets the levels even when apparently normal. At this range the potassium deficiency
may already be so severe as to have created some degeneration and disintegration of the nerve, brain cells and tissues. The entire equation may
not make any sense until this deficiency is corrected. It is often called a potassium mask. This could be a very serious and dangerous condition and one
that is irreversible.

104
0 to 5 This indicates a very serious potassium deficiency and most likely major
degeneration and deterioration in the nervous system and brain. If it has been at this level for a long time it may be irreversible. If both the urine and saliva
pH are near the 5.2 level, or below, then death is near at hand.
Urea Factors
The amount of nitrate and ammonia urea, or protein excess that is found in the
urine is indicative of how well the body is metabolising protein. Using this factor, the amount of tissue builds up, stress, and pressure on the entire
system, especially the cardiac and circulatory systems are apparent.
Generally excess protein intake is a far greater problem than its deficiency. You may find it surprising that, like protein deficiency, protein excess can
cause death. It is responsible for innumerable maladies.
Simple deduction indicates the reason for the stress. Protein, if not used, must be excreted. The nitrogen contained in protein is what causes the problem.
Before it can be eliminated, it must be converted to a form that is easy to eliminate. This is nitrate nitrogen. Some protein is converted to an
intermediate product and poisonous waste which is ammonia nitrogen. It is created in the healthy body; however, an unbalanced chemistry can cause its
overproduction. This ammonia stresses the heart and respiratory systems. The
entire process of converting excess protein into urea and other by-products is a stress in itself. It uses up energy, which is needed elsewhere.
Protein excess, causing tissue buildup is a new concept from Professor Lother
Wendt, of Frankfurt University. His studies indicate that protein, not immediately used or excreted, can clog capillaries and starve cells of their
nutrients. When long chains of amino acids circulate, before they are separated, through the capillaries, they may block a vessel. Then the walls
thicken and nutrients can neither pass through the barricaded capillaries nor diffuse across the thickened walls. The heart is then stressed, as the capillaries
are no longer elastic. The heart now may be in even greater danger because cholesterol and tri-glycerides are released into the blood stream to coat the
vessels for smoother passage.
The protein may seep into the tissue spaces expecting to be ushered into the
cells. Many of the cells may have degenerated from lack of nourishment, due to the impassable vessel walls, so the protein sets up housekeeping in the
tissue spaces, causing oedema, as it attracts sodium. Protein can combine with a base and form a mineral salt. All this salt in the connective tissue around the
bones and joints is painful and can cause malfunction.
To avoid further problems caused by protein deficiency it is imperative to obtain the correct amount from the diet, and unless you have a balanced
chemistry, this won't allow achieved. Protein accumulation can occur without excess dietary protein. However, correct nutritional practice involves the

105
optimal protein metabolism rather than just reducing the normal protein level which may endanger health.
Worms in the intestinal tract can be expected if the nitrogen value far exceeds
the ammonia value. This is because worms produce excess nitrogenous waste in the form of nitrate nitrogen. When both pH are also alkaline for a long
period of time this will reinforce the problem. Worms rarely survive in an acid
environment.
Urea will fall and rise again during a detoxifying or fasting program. The second rise indicates the body is re-building after eliminating as much waste as
possible.

Now Available:
The complete research and books on Ionictherapy and Homoeopathy by Dr Douglas Jesse: free to
download.
“Classical Homoeopathy Book One – General Principles” PDF file “Classical Homoeopathy Book Two – Polycrests” PDF file
“Classical Homoeopathy Book Three – Diseases” PDF file “Classical Homoeopathy Book Four – Advanced Principles” PDF file
“The Ionic Body” epub file
“The Healing Power of Ionictherapy” epub file “Ionictherapy and You” epub file
“Energised Distilled Water” PDF file
“Nutrition and Ionictherapy” PDF file A Practitioners Guide for Homoeopathic Ionictherapy
“Homoeopathic Ionictherapy” PDF file Principles and Practice – a Practitioner’s Guide
To download these books click on the following link and go to the Library page.
http://www.thevortexoflightandhealing.net