principles of microeconomics - irfan lalirfanlal.yolasite.com/resources/principle of micro 1st...
TRANSCRIPT

Principles of Microeconomics
Definition
• Economics is the study of how people and societies
use their scares resources to produce valuable
goods and services and distribute them among
different section of society.
Economics
Economics is the social science that studies the choices
that individuals, businesses, governments, and entire
societies make as they cope with scarcity and the
incentives that influence and reconcile those choices.

Scarcity
• means that society has limited resources and
therefore cannot produce all the goods and services
people wish to have. Just as a household cannot
give every member everything he or she wants, a
society cannot give every individual the highest
standard of living to which he or she might aspire.
•
Scarcity
• Scarcity is situation in which goods are limited
relative to desire.
• Goods are offered is less than its required
• Shortage – Demand greater than supply

Microeconomics
Microeconomics is the study of choices
that individuals and businesses make,
the way those choices interact in
markets, and the influence of
governments.
Macroeconomics
Macroeconomics is the study of the
performance of the national and global
economies.

Production Possibility Frontier-PPF
• Production Possibility Frontier shows the maximum
amounts of production that can be obtain by an
economy, given its technological knowledge and
quantity of inputs available.
Production Possibilities and Opportunity
Cost
The production possibilities frontier (PPF) is the
boundary between those combinations of goods and
services that can be produced and those that cannot.
To illustrate the PPF, we focus on two goods at a time
and hold the quantities of all other goods and services
constant.
That is, we look at a model economy in which
everything remains the same (ceteris paribus) except the
two goods we’re considering.5

Production Possibilities and Opportunity
Cost
• Production
Possibilities Frontier
Figure 2.1 shows the
PPF for two goods: CDs
and pizza.
Any point on the frontier
such as E and any point
inside the PPF such as Z
are attainable.
Points outside the PPF
are unattainable.

Economic system
• Market Economy
• In market economy individuals and firms make major
decisions about production and consumption. In
market economy a system of price mechanism
prevails. Firm adopt low cost of production
techniques and fix prices in order to maximize their
profit. In market economy price Mechanism plays an
important role. In market economy what, how and for
whom are three important elements.

Command Economy
• In Command economy Govt. makes decisions about
what to produce and how to distribute goods and
services. All economic resources, such as land;
capital and are owned by Govt. All workers are Govt.
employees and are paid by Govt. for their services.
All lands and factories controlled and managed by
the Govt.

Mixed Economy
• In mixed economy some sectors of economy are
operated by Govt. while others are being managed
by private sector. Govt. has an important role in
proper functioning of market economy; Govt.
enforces certain rules and regulations. Govt. focuses
more attention on peace and order through police,
better education and health services for the masses.
Two Big Economic Questions
Two big questions summarize the scope of economics:
How do choices end up determining what, how, and for
whom goods and services get produced?
When do choices made in the pursuit of self-interest
also promote the social interest?

Two Big Economic Questions
What, How, and For Whom?
Goods and services are the objects that people value and produce to satisfy human wants.
What?
What we produce changes over time.
Seventy years ago, almost 25 percent of Americans worked on farms. Today that number is 3 percent.
Seventy years ago, 45 percent of Americans produced services. Today, almost 80 percent of Americans have service jobs.
Two Big Economic Questions
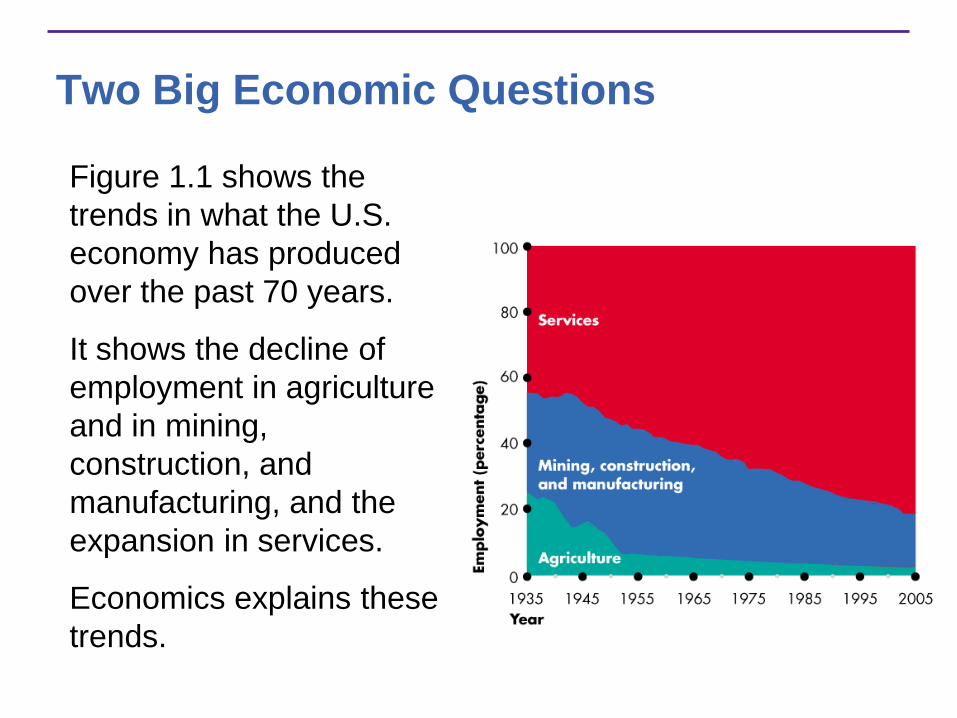
Figure 1.1 shows the
trends in what the U.S.
economy has produced
over the past 70 years.
It shows the decline of
employment in agriculture
and in mining,
construction, and
manufacturing, and the
expansion in services.
Economics explains these
trends.

Two Big Economic Questions
How?
Goods and services are produced by using productive
resources that economists call factors of production.
Factors of production are grouped into four categories:
Land
Labor
Capital
Entrepreneurship

Two Big Economic Questions
The “gifts of nature” that we use to produce goods and services are land.
The work time and work effort that people devote to producing goods and services is labor.
The quality of labor depends on human capital, which is the knowledge and skill that people obtain from education, on-the-job training, and work experience.
The tools, instruments, machines, buildings, and other constructions that are used to produce goods and services are capital.
The human resource that organizes land, labor, and capital is entrepreneurship.

Two Big Economic Questions
For Whom?
Who gets the goods and services depends on the incomes
that people earn.
Land earns rent.
Labor earns wages.
Capital earns interest.
Entrepreneurship earns profit.

To make coordination work, four complimentary social
institutions have evolved over the centuries:
Firms
Markets
Property rights
Money
Economic Coordination

Economic Coordination
A firm is an economic unit that hires factors of production and organizes those factors to produce and sell goods and services.
A market is any arrangement that enables buyers and sellers to get information and do business with each other.
Property rights are the social arrangements that govern ownership, use, and disposal of resources, goods or services.
Money is any commodity or token that is generally acceptable as a means of payment.

Economic Coordination
• Circular Flows Through Markets
A circular flow diagram, like Figure 2.8 on the next
slide, illustrates how households and firms interact in the
market economy.

Economic Coordination
• Coordinating
Decisions
Markets
coordinate
individual
decisions through
price adjustments.
Demand
If you demand something, then you
1. Want it,
2. Can afford it, and
3. Have made a definite plan to buy it.
Wants are the unlimited desires or wishes people have for
goods and services. Demand reflects a decision about
which wants to satisfy.
The quantity demanded of a good or service is the
amount that consumers plan to buy during a particular
time period, and at a particular price.

Demand
The Law of Demand
The law of demand states:
Other things remaining the same, the higher the price of a
good, the smaller is the quantity demanded; and
the lower the price of a good, the larger is the quantity
demanded.
The law of demand results from
Substitution effect
Income effect

Demand
Substitution effect
When the relative price (opportunity cost) of a good or
service rises, people seek substitutes for it, so the
quantity demanded of the good or service decreases.
Income effect
When the price of a good or service rises relative to
income, people cannot afford all the things they
previously bought, so the quantity demanded of the
good or service decreases.

Demand
Demand Curve and Demand Schedule
The term demand refers to the entire relationship between
the price of the good and quantity demanded of the good.
A demand curve shows the relationship between the
quantity demanded of a good and its price when all other
influences on consumers’ planned purchases remain the
same.

Demand
Figure 3.1 shows a
demand curve for energy
bars.
A rise in the price, other
things remaining the same,
brings a decrease in the
quantity demanded and a
movement along the
demand curve.

Demand
Willingness and
Ability to Pay
A demand curve is also a
willingness-and-ability-to-
pay curve.
The smaller the quantity
available, the higher is the
price that someone is
willing to pay for another
unit.
Willingness to pay
measures marginal benefit.

Demand
A Change in Demand
When any factor that influences buying plans other than
the price of the good changes, there is a change in
demand for that good.
The quantity of the good that people plan to buy changes
at each and every price, so there is a new demand curve.
When demand increases, the demand curve shifts
rightward.
When demand decreases, the demand curve shifts
leftward.

Demand
Six main factors that change demand are
The prices of related goods
Expected future prices
Income
Expected future income
Population
Preferences

Demand
Prices of Related Goods
A substitute is a good that can be used in place of
another good.
A complement is a good that is used in conjunction with
another good.
When the price of substitute for an energy bar rises or
when the price of a complement of an energy bar falls, the
demand for energy bars increases.

Demand
Expected Future Prices
If the price of a good is expected to rise in the future,
current demand fore the good increases and the demand
curve shifts rightward.
Income
When income increases, consumers buy more of most
goods and the demand curve shifts rightward. A normal
good is one for which demand increases as income
increases. An inferior good is a good for which demand
decreases as income increases.
Demand
Expected Future Income
When income is expected to increase in the future, the
demand might increase now.
Population
The larger the population, the greater is the demand for all
goods.
Preferences
People with the same income have different demands if
they have different preferences.

Demand
Figure 3.2 shows an
increase in demand.
Because an energy bar
is a normal good, an
increase in income
increases the demand
for energy bars.

Demand
A Change in the Quantity
Demanded Versus a
Change in Demand
Figure 3.3 illustrates the
distinction between a
change in demand and a
change in the quantity
demanded.

Demand
A Movement along the
Demand Curve
When the price of the good
changes and everything
else remains the same, the
quantity demanded
changes and there is a
movement along the
demand curve.

Demand
A Shift of the Demand
Curve
If the price remains the
same but one of the other
influences on buyers’
plans changes, demand
changes and the demand
curve shifts.

Supply
If a firm supplies a good or service, then the firm
1. Has the resources and the technology to produce it,
2. Can profit from producing it, and
3. Has made a definite plan to produce and sell it.
Resources and technology determine what it is possible
to produce. Supply reflects a decision about which
technologically feasible items to produce.
The quantity supplied of a good or service is the amount
that producers plan to sell during a given time period at a
particular price.
Supply
The Law of Supply
The law of supply states:
Other things remaining the same, the higher the price of a
good, the greater is the quantity supplied; and
the lower the price of a good, the smaller is the quantity
supplied.
The law of supply results from the general tendency for the
marginal cost of producing a good or service to increase
as the quantity produced increases (Chapter 2, page 37).
Producers are willing to supply a good only if they can at
least cover their marginal cost of production.

Supply
Supply Curve and Supply Schedule
The term supply refers to the entire relationship between
the quantity supplied and the price of a good.
The supply curve shows the relationship between the
quantity supplied of a good and its price when all other
influences on producers’ planned sales remain the same.

Supply
Figure 3.4 shows a supply
curve of energy bars.
A rise in the price of an
energy bar, other things
remaining the same,
brings an increase in the
quantity supplied.
Supply
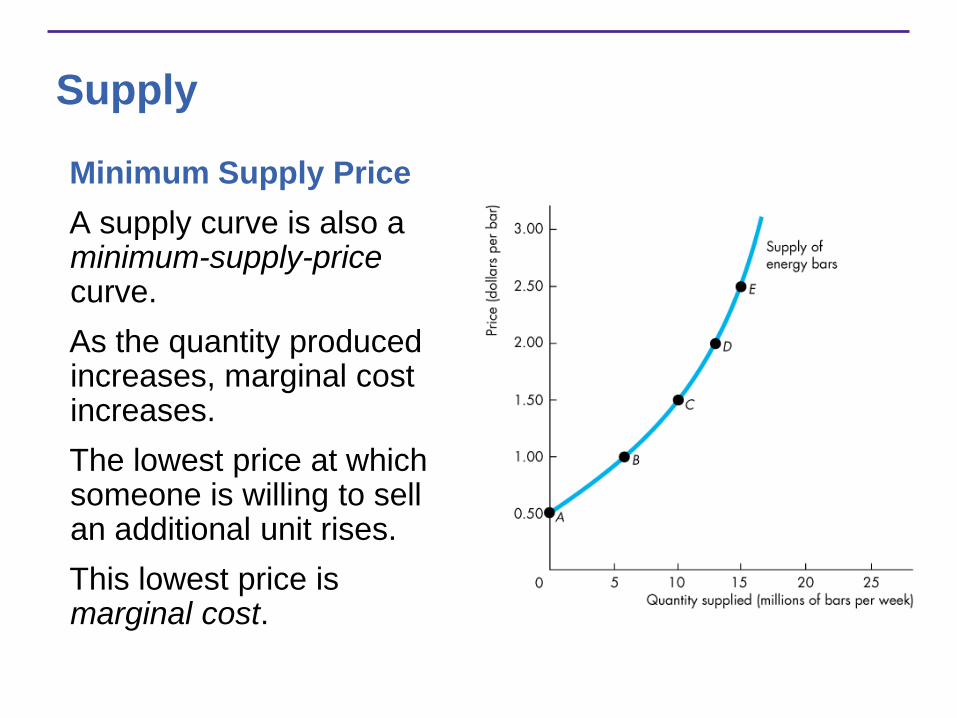
Minimum Supply Price
A supply curve is also a minimum-supply-price curve.
As the quantity produced increases, marginal cost increases.
The lowest price at which someone is willing to sell an additional unit rises.
This lowest price is marginal cost.

Supply
A Change in Supply
When any factor that influences selling plans other than
the price of the good changes, there is a change in
supply of that good.
The quantity of the good that producers plan to sell
changes at each and every price, so there is a new supply
curve.
When supply increases, the supply curve shifts rightward.
When supply decreases, the supply curve shifts leftward.
Supply
The five main factors that change supply of a good are
The prices of productive resources
The prices of related goods produced
Expected future prices
The number of suppliers
Technology
Supply
Prices of Productive Resources
If the price of resource used to produce a good rises, the
minimum price that a supplier is willing to accept for
producing each quantity of that good rises.
So a rise in the price of productive resources decreases
supply and shifts the supply curve leftward.

Supply
Prices of Related Goods Produced
A substitute in production for a good is another good that
can be produced using the same resources.
The supply of a good increases if the price of a substitute
in production falls.
Goods are complements in production if they must be
produced together.
The supply of a good increases if the price of a
complement in production rises.

Supply
Expected Future Prices
If the price of a good is expected to rise in the future,
supply of the good today decreases and the supply curve
shifts leftward.
The Number of Suppliers
The larger the number of suppliers of a good, the greater
is the supply of the good. An increase in the number of
suppliers shifts the supply curve rightward.
Supply
Technology
Advances in technology create new products and lower
the cost of producing existing products, so advances in
technology increase supply and shift the supply curve
rightward.
A natural disaster is a negative technology change, which
decreases supply and shifts the supply curve leftward.
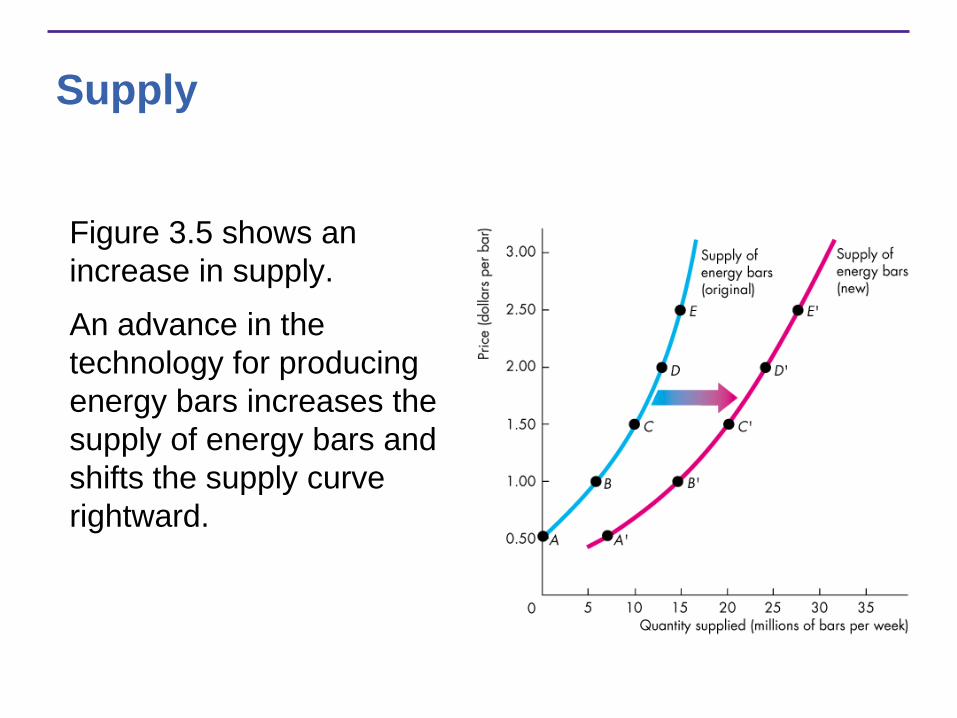
Supply
Figure 3.5 shows an
increase in supply.
An advance in the
technology for producing
energy bars increases the
supply of energy bars and
shifts the supply curve
rightward.

Supply
A Change in the Quantity
Supplied Versus a
Change in Supply
Figure 3.6 illustrates the
distinction between a
change in supply and a
change in the quantity
supplied.

Supply
A Movement Along the
Supply Curve
When the price of the good
changes and other
influences on sellers’ plans
remain the same, the
quantity supplied changes
and there is a movement
along the supply curve.
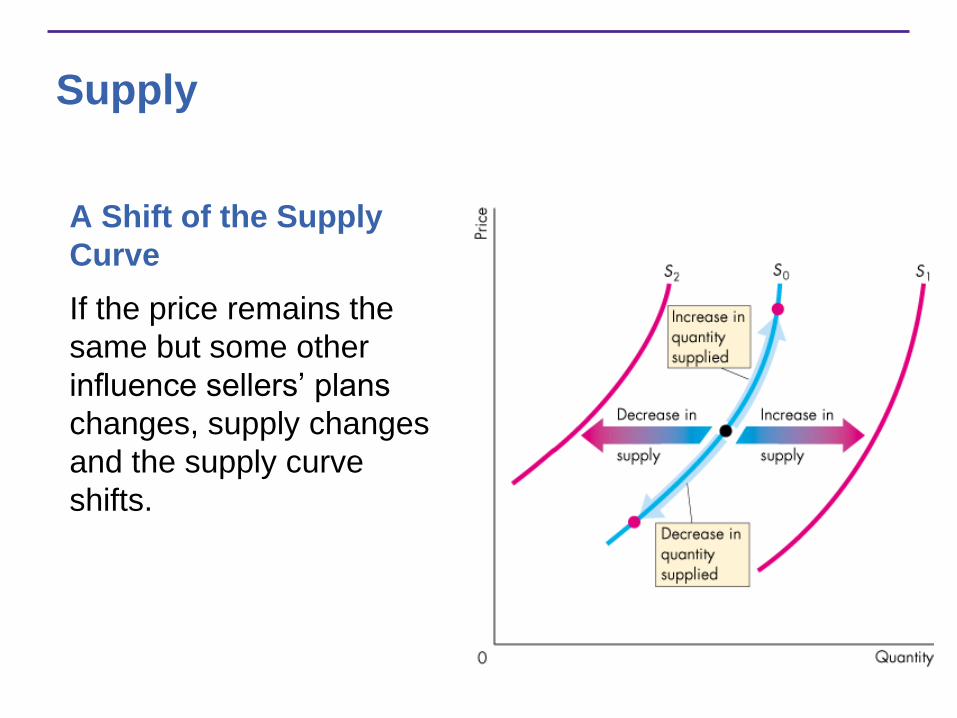
Supply
A Shift of the Supply
Curve
If the price remains the
same but some other
influence sellers’ plans
changes, supply changes
and the supply curve
shifts.

Market Equilibrium
Equilibrium is a situation in which opposing forces balance
each other. Equilibrium in a market occurs when the price
balances the plans of buyers and sellers.
The equilibrium price is the price at which the quantity
demanded equals the quantity supplied.
The equilibrium quantity is the quantity bought and sold
at the equilibrium price.
Price regulates buying and selling plans.
Price adjusts when plans don’t match.

Market Equilibrium
Price as a Regulator
Figure 3.7 illustrates the
equilibrium price and
equilibrium quantity.
If the price is $2.00 a bar,
the quantity supplied
exceeds the quantity
demanded.
There is a surplus of 6
million energy bars.

Market Equilibrium
If the price is $1.00 a bar, the quantity demanded exceeds the quantity supplied.
There is a shortage of 9 million energy bars.
If the price is $1.50 a bar, the quantity demanded equals the quantity supplied.
There is neither a shortage nor a surplus of energy bars.

Market Equilibrium
Price Adjustments
At prices above the equilibrium price, a surplus forces the price down.
At prices below the equilibrium price, a shortage forces the price up.
At the equilibrium price, buyers’ plans and sellers’ plans agree and the price doesn’t change until some event changes either demand or supply.

Predicting Changes in Price and Quantity
An Increase in Demand
Figure 3.8 shows that
when demand increases
the demand curve shifts
rightward.
At the original price, there
is now a shortage.
The price rises, and the
quantity supplied increases
along the supply curve.

Predicting Changes in Price and Quantity
An Increase in Supply
Figure 3.9 shows that
when supply increases
the supply curve shifts
rightward.
At the original price, there
is now a surplus.
The price falls, and the
quantity demanded
increases along the
demand curve.

Predicting Changes in Price and Quantity
All Possible Changes in
Demand and Supply
A change demand or
supply or both demand
and supply changes the
equilibrium price and the
equilibrium quantity.

Predicting Changes in Price and Quantity
Change in Demand with
No Change in Supply
When demand increases,
equilibrium price rises and
the equilibrium quantity
increases.

Predicting Changes in Price and Quantity
Change in Demand with
No Change in Supply
When demand decreases,
the equilibrium price falls
and the equilibrium
quantity decreases.

Predicting Changes in Price and Quantity
Change in Supply with No
Change in Demand
When supply increases,
the equilibrium price falls
and the equilibrium
quantity increases.

Predicting Changes in Price and Quantity
Change in Supply with No
Change in Demand
When supply decreases,
the equilibrium price rises
and the equilibrium
quantity decreases.
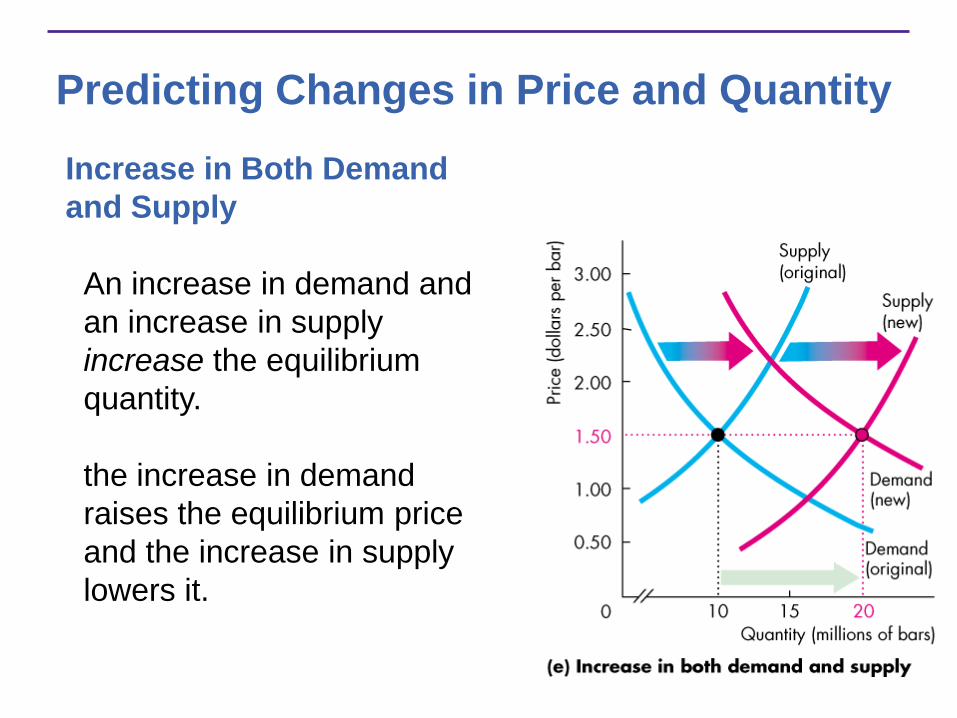
Predicting Changes in Price and Quantity
Increase in Both Demand
and Supply
An increase in demand and
an increase in supply
increase the equilibrium
quantity.
the increase in demand
raises the equilibrium price
and the increase in supply
lowers it.

Predicting Changes in Price and Quantity
Decrease in Both Demand
and Supply
A decrease in both demand
and supply decreases the
equilibrium quantity.
the decrease in demand
lowers the equilibrium price
and the decrease in supply
raises it.

Predicting Changes in Price and Quantity
Decrease in Demand and
Increase in Supply
A decrease in demand and
an increase in supply lowers
the equilibrium price.
the decrease in demand
decreases the equilibrium
quantity and the increase in
supply increases it.

Predicting Changes in Price and Quantity
Increase in Demand and
Decrease in Supply
An increase in demand and a
decrease in supply raises the
equilibrium price.
the increase in demand
increases the equilibrium
quantity and the decrease in
supply decreases it.

Producer surplus is the difference between what the producer
receives for the good and the amount he/she must receive to be
willing to provide the good.
S
D
P
Q
P*
Q*
It is the area above the supply curve & below the price.

Consumer surplus is the difference between what the consumer has to pay for
a good and the amount he/she is willing to pay.
S
D
P
Q
P*
Q*
It is the area under the demand curve & above the price.

Original Consumer
Surplus
Change in Consumer Surplus: Price
Increase
Quantity
New Consumer Surplus
Loss in Surplus: Consumers paying more
Loss in Surplus: Consumers
buying less
Price
D
Po
Qo
P1
Q1

Minimum Amount Needed to
Supply Qo
Producer Surplus
Price
Quantity
Po
Qo
What is paid
Producer Surplus
S

Consumer and Producer Surplus
Price
Quantity
Po
Qo
S
Producer Surplus
Consumer
Surplus
D

Loss in Efficiency
Too High of Price (Price Floor)
Price
Quantity
Po
Qo
S
D
QL
New Consumer
Surplus
PH
New Producer
Surplus
Lost
Consumer
Surplus
Lost Producer Surplus
Deadweight Loss

New Producer
Surplus
New Consumer
Surplus
Loss in Efficiency
Too Low of Price (Price Ceiling)
Price
Quantity
Po
Qo
S
D
QL
PL
Lost
Consumer
Surplus
Lost Producer Surplus
Deadweight Loss

New Producer
Surplus
Tax
Revenues
New Consumer
Surplus
Loss in Efficiency
Taxation
Price
Quantity
Po
Qo
S
D
QL
PS
Lost Producer Surplus
PD
STax
Lost Consumer
Surplus Deadweight Loss
Tax
Size of Deadweight Loss
• The deadweight loss of the tax will depend upon two factors:
The size of the tax
The reduction in the quantity sold
• The reduction in the quantity sold will depend upon the elasticity of demand and supply
The more elastic demand or supply is the larger the deadweight loss will be
If either demand or supply is price inelastic then the deadweight loss will small and could be zero if perfectly inelastic (no change in the quantity sold and consumed)

Loss in Efficiency
Subsidy
Po
Qo
S
D
QH
PD
Subsidy Cost
PS SSub Subsidy
New Producer
Surplus
Gain in Producer Surplus
New
Consumer
Surplus
Gain in Consumer
Surplus
Price
Quantity
Deadweight Loss