principals as teachers: measures of quality &...
TRANSCRIPT

Principals as Teachers:
Measures of quality & distribution in the school leadership labor supply
By
Peter Trabert Goff
Dissertation
Submitted to the Faculty of the
Graduate School of Vanderbilt University
in partial fulfillment of the requirements
for the degree of
DOCTOR OF PHILOSOPHY
in
Leadership and Policy Studies
August, 2012
Nashville, Tennessee
Approved:
Professor Ellen Goldring, Chair
Professor Ronald Zimmer
Professor Matthew Springer
Professor Kathryn Anderson

To my closest family,
Micah, Eliana, Nathan
and
my beloved wife, Tiz
ii

ACKNOWLEDGMENTS
I would like to express my sincere gratitude to my advisor, Ellen Goldring. Without her support,
never-ending encouragement, patience and professional advice this work would not have been
possible.
I would also like to thank the faculty of the Leadership, Policy, & Organizations department,
especially Will Doyle and Dale Ballou for many helpful and inspiring conversations.
Finally my thanks go to my friends in the graduate program, in particular to Jonathan Stern and
Ryan Balch, with whom I spent oodles of time discussing the minutia of statistics and education
policy.
iii

CONTENTS
Page
ACKNOWLEDGMENTS . . . . . . . . . . . . . . . . . . . . . . . . . . . . . . . . . . . . . . iii
Chapter
I. INTRODUCTION . . . . . . . . . . . . . . . . . . . . . . . . . . . . . . . . . . . . . . . 1
II. RESEARCH FRAMEWORK . . . . . . . . . . . . . . . . . . . . . . . . . . . . . . . . . 6
II.1 The Big Picture: Leadership Selection . . . . . . . . . . . . . . . . . . . . . . . . . 6II.2 Principal Effectiveness . . . . . . . . . . . . . . . . . . . . . . . . . . . . . . . . . 7II.3 Learning-Centered Leadership . . . . . . . . . . . . . . . . . . . . . . . . . . . . . 8II.4 Organizational Effectiveness . . . . . . . . . . . . . . . . . . . . . . . . . . . . . . 11
III. SCHOOL LEADERSHIP LABOR MARKETS. . . . . . . . . . . . . . . . . . . . . . . 15
III.1 Gender . . . . . . . . . . . . . . . . . . . . . . . . . . . . . . . . . . . . . . . . . . 16III.2 Compensation . . . . . . . . . . . . . . . . . . . . . . . . . . . . . . . . . . . . . . 16III.3 Experience . . . . . . . . . . . . . . . . . . . . . . . . . . . . . . . . . . . . . . . . 18III.4 Leadership Mobility . . . . . . . . . . . . . . . . . . . . . . . . . . . . . . . . . . . 19III.5 Geography . . . . . . . . . . . . . . . . . . . . . . . . . . . . . . . . . . . . . . . . 21
IV. DATA . . . . . . . . . . . . . . . . . . . . . . . . . . . . . . . . . . . . . . . . . . . . . . 24
IV.1 Sample . . . . . . . . . . . . . . . . . . . . . . . . . . . . . . . . . . . . . . . . . . 24IV.2 Becoming a School Leader . . . . . . . . . . . . . . . . . . . . . . . . . . . . . . . 24
V. MEASURES . . . . . . . . . . . . . . . . . . . . . . . . . . . . . . . . . . . . . . . . . . 29
V.1 Teacher Effectiveness . . . . . . . . . . . . . . . . . . . . . . . . . . . . . . . . . . 29V.2 School Value-Added . . . . . . . . . . . . . . . . . . . . . . . . . . . . . . . . . . . 33V.3 Control Variables. . . . . . . . . . . . . . . . . . . . . . . . . . . . . . . . . . . . . 34
VI. METHODS . . . . . . . . . . . . . . . . . . . . . . . . . . . . . . . . . . . . . . . . . . . 36
VI.1 Identification Strategy . . . . . . . . . . . . . . . . . . . . . . . . . . . . . . . . . . 36VI.2 Analytical Models . . . . . . . . . . . . . . . . . . . . . . . . . . . . . . . . . . . . 36VI.3 Missing and Erroneous Data . . . . . . . . . . . . . . . . . . . . . . . . . . . . . . 37
iv

VII. RESULTS . . . . . . . . . . . . . . . . . . . . . . . . . . . . . . . . . . . . . . . . . . . . 39
VII.1 Measures of Quality . . . . . . . . . . . . . . . . . . . . . . . . . . . . . . . . . . . 45VII.2 Distribution of School Leadership . . . . . . . . . . . . . . . . . . . . . . . . . . . 52VII.3 Limitations . . . . . . . . . . . . . . . . . . . . . . . . . . . . . . . . . . . . . . . . 56
VIII. DISCUSSION . . . . . . . . . . . . . . . . . . . . . . . . . . . . . . . . . . . . . . . . . 59
IX. APPENDIX . . . . . . . . . . . . . . . . . . . . . . . . . . . . . . . . . . . . . . . . . . . 67
BIBLIOGRAPHY. . . . . . . . . . . . . . . . . . . . . . . . . . . . . . . . . . . . . . . . . . . 81
v

LIST OF FIGURES
VII.1 Gender Differences . . . . . . . . . . . . . . . . . . . . . . . . . . . . . . . . . . 40
VII.2 Classroom Roles . . . . . . . . . . . . . . . . . . . . . . . . . . . . . . . . . . . 41
VII.3 Leadership Roles . . . . . . . . . . . . . . . . . . . . . . . . . . . . . . . . . . . 42
VII.4 Context Comparisons . . . . . . . . . . . . . . . . . . . . . . . . . . . . . . . . . 43
VII.5 Predicted Probability of Leadership Matriculation and School Value-Added . . . . 47
VII.6 Predicted Probability of Leadership Matriculation and Teacher Value-Added . . . . 50
VII.7 Predicted Probability of Matriculation and Teacher Value-Added . . . . . . . . . . 52
vi

LIST OF TABLES
IV.1 Counts of Teachers and Schools with Value-Added Scores . . . . . . . . . . . . . 25
IV.2 Counts of Teachers and New Administrators with Value-Added Scores . . . . . . . 27
VII.1 School Quality & Leadership Matriculation . . . . . . . . . . . . . . . . . . . . . 45
VII.2 Instructional Quality & Leadership Matriculation . . . . . . . . . . . . . . . . . . 49
VII.3 School Quality & Leadership Distribution . . . . . . . . . . . . . . . . . . . . . . 54
VII.4 Instructional Quality & Leadership Distribution . . . . . . . . . . . . . . . . . . . 55
IX.1 Descriptive Statistics . . . . . . . . . . . . . . . . . . . . . . . . . . . . . . . . . 67
IX.2 Cross-correlation table . . . . . . . . . . . . . . . . . . . . . . . . . . . . . . . . 68
IX.3 Comparison among teachers with and without Administrative Licenses . . . . . . 69
IX.4 Instructional Quality & Leadership Matriculation:Robustness Checks . . . . . . . 70
vii

CHAPTER I
INTRODUCTION
Throughout the 20th century some critics questioned whether school leadership had produced
a substantive impact on student outcomes (Meindl, 1998). Compelling empirical evidence that
leadership impacts student outcomes is in short supply, yet over the last several decades pub-
lic and professional sentiment supporting school leadership has remained strong. Methodological
shortcomings notwithstanding, findings that high quality school leadership has significant, positive
influence have been recurrent across a variety of leadership definitions, schooling contexts, ana-
lytical models, and outcome measures (Leithwood, Harris, & Hopkins, 2008; Louis, Leithwood,
Wahlstrom, Anderson, Michlin, Mascall, Gordon, Strauss, Thomas, & Moore, 2010; Robinson,
Lloyd, & Rowe, 2008; Supovitz, Sirinides, & May, 2010).
Research investigating leadership has accelerated in recent years, in part owing to the consen-
sus that school leadership is critically linked to student outcomes, but also to a surge in the data
available to conduct such research. Much of this research focuses on questions of leadership (a)
preparation, (b) development, (c) leadership effectiveness, and, (d) labor market issues. By a sub-
stantial margin the strands of school leadership dominating the research landscape have pertained
to leadership preparation and measures of effectiveness. This focus on preparation and measures
can be contrasted with conventional approaches in other domains of leadership studies, which tend
to place a premium on labor market perspectives such as selection, distribution, and compensation.
Nonetheless, school leadership research surrounding the compensation (Cullen & Mazzeo, 2010),
distribution (Loeb, Kalogrides, & Horng, 2010), mobility (Battle & Gruber, 2010), recruitment
(Stark-Price, Munoz, Winter, & Petrosko, 2006), promotion (Gates, Ringel, & Santibanez, 2003),
certification (Papa Jr, Lankford, & Wyckoff, 2002), and attrition (Miller, 2010) of administrators
(i.e. principals, vice-principals, or assistant principals) has proliferated in recent years.
1

Although growing, this research base on educational leadership labor markets is small, our
understanding of labor dynamics is limited, and much of our knowledge is concentrated on the
post-hire leadership labor market. As it stands we know little about school leaders before they
took up their leadership position and less still about how they compare other teachers who chose
not to enter school leadership.
While the influential role of leadership on student outcomes may constitute adequate motiva-
tion to better understand the nuances of the leadership labor supply, a shrinking pool of qualified
administrative applicants provides an additional layer of importance and urgency to this line of
research. The number of certified individuals remains quite high and yet district officials have ex-
pressed that too few individuals apply for positions that are becoming increasingly vacated and the
quality of these applicants is a subject of concern (Neudecker, 2007; Pijanowski, Hewitt, & Brady,
2009; Roza, Celio, Harvey, & Wishon, 2003; Education Research Service, 2000; Whitaker, 2003;
Winter & Morgenthal, 2002). In addition to concerns of labor supply, asymmetric distributions
of human resources in schools may be exacerbating an already large academic achievement gap
(Haycock & Jerald, 2001; Murphy, 2010; Rothstein, 2004). Given the connections between school
leadership and student learning, a thorough understanding of how new school leaders are sorted
and distributed is a key question in the education labor market.
An additional consideration motivating an inquiry into educational leadership labor supply
stems from work conducted on the labor supply of school teachers. Understanding the seminal
role of teachers on student learning, many researchers have sought to contrast the characteristics,
qualifications, and aptitudes of individuals who move into teaching as compared to their peers who
pursue other career paths (e.g., Wise, Darling-Hammond, Berry, Berliner et al., 1987). Building off
this research later work linked these pre-teaching characteristics, qualifications, and aptitudes to
measures of teaching quality (e.g. Ballou, 1996; D’Agostino & Powers, 2009) and distribution (e.g.
2

Clotfelter, Ladd, & Vigdor, 2005). Lastly, highly effective teachers are a prized resource within the
education system. Knowing whether these teachers disproportionately exit the classroom to pursue
leadership positions is a key concern when considering questions of human resource management
within and among districts.
A first step in examining the supply and distribution of school leaders is to link the research
on effective leadership with the characteristics and experiences of individuals who are most likely
to become leaders: school teachers. The research on school leadership suggests that there are spe-
cific skills, knowledge, and behaviors that differentiate highly effective from ineffective principals.
Many of these behaviors center around instructional matters. Given the positive emphasis school
leaders place on their prior experiences as teachers (Fiore & Curtin, 1997), we may expect the
quality of these experiences to play a role in the shaping subsequent leadership behaviors.
Examining the literature on effective teaching, effective schools, and effective leadership, two
aspects of the pre-leadership experience appear to have the most promise of predicting subse-
quent leadership effectiveness: those experiences in the classroom and those within the school. In
the classroom, teachers develop their pedagogical knowledge, refine their communication skills,
deepen their understanding of the psycho-social dynamic of teaching and learning, while deliver-
ing content, providing feedback, and interpreting results. Although not exhaustive of all that is
learned throughout the teaching experience, the preceding list captures several of the skills gained
in the classroom that add to a teacher’s instructional capacity. Of the many conceptualizations of
leadership, learning-centered leadership has shown the strongest ties to student outcomes (Robin-
son et al., 2008). This mode of school leadership is defined by the behaviors principals undertake
as they support teaching and learning (Hallinger, 2010b). It is a reasonable conjecture that the
above competencies acquired as a classroom teacher may later inform a principal’s capacity to
understand, implement, and support learning-centered leadership practices.
3

The second aspect of pre-leadership experience that may inform subsequent leadership prac-
tices concerns the school-wide environment in which the teaching took place. Recent work has
articulated the principal’s role in shaping and maintaining the organizational context of the school.
Aspects of the organizational context within the principal’s realm of influence include cultivat-
ing professional community, promoting normative behaviors for students and staff that promote
learning, developing links with parents and community, maintaining facilities, and ensuring a safe
school environment (Bryk, Sebring, Allensworth, Luppescu, & Easton, 2010; Grissom & Loeb,
2009). Here we may expect that teachers with experience in highly effective schools may be more
likely to reproduce and support such organizational qualities in their role as school leaders.
Motivated by a need to better understand the school leadership pipeline coupled with the po-
tential importance of leaders’ prior experiences in highly effective schools or as a highly effective
instructor, I ask the following research questions:
1. To what extent is school quality related to a teacher’s movement into a leadership position?
2. To what extent is instructional quality related to a teacher’s movement into a leadership
position?
3. Do highly effective teachers, or teachers from highly effective schools, tend to move to
leadership positions in high status schools, or do these teachers move to schools most in
need?
For the purpose of this research I define school leadership to be principals or assistant princi-
pals. This research is organized into 8 sections. In section 2, I outline a framework describing why
measures of individual instructional effectiveness as well as prior experience in effective schools
may be promising measures with which to predict subsequent application and placement in leader-
ship positions. Section 3 provides an overview of the existing knowledge of labor dynamics within
school administration, highlighting the measures and methods of interest to this line of research.
The variables central to this inquiry are operationalized in section 4. A summary of the data are
4

outlined in section 5. Section 6 identifies the value-added modeling approach, including prior use
in research and limitations; section 6 also outlines the analytical models used to address each of
the research questions. Section 7 presents the descriptive and analytical results. A discussion of
the results is outlined in section 8 and the paper concludes with the implications for future work.
5

CHAPTER II
RESEARCH FRAMEWORK
II.1 The Big Picture: Leadership Selection
This line of research is a subsection of the broader picture regarding leadership selection in educa-
tion. In the business world identifying the right candidate for the position is well established as a,
if not the, critical leadership decision (e.g., Smart & Street, 2008). In contrast, the education world
has focused extensively on post-selection elements such as leadership preparation, leadership stan-
dards, and leadership development. Perhaps this focus is a result of the union mentality of teaching,
where differentiation among teachers is discouraged and a teacher’s seniority and education tend
to be their defining characteristics. With such a perspective, all teachers with comparable educa-
tion and experience would be equally able as a school leader. Selection would then be cursory and
based on credentials while the primary investment in leadership capacity would be directed towards
a training and support program. Indeed, the only state mandates for matriculation into school lead-
ership are those that identify a minimum number of years of experience as a teacher and those that
require school leaders to hold a masters degree (Zimmerman, 2002). Regardless of the underly-
ing rationale, there is no empirical research to justify either seniority or education gateway policies.
The nation’s largest professional organizations specializing in school leadership, such as the
American Association of School Administrators, the National Association of Elementary School
Principals, the National Association of Secondary School Principals, the University Council for
Educational Administration, and the National Council of Professors of Educational Administra-
tion, have endorsed the Interstate School Leaders Licensure Consortium (ISLLC) standards, yet
provide no guidance to identify the critical characteristics or experiences of teachers that districts
may use to guide their recruitment policies. This is not to imply that selection is perceived as unim-
portant. The American Association of School Administrators has noted that leadership preparation
6

programs that continue to focus on admission rather than selection procedures will have a dele-
terious effect on the quality of school leaders and the field as a whole. It is not uncommon for
literature on leadership preparation to speak to the centrality of selection and to lament the current
ad-hoc nature of many selection processes (e.g., Browne-Ferrigno & Muth, 2009; Murphy, 1992).
However there is very little systematic knowledge regarding the prevalence of various selection
criteria for leadership preparation programs and still less highlighting how schools choose among
various leadership applicants, especially when schools are considering inexperienced leadership
candidates.
In a study of 200 superintendents Rammer (2007) reported that 56.2% of respondents indi-
cated that they did not have “any systematic, intentional, or purposeful means (p. 74) of determin-
ing whether applicants possessed any of the ideal attributes when hiring principals. Critics have
maligned leadership selection within education as being “anecdotal” and “atheoretical” (Hooker,
2000). The need for theoretically and empirically grounded selection criteria is not a new phe-
nomenon. Citing Culbertson & Farquhar (1970), Murphy (1992, p. 80) notes that “over the last
50 years, ‘the predominant [recruitment] methodologies still consist of chance encounters with
potential candidates, randomly distributed bulk-mail brochures, and self-recruitment by prospec-
tive students.”’ Given these repeated messages of poor selection mechanisms over the last several
decades coupled with an urgency to produce highly effective school leaders, we should expect a
more nuanced and thoughtful set of criteria by which schools can use to select new leaders.
II.2 Principal Effectiveness
Many states have mandated a minimum number of years of teaching experience before one is el-
igible to move into a leadership position. These requirements, ranging from 0-5 years, have no
apparent empirical foundation linking the years of teaching experience to subsequent leadership
effectiveness. Some evidence suggests that principal’s years of experience as a teacher is often
unrelated to leadership outcome measures (e.g. Goff, Goldring, & Bickman, 2012; Shen, Leslie,
7

Spybrook, & Ma, 2012); such findings may be a result of subsequent leadership experience dom-
inating any variance explained by prior teaching experience. It may be the case that the duration
of teaching experience may have a greater impact on leadership for new leaders. More likely how-
ever, the relevant question is not how long a principal taught, but rather, how well they taught.
The logic supporting this research is simple: the quality of a school leader’s experience as a
teacher may influence their effectiveness as a school leader. Presumably, not all prior teaching
experiences are equal in this regard – some are undoubtedly more influential and others are less
so. To illustrate the ways in which the teaching experience may influence subsequent leadership,
I first examine the literature on effective leadership. This body of research presents a compelling
foundation for two main channels by which principals can impact student outcomes: learning-
centered leadership and organizational effectiveness. Assuming that principals exert the majority
of their influence through these two channels, I argue that the two most likely determinants of
leadership quality may be found in a teacher’s instructional ability and the overall quality of the
school in which they taught.
II.3 Learning-Centered Leadership
Conceptually compelling arguments have been crafted for a multitude of leadership behaviors
(e.g. transformational, distributed, situational, etc.). Of the various conceptions of leadership,
learning-centered leadership has encountered repeated popular and empirical support. This model
of leadership, which shares much common ground with instructional leadership and instructional
management, is characterized by principals who focus on cultivating teachers’ opportunities to im-
prove their instruction and student learning (Goldring, Porter, Murphy, Elliott, & Cravens, 2009).
Learning-centered leadership is characterized by “strong, directive leadership focused on curricu-
lum and instruction from the principal” (Hallinger, 2003, p.329).
Evidence in favor of learning-centered leadership spans several decades (Hallinger, 2010b).
8

A meta-analysis by Robinson, Lloyd, & Rowe (2008) evaluates 22 of 27 studies that link lead-
ership to student outcomes. The authors conclude that instructionally focused leadership has a
substantially greater impact on student outcomes – over three fold – than does transformational
leadership. Other studies have also found that leadership focused intently upon supporting teach-
ing and learning leads to improved student outcomes (Blase, 2004; Hallinger, 2005; Halverson,
Prichett, & Watson, 2007).
Hallinger & Murphy (1985) articulate eleven job functions that are characteristic of school
leaders who work to support teaching and learning. Of particular relevance here are: supervis-
ing and evaluating instruction; coordinating curriculum; monitoring student progress; protecting
instructional time; providing incentives for teachers; and providing incentives for students. In
their taxonomy of behaviors for learning-centered leadership Goldring et al. (2009) identify six
core components of learning-centered leadership: high standards for student learning; rigorous
curricula; quality instruction; culture of learning and professional behavior; connections to exter-
nal communities; and systemic performance accountability. These attributes of learning-centered
leadership closely mirror several key characteristics of effective teaching.
Research on the characteristics of effective teaching by Charlotte Danielson has found that the
ways teachers engage planning and preparation, the classroom environment, instruction, and pro-
fessional responsibilities are among the key elements of effective instruction (Danielson, 2007).
These characteristics are reiterated in much of the research on effective teaching, including work
by Marzano (2009; 2007), Howes and Pianta, (2011), and Stronge (2007). According to Danielson,
planning and preparation identifies how a teacher designs instruction and consists of: knowledge
of content and pedagogy, knowledge of the students, selection of instructional goals, knowledge of
resources, design of coherent instruction, and assessment of student learning. Characteristics of the
classroom environment captures non-instructional elements of effective teachers, such as the re-
spect and rapport among the students and with the teacher, a culture for learning, the management
9

of classroom procedures and student behavior, and the organization of the physical space. The in-
struction component entails clear and accurate communication, the use of questioning and discus-
sion techniques, engaging students in learning, providing feedback to students, and demonstrating
flexibility and responsiveness. Reflection on teaching, maintaining accurate records, communicat-
ing with families, contributing to the school and district, growing and developing professionally,
and showing professionalism comprise the final domain of professional responsibilities (Daniel-
son, 2007).
I contend that the exemplary learning-centered leadership behaviors explicated previously are
strengthened by a principal’s experience in the classroom and, further, that teachers who have re-
peatedly demonstrated superior instructional quality may be better able to execute these leadership
functions effectively. Often, these connections between high-quality teaching and high-quality
learning-centered leadership are intuitive and straight-forward. For example, Murphy et al. (2007)
stress principals’ knowledge of and involvement with the curricular program. Danielson (2007)
stresses teachers’ knowledge of content and pedagogy as well as the design of coherent instruc-
tion. This leads one to believe that teachers who know the content, know how to teach the content,
and know how to meaningfully order and structure the content delivery may use those same skills
as a school leader to facilitate discussions and critiques of meaningful and developmentally appro-
priate curriculum within their school.
The supervision and evaluation of instruction is a task that often takes place in the classroom,
in real time (Acheson & Gall, 1987). Even when supplied with rubrics and training, those princi-
pals who themselves were exceptional teachers may be better able to interpret the student-teacher
dynamic and provide the teachers with meaningful feedback. Their ability to meaningfully iden-
tify the essential areas for instructional improvement may also help teachers be more receptive to
critical feedback. Effective coordination of curricula and monitoring of student progress both rely
on an understanding of teaching and learning. While a technical understanding of learning theory
10

is needed when undertaking these tasks, meaningful experiences grappling with the challenges of
pacing or engaging students of differing learning styles may provide a richer appreciation for the
subtle details of coordinating curricula or monitoring student progress. A similar logic follows the
development and implementation of incentives for teachers and students. Teachers who demon-
strated superior instructional skills may be better equipped to design incentives for both teachers
(since they were likely familiar with incentives that facilitate exceptional instruction, as in Ames &
Ames (1984)) and students (since exceptional teachers likely used multiple approaches to motivate
student learning, as in Frome, Lasater, Cooney, & Board (2005)).
Lastly, some have argued that school leaders’ impact on students operates by improving the
instructional capacity of teachers in their school (Hallinger, 2010a; Leithwood & Mascall, 2008).
In short, good school leaders help their faculty become better teachers. While there are notable
differences between facilitating the development of adolescents and facilitating the professional
growth of adults, there is substantial overlap in these domains as well. Teachers promote growth
in their students through a combination of trust, communication, monitoring, and feedback. These
are the among same skills that Blase and Kirby (2008) have identified effective principals using to
nurture the instructional capabilities of their staff.
The first and second research questions of this study aim to identify experiences or character-
istics of teachers that may predict their matriculation into school leadership. To be meaningful for
policy, these factors should have also relate to subsequent leadership ability. Therefore, the first
research question seeks to use instructional quality as a predictor of a teacher’s propensity to enter
school leadership.
II.4 Organizational Effectiveness
While evidence for learning-centered leadership has been growing steadily for decades, empirical
support for leadership directed towards the organizational aspects of schools has been compara-
11

tively recent. Nevertheless, the evidence in favor of leadership behaviors directed towards orga-
nizational aspects of schooling have been shown to have a positive impact on student outcomes.
These organizational factors include cultivating professional community, promoting normative be-
haviors for students and staff that promote learning, developing links with parents and community,
maintaining facilities, and ensuring a safe school environment (Bryk et al., 2010; Grissom & Loeb,
2009).
Grissom & Loeb (2009) use multi-source data from 283 schools in Miami-Dade County Florida
to explore aspects of principal behaviors. Principals, vice-principals, and parents were surveyed
and schools were later linked to value-added measures. The authors find that principals leading
schools that demonstrate exceptional organization management (e.g. managing facilities, budgets,
and resources; developing a safe school environment) have a significant relationship to improv-
ing student achievement (Grissom & Loeb, 2009). The research is exploratory and the results are
strictly correlational, yet the findings suggest that the school context as a whole plays a role in
promoting student achievement. A separate analysis from this data report portray a similar rela-
tionship between leadership and organizational supports (Horng, Klasik, & Loeb, 2010).
In an exhaustive review of the literature on effective leadership Louis, Leithwood, Wahlstrom,
Anderson, Michlin, Mascall, Gordon, Strauss, Thomas, & Moore (2010) note that the organiza-
tional importance of school leadership is well documented throughout the leadership literature,
citing examples from Hallinger and Heck (1999) who emphasize “structures and social systems,”
Conger and Kanungo who stress “context changing strategies” and Robinson et al. (2008) who
continually underscore the importance of leadership in shaping organizational supports. The au-
thors classify these organizational elements as the building collaborative cultures, restructuring
the organization to support collaboration, building productive relationships with families and com-
munities, and connecting the school to the wider community. Each of these elements impacts
achievement within the classroom by strengthening connections between classrooms as well as
12

between classrooms and the school community.
A longitudinal study of Chicago Public Schools Bryk et al. (2010) identifies 100 schools that
substantially improved student outcomes and 100 schools that declined or stagnated over that
same period. The authors identify five organizational supports associated with improving stu-
dent achievement: parent involvement, work orientation, safety and order, curriculum alignment,
and school leadership (Bryk et al., 2010). Upon identifying these organizational supports as char-
acteristic of rising student achievement, the authors then provide evidence that these supports are
not free functioning, independent aspects of successful schools; rather each of the five supports is
crucial and leadership drives change in the other domains Bryk et al. (2010).
The implications of the research on organizational effectiveness suggests that schools that sig-
nificantly improve student outcomes do so through school-wide changes that impact the daily
behaviors and professional culture of teachers in the school, and the catalyst for this change begins
with the principal. Further, teachers in schools that improve student outcomes are not only exposed
to the organizational mechanisms of school-wide change, they – as a collective faculty – are active
participants in the change process. A second implication of these findings is that teachers in these
schools have the opportunity to observe and experience, at least in part, how school leadership
successfully engages and maintains organizational change.
The evidence above provides conceptual links between the research on teacher and school
quality to research on effective leadership behaviors. These links suggest the importance of using
teacher and school-level measures of quality within leadership supply analyses. The consideration
of additional factors, such as wage differentials or gender, are required in order to identify unbiased
estimates of these quality measures on the matriculation into leadership, as well as subsequent
distribution. The next section provides a survey of the existing literature on principal labor markets,
identifying the central factors and methodological considerations pertinent to the proposed research
13

questions.
14

CHAPTER III
SCHOOL LEADERSHIP LABOR MARKETS
The questions guiding this research seek to make comparisons between those teachers move
into school leadership and and those who do not. Much of the research on principal labor markets
makes comparisons between existing administrators, comparing factors such as gender, pay, and
retention. Few studies, however, are able to stretch back in time to compare teachers who went on
to become school leaders with those who stayed in the classroom. Literature on leadership mo-
bility, for example, may be enriched by knowing whether teacher mobility is related to leadership
mobility. Likewise, this research links teachers to student outcomes over time and then follows
teachers as they move into leadership positions. The literature reviewed here is based predomi-
nantly on comparisons between school leaders; the factors identified within this body of research
are used to guide this study as I step back to examine comparisons among teachers (e.g., which
teachers move into leadership positions).
This research compares teachers through three related questions; the first and second will iden-
tify relationships between school and teacher quality measures (respectively) with a teacher’s like-
lihood to move from teaching to school leadership. The level of analysis for these first two ques-
tions is the individual teacher and comparisons are made among teachers. The third question will
identify relationships between teacher and school quality measures with the quality of the school
at which the individual becomes a school leader. The level of analysis for the third question is
the vacancy and comparisons are made among all newly hired school leaders filling those vacan-
cies. Prior research on educational labor markets has identified a number of factors that influence
employment decisions. Factors likely related to movement into administration are gender, com-
pensation as a teacher, compensation as an administrator, and experience; these factors as well
as prior administrative departures and geographic region are relevant to the distribution of new
15

administrators.
III.1 Gender
In the vast majority of cases – 99%, as of the 2007-08 Schools and Staffing Survey – principals be-
gan their career in education as classroom teachers (Fiore & Curtin, 1997). In one of the few studies
of principal labor markets that directly addresses teachers as the labor supply, Joy (1998) notes the
gender asymmetry between teachers and school leaders, pursuing the question of potential gender
bias within administrative hiring. Female teachers comprise 86% and 51% of elementary and high
schools, respectively (Joy, 1998). However, when one examines female representation of princi-
pals, these proportions drop to 22% and 25%, respectively. After estimating equations from both
the supply and demand perspectives, bivariate probit results suggest that substantial gender bias
may be at play within promotions into school leadership (Joy, 1998). In estimating the first stage
of the model, which uses labor supply characteristics to predict which teachers are likely to earn an
administrative masters degree, the author finds the gap between teacher and administrator salaries
to be the largest significant variable (by an order of magnitude), followed by the individual’s share
of the family income (Joy, 1998). Although Joy’s sample is cross-sectional, small (99 individu-
als moving into administration), and likely biased (as “administrator” includes subject department
heads as well as principals and vice-principals), this study provides a rare and informative glimpse
into the movement from the classroom to the school office. Given the significance of this finding,
gender will be included as a covariate in the analyses for the first two research questions pertaining
to movement into leadership.
III.2 Compensation
Typically, accepting a full-time leadership position requires assuming the additional responsibili-
ties of leadership and is accompanied by an increase in base salary. Lortie notes that the increasing
burdens of school leadership coupled with more oversight and less perceived job security (owing to
school closings and accountability plans) have outpaced the financial compensation in leadership
16

positions (Lortie, 2009). The teacher-principal salary difference may range from 10% to 30% of the
annual teacher salary (Brewer, 1996), with several factors impacting the teacher-administrator pay
gap. Since the administrative contract length is typically longer than that of classroom teachers,
differences in annual pay shrink when comparing monthly salaries. Elementary school principals
tend to earn less than their high school counterparts (Battle, 2009). Lastly, this salary gap may
be influenced by district pay schedules and the years of experience when one makes the transi-
tion to leadership. Urban districts typically have higher initial teacher salaries, however urban
salary schedules tend to plateau sooner and are frequently surpassed by their suburban neighbors
with increasing experience (Baugh & Stone, 1982; Player, 2009). Principal pay has typically been
lower in urban schools, although administrative salary in some urban districts have become quite
competitive in recent years (Papa Jr et al., 2002). In practice, an urban teacher early in their ca-
reer considering an urban administrative position would face smaller financial incentives than a
similar suburban teacher considering suburban administrative positions. This incentive difference,
however, would narrow and possibly reverse as the teachers gained experience and moved up the
career ladder. Brewer (1996) explores the motivating impact of this pay differential using a ten year
panel of new teacher hires from New York. He finds evidence that the magnitude of the teacher-
administrator salary difference does indeed motivate some teachers to transition into leadership
positions. He notes, however, that this effect is small and, contrary to Joy (1998), nearly exclusive
to males (Brewer, 1996).
Looking further at principal salaries, Billger (2007) regresses the usual suspects of salary cor-
relates (education, experience, gender, ethnicity, age, urban location indicators, per-pupil expendi-
tures, and students’ parental education) on principal earnings and interprets the residual to be an
indicator of principal quality. Billger’s key assumption that the labor market for educational leader-
ship is sufficiently efficient to identify and financially reward the best principals is far from certain.
The predicted quality indicator is then used to evaluate principal responsiveness to accountabil-
ity policies. Reporting results for both two-stage least squares estimation and quantile regression,
17

Billger finds mixed results. With findings of direct import to the line of research presented here,
Billger interprets a negative correlation between accountability and the best principals (most pos-
itive salary residual) to possibly indicate that more able principals are selecting or being assigned
to schools most in need of strong leadership. Ultimately, Billger concludes that, “[p]erhaps, like
many teachers, the best principals were not motivated by money, but by their ability to positively
affect students” (Billger, 2007, p. 106).
While the cross-sectional analysis from Billger yielded mixed results regarding relationships
between principal pay and outcomes, a forthcoming study by Cullen & Mazzeo (2010) uses seven-
teen years of longitudinal data in Texas and concludes that principals are not financially rewarded
for impacting student achievement until they accept a position at another institution. Here the
authors observe that principals who exceeded expectations at their last school (i.e. had positive
value-added scores) receive significantly higher salaries at their next job as compared with others
who fell short of expected student growth. To the extent that this finding generalizes beyond Texas,
the Cullen and Mazzeo study suggests that schools hire leaders based at least in part, on demon-
strable prior effectiveness. If prior effectiveness is a consideration for hiring established school
leaders then we may think that some other measure of prior effectiveness (perhaps as a teacher)
may be a consideration when hiring new leaders.
III.3 Experience
One of the more robust findings regarding teachers moving into administration pertains to the role
of experience. Many states require that teachers spend three to five years in the classroom before
moving into administration. While some teachers meet this minimum threshold and then move on,
the more common trend to is spend a decade or more as a teacher prior to moving exclusively into
a leadership role (Fiore & Curtin, 1997).
In a study examining principals in New York City, Papa et al. (2002) find that teachers are
18

moving into leadership positions later in their career, with the model age increasing from 43 in
1990 to 53 in 2000. An additional aspect of experience that has a direct bearing on this line of
research also stems from Papa et al., where they identify that teachers who enter administration
and move directly into a position as school principal do so at younger ages, have less teaching
experience, and come from more competitive undergraduate universities (2002). This leads the
authors to conclude that “more highly qualified individuals appear to progress to the principalship
more quickly” (Papa Jr et al., 2002, p. 11). Since the rapidity with which teachers move from the
classroom to leadership may be associated with quality measures, experience is a key variable to
be included when examining movement into administration.
In summary, gender, earnings (absolute and relative to anticipated leadership earnings), and
experience are likely to be associated with matriculation into school administration. The nature of
administrative departures and geography, discussed below, are needed to more fully understand the
choices teachers make when moving into their first leadership position.
III.4 Leadership Mobility
The research I pursue here is directed towards movement into school leadership. The research
on leadership departures becomes pertinent to this line of inquiry when the conditions surrounding
departure may influence conditions for the subsequent principal in that school. This relates directly
to my third research question, which investigates the distribution of new leaders. As I examine the
academic quality of schools at which a new leaders accept positions, factors that could influence
measures of school quality (including leadership departures) need to be included.
Research investigating school leadership mobility between schools has largely mirrored find-
ings on teacher mobility (Ebmeier & Hart, 1992; Hanushek, Kain, & Rivkin, 2004; Lankford,
Loeb, & Wyckoff, 2002), namely that school environment exerts a strong influence on leaders’ de-
cisions to change schools (Gates et al., 2003; Gates, Ringel, Santibanez, Guarino, Ghosh-Dastidar,
19

& Brown, 2006; Loeb et al., 2010; Papa Jr et al., 2002; Ringel, Gates, Chung, Brown, Ghosh-
Dastidar, & CA, 2004). In analyzing transfer patterns among principals in Miami-Dade County
Florida from 2003 – 2008, Loeb, Kalogrides, & Horng (2010) observe that the proportion of stu-
dents receiving free and reduced lunch is approximately 10% lower in the school principals trans-
fer to than the school they transferred from. Interestingly, the authors also note that when such
transfers occur they tend not to be associated with significant changes in the faculty composi-
tion (number of master’s degrees and teaching experience), signaling “that principals may not be
seeking out a more qualified group of teachers to lead when they transfer” (Loeb et al., 2010, p.
221). In an attempt to separate the demographics of the student body from correlated measures of
school context, such as parental involvement, safety, or limited resources, the authors find that the
inclusion of a school climate measure renders the significance of student demographics null in pre-
dicting principal mobility. It is possible that principals are moving in response to their knowledge
of schools that present a context where leadership has the greatest opportunity to positively impact
student outcomes. However, it is also possible that the faculty perceptions of school climate is arti-
ficially inflated upon the arrival of a new principal and/or artificially deflated prior to a principal’s
departure. It is also difficult to interpret this finding given that managing the school culture is a
goal of school leadership; the Loeb, Kalogrides, & Horng (2010) finding may be evidence that the
principals whose behavior is detrimental to the school climate are more likely to leave.
A similar methodological problem is encountered in a recent study by Miller (2010), which
shows that principal departures are more likely to occur following a decline in student achievement.
Here again we cannot know whether the principal’s anticipation of leaving caused achievement to
fall or whether the falling achievement caused the principal to leave (as the author concedes).
Interestingly, Miller finds evidence of this decline, an “Ashenfelter dip,” spanning into the new
principal’s tenure. The author reports that the dip, which begins up to four years prior to the tran-
sition, continues for two years after the appointment of the new principal before scores begin to
climb again, returning to pre-transition levels within four years. These findings suggest that there
20

may be a four to eight year cycle of changing student achievement accompanying principal mobil-
ity. Unfortunately, the available data prevent Miller from controlling for the context surrounding
the vacancy – firing, lateral voluntary transition, retirement, or promotion; or whether the transition
occurred mid-year or over the summer. The way in which leadership successions are handled can
have long-lasting implications for subsequent principal, faculty, and student success. “Creating
and protecting substantial support systems for new principals that can pass on, share, and develop
the essential inbound knowledge of incoming leadership” claim Fink & Brayman ”seems to us to
be a ... paramount priority of educational leadership reform” (2006, p. 85).
While succession planning may be a distant concern for most principals, finding a qualified
replacement is often a challenging process. As may be expected, districts and schools that may
be perceived as challenging work environments – typically poor or urban schools – have the most
difficulty filling positions with qualified applicants (Normore, 2004; Roza et al., 2003; Stark-Price
et al., 2006). While reporting this phenomenon, authors are careful to articulate that it is qualified
applicants which are lacking. The finding that the number of qualified teachers with administrative
certificates or licensure currently working within education far outstrips vacated positions appears
to be surprisingly robust across locations and methods. Much as Ingersoll & Perda found when
investigating claims of a teacher shortage 2009, the appearance of a limited supply of potential
administrators is not owning to a lack of a qualified individuals. Rather, the shortage in adminis-
tration could be interpreted to mean that qualified teachers do not perceive the additional demands
and rewards of leadership to exceed the demands and rewards of teaching. The question for those
examining the leadership labor market is then, how do the certified individuals who move into
leadership differ from those equally qualified individuals who do not apply?
III.5 Geography
The final consideration of the labor research comes directly from research on teachers, namely
their propensity to work close to home. Boyd, Lankford, Loeb, & Wyckoff (2005) compare the
21

hometown, college, and first teaching job locations for teachers in New York State. They find that
34% of new teachers accepted a job in their hometown and over 80% were within 40 miles of their
hometown. Additionally, the authors also find that teachers return to similar locals as their home
town: 88% of teachers growing up in an urban district find their first teaching position in an urban
district (Boyd et al., 2005). When considering how this finding may relate to school leaders, two
factors are worthy of consideration. First, teachers tend to move into school leadership after ten
or more years in the classroom. Substantial teacher attrition over the first several years is well
documented (Lankford et al., 2002; Loeb, Darling-Hammond, & Luczak, 2005); how Boyd et al.’s
finding holds among the remaining teachers who do not attrit is uncertain. The other unknown
aspect lies within the self-selection of teachers into school leadership. Those who have chosen
to stay in education and have subsequently chosen to pursue leadership could equally be among
the most or the least likely to stay close to home. Regardless, this line of research suggests that
geographic location is a parameter worthy of consideration when examining job preferences and
distribution within school leadership.
In summary, the literature provides direction regarding the key factors and findings that influ-
ence leadership labor decisions in education. Of the existing work on the leadership labor market,
the majority of studies compare administrators to administrators – where are they located, how
much are they paid, what are their qualifications, or how effective are they, as compared to their
peers. These studies capture the complexity of interactions as principals move within the labor
market. Although it is widely known that the school leadership labor market begins with class-
room teachers, few studies have rigorously explored how teachers who go on to become school
leaders compare to teachers who remain the classroom (or to those teachers who choose to leave
the classroom and education as a whole). Of these the studies that have linked principals to their
experience as a teacher, none have been able link student outcomes to teachers and subsequently
link these teachers to their movement into leadership. The research presented here builds upon a
solid and growing base of research by extending our line of sight down the labor supply chain,
22

looking inside of the classrooms of aspirant school leaders and comparing them to teachers who
do not move into leadership positions.
23

CHAPTER IV
DATA
IV.1 Sample
This research uses state-wide administrative and student achievement data from a mid-sized south-
eastern state from 2003-04 to 2010-11. The data combines administrative records with student-
level test data, allowing for links to be made from students to teachers, while also following
teachers as they move from the classroom into leadership positions. The state exam is a crite-
rion referenced multiple choice test measuring reading and language arts, mathematics, science,
and social studies knowledge of students in grades 3-8.
This data set is well suited to the research questions outlined above since: (a) the state data has
been a reliable source for multiple studies using value-added measures; (b) there is considerable
variation in the geographic location and organizational structure of school districts; (c) we have a
complete panel with a large number of hiring schools; (d) salary data are included and represent the
bulk of employee compensation; and (e) turnover and promotion are more likely to occur within
the schools and districts, rather than between states (Papa Jr et al., 2002).
IV.2 Becoming a School Leader
To become a school principal or assistant principal, the aspirant school leaders must first apply to
Local Educational Agencies (LEAs), which are typically collaborating colleges or universities that
have met the state requirements that allows them to deliver preparation courses and issue admin-
istrative certificates. Following an application to an LEA, aspiring leaders must then complete the
licensure program and apply for leadership positions.
24

As is common practice, the state requires that applicants to licensure programs hold a current
teaching license and have at least one year of “successful education working experience;” for the
majority of teachers this takes the form of traditional classroom instruction. Over the course of
our study the state requirements for administrative licensure were stable, however in 2009 the state
issued slight changes to the administrative certification requirements. The most substantial change
was that applicants are required to have taught for three years rather than one year. Since the ma-
jority of new leaders have taught for five or more years, this policy change is of small significance
to this study. The applicants are also required to document their ability to improve student achieve-
ment1. Preliminary licensure is given to those individuals who have a graduate degree, completed
the certification program with the Local Educational Agency, and pass the state leadership exam
(Praxis leadership exam, administered by ETS).
Table IV.1: Counts of Teachers and Schools with Value-Added Scores
School Value-Added Teacher Value-Added
Students Schools Teachers Students Teachers
no MA 2 year MA 3 year MA
2005 320,000 1,300 44,300 250,000 8,800
2006 320,000 1,300 44,500 270,000 8,600 6,400
2007 324,000 1,300 45,300 275,000 8,700 6,700 5,100
2008 329,000 1,300 45,800 277,000 8,700 6,800 5,500
2009 320,000 1,300 46,900 284,000 8,600 6,600 5,400
2010 311,000 1,300 46,600 290,000 8,400 6,600 5,500
Note: Each line shows the number of students used to calculate each VA measure as well as the numberof teachers and schools for whom a measure was calculated. MA indicates a Moving Average.
1There are no documented requirements surrounding the evidence of improving student achievement; this criteriais determined locally by the district and the LEA
25

Table IV.1 provides a perspective on the number students that were included in school value-
added and teacher value-added calculations (school value-added and teacher value-added serve as
proxies for school and teacher quality; see Measures section). Also shown in table IV.1 are counts
of the number of teachers for whom school and teacher value-added measures could be constructed.
The first line of table IV.1 can interpreted to show that in 2005, 320,000 students used to construct
school value-added measures for 1,300 schools and the 44,300 teachers teaching in those schools.
Also in 2005, 250,000 students were used to construct teacher value-added measures for 8,800
teachers. In 2006 is the first year that a 2-year moving average (MA) can be calculated for teacher
value-added, which drops the sample size from 8,600 to 6,400 because 2,200 of the 2006 teachers
do not have value-added data from the prior year (they were likely new teachers or taught in a
non-value-added subject such as k-3rd grade or art).
Records from 2004 were dropped as a lag year to calculate value-added scores; 2011 was used
only to identify those individuals from 2010 who moved into leadership positions. The student
sample used to calculate school value-added relies on student-school linkages and includes over
300,000 students each year. This represents approximately 80% of all tested students in grades 4-8
(3rd grade is also dropped as a baseline measure). The primary reason for the exclusion of 20%
of tested students is that they did not have or could not be linked to a prior test score. This school
value-added sample was used to calculate value-added measures for approximately 1,300 schools
and 45,000 teachers per year.
The process by which teachers claim students adds structural restrictions and also introduces
some error in the linking of students to teachers; thus teachers with individual value-added mea-
sures represent a sub-set of those teachers with school value-added measures. Table IV.1 shows the
number of students used in the calculation of teacher value-added measures as well as the num-
ber of teachers with teacher value-added measures each year. In an attempt to temper some of the
year-to-year variability in the individual value-added measures I have also constructed 2 and 3 year
26

moving averages (MA)2.
Table IV.2: Counts of Teachers and New Administrators with Value-Added Scores
School VA Teacher VA
2 year MA 3 year MA
Teachers New Teachers New Teachers New Teachers New
Admin Admin Admin Admin
2005 43,771 240 7,717 56
2006 44,422 230 7,666 43 5,868 33
2007 45,174 260 7,731 54 6,163 46 4,764 35
2008 45,928 263 7,940 48 6,369 39 5,148 30
2009 45,088 145 7,741 29 6,151 26 5,068 24
2010 47,293 162 7,962 33 6,462 30 5,315 28
total 271,676 1,300 46,757 263 31,013 174 20,295 117
Note: Each line shows the number of teachers in the sample as well as the number of teachers that becamenew school leaders in the subsequent year. MA indicates a Moving Average.
Table IV.2 displays the number of teachers who move into a school leadership position in the
subsequent year based on their value-added measure. Of the teachers with school value-added
measures, approximately 150-200 move from instructional to leadership positions each year. For
the teachers with individual value-added measures there are 30-50 teachers moving into school
leadership per year; this number declines with the two and three-year moving averages. The modal
number of yearly observations per teacher is three.
To address the first two research questions (pertaining to the quality measures and charac-
teristics of promoted teachers) this study makes comparisons between two samples of teachers:24 of 1,424 schools moved from the 90th percentile to the 10th percentile (or vice-versa) over the six year panel; 44
of 1,424 schools moved from the 75th percentile to the 25th percentile (or vice-versa). Thus the within-panel schoollevel value-added estimates appear fairly stable over time and no moving-averages were constructed.
27

all teachers and those teachers with administrative licenses. The “policy relevant” comparison
is among all current teachers. The logic here is that all teachers are potential candidates to be
recruited into a school leadership position. Examining comparisons in leadership matriculation
among all teachers will allow us to question the existing policies, norms, and patterns that facili-
tate movement from teaching to school leadership.
The “pipeline relevant” sample addresses current leadership pipeline concerns by examining
leadership matriculation among only those teachers certified or licensed in school administration.
This group consists of a self-selected group of individuals who have met the existing state require-
ments for school leadership outlined above. Examining comparisons in leadership matriculation
among licensed teachers will allow for a better understanding of selection from the existing pool
of immediately available potential school leaders. The “pipeline relevant” comparison group (li-
censed teachers) are a sub-set of the “policy relevant” comparison group (all teachers).
28

CHAPTER V
MEASURES
V.1 Teacher Effectiveness
Defining instructional or school quality can be challenging to articulate in manner that lends itself
to direct measurement. Goe (2007) differentiates between teaching quality, teacher quality, citing
Fenstermacher and Richardson (2005) to clarify:
Quality teaching could be understood as teaching that produces learning. In other
words, there can indeed be a task sense of teaching, but any assertion that such teaching
is quality teaching depends on students learning what the teacher is teaching. To keep
these ideas clearly sorted, we label this sense of teaching successful teaching. (p. 186)
Goe (2007) continues, articulating a framework for teacher quality that includes inputs, processes,
and outputs. Input measures include teacher qualifications, such as education, certification, and ex-
periences, as well as teacher characteristics, such as gender, race, or self-efficacy. Process measures
refer to teacher practices (teaching quality) and include classroom management, planning, and in-
structional delivery. In this framework, the outcome measures are teacher effectiveness, defined
to be the average gain in student outcomes, above and beyond any expected gains (Goe, 2007).
Teacher effectiveness is then a manifestation of teacher quality resulting from each teacher’s set of
qualifications, characteristics, and practices.
Research on teacher quality that establishes strong links between inputs and outcomes is sparse.
Findings on the impact of certification, preparation, undergraduate degree, advanced degree, Na-
tional Boards Certification, or quality of undergraduate university are typically small and vary
by sample and method (Goldhaber & Brewer, 1997; Glazerman, Mayer, & Decker, 2006; Boyd,
Grossman, Lankford, Loeb, & Wyckoff, 2006; Clotfelter, Ladd, & Vigdor, 2007; Goldhaber &
29

Anthony, 2007; Harris & Sass, 2009). The most consistent evidence suggests that teacher experi-
ence has positive effects on student achievement, however selection bias within schools, between
schools, and attrition bias presents a substantial challenge to this claim and evidence to the con-
trary does exist (Betts, Zau, & Rice, 2003). Research surrounding teacher characteristics such as
student-teacher racial matches shows some positive effects (Dee, 2004), while other research is
inconclusive (Ehrenberg, Goldhaber, & Brewer, 1995). Investigations regarding teacher character
traits, such as self-efficacy have not been able establish links to student learning (Goddard, Hoy, &
Hoy, 2000).
Some confusion has arisen around the use of student-outcomes as measures of teacher quality.
“A major source of confusion appears to be the circular nature of the line of argumentation that
attempts to define teacher effectiveness in terms of estimated teacher effects” (Kupermintz, 2002,
p. 229). Unlike a variable such as teacher preparation, which we may interpret as a causal factor
in raising student achievement, instructional quality cannot cause increases student achievement
– instructional quality is defined as increases in student achievement. The use of student gains
to define instructional quality is not problematic within the context of this research. The line of
inquiry pursued here is motivated by the prospect that high instructional quality or teachers from
high-quality schools may become high-quality school leaders. Under this approach, changes in
student outcomes are used to identify teachers of varying quality; differential matriculation into
leadership will be evaluated conditional upon this measure. While it is possible that being a high
value-added teacher does exert a causal effect on the propensity for leadership (if, for example,
a teacher’s skill is recognized by school or district leaders who then help pave the path towards
leadership), that particular causal claim is neither made nor evaluated through this line of research.
A notable limitation of this research is that value-added measures are only available for teachers
in tested subjects; special education, art, music, and even third grade teachers (because there is
no prior baseline) cannot be evaluated by this measure. And yet, if the results from this inquiry
prove promising subsequent research may explore the relationship between additional measures
30
of instructional quality (observations, National Boards Certification, etc.) and school leadership
matriculation.
The use of value-added estimates in defining teacher quality has been disturbing to some ed-
ucators who rightly point out that the contributions of excellent educators cannot be adequately
summarized by the change in a test score. This argument carries substantial weight since excellent
teachers strive to develop the student as a whole, focusing on emotional, social, as well as in-
tellectual growth. However a teacher who neglects academic achievement at the expense of other
domains cannot be rightly classified as an exceptional educator. This research presumes that the as-
pects of exceptional teachers that may reasonably make them exceptional instructional leaders are
those skills surrounding instruction and the cultivation of knowledge. Milanowski (2004) provides
some substance to this assertion as he found that, based on an evaluation of Ohio teachers con-
sisting of six observations and a portfolio analysis, “[t]he results also suggest that teacher [value-
added] scores may be useful as representations of teaching practices that affect student learning.”
Kane et al. (2010) also found that observational measures of high quality instruction corresponded
to teachers’ value-added estimates. Lastly there is reason to believe that high (or low) value-
added teachers can have a cumulative effect on children, impacting students subsequent academic
outcomes (Sanders & Rivers, 1996) and long-term economic productivity and social well-being
(Chetty, Friedman, & Rockoff, 2011; Rockoff, 2004)
The key variables in this line of research are the measures of school and instructional quality.
There are several challenges to quantifying these quality measures, such as establishing continuity
of the assessment over time, the determination of an appropriate baseline, and limiting measure-
ment error. The state exams are vertically aligned, criterion-referenced, and use item-response
theory to generate scale scores. Speaking to the continuity of the assessment over time, over the
course of the data panel a testing change resulted in a re-scaling of the exam. To accommodate
this change standardized scale scores were constructed by grade and year. This results in a slight
31

change in the interpretation of the scores, which now should be regarded as the child’s relative
position in the achievement distribution.
To address the second challenge of baseline selection, the fixed-effects models (shown below)
use lagged achievement when estimating current achievement, thereby measuring any change in
achievement relative to the prior year (Kane & Staiger, 2008). The teacher (or school) fixed-effects
provide each teacher (or school) with their own intercept where this intercept is then interpreted
to be the added effect of being in that particular classroom (or school) after controlling for prior
achievement. As McCaffery points out in Springer (2009), “Fixed-effect and mixed-model meth-
ods are highly correlated and disagree on just 10% of teachers ... Moreover, the differences between
these two methods are not persistent” (p. 142). In the model below I have also included squared
and cubic terms of lagged achievement to more accurately represent any non-linear relationships
in between lagged achievement and current achievement.
The third challenge pertains to measurement error in the achievement scores. At an extreme, if
lagged achievement were entirely stochastic we would expect the teacher fixed-effects to be pre-
dicting absolute achievement rather than growth and thus be severely conflated with students’ so-
cioeconomic status. Since value-added estimates are known to be fairly noisy measures (Guarino,
Reckase, Wooldridge, Haider, Bargagliotti, Dieterle, Stacy, & Smart, 2011), I use an instrumental
variables approach to mitigate a portion of the measurement error. In the first stage equation I
use the first, second, and third order polynomials of lagged reading and language arts, science,
and social studies scores as excluded instruments to predict lagged math scores. The logic of this
approach is that any measurement error that is unique to the math score will be uncorrelated with
the other scores. When the lagged math score is predicted using this first stage equation it will only
contain information common among all four assessments. By extension, any measurement error
that is also common to all assessments will not be expunged by this process (Angrist & Krueger,
2001).
32

The model used to estimate the teacher value-added estimates is as follows:
mathi j(t−1) = β0 +β1(rlai j(t−1))+β2(rlai j(t−1))2 +β3(rlai j(t−1))
3...+ µi jt
mathi jt = β0 +β1( mathi j(t−1))+β2( mathi j(t−1))2 +β3( mathi j(t−1))
3 +βg(gradei jt)+ µi jt
The equation above will model student i’s math score in year t as a function the student’s pre-
dicted math score in the prior year. The model was estimated separately for each of the six years
in the panel. The school or teacher associated with the student is indexed by the subscript j. To
further address year-to-year variability in teacher value-added measures, I have also calculated two
and three year moving averages. School value-added was substantially less volatile over time and
no moving averages were used. Not shown in the equations are a set of dummy variables for the
proportion of time a given teacher contributed to a students overall math instruction; this variable
accounts for time divided between teachers within or between schools.
It would be problematic if the teacher value-added measure were to be conflated with aspects
unrelated to instructional effectiveness that are also predictive of leadership matriculation. One
such example could be that a principal favors a teacher with additional resources (such as smaller
classes) that make a teacher more effective and concurrently taps this teacher for later leadership
roles. To address this possibility, class size has also been included in all teacher value-added
models.
V.2 School Value-Added
As Harris (2009) points out, value-added estimates are subject by multiple assumptions, many of
which are almost certainly not upheld within the current schooling paradigm. Some of these as-
sumptions include the random assignment of students, no differential student peer-effects, and no
differential teacher peer-effects. However, Harris also notes that many value-added models appear
to be robust to small or moderate deviations from these assumptions. In contrast to teacher value-
33

added models, school value-added models have received far less attention and rigorous study. This
is, in part, owing to two significant challenges encountered when one attempts to extrapolate the
teacher model into the school setting. First, the assumption that students are randomly assigned
to schools is far less tenable than for random assignment to teachers. Second, when estimating
teacher value-added the assumption that the teacher did not influence the students’ prior scores is
likely viable in the absence of strong student sorting or teacher peer effects. In contrast, a school
does (or at least should) play a role in students’ prior scores, especially when that student was in
that school during the prior year. If all students stayed in one school for grades k-8, we could inter-
pret school value-added to be a marginal value-added – the value-added controlling for a portion
of each schools’ prior value-added.
School value-added presents unique challenges, however as used in this context, it is a viable
measure. First, the above challenges have not prevented school value-added from being calculated
and used in a policy context. In this state, as in others, school value-added scores are publicly
available and tied to school improvement and accountability plans. Second, despite the flaws listed
above, school value-added measures provide a better alternative than using raw achievement. Un-
like raw achievement, school value-added attempts to control for a portion of prior achievement.
Lastly, non-random sorting of students into schools implies that school value-added may be con-
flated with non-academic influences such as SES, however the modeling approach used here in-
cludes raw achievement as a way for examining school value-added while controlling for a portion
of the bias in the measure. The school value-added measure used in this context provides an ap-
proximate measure of student growth within a school as compared to other schools.
V.3 Control Variables
The extant literature on teacher and principal labor markets provide insightful guidance regard-
ing the inclusion of additional variables that may also play a role in a teacher’s matriculation into
34

leadership. Chief among these variables are teacher gender (Joy, 1998) and compensation (Brewer,
1996). Experience is also a predictor of movement into leadership, however as a result of collective
bargaining agreements, salary schedules in education are highly correlated with experience. In this
data set, because years of experience is not available, I use base income as a proxy for experience.
Since salary schedules vary from district to district, I have created within district income quintile
dummy variables. These within district base income quintiles serve as controls for teachers’ years
of experience. Overall compensation is included as a continuous variable consisting of a teacher’s
teaching salary as well as any supplemental income from activities such as coaching or teaching
additional classes.1
Evidence suggests that school achievement and student demographic composition relate to both
teacher and principal mobility patterns; accordingly average school achievement in math and the
proportion of white and English language learner (ELL) students in a school are also included in
the analysis.
Descriptive statistics and a correlation table are shown in the Appendix (IX.1 and IX.2, respec-
tively). Table IX.3, also in the Appendix, parses descriptive statistics between the “policy relevant”
sample (all teachers) and the “pipeline relevant” sample (administratively licensed teachers).
1For ease of interpretation I have not used the natural log of income. This does not change the substantive orstatistical significance of my findings.
35

CHAPTER VI
METHODS
VI.1 Identification Strategy
The goal of this research is to determine if there is evidence that instructional or school quality is
associated with differential matriculation into leadership positions. To do this I make comparisons
among classroom teachers. Because all teachers are conceivably eligible to become school leaders
after one year of teaching experience, it is reasonable to include all teachers in the comparison
group1. Specifically, I have identified a teacher as an individual who had been assigned an instruc-
tional assignment code. These primarily include art, music, physical education, special education,
and classroom teachers. School leaders are individuals who held formal positions as principals or
assistant principals. A small number of individuals (primarily in rural districts) have split teach-
ing/administrative assignments; such individuals are identified as school leaders if more than half
their time is allocated to a leadership position. A new leader is defined as an individual who was a
teacher and later moved into a leadership position; such individuals are coded as 1 for all observa-
tions in their panel. There were no included instances of school leaders who later became full-time
teachers.
VI.2 Analytical Models
Research questions one and two, pertaining to differential movement into leadership, are addressed
using a probit model where moving into leadership is the dependent variable. The independent
variables are school and/or instructional quality, the percent of white students in the school, aver-
1Although teachers could move into leadership positions after one year, this is not the probable event. Insteadteachers tend to stay in the classroom for 5-10 years before moving into leadership. In results not shown, I have alsorun these models limiting the sample to only teachers in the 3rd, 4th, or 5th income quintile. This restricted samplegenerates results that are statistically and substantively congruent with the findings presented in the results section.
36
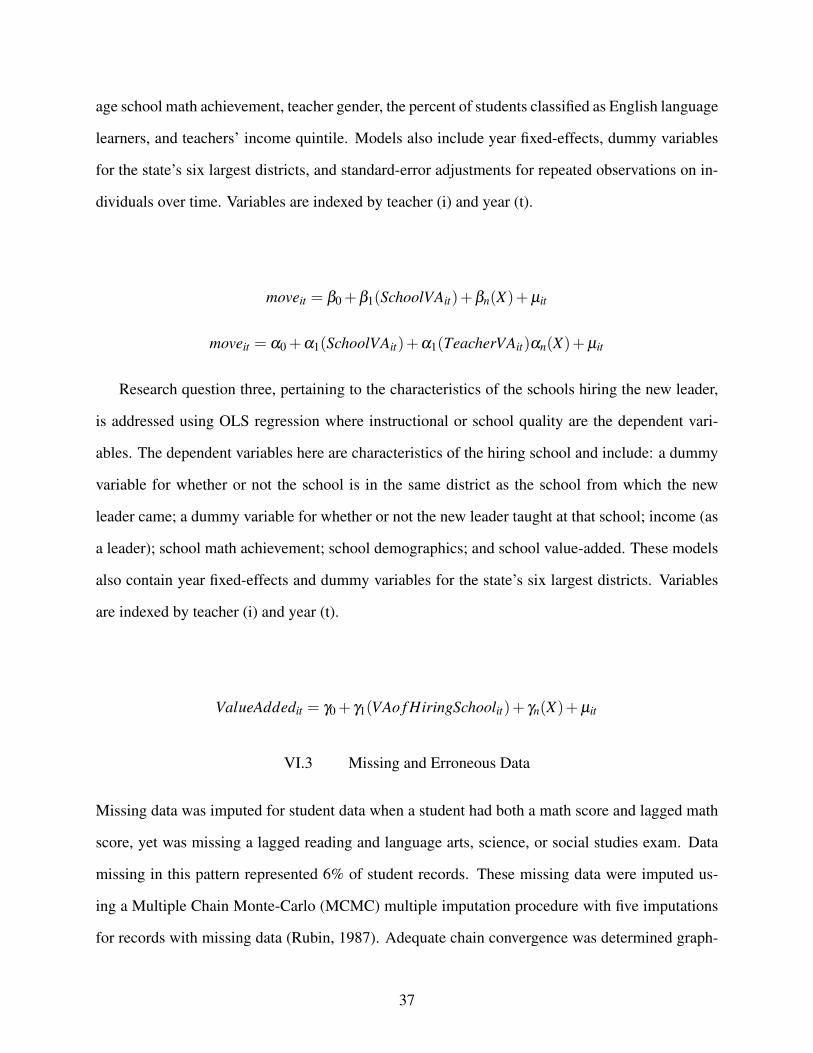
age school math achievement, teacher gender, the percent of students classified as English language
learners, and teachers’ income quintile. Models also include year fixed-effects, dummy variables
for the state’s six largest districts, and standard-error adjustments for repeated observations on in-
dividuals over time. Variables are indexed by teacher (i) and year (t).
moveit = β0 +β1(SchoolVAit)+βn(X)+ µit
moveit = α0 +α1(SchoolVAit)+α1(TeacherVAit)αn(X)+ µit
Research question three, pertaining to the characteristics of the schools hiring the new leader,
is addressed using OLS regression where instructional or school quality are the dependent vari-
ables. The dependent variables here are characteristics of the hiring school and include: a dummy
variable for whether or not the school is in the same district as the school from which the new
leader came; a dummy variable for whether or not the new leader taught at that school; income (as
a leader); school math achievement; school demographics; and school value-added. These models
also contain year fixed-effects and dummy variables for the state’s six largest districts. Variables
are indexed by teacher (i) and year (t).
ValueAddedit = γ0 + γ1(VAo f HiringSchoolit)+ γn(X)+ µit
VI.3 Missing and Erroneous Data
Missing data was imputed for student data when a student had both a math score and lagged math
score, yet was missing a lagged reading and language arts, science, or social studies exam. Data
missing in this pattern represented 6% of student records. These missing data were imputed us-
ing a Multiple Chain Monte-Carlo (MCMC) multiple imputation procedure with five imputations
for records with missing data (Rubin, 1987). Adequate chain convergence was determined graph-
37

ically (Brooks & Gelman, 1998) and confirmed using the Gelman-Rubin diagnostic (Gelman &
Rubin, 1992). Autocorrelation was determined graphically and the thinning interval was adjusted
accordingly.
Administrative records had very few records with missing data, however there were some in-
stances when data appeared to be inconsistent. For example, at times teacher gender would change
for one year; in such situations the gender was replaced with the modal gender for all observa-
tions of that individual across the panel. Such changes were made in less than 1% of administra-
tive records. Teachers that retired at any point during the span of this data were removed from
the analysis on the assumption that teachers approaching retirement are not candidates for school
leadership although 41 of 3,106 of these records represented teachers with administrative licenses.
38

CHAPTER VII
RESULTS
This line of research is motivated by a need to better understand the labor supply of school
leaders. Towards that end, I first present a descriptive overview comparing those entering school
leadership with their colleagues who remain in the classroom. In this section I describe this sample
with respect to geographic mobility, teaching assignments, types of school leadership positions, in-
come, school achievement, race, and value-added.
With respect to patterns in geographic mobility, a third of new-leaders move to leadership po-
sitions in the same school at which they taught. Eighty percent of new-leaders move to leadership
positions in the same district. When the sample is restricted to the state’s six largest districts, 97%
of new leaders stay in the same district. This finding speaks to Lortie’s claim that districts place a
premium on individuals’ localized knowledge of the schooling context when hiring school leaders
(Lortie, 2009). Viewing this finding from the perspective of labor supply, it may also be the case
that individuals, established in their career, may also be socially established in a given locale and
are only pursuing leadership positions within a limited geographic region.
39

Figure VII.1: Gender Differences
87%
64%
Teachers Movers
Female Male
Figure indicates gender distribution of all teachers (left panel) as compared with those teachers who subsequentlymoved into leadership positions (right panel).
Figure VII.1 shows the differences in gender between those moving into leadership and those
remaining in instructional positions. In addition to underscoring the asymmetry in gender between
males and females as previously emphasized by (Joy, 1998), Figure VII.1 also highlights the dy-
namic and changing nature of the school leadership labor market. In 1988 the gender composition
of the teachers was virtually identical to the composition in the past decade, however women only
occupied 22% of all elementary principal positions. In just over two decades the proportion of
women in the leadership labor market has grown three fold. Nonetheless, there remains a sizable
gender disparity between the proportion of females in the classroom and and those in school lead-
ership (87% compared to 64%).
Teachers occupy a multitude of instructional positions prior to moving into leadership posi-
tions, as is shown in Figure VII.2. The panel on the left (Teachers) shows the instructional positions
held by teachers who did not later move into school leadership. The panel on the right(Movers)
shows the instructional positions of those who did make a move into school leadership. By compar-
40

ing the two we can get a feel for whether or not teachers of various subjects are equally represented
among school leaders. For example, 3.33% of all teachers teach physical education and 4.02% of
all new school leaders also taught physical education, this shows a parity among this group within
school leadership. Figure VII.2 makes clear that teachers in the five value-added grades (i.e., those
likely to have value-added scores, shown in red) tend to move into school leadership roles at dis-
proportionately high rates. While these individuals make up 35% of the teachers in this sample,
they constitute over half of all new leaders1.
Figure VII.2: Classroom Roles
3.44%
0.67%
34%
35%
4.00%
0.08%
18%
52%
Teachers New Leaders
Music Librarian Art P.E. Counselor
ESL Spec. Ed Pre-K to 3rd 4th-8th Other
Figure indicates instructional positions held by all teachers (left panel) as compared with those teachers whosubsequently moved into leadership positions (right panel).
The disproportional matriculation of value-added teachers into school leadership makes one
wonder if such a finding may, in part, be an implication of the school accountability movement. It
may be that schools are more likely to hire individuals who have demonstrated the ability to suc-
cessfully prepare students in a high-stakes context (since value-added is most often calculated for
high-stakes evaluations). Such teachers may work well under pressure, understand how to navigate1Teachers in grades 4-8 account for 35% of all teachers, however among teachers with administrative licenses,
those in grades 4-8 constitute 43% of all teachers.
41

education through external policy constraints, or be able to prioritize learning goals and classroom
activities to maximize measurable student outcomes – all of which may be perceived as advanta-
geous characteristics for a school leader in the current policy environment.
Figure VII.3: Leadership Roles
Principal Elem
Principal High
Principal Comb
Ass't Elem
Ass't High
Ass't Comb
Figure indicates positions taken by new leaders. Combo indicates a leadership position accepted at a combined k-12school. Ass’t indicates a position taken as an assistant (or vice) principal.
Table VII.3 shows the types of positions that new leaders accepted. Expectedly, the majority
(81%) of all new leaders moved into a position as an assistant principal, as shown by the combined
area of the maroon, red, and orange slices. A notable proportion of teachers moved directly from
a teaching position into a role as principal; this mobility pattern was far more prevalent in rural
districts. Table VII.3 also shows that most teachers from k-8 subjects (75%) accepted leadership
positions in elementary schools. Teachers in urban districts were more likely move into leadership
positions in high schools, as were female teachers.
42

Figure VII.4: Context Comparisons
-2-1
01
Te
ach
ing
Sch
oo
lM
ath
Ach
ieve
me
nt
-1.5 -1 -.5 0 .5 1Hiring School Math Achievement
Correlation: 0.59
0.2
.4.6
.81
Te
ach
ing
Sch
oo
lP
erc
en
t W
hite
0 .2 .4 .6 .8 1Hiring School Percent White
Correlation: 0.87
Figure indicates how the school in which a teacher taught (y-axis) differs from the school in which they were hired(x-axis). Left panel depicts average school math achievement (standardized); right panel depicts the percent of whitestudents. The gray line provides a 1:1 reference while the red line is a linear trend line.
Distributional patterns have been of interest to labor economists and education advocates alike.
Figure VII.4 presents a comparison of school achievement (panel 1) and the racial characteristics
of students in the schools (panel 2). The measure pertaining to the school in which the new leader
worked as a teacher is represented on the y-axis while the measure pertaining to the school in
which they were hired as a leader is represented on the x-axis. The light gray line shows a one-
to-one correspondence between the measures, implying that the achievement (or student race) at
their teaching school was the same as at their leading school. The darker line shows a linear fit
between the two measures. For both achievement and student composition there is a pattern of
moving towards a similar school. In panel 1, we see that individuals who taught in high achieving
schools tend to move into leadership positions in schools with even higher achievement. Con-
43

versely, those who taught in lower performing schools tend to move into leadership positions in
even lower achieving schools. Panel 2 of Figure VII.4 shows that individuals who taught in schools
with primarily white students tend to accept leadership positions in schools with primarily white
students and, conversely, those who taught in schools with primarily non-white students tended to
move into leadership positions in schools teaching primarily non-white students as well.
The final descriptive measure presented here addresses the continuity of individual value-added
scores over time. Depending on what is motivating the change from teaching to leadership, we may
expect either a dip or a rise in performance prior to the move. In other work, Cullen & Mazzeo
(2010) noted an “Ashenfelter’s dip” – a reduction in school value-added to precede a principals’
departure from a school. An increase in teachers’ value-added scores prior to a leadership move
could suggest that teachers plan to use their record of success to help land the best leadership job,
or perhaps they want to “go out on a high note.” Conversely, a drop in value-added scores prior to
a leadership move may suggest that teachers are burned-out or have re-prioritized their time and
effort as they anticipate their next position. A supplemental fixed-effects probit regression analysis
examining within teacher variation showed no significant difference between the value-added mea-
sure in the year prior to moving into leadership (their last year as a teacher) and the value-added in
other years when the sample was restricted to leadership movers with three or more years of value-
added scores. This suggests that a teachers’ instructional quality does not change significantly as
they depart the classroom.
In summary the descriptive findings have shown that the labor market is small and largely
defined by district boundaries, men are over-represented in leadership, relative to their proportion
in the teaching force, teachers in value-added subjects are over-represented as new leaders, most
new leaders take positions as assistant principals, new leaders move to schools that are similar to
the schools in which they taught, and there is no appreciable dip in value-added in the year prior
to their move into leadership. In the next section I turn to the three analytical questions outlined at
44

the start of this paper.
VII.1 Measures of Quality
The first and second research questions investigate the extent to which school and instructional
effectiveness are related to a teacher’s movement into a leadership position. The results to these
questions are shown in Tables VII.1 and VII.2. Table VII.1 shows the probit results of two analyses
(estimates for year and large district dummies are not shown), model 1 includes all teachers (the
“policy relevant” sample), while model 2 restricts the sample to only those teachers with adminis-
trative licenses (the “pipeline relevant” sample).
Table VII.1: School Quality & Leadership Matriculation
(1) (2)
All TeachersTeachers with
Admin. LicensesCoef SE Coef SE
School VA 0.348* (0.161) 0.126 (0.237)
School % White -0.037 (0.103) -0.073 (0.150)School % ELL 0.064 (0.095) 0.012 (0.132)Math Achievement -0.207** (0.069) -0.083 (0.101)School Enrollment 0.029*** (0.007) 0.019 (0.010)Teacher Gender (male) 0.804*** (0.042) 0.583*** (0.059)
2 0.395*** (0.043) 0.316*** (0.064)Experience 3 0.526*** (0.061) 0.420*** (0.083)Quintile 4 0.851*** (0.075) 0.220* (0.104)
5 1.011*** (0.095) -0.073 (0.132)Gross Income -0.195*** (0.043) -0.198*** (0.057)
Observations 269,878 33,096† indicates p < 0.10, * indicates p < 0.05, ** indicates p < 0.01, *** indicates p < 0.001The table above presents the results of a probit regression model predicting teachers’ matric-
ulation into school leadership. The sample in model 1 includes all teachers with school-levelvalue-added measures; the sample in model 2 includes all teachers with both school-levelvalue-added measures and administrative licenses. Coefficients are marginal probabilities.
45

When we examine comparisons among the policy relevant sample (all teachers; model 1) we
see that school value-added is positively associated with movement into school leadership (School
VA = 0.348). The magnitude of this relationship is moderate, yet on the cusp of statistical signifi-
cance. Interpreting the coefficient into more practical terms this means that teachers from schools
in the lower 5% of the school value-added distribution have a 0.79% chance of moving into school
leadership as compared with their colleagues in a school in the top 5%, who have a 1.16% chance
of a leadership move (see figure VII.5). Another way to consider the magnitude of this finding is
to consider that the coefficient on school quality is slightly less than half the size of the gender and
experience (quintiles 4 and 5), the largest predictors of leadership matriculation across the litera-
ture. The small probabilities reflect the nature of this low-probability event, however the relative
probabilities show that teachers in top schools are almost one and a half times as likely to move
into school leadership.
Looking further, we see that teachers from high achieving (rather than high growth) schools
are less likely to move into school leadership (Math Achievement = -0.207). With school value-
added in the model, average school math achievement is likely a proxy for the more affluent, higher
achieving schools. If all leadership hiring were done on political and/or social connections, we may
expect that individuals working in the highest achieving (and most socially-connected) schools to
be first in line. These results tell a different story, suggesting that it is teachers in lower achieving
schools that are more likely to move into school leadership.
A school’s student composition (percent white and percent ELL), are not significant predictors
a teachers likelihood to move into school leadership. School size (scaled in terms of 100 students)
shows a very modest positive association with movement into leadership. Larger schools typically
have more individuals assigned to administrative positions. Larger schools then provide a greater
opportunity for an administrator to match with a teacher and encourage them into a leadership
role. As expected, the experience quintile dummy variables show a positive relationship to ma-
46

Figure VII.5: Predicted Probability of Leadership Matriculation and School Value-Added
0.0
05
.01
.015
.02
Pro
babili
ty
-.6 -.4 -.2 0 .2 .4 .6School VAE
1 SD = 0.12
The red line indicates the predicted probability of leadership matriculation from the “policy relevant” sampleestimated by model (1); 95% confidence intervals are depicted by the gray region on either side of the red line.Curvature of confidence interval is a function of the probit model.
triculation, affirming that teachers with more experience are more likely to move into leadership
positions. Gross income shows a negative relationship (-0.195), suggesting that after controlling
for experience, teachers with higher incomes are less likely to move into school leadership. This
is likely evidence that the teacher-leader salary differential is partially motivating the move into
school leadership.
A key difficulty in labor market studies is disentangling selection on the part of the labor sup-
ply from selection on the part of the labor demand. The preceding analysis showed that school
value-added has a positive relationship with movement into leadership, however there are two sce-
narios that could produce such a situation, each with distinct policy implications. One possibility
is that teachers from higher value-added schools are more likely to obtain administrative licenses
47

and thus make up the bulk of leadership applicants. The other possibility is that school quality
has no bearing on administrative licensure and schools are preferentially hiring new leaders who
taught in higher value-added schools. The first scenario implies that selection occurs primarily on
part of labor supply; the second scenario implies selection on the part of labor demand. The second
analysis (model 2) in Table VII.1 restricts the sample to only those teachers who hold administra-
tive licenses in a given year (the pipeline relevant sample). The results show that the relationship
between school value-added and leadership matriculation is no longer significant. This implies that
the differential selection appears to take place within the labor supply, prior to the hiring process.
Also of note in the restricted analysis shown in Table VII.1 is that the magnitude of the coeffi-
cients on the experience proxies are reduced. Such a reduction may indicate that among licensed
individuals, those with more years of experience are still more likely to move into leadership, with
one important exception: Teachers with the most experience (5th experience quintile) are no more
likely to move into school leadership than are those with the least experience (1st experience quin-
tile; the comparison group). This may be a result of experienced licensed teachers who have no
incentive or desire to move into school leadership. The final inference gleaned from the restricted
sample analysis in Table VII.1, is that the coefficient on teacher gender (Male) is also substantially
reduced, suggesting that being male plays a greater role in obtaining an administrative license as
compared to moving into leadership positions after a license has been obtained.
Results for research question two, pertaining to the relationship between instructional quality
and leadership matriculation is shown in Table VII.2. Here we see evidence suggesting that teach-
ers of higher instructional quality as measured by teacher value-added are more likely to move into
school leadership (Teacher VA = 0.502)2. Again, some perspective can be gained by considering
the predicted probability rather than the marginal probit coefficient. In this case, a teacher in the
2Table IX.4 provides several robustness checks using “policy relevant” sample analyzed by model (3). Similarresults are obtained when using two or three-year moving averages as well as using a teacher value-added measureconstructed with two-year student lag scores.
48

Table VII.2: Instructional Quality & Leadership Matriculation
(3) (4)
All TeachersTeachers with
Admin. LicensesCoef SE Coef SE
Teacher VA 0.502*** (0.144) 0.361 (0.199)School VA 0.394 (0.369) 0.340 (0.528)
School % White 0.032 (0.205) 0.192 (0.295)School % ELL -0.320 (0.168) -0.372 (0.236)Math Achievement -0.376* (0.153) -0.243 (0.221)School Enrollment 0.023 (0.016) 0.023 (0.023)Teacher Gender (male) 0.873*** (0.083) 0.572*** (0.115)
2 0.382*** (0.091) 0.266* (0.130)Experience 3 0.700*** (0.123) 0.576*** (0.163)Quintile 4 1.106*** (0.155) 0.460* (0.210)
5 1.364*** (0.192) 0.262 (0.265)Gross Income -0.487*** (0.096) -0.470*** (0.132)
Observations 46,059 6,813† indicates p < 0.10, * indicates p < 0.05, ** indicates p < 0.01, *** indicates p < 0.001The table above presents the results of a probit regression model predicting teachers’ ma-
triculation into school leadership. The sample in model 3 includes all teachers with individ-ual value-added measures; the sample in model 4 includes all teachers with both individualvalue-added measures and administrative licenses. Coefficients are marginal probabilities.
bottom 5% of the value-added distribution would have a 0.85% percent chance of moving into a
school leadership position. In contrast, a teacher in the top 5% would have a 1.64% chance (see
Figure VII.6). Again, these probabilities are low as they reflect the unlikely event that anyone
moves from teaching to leadership, however a comparison of the top and bottom teachers suggests
that top teachers may be twice times as likely to move into school leadership.
In this analysis, school value-added is not significant, however the similar magnitude of the
coefficient to that shown on Table VII.1 suggests that the five-fold drop in sample size may have
resulted in a substantial loss of precision rather than a differential effect of school value-added
49

Figure VII.6: Predicted Probability of Leadership Matriculation and Teacher Value-Added
0.0
1.0
2.0
3.0
4.0
5P
robabili
ty
-1.2 -.8 -.4 0 .4 .8 1.2Teacher VAE
1 SD = 0.22
The red line indicates the predicted probability of leadership matriculation from the “policy relevant” sampleestimated by model (3); 95% confidence intervals are depicted by the gray region on either side of the red line.Curvature of confidence interval is a function of the probit model.
within this sample. The remaining variables are largely in keeping with those presented in Ta-
ble VII.1, namely being male, increasing experience, lower income, larger school size, and lower
school-wide math achievement are related to an increased propensity to move into leadership po-
sitions.
When I restrict the sample to the pipeline relevant teachers (model 4), we see that teacher
value-added is no longer significant. Thus, it appears that it is primarily the higher value-added
teachers who hold leadership licenses, regardless of whether or not they move into school leader-
ship. As with the results from the first research question, we also see that math achievement is not
significant in this sub-population, the coefficient on male drop appreciably, the experience proxies
are reduced, and the coefficient on income remains the same.
50

Figure VII.7 shows the overall predictive power of model 3 (including all teachers, measuring
teacher and school value-added) relative to the naive estimate. The uninformed naive estimate,
shown as a vertical line, represents the 1.8% of teachers who move into school leadership. The
curved gray line represents the predicted probability that a teacher moves into school leadership for
those teachers who do not move into leadership and the red line represents the same probability for
teachers who do move into administration. A highly predictive model would show that individuals
who move into leadership to have predicted matriculation rates higher than the naive estimate and
those who do not move into leadership to be lower than the naive estimate. In Figure VII.7 we see
that, to the left of the naıve estimate, the population is dominated by teachers who do not move
into leadership, where as to the right of the naive estimate teachers who do move into leadership
dominate. As expected by the significant findings presented above, conditioning on teacher and
school characteristics produces more informed estimates. However, Figure VII.7 also shows evi-
dence of misclassification; that is, individuals who do move into school leadership are occasionally
predicted to be less likely to do so than are teachers who remain in classroom (as shown by the red
line to the left of the naive estimate and the gray line to the right). This suggests that there are other
omitted variables that may be related to leadership matriculation (e.g., the number of applications
submitted, then number of schools within 25 miles of home, total family income, etc.).
The preceding analyses set out to explore the relationship between school and instructional
quality and a teacher’s propensity to move into school leadership. When considering the “policy
relevant” sample of all teachers eligible to move into school leadership it appears that both school
and teacher value-added are significant, positive predictors of matriculation from teaching to school
leadership. However neither of these quality measures were significant predictors of leadership
matriculation in the “pipeline relevant” sample of teachers with administrative licenses. School
demographics (% White and % ELL) were never significant predictors and gross income displayed
a consistent negative relationship to leadership matriculation. Being male remained the the single
51

Figure VII.7: Predicted Probability of Matriculation and Teacher Value-Added
Pro
po
rtio
n
0 .05 .1 .15Move [hat]
New Leaders
Kernel density estimate
Figure indicates the predictive power of the model, in this case model 3 – the “policy relevant” sample that includesall teachers. The vertical line represents the naıve leadership matriculation estimate of 0.018%.
largest predictor of a teachers movement into school leadership.
VII.2 Distribution of School Leadership
In addition to examining the differential movement of teachers into leadership, the third research
question in this study set out to identify patterns in the distribution of new leaders as a function
of school and instructional quality. Table VII.3 presents the results of modeling school quality
(from the new leaders’ teaching days) with the various characteristics of the hiring school. Model
5 includes all new leaders; model 6 restricts the sample to only those new leaders who moved into
a leadership position in a school different from the school at which they taught. In both model 5
and model 6 the level of analysis is the vacancy of the leadership position.
The most striking conclusion drawn from Table VII.3 is that new leaders who taught in high
value-added schools tend to have accepted leadership positions in other high value-added schools
(School VA = 0.49). The trend, however, functions in both directions and also suggests that teach-
52
ers who taught in low value-added schools are more likely to accept a leadership position in a
low value-added school. Having taught in a high value-added school does not appear to have any
bearing on whether the individual moves into a position as a principal or a vice-principal, nor does
it have an appreciable relationship to school achievement or school size. There is, however, a
slight positive relationship to school demographics (% White = 0.04), indicating that schools with
more white students appear more slightly more likely to attract new leaders from high value-added
schools. This coefficient of 0.04, where represents a 0.04 unit increase in school value-added
(which is slightly less than 1/2 of a standard deviation), reflects an individual moving from a non-
white school to an all white school. As we saw in the descriptive overview (e.g., Figure VII.4),
such moves are uncommon.
53

Table VII.3: School Quality & Leadership Distribution
(5) (6)
All new New Leaders who
leaders switched schools
Coef SE Coef SE
School VA 0.49 *** 0.07 0.18 * 0.08
Principal 0.02 0.01 0.00 0.02
% White 0.04† 0.02 0.07 * 0.03
Math Score 0.00 0.02 0.00 0.03
School Size 0.00 0.00 0.00 0.00
Gross Income -0.01*** 0.00 -0.01 0.01
Observations 908 493
† indicates p < 0.10, * indicates p < 0.05, ** indicates p < 0.01, *** indicates p <0.001The table above presents the results of an OLS regression model predicting teachers’
school-level value-added using characteristics of the school at which they were hired asa school leader. The sample in model 5 includes all teachers with school-level value-added measures from grades 4-8 who moved into a school leadership position; thesample in model 6 restricts the sample from model 5 to those teachers who accepted aleadership position at a school different from the one in which they previously taught.
It is possible that the magnitude and significance of the school value-added coefficient is solely
the result of the teachers who stay in the same school. In such cases the school value-added coeffi-
cient would be biased towards one. Model 6 excludes these individuals and we see that, although
diminished, this coefficient remains appreciably positive and significant.
In the final analysis, I again examine patterns of leadership distribution, this time focusing on
the role of instructional quality as measured by teacher value-added. Similar to the prior results,
Table VII.4 shows that individuals who demonstrated higher instructional quality are more likely
54

to move into leadership positions in high value-added schools, albeit at diminished levels of sig-
nificance (p=0.08). At similar levels of precision, moving directly into a principal position, school
math score, and school size all show some positive relationship to instructional quality.
Table VII.4: Instructional Quality & Leadership Distribution
(7) (8)
All new New leaders who
leaders switched schools
Coef SE Coef SE
School VA 0.35 † 0.21 -0.04 0.16
Principal 0.07† 0.04 0.05 0.05
% White -0.06 0.07 -0.05 0.08
Math Score 0.14† 0.08 0.15* 0.07
School Size 0.01† 0.01 0.00 0.01
Income -0.02 0.01 0.00 0.02
Observations 270 159
† indicates p < 0.10, * indicates p < 0.05, ** indicates p < 0.01, *** indicates p< 0.001The table above presents the results of an OLS regression model predicting teach-
ers’ individual value-added using characteristics of the school at which they werehired as a school leader. The sample in model 7 includes all teachers with indi-vidual value-added measures from grades 4-8 who moved into a school leadershipposition; the sample in model 8 restricts the sample from model 7 to those teach-ers who accepted a leadership position at a school different from the one in whichthey previously taught.
After restricting the sample to those individuals who moved schools as they transitioned to a
leadership position it is evident that the school value-added relationship is no longer significant
(School VA = -0.04). It then appears that high value-added teachers are likely to move into lead-
ership positions at high value-added schools primarily when they have taught at that school. This
reinforces the notion that schools may use local informal information networks to evaluate po-
55

tential candidates. Schools may have a rich contextual understanding of teachers working within
the building; high value-added teachers may then be more likely to be promoted into leadership
positions when they can rely on their within-school reputation in addition to their instructional
expertise. When moving to other schools for a leadership position, it does appear that the hiring
school’s math achievement is the only variable that relates to the new leaders’ prior instructional
quality.
VII.3 Limitations
The results presented in this work are subject to several notable limitations. First, value-added mea-
sures are an indirect measure of teacher quality and have been subject to conceptual and method-
ological criticism. One mechanism that may bias teacher value-added estimates that is relevant to
this inquiry pertains to the non-random assignment of teachers to students. If principals favored
some teachers over others, allowed these favored teachers to select their students for the following
year, and also favored them with additional resources, then we may expect that principals may
also be more likely to “tap” these teachers for subsequent leadership positions. Under such con-
ditions, even if all teachers were of equal instructional ability, these teachers would receive higher
value-added ratings and would also be more likely to move into school leadership, thus creating
a spurious positive relationship between teacher quality and leadership matriculation. Although
work by Kane et al. 2010 and Milinowski 2004 suggests that value-added measures are sound
proxies for the underlying teacher practices that support their use, such political gamesmanship
within schools is not inconceivable.
The second limitation of this study lies in my inability to portray the choice sets of the actors
within the labor market. This research depicts individuals moving from a classroom teaching po-
sition to a position as an assistant or full school principal. There are two critical selection steps
in this process. The first involves individuals selecting into and being selected by administrative
certification programs. The second selection step occurs as individuals are selected into and are
56

selected by schools to fill leadership roles. In the pipeline sample I restricted the comparison group
to those teachers with administrative licensure, however Muth, Browne-Ferrigno, Carr, & Fulmer
(2004) found that many teachers who enter administrative certification programs have little de-
sire or motivation to become school leaders. Muth et al. (2004) suggest that this issue of lack of
commitment to leadership has costs in terms of lost opportunity costs, inefficiencies in the train-
ing process, and ends up rewarding teachers for additional knowledge that has little to no bearing
on their professional responsibilities. One solution, as the authors point out, is to change admin-
istrative certification admissions requirements. By examining both the leadership opportunities
that teachers have sought out and the quality with which the opportunities have been performed,
programs may be better equipped to identify those individuals legitimately interested in pursuing
school leadership. Another solution may be to limit the duration for which administrative masters
degrees can contribute to increases in teacher salary schedules. If teachers knew that the financial
value of an administrative masters degree came primarily from moving into a leadership position
rather than moving up the salary schedule and staying in the classroom we may find those in the
leadership labor pool would be more willing to apply for principal and assistant principal positions.
In an attempt to cultivate a ready supply of school leaders, some districts may also provide full
or partial subsidization of the coursework required to obtain administrative licensure. There is a
potential conflict of interest at play in such policies since some teachers may have no interest in
leadership and may be interested in completing such coursework only as a mechanism to move
them higher on the salary schedule (Muth et al., 2004). If such individuals differ systematically
from other teachers on measures of instructional or school quality, their inclusion would result in
biased estimates.
The use of test-based value-added measures presents another limitation. Observational or sur-
vey methods may be produce better measures of of instructional and school quality constructs.
Student surveys of instructional quality may be more reliable (less noisy) than value-added mea-
57
sures and carry the additional benefit of being available for all teachers, not only those in tested
subjects.
In this particular state districts tend to be fairly large, frequently coinciding with county bound-
aries. These results, especially those regarding intra-district matriculation, may not readily gener-
alize to states with a larger number of small districts. It would be interesting to see how district
size or proximity to schools beyond an individual’s district relates to distributional patterns in lead-
ership matriculation.
Having full access to an application database that indicates which candidates applied to which
schools coupled with information on which schools extended offers to which candidates would
address many of these concerns. Collecting such information represents a next step in this line of
research.
58

CHAPTER VIII
DISCUSSION
This study has been motivated by a need to better understand the labor supply of school lead-
ers. School quality, typically a measure of institutional or leadership quality, has been recast as
a measure of teacher quality, emphasizing the elements of school quality that may translate into
organizational effectiveness. I have argued that instructional quality may be a telling predictor
of subsequent leadership behaviors, namely those leadership behaviors associated with learning-
centered leadership. Empirically, this research set out to address three questions on the subject of
school leadership matriculation:
1. To what extent is school quality related to a teacher’s movement into a leadership position?
2. To what extent is instructional quality related to a teacher’s movement into a leadership
position?
3. Do highly effective teachers, or teachers from highly effective schools, tend to move to
leadership positions in high status schools, or do these teachers move to schools most in
need?
To the first and second question I have shown that among all teachers, school and individ-
ual value-added were positively associated with leadership matriculation, yet among teachers with
administrative licenses school and individual value-added show no significant relationship to lead-
ership matriculation. Speaking to the third question I have shown that school value-added as a
teacher is positively related to the value-added of the school hiring a new leader. This trend ap-
pears to be less pronounced for individual value-added where high value-added teachers are most
likely to be hired as new leaders in high-achieving (rather than high growth) schools.
59

The findings above suggest that it is teachers from higher value-added schools, not higher
achieving schools, that are more likely to move into positions of school leadership. Assuming that
exposure to organizational effectiveness is a desirable attribute in new leaders, this appears to be a
positive finding. Although we cannot be certain from this research how such exposure translates
into subsequent leadership behaviors, it is difficult to reason how experience in a highly effective
context would be detrimental to leadership development.
A recent study has shown that many current principals, when still teaching, were identified
and helped into leadership roles by their own principals (Myung, Loeb, & Horng, 2011). Coupled
with other research that provides evidence that principals can ably identify the top decile of effec-
tive teachers in their school (Jacob & Lefgren, 2008), the findings presented here may be a result
of principals identifying more effective teachers and supporting them in a move towards formal
leadership positions. Indeed, such a phenomenon would explain why it appears that highly effec-
tive teachers are more likely to obtain leadership licenses. This potential behavior also provides an
additional and interesting hypothesis in favor of further examination of school quality prior to lead-
ership matriculation: Working in a highly effective school may also mean that an individual was
identified for leadership by the leader of a highly effective school. It may be that highly effective
leaders are better equipped to identify individuals with strong leadership potential; the homosocial
tapping phenomenon that Myung et al. (2011) suggest lends credence to this hypothesis.
This research has shown that more effective teachers are more likely to hold an administrative
license, yet among administratively licensed teachers they are no more likely to move into a lead-
ership position. In light of the preceding overview of existing selection trends in administrative
certification programs, one may infer that more effective teachers are more likely to apply to ad-
ministrative certification programs than are their less effective colleagues. From an organizational
perspective, it is unclear at this point whether or not this is a desirable outcome. If subsequent
research finds that instructional effectiveness is predictive of instructional leadership then we must
60

consider a cost-benefit framework to identify the balance between the relative contributions of the
individual functioning as an effective teacher as opposed to an effective school leader. If sub-
sequent research finds that instructional effectiveness is not predictive of instructional leadership
then the findings presented here appear to highlight an inefficiency in the system. And yet, should
the counter-factual for an effective teacher turn out to be an exodus from education as they accept
a position in another field as opposed to remaining in the classroom, a leadership promotion may
still be in the best interests of the district.
Given the controversy around the use of value-added assessment for organizational and per-
sonnel decisions (e.g., Thrupp (2001)), it is of considerable interest if value-added measures are
related to movement from teaching into leadership. This research has provided evidence to sug-
gest that those who enter the leadership applicant pool – those who currently hold administrative
licenses – are primarily those who demonstrated superior instructional quality or those who came
from highly effective schools. This research has also shown that there is little reason to suppose
that the schools or districts hiring new leaders are privileging instructional or school quality in
their hiring decisions. While this may represent wisdom on the part of districts if prior quality is
unrelated to subsequent leadership ability, it may also represent an oversight and a potential policy
lever to improve the pool of effective school leaders. An inquiry into such possibilities represents
a rich area for future research.
As has been illustrated with this research, I argue that we should move from “quantity” cri-
teria to “quality” criteria in leadership hiring decisions. Quantity criteria, which are currently
being used primarily because they have been used in the past and are readily available, include
elements such as college degree, years of teaching experience, having been a coach, sponsoring
an extracurricular activity, serving as department head, and leading professional development ses-
sions (?). This research has examined one of the above elements, a teacher’s teaching experience,
and has sought to move from a quantity measure of “how long has one taught” to “how well has
61

one taught.” This research has used value-added measures of student achievement as a potential
predictor of instructional leadership and organizational effectiveness, yet other measures may be
worthy of consideration. These measures may include measures such as parent surveys, student
surveys of teacher instructional practices, teacher and student climate surveys, and National Board
Certification.
With student, parent, and teacher surveys readily deployed, collected, and stored electronically,
the financial cost to districts to initiate and maintain such surveys is small. The costs are still less
when we consider that such surveys or other evaluative measures can be useful for improving, not
only leadership selection, but the human resource management of schools as a whole, primarily
from a teacher or principal evaluation/development standpoint (Odden, 2011). Such a database
could be used not only to better discern amongst applicants, but also to seek out and actively re-
cruit potential candidates.
The distributional inquiry was motivated by a concern over the equitable distribution of lead-
ership quality. From an equity stand point, the most detrimental result would be to find that poten-
tially high-quality new leaders are moving into high achieving, high value-added schools. Such a
result would represent social-cultural reproduction (Bourdieu, 1973) operating at the institutional
level. This movement would consolidate organizational knowledge into schools serving privileged
students and likely serve as a mechanism to exacerbate gaps in student achievement. The final
analyses (Table VII.4) presented evidence to suggest that new leaders with superior instructional
skills may be moving disproportionately into high-achieving schools, especially when new lead-
ers switch schools (model 8). Results examining school quality (Table VII.3) provide evidence
that potentially high-quality new leaders move into high academic growth schools. The end prod-
uct is a partial consolidation of capabilities into high-growth schools. This influx of potentially
high-quality new leaders may indeed be part of the story behind the success of low-achieving
and high-growth schools. Unfortunately, this finding is rather disparaging for low-achieving, low-
62
growth schools who have few resources at their disposal to attract highly effective leaders.
Other research on teacher and principal mobility has established trends showing movement
away from high-minority and low-achieving schools and towards low-minority and higher-achieving
schools. Beyond student demographics and achievement,Loeb et al. (2005) found that the most
significant predictor of teacher turn-over pertained to school conditions. To the extent that school
conditions are positively correlated with school value-added, the analyses on the distribution of
new leaders show a similar trend where teachers from high value-added schools are likely to go to
schools with more white students, yet the stronger trend to move into a high value-added school
(see VII.3). Similarly, teacher quality appears to be related to both school achievement as well as
school growth (see VII.4).
Some scholars have noted the narrowly local, even provincial, nature of educational labor mar-
kets (Boyd et al., 2005; Lortie, 2009) and the results presented here suggest that new leadership
labor markets function in a similar manner. As presented above, 80% of new leaders take positions
in schools within the same district in which they taught. Lortie interprets such trends as being
indicative of a district preference for leaders with a knowledge of local context 2009. Given the
preceding perspective on the existing structure of leadership selection, it is possible that these se-
lection policies have induced an artificially strong tendency for within district selection.
Informal, non-systematic information regarding new leaders is likely to be most reliable within
their immediate professional vicinity – their district. That is, it is primarily within districts that
teachers can develop their reputation as potential school leaders. Through word of mouth or per-
sonal interactions local school and district leaders can gage some of the quality measures identified
above. These informal networks may help distinguish between intra-district candidates who are
legitimately interested in leadership to improve student outcomes as opposed to less desirable can-
didates. Because informal information on candidates without leadership experience tends to be
63

concentrated within districts and the selection process into leadership is often non-discriminant,
districts may become overly reliant on within district candidates. If it is known among the labor
supply that institutions primarily hire from within, new leadership candidates will be less likely to
apply to positions beyond their own district. Thus, integrating more information into the admin-
istrative certification selection process may help schools attract intra-district candidates and may
also assist schools in selecting among candidates.
Murphy characterizes administrative certification selection policies as propagating a leader-
ship labor pool where “automorphism reigns, “good old boys” flourish, and “savvy, risk-taking,
entrepreneurial educational leaders” are conspicuous by their absence 1992, p. 84. Similarly,
Myung et al. (2011) found evidence of homosocial tapping behaviors among Miami-Dade princi-
pals. Such behaviors are revealing yet unsurprising – without any alternatives, it is reasonable for
leaders to seek out teachers who reinforce the leaders’ vision of their own competencies. Princi-
pals have more contextual knowledge of their teachers than can be summarized on any survey and
should be a valued part of the recruitment and nomination portion of the leadership supply chain.
Rather than leaving principals to identify potential candidates at their convenience, districts should
consider training principals to identify teachers who have consistently demonstrated leadership po-
tential. Districts can take advantage of a principals’ deep local knowledge to identify and recruit
candidates not only by what they have done, but by how well they have done it. Formalizing such
an identification process, perhaps through the use of the measures suggested above, could be a
notable step to address concerns regarding principal pipeline.
By instituting more comprehensive selection policies an measures a more robust set of poten-
tial indicators including parent, principal, peer, and student surveys, letters of recommendation,
classroom observations, tests (e.g., GRE, PRAXIS and Gallop PrincipalInsight), writing samples,
years of experience, and education can be included in the selection criteria. This comprehensive
recruitment and selection process may produce a more capable leadership labor supply.
64
The strong propensity of leadership hires to be made within districts may offer an opportu-
nity to change these leadership patterns in low-achieving low-growth schools. A labor demand
perspective would suggest that the geographically limited hiring patterns may be attributable to
districts and schools placing a premium on localized knowledge and experience. A labor supply
perspective may suggest that this same phenomenon may be attributable to individuals being so-
cially and professionally vested in their local community and preferring this known context over
others. Both views would be congruous with a policy to develop partnerships between high-growth
and low-growth schools within districts. In addition to the clear benefits of networking and sharing
of ideas, such pairings may familiarize potential leaders with the low-growth schools and increase
the probability that they would consider leadership positions at these or similar schools.
Higher salaries and signing bonuses represent second policy lever to attract new leaders to
low-growth, low-income schools. Considering that the demands of school leadership have been
increasing and teacher salaries have been rising faster than those of administrator salaries, we may
expect a portion of the leadership pipeline issues to stem from diminished incentives to move into
school leadership. As shown in Tables VII.1 and VII.2, when teachers’ income rises they are less
likely to move into a leadership position. We may then infer that financial compensation is partially
driving movement into leadership. If working conditions are considered to be a part of the overall
compensation for moves made within the education sector (Loeb et al., 2005), districts may want
to consider methods to increase financial compensation for leaders in schools where alternative
forms of compensation are lacking. The results presented here suggest that new leaders may be
receptive to such policies.
The framework motivating this study is empirical in regard to its reliance on established re-
search on high-quality instruction, leadership behaviors, and organizational effectiveness; however
the validity of the claim linking teacher quality to leadership effectiveness remains unsubstantiated.
65

Although testing the validity of the framework is beyond the scope of this particular research, such
an inquiry is central to the larger research agenda framing this work. Many of the interpretations
and policy suggestions that may be drawn from this research are conditional on the validity of
the proposed framework. For example, if later research can determine that instructional quality is
not related to leadership efficacy, we may want to consider policy levers to keep high value-added
teachers in the classroom. If later research finds that instructional quality is predictive of leadership
efficacy we need to compare the relative effects of the outcomes before taking steps to promote one
over the other. The validation of this framework will be of substantial interest to research related
to leadership preparation and effectiveness as well as being of notable interest to policy makers.
66

CHAPTER IX
APPENDIX
Table IX.1: Descriptive Statistics
Min Max Mean S.D.Teacher VA -1.223 1.479 0.004 0.245School VA -1.367 0.967 0.013 0.137School % White 0.000 1.000 0.685 0.335School Math Achievement -2.700 4.252 -0.003 0.418Teacher Gender 0.161 0.367School % ELL 0.000 1.000 0.820 0.285School Enrollment 0.100 12.590 2.965 2.463Experience Quintile 1 0.204 0.403Experience Quintile 2 0.200 0.400Experience Quintile 3 0.207 0.405Experience Quintile 4 0.199 0.399Experience Quintile 5 0.191 0.393Gross Income 2.155 15.550 4.412 0.855Note: School size is measured per 100 students. Gross income is measured
per $10,000.
67

Tabl
eIX
.2:C
ross
-cor
rela
tion
tabl
eV
aria
bles
(1)
(2)
(3)
(4)
(5)
(6)
(7)
(8)
(9)
(10)
(11)
(12)
(13)
Teac
herV
A1.
00Sc
hool
VA0.
461.
00Sc
hool
%W
hite
0.18
0.11
1.00
Scho
olM
ath
Ach
ieve
men
t0.
480.
610.
531.
00Te
ache
rGen
der
-0.0
5-0
.09
-0.0
1-0
.04
1.00
Scho
ol%
EL
L-0
.08
-0.1
10.
07-0
.14
-0.0
21.
00Sc
hool
Enr
ollm
ent
0.01
-0.0
90.
010.
140.
150.
011.
00E
xper
ienc
eQ
uint
ile1
-0.0
6-0
.01
-0.0
3-0
.04
0.05
-0.0
00.
001.
00E
xper
ienc
eQ
uint
ile2
-0.0
2-0
.01
-0.0
1-0
.02
0.01
-0.0
00.
00-0
.25
1.00
Exp
erie
nce
Qui
ntile
30.
020.
00-0
.00
0.00
-0.0
10.
00-0
.01
-0.2
6-0
.26
1.00
Exp
erie
nce
Qui
ntile
40.
030.
010.
030.
03-0
.02
-0.0
0-0
.00
-0.2
5-0
.25
-0.2
51.
00E
xper
ienc
eQ
uint
ile5
0.03
0.01
0.01
0.02
-0.0
30.
010.
00-0
.25
-0.2
4-0
.25
-0.2
41.
00G
ross
Inco
me
0.04
0.02
-0.3
2-0
.03
0.00
-0.0
60.
05-0
.54
-0.2
80.
020.
240.
571.
00
68

Table IX.3: Comparison among teachers with and without Administrative Licenses
Teacher School School School Math Teacher SchoolVA VA % White Achievement Gender % ELL
Min -1.22 -1.37 0.00 -2.70 0.00 0.00Without Max 1.48 0.97 1.00 4.25 1.00 1.00Licenses Mean 0.00 0.01 0.69 -0.00 0.16 0.82
S.D. 0.25 0.14 0.33 0.42 0.37 0.29Min -0.90 -1.37 0.00 -2.21 0.00 0.00
With Max 0.88 0.97 1.00 4.25 1.00 1.00Licenses Mean 0.02 0.00 0.67 -0.04 0.24 0.84
S.D. 0.26 0.14 0.35 0.42 0.43 0.27
School Exp 1 Exp 2 Exp 3 Exp 4 Exp 5 GrossEnrollment Income
Min 0.01 0.00 0.00 0.00 0.00 0.00 2.16Without Max 12.59 1.00 1.00 1.00 1.00 1.00 15.55Licenses Mean 2.96 0.21 0.20 0.21 0.20 0.18 4.40
S.D. 2.46 0.41 0.40 0.41 0.40 0.39 0.85Min 0.01 0.00 0.00 0.00 0.00 0.00 2.97
With Max 12.04 1.00 1.00 1.00 1.00 1.00 8.77Licenses Mean 3.16 0.03 0.08 0.09 0.24 0.56 5.06
S.D. 2.57 0.18 0.27 0.28 0.43 0.50 0.87
Note: Exp 1-5 refer to the five within-district experience quintiles. School size is measured per 100 students. Gross incomeis measured per $10,000.
69

Tabl
eIX
.4:I
nstr
uctio
nalQ
ualit
y&
Lea
ders
hip
Mat
ricu
latio
n:R
obus
tnes
sC
heck
s
(3)
(9)
(10)
(11)
All
Teac
hers
2ye
arM
A3
year
MA
2ye
arla
gC
oef
SEC
oef
SEC
oef
SEC
oef
SE
Teac
herV
A0.
34**
0.10
0.40
**0.
150.
39+
0.21
0.28
*0.
14Sc
hool
VA0.
260.
29-0
.06
0.38
-0.3
0.51
-0.0
20.
38
%W
hite
0.01
0.15
-0.0
10.
170.
050.
230.
020.
18%
Non
-ESL
-0.2
40.
12-0
.25†
0.13
-0.3
0*0.
15-0
.23
0.15
Mat
hA
chie
vem
ent
-0.2
4*0.
11-0
.11
0.13
-0.0
50.
16-0
.23
0.14
Teac
herG
ende
r(m
ale)
0.56
***
0.06
0.51
***
0.07
0.44
***
0.09
0.54
***
0.07
Scho
olSi
ze0.
015
0.01
0.01
0.01
0.01
0.02
00.
012
0.25
***
0.07
0.20
*0.
090.
10.
130.
33**
*0.
09E
xper
ienc
e3
0.47
***
0.09
0.42
***
0.11
0.31
*0.
150.
57**
*0.
12Q
uint
ile4
0.77
***
0.11
0.79
***
0.13
0.77
***
0.17
0.89
***
0.14
50.
96**
*0.
140.
98**
*0.
160.
93**
*0.
21.
09**
*0.
17In
com
e-0
.32*
**0.
07-0
.37*
**0.
09-0
.39*
**0.
1-0
.32*
**0.
09O
bser
vatio
ns41
,201
28,0
7918
,760
22,9
29†
indi
cate
sp
<0.
10,*
indi
cate
sp
<0.
05,*
*in
dica
tes
p<
0.01
,***
indi
cate
sp
<0.
001
The
tabl
eab
ove
pres
ents
the
resu
ltsof
apr
obit
regr
essi
onm
odel
pred
ictin
gte
ache
rs’m
atri
cula
tion
into
scho
olle
ader
ship
.T
hesa
mpl
efo
rmod
els3
,9-1
1in
clud
eal
ltea
cher
sval
ue-a
dded
mea
sure
syet
diff
eron
how
how
the
mea
sure
was
cons
truc
ted.
Mod
el3
has
nom
ovin
gav
erag
e(a
spre
sent
edin
Tabl
eV
II.2
forc
ompa
riso
n);M
odel
9us
esa
2-ye
arm
ovin
gav
erag
e;M
odel
10us
esa
3-ye
arm
ovin
gav
erag
e;an
dM
odel
11us
esa
valu
e-ad
ded
mod
elth
atin
clud
esa
two-
year
lag
inst
uden
ttes
tsco
rean
dm
aybe
robu
stto
stud
ent-
teac
hers
ortin
gbi
ases
.Coe
ffici
ents
are
mar
gina
lpro
babi
litie
s.
70

REFERENCES
Acheson, K. A., & Gall, M. D. (1987). Techniques in the clinical supervision of teachers: Pre-
service and inservice applications. Order Department, Longman Inc., 95 Church Street, White
Plains, NY 10601 ($14.95).
Ames, C., & Ames, R. (1984). Systems of student and teacher motivation: Toward a qualitative
definition. Journal of Educational Psychology, 76(4), 535–556.
Angrist, J. D., & Krueger, A. B. (2001). Instrumental variables and the search for identification:
From supply and demand to natural experiments. Journal of Economic Perspectives, (pp. 69–
85).
Ballou, D. (1996). Do public schools hire the best applicants? The Quarterly Journal of Eco-
nomics, 111(1), 97–133.
Battle, D. (2009). Characteristics of public, private, and bureau of indian education elementary and
secondary school principals in the united states: Results from the 2007–08 schools and staffing
survey. Tech. Rep. NCES 2009-323, National Center for Education Statistics.
URL http://nces.ed.gov/pubs2009/2009323.pdf
Battle, D., & Gruber, K. (2010). Principal attrition and mobility: Results from the 2008-09 prin-
cipal follow-up survey. Tech. Rep. NCES 2010-337, U.S. Department of Education, National
Center for Education Statistics, Washington, DC: U.S.
URL http://nces.ed.gov/pubsearch/pubsinfo.asp?pubid=2010337
Baugh, W. H., & Stone, J. A. (1982). Mobility and wage equilibration in the educator labor market.
Economics of Education Review, 2(3), 253–274.
Betts, J. R., Zau, A., & Rice, L. (2003). Determinants of student achievement: New evidence from
San Diego. Public Policy Inst of California.
71

Billger, S. M. (2007). Principals as agents? Investigating accountability in the compensation and
performance of school principals. Industrial and Labor Relations Review, 61(1), 90–107.
Blase, J. (2004). Handbook of instructional leadership: How successful principals promote teach-
ing and learning. Corwin Pr.
Blase, J., & Kirby, P. (2008). Bringing out the best in teachers: What effective principals do.
Corwin Pr.
Bourdieu, P. (1973). Cultural reproduction and social reproduction. Knowledge education and
cultural change papers in the sociology of education, 10(2), 71–112.
Boyd, D., Grossman, P., Lankford, H., Loeb, S., & Wyckoff, J. (2006). How changes in entry
requirements alter the teacher workforce and affect student achievement. Education Finance
and Policy, 1(2), 176–216.
Boyd, D., Lankford, H., Loeb, S., & Wyckoff, J. (2005). The draw of home: How teachers’ pref-
erences for proximity disadvantage urban schools. Journal of Policy Analysis and Management,
24(1), 113–132.
Brewer, D. J. (1996). Career paths and quit decisions: Evidence from teaching. Journal of Labor
Economics, 14(2), 313–339.
Brooks, S., & Gelman, A. (1998). General methods for monitoring convergence of iterative simu-
lations. Journal of Computational and Graphical Statistics, (pp. 434–455).
Browne-Ferrigno, T., & Muth, R. (2009). Candidates in educational leadership graduate programs.
Handbook of research on the education of school leaders, (pp. 195–244).
Bryk, A. S., Sebring, P. B., Allensworth, E., Luppescu, S., & Easton, J. Q. (2010). Organizing
schools for improvement: Lessons from Chicago. University Of Chicago Press.
72

Chetty, R., Friedman, J. N., & Rockoff, J. E. (2011). The long-term impacts of teachers: Teacher
value-added and student outcomes in adulthood. Tech. rep., National Bureau of Economic Re-
search.
URL http://www.nber.org/papers/w17699
Clotfelter, C. T., Ladd, H. F., & Vigdor, J. (2005). Who teaches whom? race and the distribution
of novice teachers. Economics of Education Review, 24(4), 377–392.
Clotfelter, C. T., Ladd, H. F., & Vigdor, J. L. (2007). Teacher credentials and student achievement:
Longitudinal analysis with student fixed effects. Economics of Education Review, 26(6), 673–
682.
Culbertson, J. A., & Farquhar, R. H. (1970). Preparing educational leaders: Recruiting and select-
ing candidates from administrative preparation. UCEA Newsletter, 12(1), 10–13.
Cullen, J. B., & Mazzeo, M. J. (2010). Implicit performance awards: An empirical analysis of the
labor market for public school administrators. Unpublished manuscript.
D’Agostino, J. V., & Powers, S. J. (2009). Predicting teacher performance with test scores and
grade point average: A meta-analysis. American Educational Research Journal, 46(1), 146–
182.
Danielson, C. (2007). Enhancing professional practice: A framework for teaching. Association
for Supervision & Curriculum Development.
Dee, T. S. (2004). Teachers, race, and student achievement in a randomized experiment. Review
of Economics and Statistics, 86(1), 195–210.
Ebmeier, H., & Hart, A. W. (1992). The effects of a career-ladder program on school organizational
process. Educational Evaluation and Policy Analysis, 14(3), 261.
73

Education Research Service (2000). The principal, keystone of a high-achieving school: Attract-
ing and keeping the leaders we need. Tech. rep., National Association of Elementary School
Principals and National Association of Secondary School Principals.
Ehrenberg, R. G., Goldhaber, D. D., & Brewer, D. J. (1995). Do teachers’ race, gender, and
ethnicity matter? evidence from the national educational longitudinal study of 1988. Industrial
and Labor Relations Review, 48(3), 547–561.
Fink, D., & Brayman, C. (2006). School leadership succession and the challenges of change.
Educational Administration Quarterly, 42(1), 62.
Fiore, T. A., & Curtin, T. R. (1997). Public and Private School Principals in the United States:
A Statistical Profile, 1987-88 to 1993-94. US Government Printing Office, Superintendent of
Documents, Mail Stop: SSOP, Washington, DC 20402-9328.
Frome, P., Lasater, B., Cooney, S., & Board, S. R. (2005). Well-qualified Teachers and High
Quality Teaching: Are They the Same?. Southern Regional Education Board.
Gates, S. M., Ringel, J. S., & Santibanez, L. (2003). Who is leading our schools? An overview of
school administrators and their careers. Rand Corp.
Gates, S. M., Ringel, J. S., Santibanez, L., Guarino, C., Ghosh-Dastidar, B., & Brown, A. (2006).
Mobility and turnover among school principals. Economics of Education review, 25(3), 289–
302.
Gelman, A., & Rubin, D. B. (1992). Inference from iterative simulation using multiple sequences.
Statistical science, 7(4), 457–472.
Glazerman, S., Mayer, D., & Decker, P. (2006). Alternative routes to teaching: The impacts of
teach for america on student achievement and other outcomes. Journal of Policy Analysis and
Management, 25(1), 75–96.
74

Goddard, R. D., Hoy, W. K., & Hoy, A. W. (2000). Collective teacher efficacy: Its meaning,
measure, and impact on student achievement. American Educational Research Journal, 37(2),
479.
Goe, L. (2007). The link between teacher quality and student outcomes: A research synthesis.
National Comprehensive Center for Teacher Quality.
Goff, P., Goldring, E., & Bickman, L. (2012). Perceptual congruence between school principals
and their faculty’s perceptions of leadership: Predicting the gap. Tech. rep., Vanderbilt Univer-
sity.
Goldhaber, D., & Anthony, E. (2007). Can teacher quality be effectively assessed? national board
certification as a signal of effective teaching. The Review of Economics and Statistics, 89(1),
134–150.
Goldhaber, D. D., & Brewer, D. J. (1997). Why don’t schools and teachers seem to matter? assess-
ing the impact of unobservables on educational productivity. The Journal of Human Resources,
32(3), 505–523.
URL http://www.jstor.org.proxy.library.vanderbilt.edu/stable/146181
Goldring, E., Porter, A., Murphy, J., Elliott, S., & Cravens, X. (2009). Assessing learning-centered
leadership: Connections to research, professional standards, and current practices. Leadership
and Policy in Schools, 8(1), 1–36.
Grissom, J. A., & Loeb, S. (2009). Triangulating principal effectiveness: How perspectives of
parents, teachers, and assistant principals identify the central importance of managerial skills.
working paper 35. National Center for Analysis of Longitudinal Data in Education Research,
(p. 56).
Guarino, C. M., Reckase, M. D., Wooldridge, J. M., Haider, K. F., Bargagliotti, A., Dieterle, S.,
Stacy, B., & Smart, F. (2011). Evaluating value-added methods for estimating teacher effects.
Working Paper.
75

Hallinger, P. (2003). Leading educational change: Reflections on the practice of instructional and
transformational leadership. Cambridge Journal of Education, 33(3), 329–352.
Hallinger, P. (2005). Instructional leadership and the school principal: A passing fancy that refuses
to fade away. Leadership and Policy in Schools, 4(3), 221–239.
Hallinger, P. (2010a). Developing instructional leadership. Developing successful leadership, (pp.
61–76).
Hallinger, P. (2010b). Methodologies for studying school leadership: A review of 25 years of
research using the principal instructional management rating scale. Educational Administration
Quarterly, forthcoming.
Hallinger, P., & Murphy, J. (1985). Assessing the instructional management behavior of principals.
The Elementary School Journal, 86(2), 217–247.
Halverson, R., Prichett, R. B., & Watson, J. G. (2007). Formative feedback systems and the new
instructional leadership. Wisconsin Center for Education Research, (p. 30).
Hanushek, E. A., Kain, J. F., & Rivkin, S. G. (2004). Why public schools lose teachers. Journal
of Human Resources, 39(2), 326.
Harris, D. (2009). Would accountability based on teacher value added be smart policy? an exam-
ination of the statistical properties and policy alternatives. Education Finance and Policy, 4(4),
319–350.
Harris, D., & Sass, T. (2009). What makes for a good teacher and who can tell? Tech. rep.,
National Center for Analysis of Longitudinal Data in Education Research.
URL http://www.urban.org/url.cfm?ID=1001431
Haycock, K., & Jerald, C. (2001). Closing the achievement gap. Educational Leadership, 58(6),
6–11.
76

Hooker, K. O. (2000). Superintendents’ perspectives on the recruitment and selection of building
level administrators. Planning and Changing, 31(3/4), 182–205.
Horng, E. L., Klasik, D., & Loeb, S. (2010). Principal’s time use and school effectiveness. Ameri-
can Journal of Education, 116(4).
Howes, C., & Pianta, R. (2011). Foundations for Teaching Excellence: Connecting Early Child-
hood Quality Rating, Professional Development, and Competency Systems in States.. Brookes
Publishing Company. PO Box 10624, Baltimore, MD 21285.
Ingersoll, R. M., & Perda, D. (2009). The mathematics and science teacher shortage: Fact and
myth. Tech. rep., Consortium for Policy Research in Education, University of Pennsylvania,
Philadelphia.
Jacob, B. A., & Lefgren, L. (2008). Can principals identify effective teachers? evidence on sub-
jective performance evaluation in education. Journal of Labor Economics, 26(1), 101–136.
Joy, L. (1998). Why are women underrepresented in public school administration? an empirical
test of promotion discrimination. Economics of Education Review, 17(2), 193–204.
Kane, T., Taylor, E., Tyler, J., & Wooten, A. (2010). Identifying effective classroom practices
using student achievement data. Tech. rep., National Bureau of Economic Research.
Kane, T. J., & Staiger, D. (2008). Estimating teacher impacts on student achievement: An experi-
mental evaluation. NBER working paper.
Kupermintz, H. (2002). Value-added assessment of teachers. School reform proposals: The re-
search evidence, (pp. 202002–101).
Lankford, H., Loeb, S., & Wyckoff, J. (2002). Teacher sorting and the plight of urban schools: A
descriptive analysis. Educational Evaluation and Policy Analysis, 24(1), 37.
Leithwood, K., Harris, A., & Hopkins, D. (2008). Seven strong claims about successful school
leadership. School Leadership & Management, 28(1), 27–42.
77

Leithwood, K., & Mascall, B. (2008). Collective leadership effects on student achievement. Edu-
cational Administration Quarterly, 44(4), 529–561.
Loeb, S., Darling-Hammond, L., & Luczak, J. (2005). How teaching conditions predict teacher
turnover in california schools. Peabody Journal of Education, 80(3), 44–70.
Loeb, S., Kalogrides, D., & Horng, E. L. (2010). Principal preferences and the uneven distribution
of principals across schools. Educational Evaluation and Policy Analysis, 32(2), 205.
Lortie, D. C. (2009). School principal: Managing in public. Chicago, IL: University of Chicago
Press.
Louis, K. S., Leithwood, K., Wahlstrom, K., Anderson, S. E., Michlin, M., Mascall, B., Gordon,
M., Strauss, T., Thomas, E., & Moore, S. (2010). Learning from leadership: Investigating the
links to improved student learning. Tech. rep., Wallace Foundation.
Marzano, R. (2007). The art and science of teaching: A comprehensive framework for effective
instruction. Ascd.
Marzano, R. (2009). Setting the record straight on “high-yield” strategies. The Phi Delta Kappan,
91(1), 30–37.
Meindl, J. R. (1998). Invited reaction: enabling visionary leadership. Human resource development
quarterly, 9(1), 21–24.
Milanowski, A. (2004). The relationship between teacher performance evaluation scores and stu-
dent achievement: Evidence from cincinnati. Peabody Journal of Education, 79(4), 33–53.
Miller, A. (2010). The causes and consequences of principal turnover. Tech. rep., Princeton
University Center for Economic Policy Studies.
Murphy, J. (1992). The Landscape of Leadership Preparation: Reframing the Education of School
Administrators.. 2455 Teller Road, Newbury Park, CA 91320: Corwin Press, Inc.
78

Murphy, J., Elliott, S., Goldring, E., & Porter, A. (2007). Leadership for learning: a research-based
model and taxonomy of behaviors 1. School Leadership and Management, 27(2), 179–201.
Murphy, J. F. (2010). The educator’s handbook for understanding and closing achievement gaps.
Corwin Press.
Muth, R., Browne-Ferrigno, T., Carr, C., & Fulmer, C. (2004). Why don’t our graduates take ad-
ministrative positions, and what’s the cost. Educational leadership: Knowing the way, showing
the way, going the way, (pp. 294–306).
Myung, J., Loeb, S., & Horng, E. (2011). Tapping the principal pipeline. Educational Administra-
tion Quarterly, 47(5), 695–727.
Neudecker, P. E. (2007). Will they lead? Teacher leaders respond to the factors which negatively
and positively influence decisions for pursuing careers in educational administration. Ph.D.
thesis, The University of Wisconsin - Madison.
Normore, A. H. (2004). Leadership success in schools: Planning, recruitment, and socialization, 8
(10). IEJLL: International Electronic Journal for Leadership in Learning, 8(0).
Odden, A. (2011). Strategic management of human capital in education. Routledge.
Papa Jr, F. C., Lankford, H., & Wyckoff, J. (2002). The attributes and career paths of principals:
Implications for improving policy. Unpublished manuscript.
Pijanowski, J. C., Hewitt, P. M., & Brady, K. P. (2009). Superintendents’ perceptions of the
principal shortage. NASSP Bulletin, 93(2), 85–95.
Player, D. (2009). Monetary returns to academic ability in the public teacher labor market. Eco-
nomics of Education Review, 28(2), 277–285.
Rammer, R. A. (2007). Call to action for superintendents: Change the way you hire principals.
The Journal of Educational Research, 101(2), 67–76.
79

Ringel, J., Gates, S., Chung, C., Brown, A., Ghosh-Dastidar, B., & CA, R. E. (2004). Career paths
of school administrators in illinois: Insights from an analysis of state data. Tech. rep., RAND.
Robinson, V. M., Lloyd, C. A., & Rowe, K. J. (2008). The impact of leadership on student out-
comes: An analysis of the differential effects of leadership types. Educational administration
quarterly, 44(5), 635.
Rockoff, J. E. (2004). The impact of individual teachers on student achievement: Evidence from
panel data. The American Economic Review, 94(2), 247–252.
URL http://www.jstor.org/stable/10.2307/3592891
Rothstein, R. (2004). The achievement gap: A broader picture. Educational Leadership, 62(3), 4.
Roza, M., Celio, M., Harvey, J., & Wishon, S. (2003). A matter of definition: Is there truly
a shortage of school principals?. Tech. rep., The Wallace Foundation, Center on Reinventing
Public Education Daniel J. Evans School of Public Affairs, University of Washington.
Rubin, D. (1987). Multiple imputation for nonresponse in surveys, vol. 519. Wiley Online Library.
Sanders, W. L., & Rivers, J. C. (1996). Cumulative and residual effects of teachers on future
student academic achievement. Knoxville, TN: University of Tennessee Value-Added Research
and Assessment Center.
Shen, J., Leslie, J. M., Spybrook, J. K., & Ma, X. (2012). Are principal background and school
process related to teacher job satisfaction? A multilevel study using schools and staffing survey
2003-04. American Educational Research Journal, 49(2), 200–230.
Smart, G., & Street, R. (2008). Who: The A Method for Hiring. Ballantine Books.
Springer, M. G. (2009). Performance incentives: Their growing impact on american k-12 educa-
tion. Brookings Institution Press, (p. 300).
80

Stark-Price, G. A., Munoz, M. A., Winter, P. A., & Petrosko, J. M. (2006). Recruiting principals
to lead low-performing schools: Effects on job attractiveness. Journal of Personnel Evaluation
in Education, 19(1), 69–83.
Stronge, J., Ward, T., Tucker, P., & Hindman, J. (2007). What is the relationship between teacher
quality and student achievement? an exploratory study. Journal of Personnel Evaluation in
Education, 20(3), 165–184.
Supovitz, J., Sirinides, P., & May, H. (2010). How principals and peers influence teaching and
learning. Educational Administration Quarterly, 46(1), 31.
Thrupp, M. (2001). Sociological and political concerns about school effectiveness research: Time
for a new research agenda. School Effectiveness and School Improvement, 12(1), 7–40.
Whitaker, K. S. (2003). Principal role changes and influence on principal recruitment and selection:
An international perspective. Journal of educational administration, 41(1), 37–54.
Winter, P. A., & Morgenthal, J. R. (2002). Principal recruitment in a reform environment: Ef-
fects of school achievement and school level on applicant attraction to the job. Educational
Administration Quarterly, 38(3), 319.
Wise, A. E., Darling-Hammond, L., Berry, B., Berliner, D. C., et al. (1987). Effective teacher
selection. Rand Santa Monica, CA.
Zimmerman, S. (2002). Handbook of certification requirements for school administrators. Uni-
versity Press of America.
81