primer and clinical significance of artifacts in ultrasound · pdf fileprimer and clinical...
TRANSCRIPT

Primer and Clinical Significance of
Artifacts in Ultrasound
David M. Paushter, M.D., FACR, FAIUM, FSAR
RSNA/AAPM 2015

Disclosures
I am not a physicist
I never wanted to be a physicist
I am not capable of being a physicist
I should not be presenting to physicists
I do not believe in the supposed “theory” of gravity
I will have no time for questions

ar·ti·fact also ar·te·fact (är t -f kt ) n.
1. An object produced or shaped by human craft, especially a tool,
weapon, or ornament of archaeological or historical interest.
2. Something viewed as a product of human conception or agency rather than an inherent element.
3. A structure or feature not normally present but visible as a result of an external agent or action, such as one seen in a microscopic specimen after fixation, or in an image produced by radiology or electrocardiography.
4. An inaccurate observation, effect, or result, especially one resulting from the technology used in scientific investigation or from experimental error.

IMPRESSION:
1. Discrete anechoic lesion with greatest
dimension of 2.1 cm in the superior aspect of
the right kidney may represent dilatation of a
duplicated collecting system.
2. Increased echogenicity of the superior
aspect of the right kidney may be secondary
to infection.
Never mind
Artifacts can change management of patients!

Artifacts: Things to know
Artifacts are often present in multiples.
Occur due to:
Equipment malfunction or design
Operator error
Violation of assumptions
Physical principles

Assumptions
The transmitted wave travels along a straight line path from the transducer to the object and back to the transducer
The attenuation of sound in tissue does not vary
Beam dimensions are small in both section thickness (elevational) and lateral directions
All detected echoes originate from the axis of the main beam only
All received echoes are derived from the most recently transmitted pulse
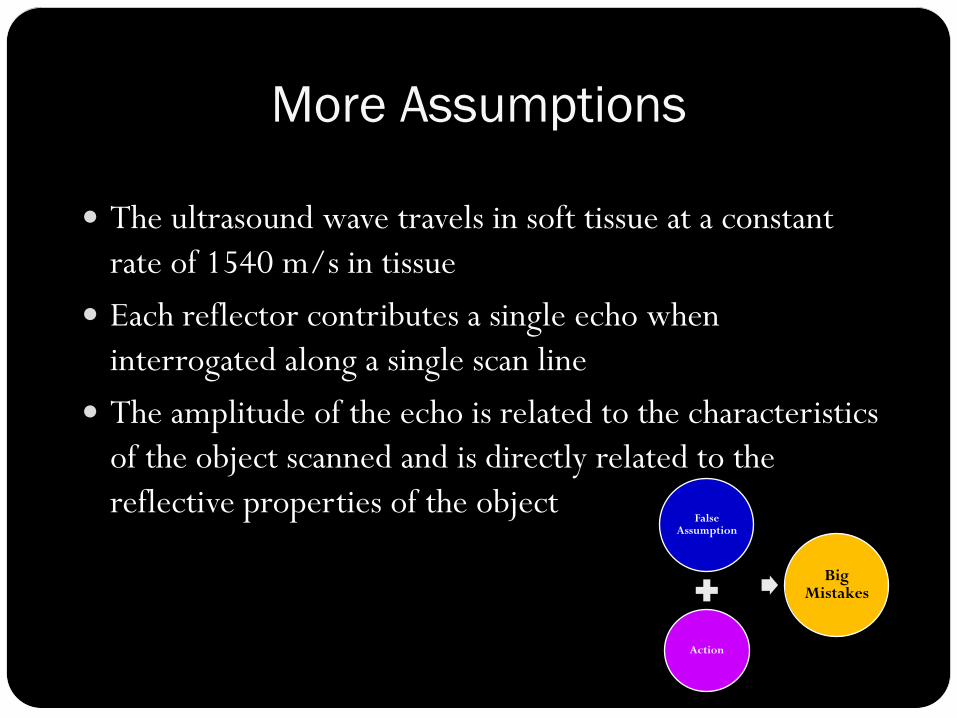
More Assumptions
The ultrasound wave travels in soft tissue at a constant
rate of 1540 m/s in tissue
Each reflector contributes a single echo when
interrogated along a single scan line
The amplitude of the echo is related to the characteristics
of the object scanned and is directly related to the
reflective properties of the object False
Assumption
Action
Big Mistakes

Categories of Artifacts
Image detail resolution related
Locational artifacts
Attenuation artifacts
Doppler artifacts

Resolution
Axial L
a
t
e
r
a
l
Elevational
(Beam Thickness)
(Beam Width)
(Depth, Range)
Tra
nsd
ucer

Axial Resolution
The ability to display two reflectors along the axis of the beam as distinct
SPL (mm) = # of cycles in the pulse x the wavelength
If two reflectors are closer than the SPL/2, they appear as one reflector
Higher frequency sound → better axial resolution
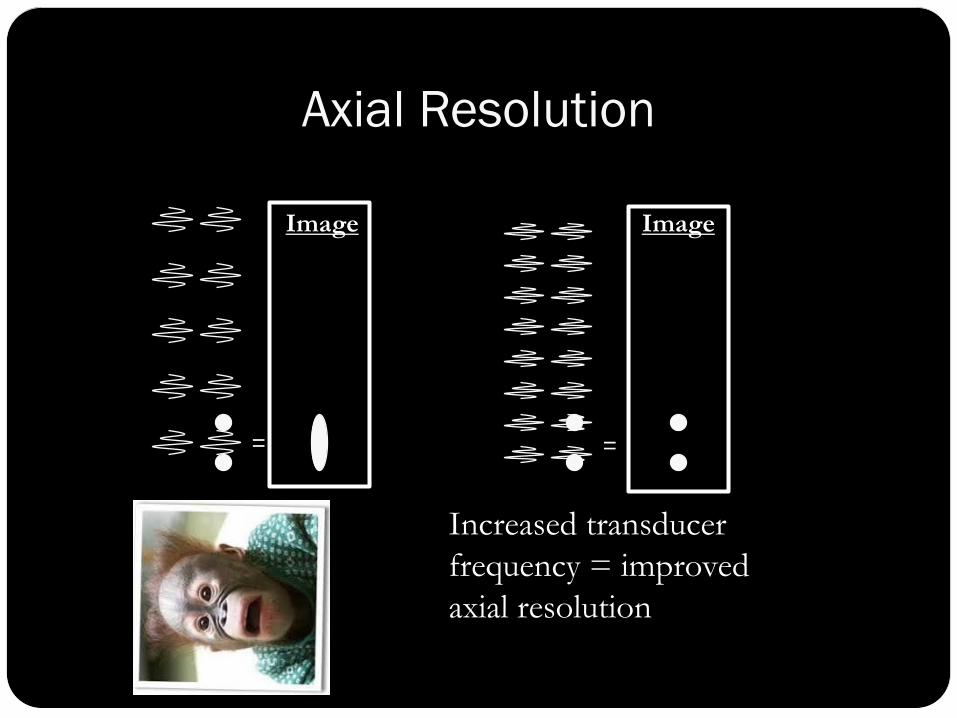
Axial Resolution
= =
Increased transducer
frequency = improved
axial resolution
Image Image

Lateral Resolution
The ability to display two adjacent reflectors as
distinct when lying perpendicular to the axis of the
beam
Related to the width of the sound beam which can
be altered with focusing
If two reflectors lying side-by-side are insonated at
the same time, due to the width of the sound beam,
they will appear as one reflector


Elevational Resolution
Determined by the thickness of the imaging plane
Measured in a direction perpendicular to the imaging plane
True reflector lies above or below the imaging plane.
May “fill in” anechoic structures

Slice Thickness Artifact
True False

Artifactual Echoes Urinary Bladder

Mass in the Bladder?
No! Bowel which is outside the main beam
Locational Artifacts
Refraction
Reverberation
Comet tail
Ringdown
Multipath
• Lobes: Side, Grating • Speed error • Range ambiguity • Mirror image

Refraction
Predicted by Snell’s Law
Requires
Oblique incidence
Different propagation speeds in the two media
)sin(
)sin(
t
i
t
i
C
C

Refraction: Types
Misregistration Improper placement
Distortion of size or shape
Defocusing Loss of beam coherence
Shadowing at the edge of large curved structures
Ghost image Duplication of a structure related to significant acoustic
impedance mismatch

Refraction: Misregistration
Real
Not Real
Object outside of primary
beam appears to reside
within the beam due to
return of refracted sound to
the transducer

Refraction/Misregistration
Apparent discontinuity
of the diaphragm due
to irregular fatty liver

Refraction: Ghost Image
Triplets?
Real
object
Refraction
Fake
object Fake
object

Apparent aortic duplication
due to refraction associated
with rectus musculature
Refraction: Ghost Image

Refraction/Defocusing
Hypo- or anechoic bands at
the edge of a curved object
Extends downward from
the curved reflector’s edge
parallel to the beam
Prevents visualization of
true anatomy
Typically seen with fluid-
filled structures

Refractile Shadow

Refraction Due to Rectus Musculature?
No! Duplication of the Inferior Vena Cava
Aorta IVC IVC
Reverberation
Additional echoes from an interface which are recorded on the image due to repeated reflections prior to reception. Only the first reflection is spatially correct Series of bright bands Parallel to sound beam’s main axis Decreasing in intensity Equidistant from each other
Echoes can appear between the transducer and a strong reflector or between two strong reflectors
Echoes may also be the result of defective equipment or improper technique

Reverberation
Echoes are
separated equally
in time (“step
ladder”) with
decreasing echo
amplitude

Reverberation

Comet Tail
A series of echoes created by multiple reflections
within a small but highly reflective object or
close reflective interfaces with acoustic
impedance mismatch
Characteristics
Single long hyperechoic echo
Parallel to the sound beam’s main axis
“Trails off ” distally. Decreased amplitude =
decreased width

Comet Tail
May arise from the near wall of the gallbladder when
crystalline deposits are present in adenomyosis
Thought to be produced by “inspisated” colloid in
thyroid nodules
Surgical clips, staples, sutures and mechanical heart
valves are common sources for comet tail artifact
May occur with gas

Comet Tail
Internal reflections give rise to multiple
echoes from an object.

Comet Tail Artifact
Cholesterol crystals in gallbladder

Comet Tail Artifact
Colloid cyst in the thyroid

Ringdown (Resonance)
Similar to comet tail artifact
Typically occurs due to the resonance
(vibration) of fluid trapped among gas bubbles
after being bombarded with ultrasound
Vibrations produce a continuous sound wave
that is transmitted to transducer

Ring-down Artifact
Gas

Multipath
Results from insonating a specular reflector at an oblique angle
Reflection angle equals the incident angle. The sound wave encounters a second
reflector which then redirects the sound wave back to the transducer
Based on a longer time of flight, a second copy of the reflector is placed artifactually deeper in the image.

Multipath
Real
object
Artifact
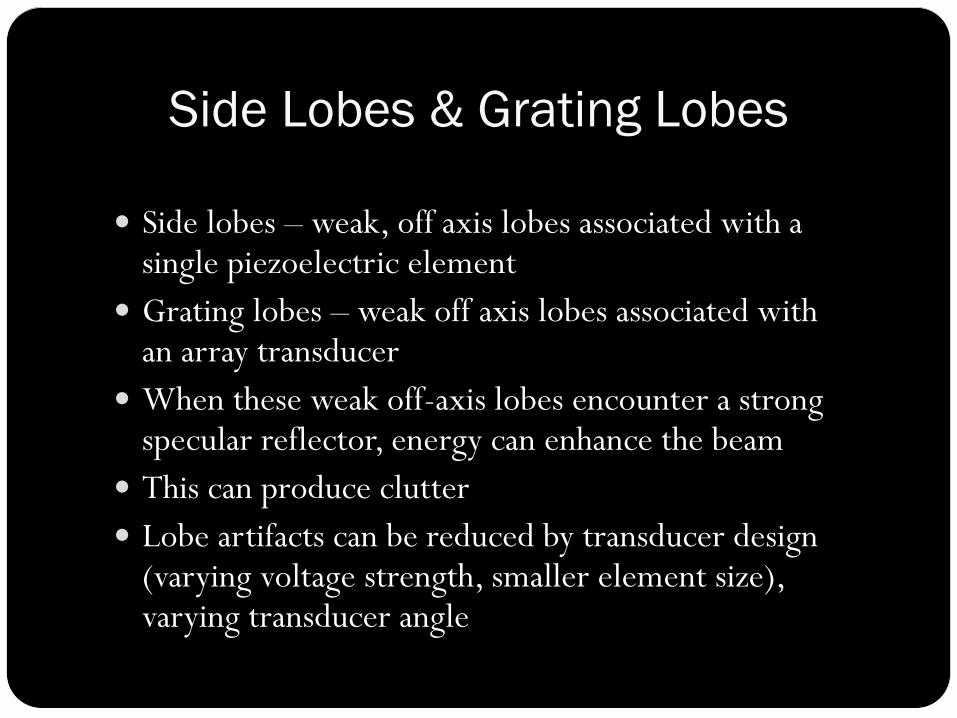
Side Lobes & Grating Lobes
Side lobes – weak, off axis lobes associated with a single piezoelectric element
Grating lobes – weak off axis lobes associated with an array transducer
When these weak off-axis lobes encounter a strong specular reflector, energy can enhance the beam
This can produce clutter
Lobe artifacts can be reduced by transducer design (varying voltage strength, smaller element size), varying transducer angle
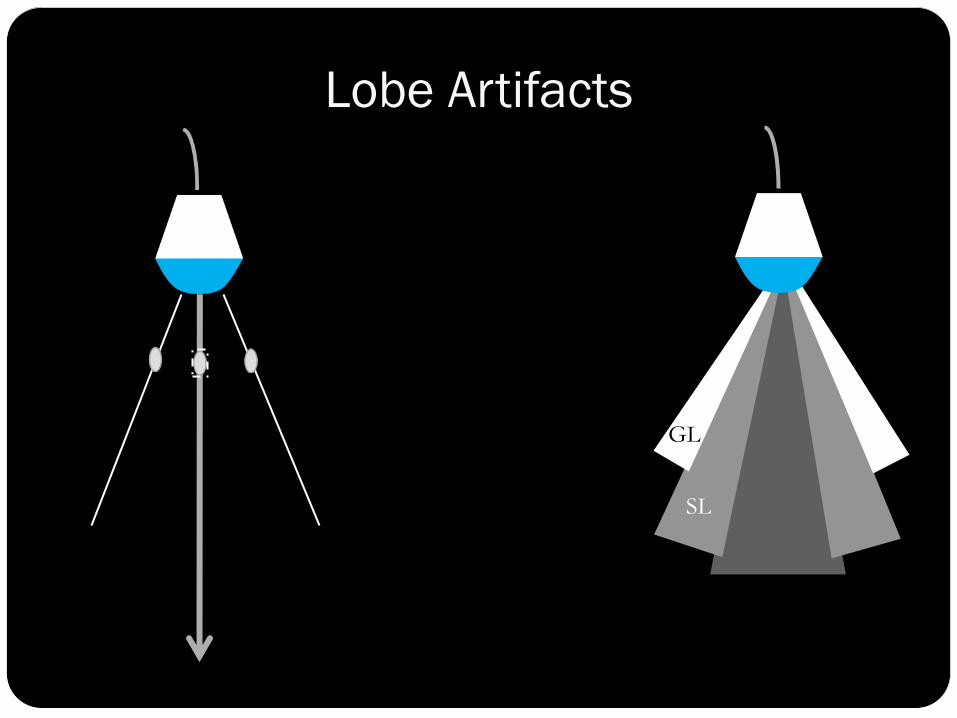
SL
GL
Lobe Artifacts

Speed Error
Traditional sonographic equipment presumes a sound propagation velocity of 1540 m/s
Reflectors will be inappropriately positioned if the propagation velocity is different
Propagation velocity >1540 m/s
Go-return time short reflector appears shallow
Propagation velocity <1540 m/s
Go-return time long reflector appears deep
Hence the development of speed of sound correction

Range Ambiguity
Shallow depth settings have short go-return times (high PRF’s)
For shallow reflectors some of the sound energy is reflected and some is transmitted
Superficial reflected sound energy arrives at the transducer before a second sound pulse is generated
Deeper (delayed) arrive at the transducer after the transmit of the new pulse
The system interprets the echoes returning from depth as being associated with the second pulse
The system places these echoes in the image near field, assuming these are early returning pulses from the second pulse
Alter depth or PRF/utilize lower frequency transducer

Mirror Image
Created as sound reflects off of a strong reflector and is
redirected toward an object
Appears as a second copy of the object which is
placed deeper on the image
Mirror is always present along a straight line between the
transducer and the artifact
True reflector and the artifact are equal distances from the
mirror
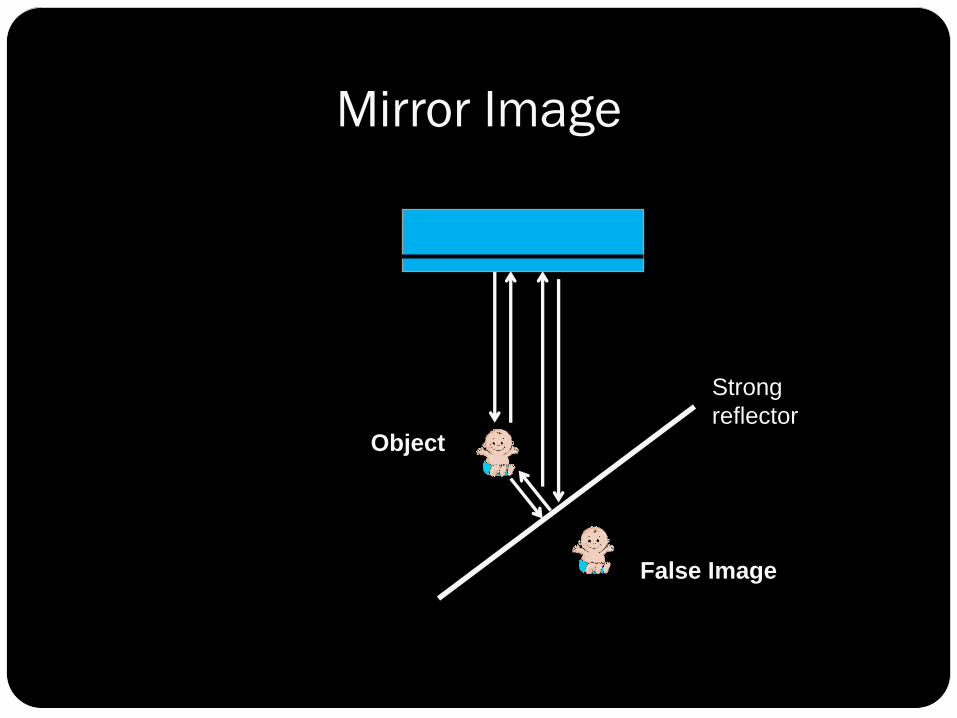
Mirror Image
False Image
Object
Strong
reflector

Mirror Image
Hepatic hemangioma is mirrored
on the opposite side of the diaphragm.

Attenuation Artifacts
Acoustic shadowing
Enhancement
Reverberation
Comet tail
Ring down
Refraction
Speckle
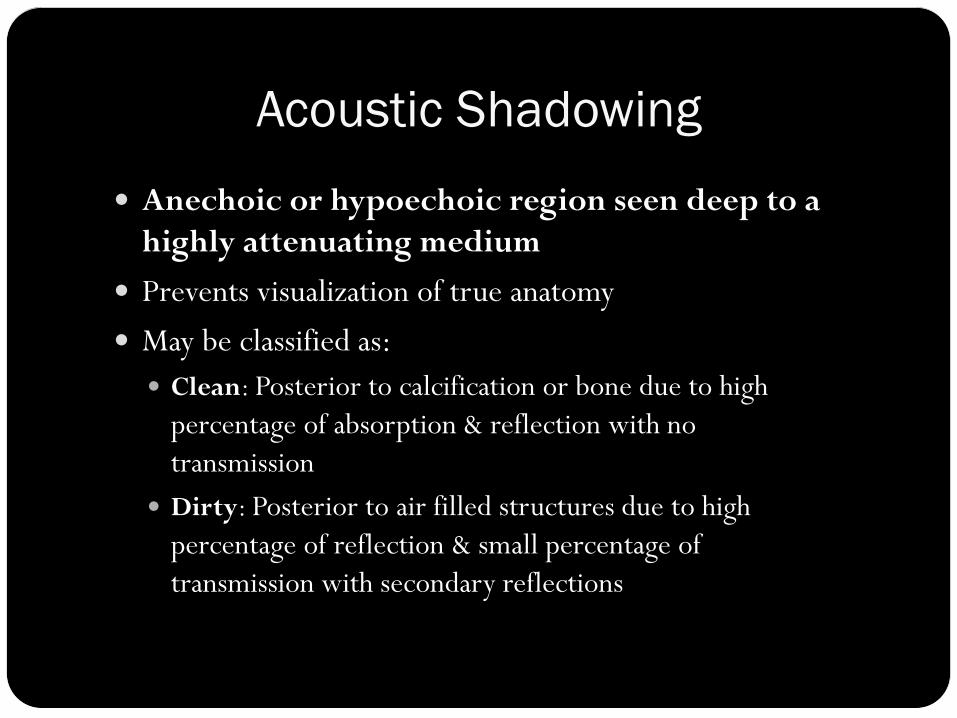
Acoustic Shadowing
Anechoic or hypoechoic region seen deep to a
highly attenuating medium
Prevents visualization of true anatomy
May be classified as:
Clean: Posterior to calcification or bone due to high
percentage of absorption & reflection with no
transmission
Dirty: Posterior to air filled structures due to high
percentage of reflection & small percentage of
transmission with secondary reflections

Acoustic Shadowing
“Clean” Shadow

If the reflector is small, shadow may
not be visible, since the beam width
may exceed the stone diameter
Adjust the focal zone to the level of
the reflector and/or increase the
frequency to improve visualization
of shadow
Acoustic Shadowing: Reflector Size

Acoustic Shadowing “Dirty” shadow due to bowel gas
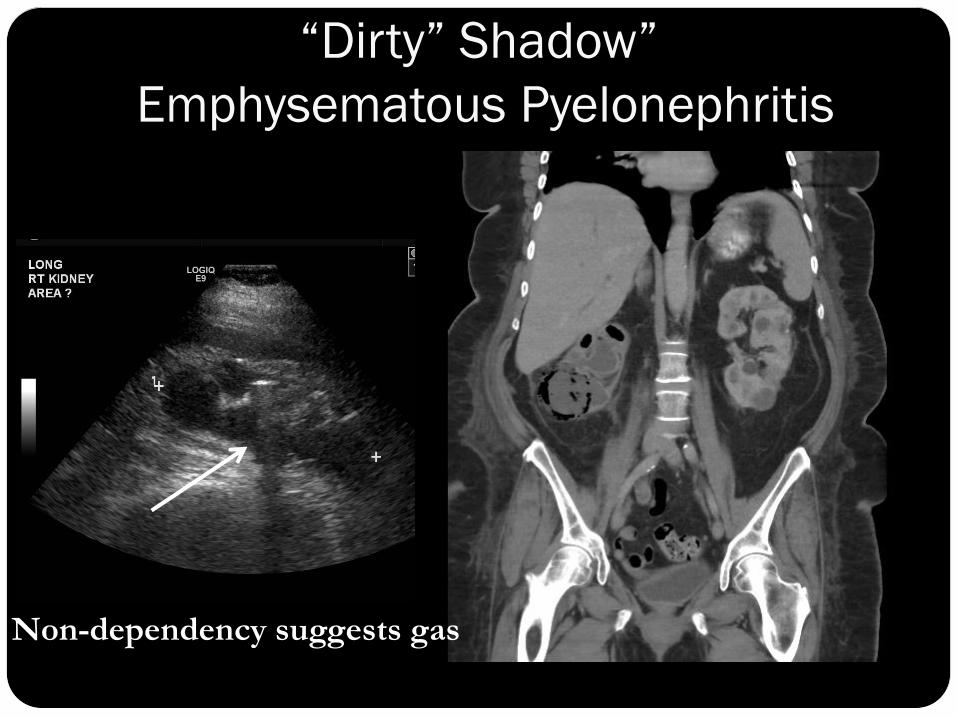
“Dirty” Shadow”
Emphysematous Pyelonephritis
Non-dependency suggests gas

All That Shadows is Not Calcium or Gas!
Angiomyolipoma
of the kidney

Embolization coils producing shadow
All That Shadows is not Gas or Ca++

Tissue Characterization:
Complexity: A Clue to Diagnosis

Fluid + Fat +Soft Tissue + Ca++ = Dermoid

Tissue Characterization
Hepatic Hemangioma?
No! Typically produces increased through transmission, not shadowing

Bladder Echoes: Real or Not?
Turn the Patient!
Supine LLD
Shifting
Debris

Acoustic Enhancement/Increased
Through Transmission
Due to lesser sound attenuation of structure
compared with surrounding tissues
Typically seen with fluid filled structures, but may
occur with homogeneous solids to a lesser degree
Hyperechoic region extending beneath an
abnormally low attenuating structure
Considered a beneficial artifact

Posterior Enhancement
Enhancement seen posterior to the gallbladder
Edge shadow

Acoustic Enhancement:
Hepatic Lymphoma
Increased through
transmission with
homogeneous solid

Focal Enhancement
Aka – Focal Banding
Side-to-side region of
increased intensity at the
focus of an image
Most notable with linear array
transducers
Decrease the artifact by
altering focal zone, increasing
# of focal zones
FZ

Speckle
Due to scattering: constructive and destructive
Associated with normal appearance of: Liver parenchyma Spleen Heart muscle Skeletal muscle Thyroid Kidney
Coarseness of speckle pattern decreases with increasing transducer frequency

Speckle: It’s What Makes a Liver a Liver
Extra credit: Name the artifact

Pancreatic Mass?
Nope!

Duplex Sonography:
Pitfalls in Abdominal Imaging

V
Whenever there is relative motion between a sound source and a reflector,
there will be a change in the frequency of the reflected sound
The Doppler Principle
ft fr
2 frv cos
ft - fr = ---------------- c
ft = transmtted frequency
fr = received frequency
c = speed of sound (1540 m/sec)
v = blood flow velocity
= Doppler angle

Duplex Sonography Combines imaging and pulsed Doppler
System oscillates between two functions
Image updated for accurate sample volume and Doppler angle
There is “competition” between system components. Each is strongest with other off
Freeze image for Doppler
Freeze Doppler for imaging
Update sparingly

Color Flow Doppler
Requires multiple, shorter pulses to produce image
Utilizes autocorrelation
Approximates multiple gates
Mean velocity only
No angle correction, but angle dependent
Color saturation, hue proportional to velocity
Less sensitive to flow than pulsed Doppler Use smallest color box
possible to increase frame rate
Answers the age old color Doppler question on flow direction: How does it know?

Power Doppler
Conventional The flow information is based on echo amplitude No velocity or directional information Very sensitive to slow flow and small vessels (higher
S/N), detects flow perpendicular to beam Very susceptible to motion (flash artifact), poor
temporal resolution
Directional Combines power (amplitude) of Doppler signal with
directional (phase) information
Long
Rt

The Doppler Equation
Larger angle
Smaller cosine
Smaller Doppler shift
Decrease apparent V
At 90 no Doppler signal
Smaller angle
Larger cosine
Larger Doppler shift
cos 2 frv cos
ft - fr = ---------------- c
0 90

Appropriate Doppler Angle: Angle
Correction Parallel to Vessel Wall
Angle Correction Not Parallel to Vessel
Walls
Apparent V Low
Angle Correction Not Parallel to Vessel
Walls
Doppler shifted frequency and therefore
calculated velocity varies with cos
If the Doppler angle is not parallel
to the vessel walls/flow stream the
calculated velocity will be in error
Effect of Incorrect Doppler
Angle on Measured Velocity

Other Doppler Parameters
Power: transmitted power into tissue (ALARA)
Gain: overall sensitivity to flow signals
Pulse repetition frequency (scale)
low pulse repetition frequency to look at low velocities
high pulse repetition frequency reduces aliasing
Gate size adjustable (spectral) and should be minimized for sampling, enlarged for “searching”
Beam steering can allow improved Doppler angle
Presets by organ/body habitus and Post-processing

Doppler and Imaging: The “Must Knows”
Doppler only recognizes flow vector that is parallel to beam (less than “true” flow)
Larger Doppler angles = smaller Doppler shifts Higher reflector (RBC) velocity = greater Doppler
shift Higher operating frequency = greater Doppler shift Duplex requires short pulses for imaging, long for
Doppler The system alternates, and produces “competition” Imaging best with Doppler frozen Doppler best with imaging frozen

For each location in window scanner determines Flow direction Mean value Variance
Window size affects frame rate larger window = slower scanning ( PRF) more Doppler pulses required
Very sensitive to slow flow and small vessels (higher S/N), detects flow perpendicular to beam
Very susceptible to motion (flash artifact), poor temporal resolution
Doppler and Imaging: The “Must Knows”
Color Doppler
and…. for Power Doppler

Duplex Sonography: Potential Pitfalls
For all Doppler studies
Inappropriate Doppler gain
Inappropriate Doppler scale
Inappropriate Doppler angle
Aliasing/Range Ambiguity
Mirroring
Wall filter
AND for color Doppler Perivascular color: tissue vibration Color assignment in moving, anechoic spaces Color bleeding: Doppler gain too high Specular reflector: highly reflective interfaces Twinkle artifact

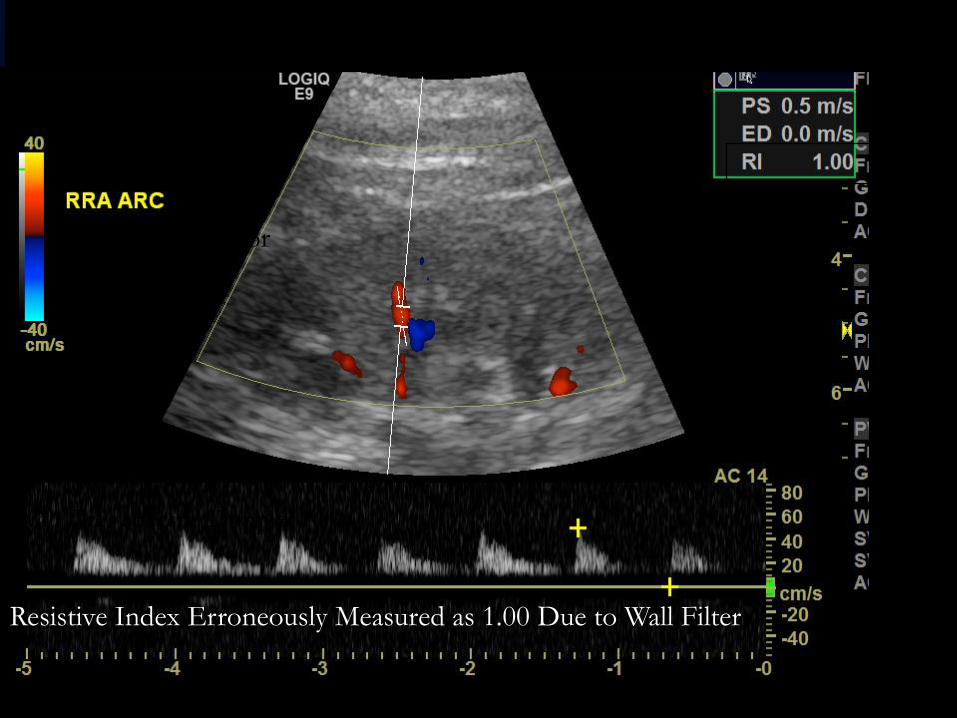
Wall Filter: Effect on Spectral Display
Filters out low frequency high amplitude shifts (high pass)
due to soft tissue (wall) motion that would overwhelm flow
Adjustable, but still may cause erroneous estimation of End
Diastolic Velocity (EDV)
Wall Filter: Low Medium High
Wall filter color
Doppler
Wall filter spectral Doppler
Resistive Index Erroneously Measured as 1.00 Due to Wall Filter

“Auto-trace” Limitations
Weak spectral signal, high wall
filter and auto-trace = Disaster
Auto-trace is a machine-
generated, time saving tool that
may improve accuracy when
spectral tracing is strong and
technically good

Spectral Scale Too High
Spectral Scale Too Low Spectral Scale “Just Right”
• Scale should allow visualization of entire
waveform with size suitable for
measurement
• High scale reduces visibility of waveform
morphology and predisposes to inaccurate
measurement
• Low scale may produce aliasing
Spectral Doppler Scale

Color Scale Too Wide: Simulates Thrombus
Color Scale Too Narrow: Aliasing Simulates
Flow Acceleration
Color Scale “Just Right”:
Gentle Shading of Color
Color Doppler Scale
• Color scale should produce gentle
shading of color due to change in blood
flow velocity or Doppler angle
• Wide scale may simulate thrombus
• Narrow scale may produce aliasing and
be mistaken for flow acceleration
Doppler Sample Volume
Spectral Doppler
Sample volume can be increased when searching for stenosis,
but should be decreased when sampling
Too large a sample volume may incorporate more than one
flow stream or vessel and average velocities
Too small may result in missing a stenotic jet
Color Doppler
Color box should be as small as possible to allow adequate
frame rate for increased Doppler sensitivity

Artery
Vein
Sample Volume Incorporates Arterial and Venous Flow

Aliasing Nyquist limit = 2x PRF (pulse repetition frequency)
Aliasing occurs when frequency exceeds the Nyquist limit Increasing the PRF or decreasing baseline will diminish
aliasing
Reducing the depth of the sample volume (gate) will allow an increase in the PRF.
Reducing the frequency of the transmitted pulse (f t ) will reduce the Doppler shifted frequency.
Decreasing the angle between the beam axis and the vessel
axis will reduce the Doppler shifted frequency
Aliasing may be a useful indicator of high-velocity flow, stenosis detection

Aliasing
Spectral aliasing produces a wrap-around effect on the Doppler
display with the peaks of the waveforms “cut off ” and displayed on the
opposite side of the baseline
Color Doppler aliasing projects the color of reversed flow
within central areas of highest velocity
True color changes from red to blue shades are etched in black and
involve the deepest shades on the color scale. This occurs due to:
Changes in the Doppler angle
Reversal of blood flow direction
Color changes caused by aliasing are not etched in black and
involve the brightest colors on the color scale

Aliasing: Peak Systole “Cut Off ”
and Displayed Below Baseline
Aliasing Corrected by Widening
the Spectral Scale
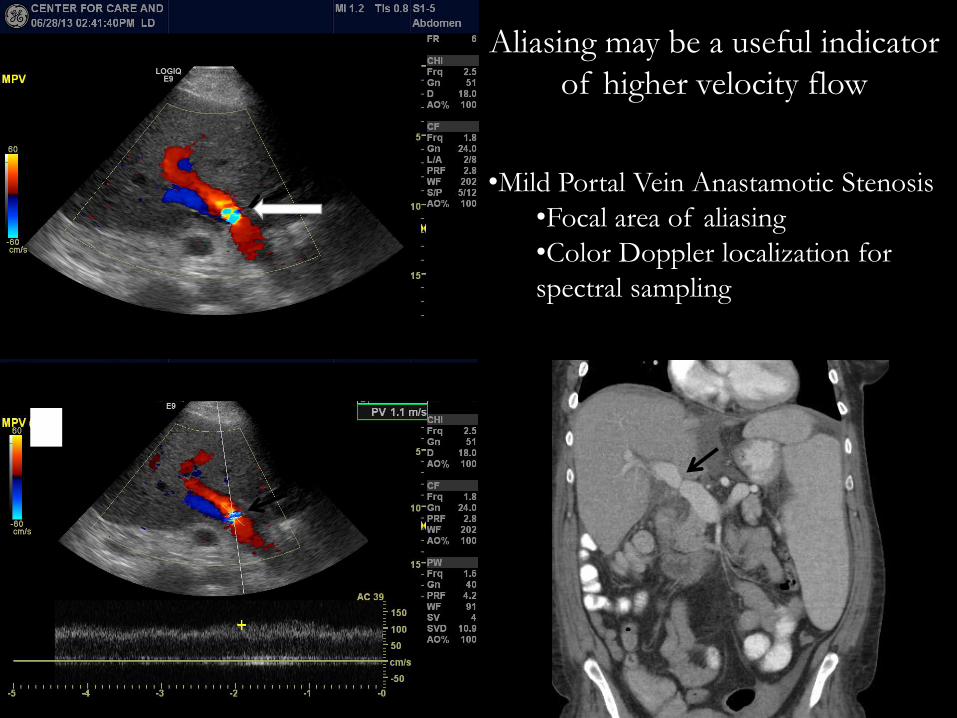
•Mild Portal Vein Anastamotic Stenosis
•Focal area of aliasing
•Color Doppler localization for
spectral sampling
Aliasing may be a useful indicator
of higher velocity flow

Perivascular Tissue Artifact = Visible Bruit
Tissue vibration artifact is produced by turbulence and may provide
clue to disease
• severe stenosis
• arteriovenous fistulas
• shunts
AVF with Pseudoaneurysm
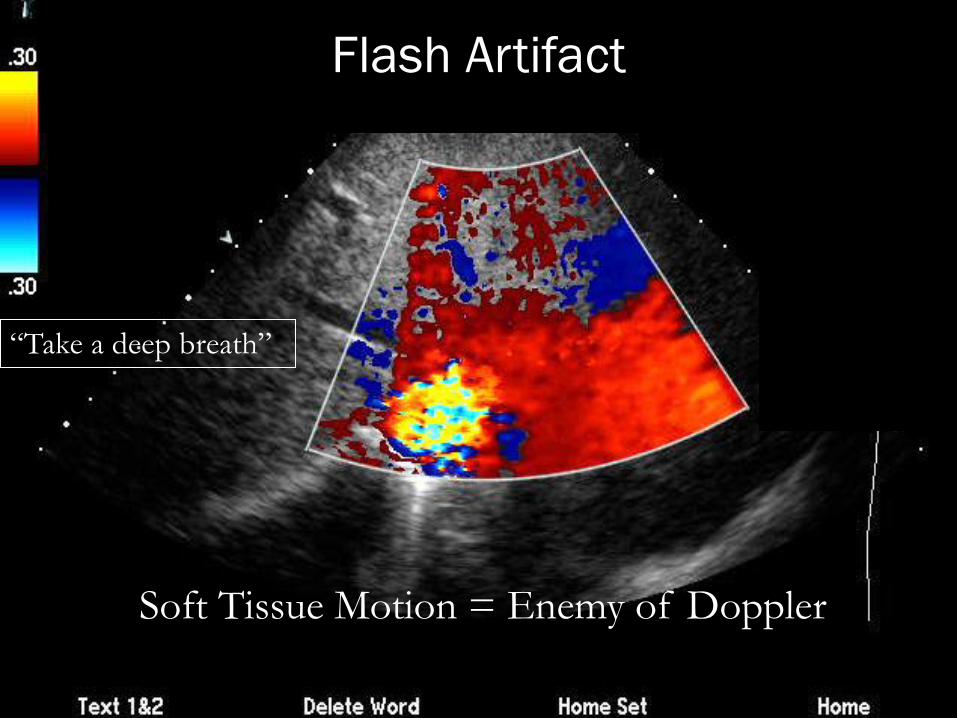
Soft Tissue Motion = Enemy of Doppler
“Take a deep breath”
Flash Artifact

Assignment of Color to (Moving) Anechoic Spaces:
Flash Artifact Will NOT Produce a Spectral Tracing
Hydronephrosis

Excessive Doppler Gain
Increase gain until small amount of
“noise” in tissues, then back it down

“Bleeding” = Overwriting
• Gray scale images a
must!
• May obscure pathology
• Decrease gain
• Adjust scale to allow
visualization of vessel
walls
Clot Obscured by Color
Clot Main Portal Vein
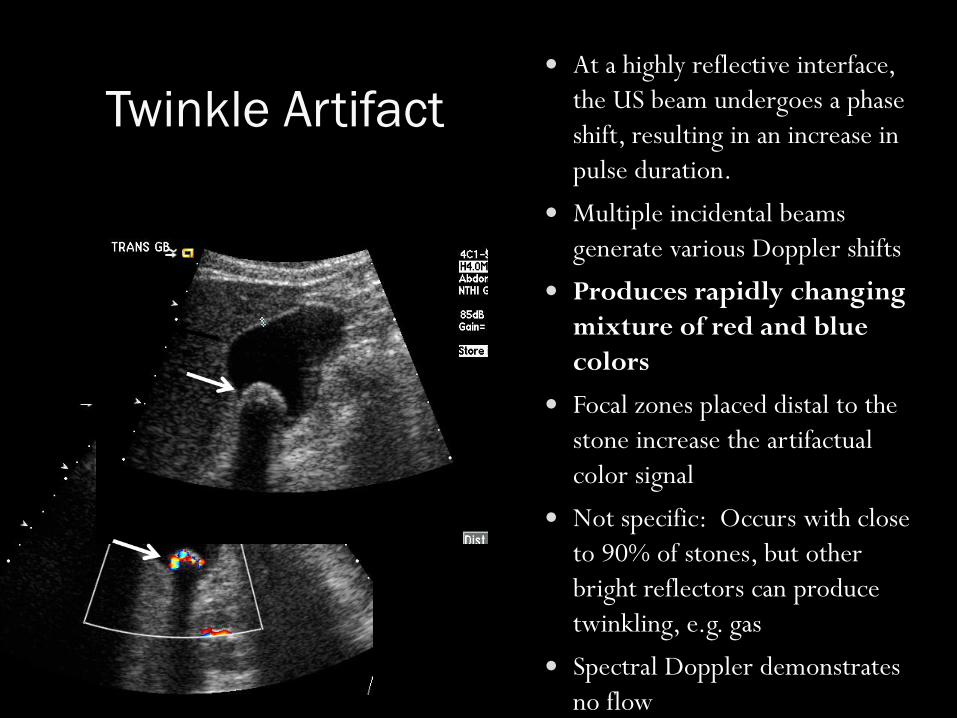
Twinkle Artifact
At a highly reflective interface,
the US beam undergoes a phase
shift, resulting in an increase in
pulse duration.
Multiple incidental beams
generate various Doppler shifts
Produces rapidly changing
mixture of red and blue
colors
Focal zones placed distal to the
stone increase the artifactual
color signal
Not specific: Occurs with close
to 90% of stones, but other
bright reflectors can produce
twinkling, e.g. gas
Spectral Doppler demonstrates
no flow
Stones
Mirror Image
Created as sound reflects off of a strong reflector and is
redirected toward an object
Appears as a second copy of the object which is
placed deeper on the image
Mirror is always present along a straight line between the
transducer and the artifact
True reflector and the artifact are equal distances from the
mirror
Doppler data also duplicated

Pleura
Subclav Rt
Mirror Image: Imaging and Doppler
Rt Sub Long Rt Sub Long

Blood flows
away from
transducer
• Electronic duplication:
gain set too high
• True sensing: too large
of a Doppler gate:
beam covers flow in
both directions from
same vessel
• Decrease gain
• Decrease gate size
Spectral Duplication: Mirror Image
Appears on Opposite Side of Baseline
Paushter 2014
Blood flows
towards
transducer
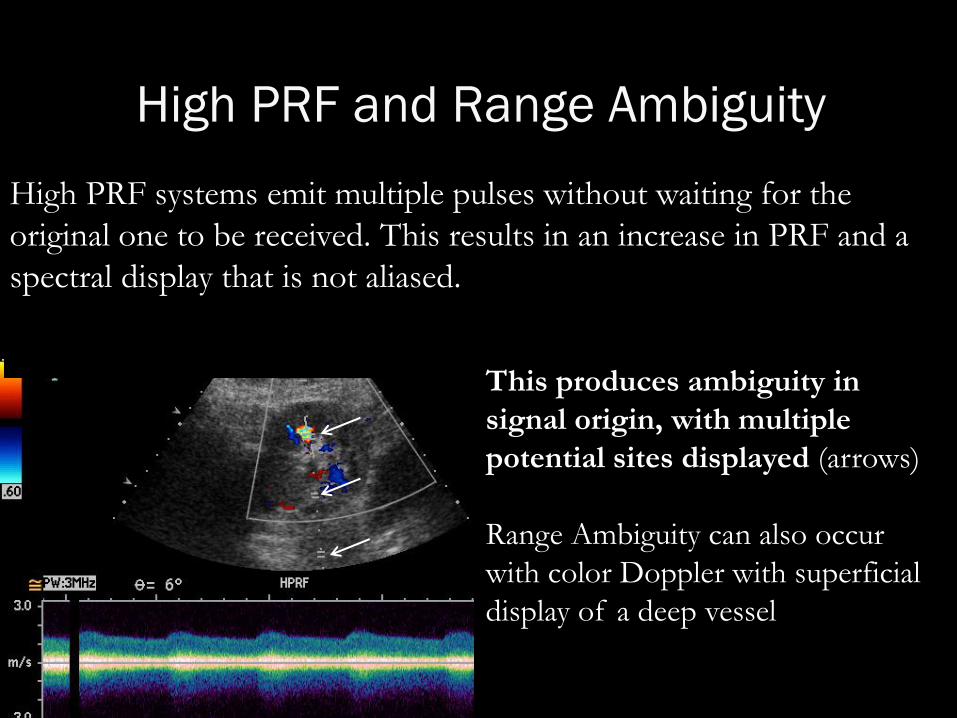
High PRF and Range Ambiguity
High PRF systems emit multiple pulses without waiting for the
original one to be received. This results in an increase in PRF and a
spectral display that is not aliased.
This produces ambiguity in
signal origin, with multiple
potential sites displayed (arrows)
Range Ambiguity can also occur
with color Doppler with superficial
display of a deep vessel

“Take Home Points”

“Take Home Points”
Smaller Doppler angles are preferred
The Doppler angle should reflect the actual flow vector
Sample volume/color box should be minimized for
interrogation
Doppler and imaging “compete” when used together
Spectral and color scales must be optimized to avoid errors
Doppler gain should be adjusted to avoid excessive signal
Artifacts related to aliasing, motion and echogenic interfaces
are common

Conclusions
Doppler artifacts are generally easily
recognizable and may provide a clue to
diagnosis if interpreted correctly
Questions or Suggestions?

Something Fishy? Consider Artifact
http://radiology.uchicago.edu/page/faculty-lectures