prices and incentives for an efficient integration of ... · prices and incentives for an efficient...
TRANSCRIPT

Lessons from the MIT Utility of the Future Study
Prices and Incentives for an Efficient Integration
of Distributed Energy Resources
Imagine Energy, December 12th, 2016 Santiago, Chile
Claudio Vergara Massachusetts Institute of Technology

Agenda
2
1. Why distributed PV and storage?
2. Getting prices and incentives right
3. Regulation of the distribution network company

Why a distributed deployment of
solar PV & energy storage?
3

4
DER adoption and its capacity to add value across the system is ultimately linked to its economics at various scales – The realities of economies of scale are well illustrated by
the variation in contemporary PV costs

5

Then why distributed? – Distributed energy resources can deliver a broad suite of
benefits to the power system, some site specific and some system wide. Locational
values may add sufficient value to justify distributed opportunity cost
6
Locational Non-locational
Power system benefits - Network capacity
- Network constraint
mitigation
- Loss reduction
- Voltage control
- Power quality
- Reliability and resiliency
- Energy (excluding losses
and congestion)
- Firm capacity
- Operating reserves
- Price suppression
- Price hedging
Other public benefits - Land use
- Employment
- Emissions mitigation
- Energy security
Source: MIT Analysis

Locational values are highly idiosyncratic – they vary tremendously across
and within a given power system. Consider the case of network capacity deferral
benefits for solar PV systems in California…
7
Network capacity benefits:
90% of feeders:
$0/kW-yr (zero)
10% of feeders:
$10/kW-yr to $60/kW-yr
1% of feeders:
>$60/kW-yr
Source: M.A. Cohen, P.A. Kauzmann, D.S. Callaway, Effects of distributed PV generation on California’s distribution system, part 2:
Economic analysis, Solar Energy, Volume 128, 2016, 139–152
Feeder-level congestion heat map across PG&E territory

8
$0
$20
$40
$60
$80
$100
Locational energyvalue: transmission
Locational energyvalue: distribution
losses
Conservation voltagereduction
Network investmentdeferral
Generation capacitypremium
Reliability Total locational value
Avera
ge
valu
e p
er
MW
h p
rod
uc
ed
24.0
5.6
11.1
41.2
2.9 0.0 84.7
Locational value of distributed solar PV – Long Island, New York, high value example

9
Locational value of distributed solar PV – Long Island, New York, average value example
$0
$2
$4
$6
$8
$10
Locational energyvalue: transmission
Locational energyvalue: distribution
losses
Conservation voltagereduction
Network investmentdeferral
Generation capacitypremium
Reliability Total locational value
Avera
ge
valu
e p
er
MW
h p
rod
uc
ed
2.3
3.1
1.7 0.0
0.9 0.0 7.9

10
Comparison of Locational Value and Incremental Cost for Solar PV Systems in New York State Example

Getting prices & charges right to let the best solutions emerge

Any cost-reflective component of prices & charges should be exclusively based on the individual
injection & withdrawal profiles at the network connection point
“Technology neutrality”
12
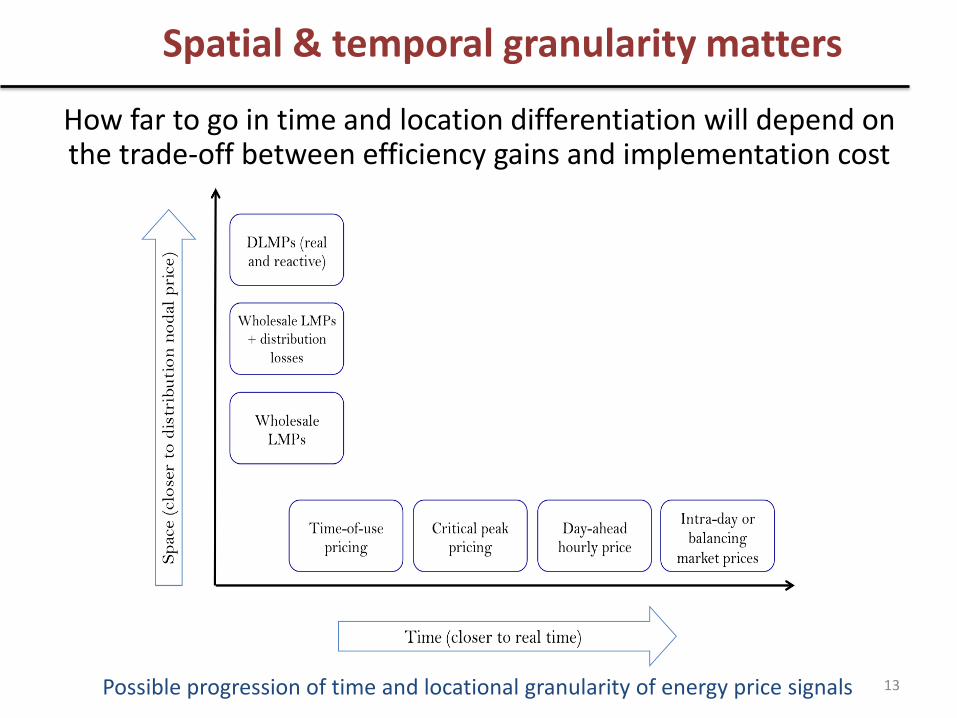
How far to go in time and location differentiation will depend on the trade-off between efficiency gains and implementation cost
Spatial & temporal granularity matters
13 Possible progression of time and locational granularity of energy price signals
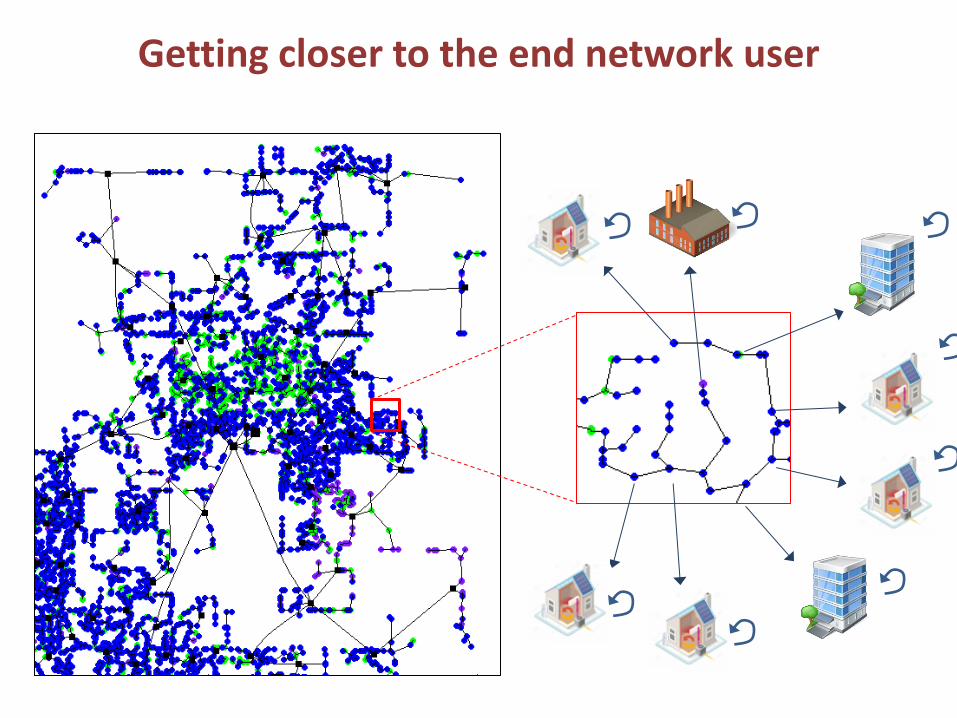
Getting closer to the end network user

• Send network users energy prices in different formats • Calculate most profitable investments in DERs • Assess impact of those investments on network conditions • DLMP = LMP + Losses + Congestion
Assessing user response to different energy prices
0
50
100
150
200
250
Month 2 Month 2 Month 3 Month 4
$/M
Wh
DLMP(@ congested node)
LMP
Flat

Congested region
Starting Conditions: Peak-hour nodal prices ($/MWh)

DER investments in response to flat rates
Solar PV
HVAC Controls
Batteries
Area of congestion

DER investments in response to bulk hourly LMP
Solar PV
HVAC Controls
Batteries
Area of congestion

DER investments in response to 11 kV LMP
Solar PV
HVAC Controls
Batteries
Area of congestion

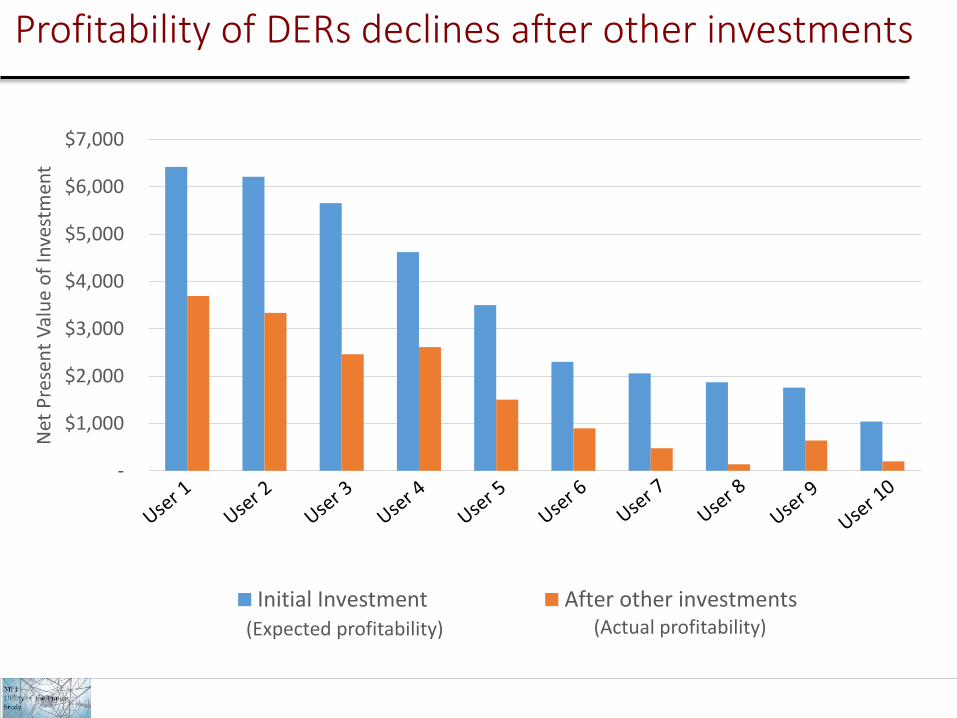
What happens to the profitability of DER investments after network constraints have been relieved?
Average DLMPs pre-DERs Average DLMPs post-DERs
DER Economics
-
$1,000
$2,000
$3,000
$4,000
$5,000
$6,000
$7,000
Net
Pre
sen
t V
alu
e o
f In
vest
men
t
Initial Investment After other investments
Profitability of DERs declines after other investments
(Expected profitability) (Actual profitability)

How to recover the cost of the
distribution network?
22

Objectives of network charges: 1) Send efficient economic signals beyond LMPs (if they exist); 2) contribute to the recovery of regulated network costs; 3) remaining regulated costs should be recovered in a minimally distortive manner (perhaps outside the tariff)
DLMPs are used to price energy
consumption/ injection at each
node.
The surplus is used to partially
recover part of the network costs.
(implicit in energy charge €/kWh)
Allocate to network users
following cost-causality
principle
€/ kW (at critical hours)
Allocate as a common good
(some “Ramsey-like”
approach)
€/ Network User
DLMP
Surplus
Total
Remaining
Network
Cost
(TRNC)
Incremental
Network
Cost (INC)
Residual
Network
Cost (RNC)
Figure: Components of network cost recovery
Getting Prices Right: Distribution network charges

Allocation of other regulated costs
24

0%
10%
20%
30%
40%
50%
60%
70%
80%
90%
100%
Belgiu
m
France
Germ
any
Italy
Neth
erland
s
Spain
UK
Califo
rnia-Sce
Co
nn
ecticut
Main
e
Massach
usse
ts
New
Jersey
New
York
Texas
Can
ada -O
ntario
Au
stralia
Brasil
% o
f el
ectr
icit
y b
ill
Wholesale Networks Other costs Taxes
Breakdown of residential electricity bills in different jurisdictions in 2014-2015
Implications for grid defection
26

Cost recovery in an era of “grid defection” — the marginal cost to customers of “grid defection” creates an upper limit on the recovery of regulated and policy costs via fixed charges
Getting Prices Right: Implications on grid defection
Distribution regulation
28

1. A forward looking revenue trajectory
• The future does not look like the past
2. Efficiency incentives via earnings sharing mechanisms
• Align utility’s business model with finding new solutions
3. Equalize incentives between OPEX and CAPEX
• Put “wires” and “non-wires” solutions on a level playing field
4. Create mechanisms to adjust for inevitable forecast errors
• Manage uncertainty, improve regulatory certainty and allocative efficiency
5. Set performance-based incentives for quality of service
• Reward utilities for delivering better service & achieving policy objectives
6. Create incentives for long-term innovation
• Accelerate learning about capabilities and diffusion of best practices
The regulated network utility business model
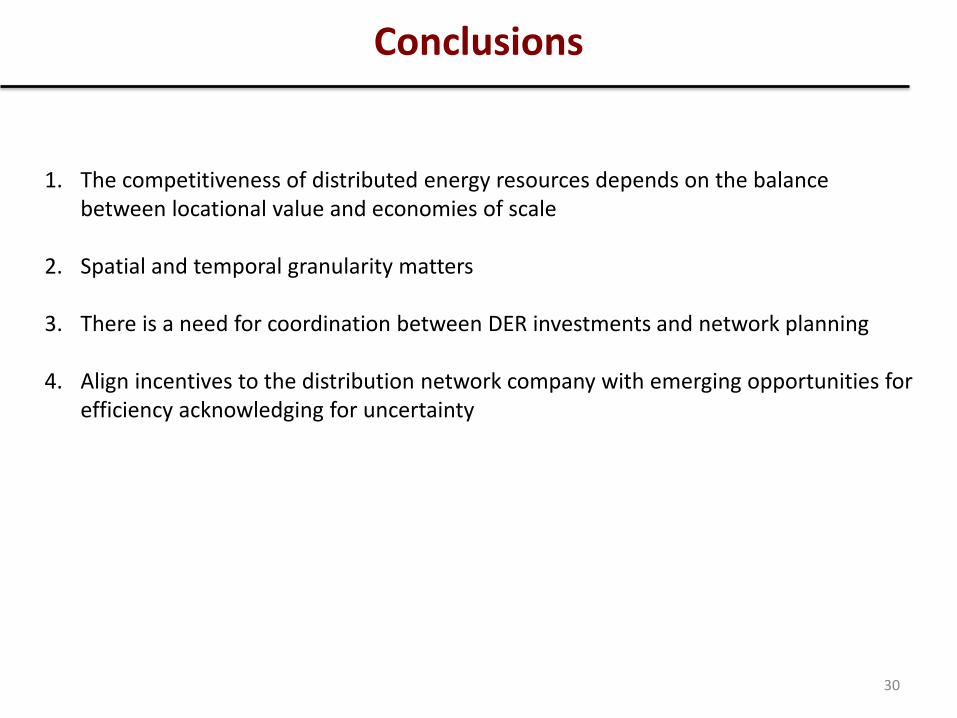
Conclusions
30
1. The competitiveness of distributed energy resources depends on the balance
between locational value and economies of scale
2. Spatial and temporal granularity matters
3. There is a need for coordination between DER investments and network planning
4. Align incentives to the distribution network company with emerging opportunities for efficiency acknowledging for uncertainty

Thank you for your attention
Stay tuned, December 15th 2016 http://energy.mit.edu/research/utility-future-study/