prices and earnings 2015 ubs
TRANSCRIPT

ab
Prices and earnings 2015Do I earn enough for the life I want?
Chief Investment Office WMSeptember 2015

Do I earn enough for the life I want?
AfricaCairo (Egypt)
Johannesburg (South Africa)
Nairobi (Kenya)
AsiaBangkok (Thailand)
Beijing (China)
Hong Kong (China)
Jakarta (Indonesia)
Kuala Lumpur (Malaysia)
Manila (Philippines)
Mumbai (India)
New Delhi (India)
Seoul (South Korea)
Shanghai (China)
Taipei (Taiwan)
Tokyo (Japan)
North AmericaChicago (United States)
Los Angeles (United States)
Mexico City (Mexico)
Miami (United States)
Montreal (Canada)
New York City (United States)
Toronto (Canada)
OceaniaAuckland (New Zealand)
Sydney (Australia)
Prices and earnings 2015
Eastern EuropeBratislava (Slovakia)
Bucharest (Romania)
Budapest (Hungary)
Kiev (Ukraine)
Ljubljana (Slovenia)
Moscow (Russia)
Prague (Czech Republic)
Riga (Latvia)
Sofia (Bulgaria)
Tallinn (Estonia)
Vilnius (Lithuania)
Warsaw (Poland)
Middle EastDoha (Qatar)
Dubai (United Arab Emirates)
Istanbul (Turkey)
Manama (Bahrain)
Nicosia (Cyprus)
Tel Aviv (Israel)
South AmericaBogotá (Colombia)
Buenos Aires (Argentina)
Lima (Peru)
Rio de Janeiro (Brazil)
Santiago de Chile (Chile)
São Paulo (Brazil)
Western EuropeAmsterdam (Netherlands)
Athens (Greece)
Barcelona (Spain)
Berlin (Germany)
Brussels (Belgium)
Copenhagen (Denmark)
Dublin (Ireland)
Frankfurt (Germany)
Geneva (Switzerland)
Helsinki (Finland)
Lisbon (Portugal)
London (Great Britain)
Luxembourg (Luxembourg)
Lyon (France)
Madrid (Spain)
Milan (Italy)
Munich (Germany)
Oslo (Norway)
Paris (France)
Rome (Italy)
Stockholm (Sweden)
Vienna (Austria)
Zurich (Switzerland)
Toronto
Mexico City
São PauloRio de Janeiro
Johannesburg
Bogotá
Lima
Montreal
Chicago
Miami
Los AngelesNew York City
Santiago de ChileBuenos Aires
Nairobi
Cairo
Istanbul
Nicosia
Tel Aviv

Tokyo
Beijing Seoul
Shanghai
Taipei
Hong KongManila
Kuala Lumpur
Jakarta
Bangkok
New Delhi
Mumbai
Manama
Doha
Dubai
Sydney
Auckland
Zurich Vienna
LisbonMadrid
Dublin
Milan
Paris
Amsterdam
Brussels
Frankfurt
Geneva
Luxembourg
Lyon
Athens
London
Munich
Oslo
Berlin
Helsinki
Rome
Kiev
Bucharest
Moscow
Prague
Riga
Tallinn
Vilnius
Warsaw
Ljubljana
Sofia
Bratislava
Budapest
Copenhagen
Barcelona
Stockholm

4 Prices and earnings 2015
Contents
Editorial 5Methodology 6
OverviewPrice levels 8Wage levels 9Domestic purchasing power 10Working time required to buy… 12 Exchange rates used and inflation 14
Price comparisonTotal expenditure on goods and services 18Food 20Women’s and men’s clothing 22Household appliances 23Home electronics 24Housing 25Public transport 26Restaurants and hotels 27Services 28City breaks 30
Wage comparisonInternational wage comparison 32Taxes and social security contributions 34Working hours and vacation days 36
Appendix 38

5Prices and earnings 2015
Dear readerGlobal exchange rates moved sufficiently of late to prompt talk of a “currency war”. States and currency zones are hoping for a weak currency to generate momentum in their economies, especially in the export sector. The measures of various central banks aimed at staving off deflation are also affecting exchange rates. These circumstances make it more difficult to compare purchasing power in different currency zones.
Against this backdrop, we are particularly pleased to present you with the 16th edition of our Prices and earnings study, in which we compare purchasing power in 71 cities across the globe. Our analysis of more than 68,000 datapoints highlights the effects of political and economic events on prices and earnings, and reveals significant changes compared with the previous study three years ago.
The cities of Zurich and Geneva, for instance, have become markedly more expensive since the last study – mainly due to the Swiss National Bank‘s decision to abandon the EURCHF minimum exchange rate early this year.
Three years ago, the minimum exchange rate was set at CHF 1.20. Life in cities within the eurozone and in Tokyo, on the other hand, has become less expensive as the euro and yen have depreciated against the US dollar. And with the currencies of certain emerging markets falling significantly, price drops have been even more pronounced in those parts of the world.
Prices and earnings is now available at www.ubs.com/pricesandearnings, from the UBS Newsstand and in the iOS app. We are also launching new open data options, so you can download all raw data from the first report in 1971 to the most recent 2015 figures for free.
We would like to thank all the participants in our survey, including students, UBS employees and various people around the world who tire-lessly collected first-rate data for this report. We would also like to thank our colleagues at Com-munications & Branding and WM Innovation for their cooperation in producing this report.
We hope you find it interesting and informative reading.
Editorial
Daniel KaltChief Economist Switzerland
Andreas HöfertChief Economist
Frank-Stephan GraefProject Manager Prices and earnings
Caroline SteiblinProject Manager Prices and earnings

6 Prices and earnings 2015
Comparison of prices and earnings
Between the end of March and end of April 2015, we completed a standardized survey on prices of 122 goods and services, and earnings for 15 professions in 71 cities worldwide. The survey was conducted locally by mutually independent observers. More than 68,000 data points were collected and included in our calculations of the indi-cators in this report.
To effectively compare cities, we converted all prices and earnings in local currencies to a common currency, the US dollar (USD). Average exchange rates from the data collection period were used to minimize the effect of daily price fluctuations. The exchange rates are listed on pages 14 –15.
While we originally started the survey with 72 cities, we needed to remove Caracas, Venezuela. Due to the current complex political and economic situation in the country, with large fluctuations in inflation and exchange rates, we decided that the results for it would not represent current circumstances.
Reference basket of goodsTo make an effective comparison of purchasing power worldwide, a standardized basket of goods and services is required, even though consumer habits and preferences vary greatly. Our reference basket of 122 goods and ser-vices is based on the monthly consumption habits of a European three-person family. If products were not avail-able in some cities, or deviated too far from our parame-ters, local representative substitutes were sometimes used. To make up for the missing coverage, individual items were weighted differently as a correction. We attained a coverage level of almost 70% of the EU’s harmonized index of consumer prices (HCIP) this year.
Changes in consumer habits stemming from technological developments were accounted for by updated specifica-tions for electronic products. The iPhone 4S from 2012, for instance, was replaced with an iPhone 6. We also expanded data collection possibilities for our housing sec-tion to get a more accurate picture of local accommoda-tion worldwide. Also, the furnished four-room apartment was changed to a furnished two-room apartment.
Reference profile of working populationsAs with our prices section, we created a reference profile of 15 professions, representing the structure of the work-ing population in Europe. We included profiles of workers of varying ages, family status, work experience and educa-tion levels. To offer a fuller picture, we introduced the profession of a hospital nurse to replace the financial ana-lyst. This change affected our weighting of the other pro-fessions, a fact to consider when comparing this version of the report to those of previous years. We also expanded our social security contributions section considerably to encapsulate both employee and employer contributions, providing a more realistic cost of the global workforce.
Methodology
NoteIndividual cities by geographical region are found on the map on pages 2 – 3.
Price, earnings, index, time, and percentage figures are rounded off in most cases to improve readability. The index values are calculated on data collected in the sur-vey, relative to a reference city.
The sample size per city may not be statistically represen-tative for single data points.
Our weightings are based on Eurostat data for EU coun-tries.

Overview

8 Prices and earnings 2015
Price levels
The price level rankings reveal the relative cost of goods and services worldwide. Zurich, Geneva, and New York City have the highest prices, over 2.5 times higher than those in Bucharest, Sofia, and Kiev, with the lowest. Istan-bul, Doha, and Lyon are middle-ranking cities; prices there are somewhat closer to those of high-ranking cities than to those of lower ranked ones.
Do I live in an expensive city?
When rents are included in the price level index, almost all city indices decrease in relation to New York City, with an average decrease of 17%. Hong Kong is the only excep-tion, gaining over 5% due to high rents, and moving up 13 spots in our ranking. Rents also make New York City the most expensive city, and Sofia the least expensive. Price levels including rents show how large an impact rents have on monthly spending. Assuming similar incomes, residents of Hong Kong must allocate almost 8% more of their income to housing than those in New York City. By com-parison, residents in Zurich spend almost 8% less on rent than New York City residents.
Price levelsCities1 Excl. rent Incl. rent
Zurich 108.7 92.6 Geneva 106.1 91.8 New York City 100.0 100.0 Oslo 92.9 79.9 Copenhagen 88.0 74.3 London 84.7 79.5 Chicago 83.5 76.7 Tokyo 83.1 70.6 Auckland 82.8 67.6 Sydney 80.5 72.5 Seoul 79.2 64.2 Toronto 78.1 63.7 Milan 77.9 64.5 Stockholm 76.9 62.8 Montreal 76.2 58.9 Miami 76.1 67.7 Los Angeles 76.0 67.4 Helsinki 74.3 63.2 Hong Kong 72.9 76.8 Paris 72.6 63.8 Luxembourg 72.3 66.1 Tel Aviv 72.0 61.4 Dubai 71.1 66.1 Buenos Aires 70.4 56.1 Dublin 70.3 63.1 Taipei 67.3 62.7 Brussels 67.2 57.3 Rome 67.1 57.1 Manama 66.6 55.4 Frankfurt 65.8 55.1 Munich 65.5 56.1 Vienna 65.4 53.4 Amsterdam 65.3 55.5 Shanghai 64.9 54.3 Istanbul 64.8 53.0 Doha 64.8 61.4 Lyon 64.8 51.2 Berlin 63.3 51.3 Barcelona 63.2 50.5 Beijing 61.4 53.2 Madrid 60.6 50.4 Nicosia 60.3 48.4 Sao Paulo 59.4 49.5 Athens 58.9 47.5 Rio de Janeiro 57.9 49.2 Bangkok 57.5 46.4 Lisbon 55.5 45.3 Mexico City 54.7 46.2 Tallinn 54.4 44.0 Ljubljana 54.0 44.0 Bogotá 53.6 43.7 Jakarta 53.3 41.6 Bratislava 53.3 42.6 Santiago de Chile 52.8 44.0 Lima 52.2 42.8 Kuala Lumpur 52.0 41.2 Moscow 51.9 45.2 Manila 51.3 41.1 Vilnius 50.9 40.9 Nairobi 50.3 40.5 Warsaw 48.8 39.6 Cairo 48.1 38.7 Budapest 47.6 38.6 Johannesburg 46.6 40.5 Riga 45.8 37.1 Prague 45.6 36.4 New Delhi 45.5 36.9 Mumbai 44.9 37.2 Bucharest 43.8 34.5 Sofia 39.0 30.0 Kiev 38.1 30.3
Overview
MethodologyThe composition of our reference basket of goods and services represents the spending habits of a three-person European family. The prices of the 122 goods and ser-vices are weighted by monthly consumption. For exam-ple, we assume that a family in Europe consumes almost 15 kilos (33 pounds) of vegetables every month, but only buys a new personal computer every 2.5 years. Price level calculations are based on the cost of a basket of 122 goods and services including rent. For our index, these reference basket prices are shown as relative to our reference city, New York City. Rent values were cal-culated by weighting the prices of our three types of housing equally (see page 25 for more details).
1 Listed according to value of indexed (price level excluding rent)
* New York City = Index 100

9Prices and earnings 2015
Wagelevels
Wage levels indicate earnings worldwide. Workers in cities with high relative gross salaries (Zurich, Geneva and Lux-embourg) receive pay that is on average 19 times those in Nairobi, Jakarta and Kiev. Cities such as Tel Aviv, Barcelona and Seoul ended up in the middle of our rankings. Their workers receive nominal gross salaries a little under one-half of those living in the highest-ranking cities, but seven times those from the lowest-ranking cities.
Would I earn more in another city?
Net wages take into account deductions, and will usually shift all cities down in rankings compared to New York City. Relatively high deductions, stemming from significant social security contributions and taxes, are seen in Copen-hagen, Brussels and Milan. If one considers net instead of gross wages, wage-level ranking drops an average of 22%. Then there are cities, such as Manama, Doha and Dubai, whose net-wage index rises by an average of 16% due to comparatively lower deductions. Net wages are a good indication of expendable income: a worker in Zurich will have almost 23 times the amount of money to spend than a similar worker in Kiev.
Wage levelsCities1 Gross Net
Zurich 131.5 141.7Geneva 130.3 135.1Luxembourg 106.4 97.0New York City 100.0 100.0Miami 92.7 93.0Copenhagen 92.4 59.0Sydney 89.8 83.8Oslo 87.9 80.4Los Angeles 87.6 88.2Chicago 85.4 84.5Montreal 77.4 78.2Stockholm 76.1 63.8London 75.8 72.3Brussels 72.9 60.9Toronto 71.7 69.4Auckland 70.1 68.6Tokyo 70.1 70.5Dublin 68.8 64.2Vienna 68.5 69.7Helsinki 67.8 62.7Munich 67.8 68.3Frankfurt 66.6 67.2Amsterdam 65.3 55.4Berlin 64.0 64.6Paris 62.7 67.2Rome 60.2 54.2Nicosia 59.2 64.2Lyon 58.6 62.7Milan 58.6 53.1Barcelona 51.6 46.9Madrid 51.0 46.1Hong Kong 49.4 51.3Tel Aviv 46.5 47.2Manama 45.9 53.1Seoul 45.9 50.2Dubai 40.4 46.9Taipei 35.0 38.7Sao Paulo 34.7 38.7Ljubljana 33.8 32.8Johannesburg 32.8 30.6Doha 32.2 37.3Lisbon 31.8 32.1Athens 29.9 28.0Bratislava 28.3 27.7Rio de Janeiro 26.8 30.3Istanbul 26.4 25.8Tallinn 26.1 24.4Santiago de Chile 23.2 25.1Warsaw 23.2 22.5Buenos Aires 22.6 26.2Vilnius 21.7 21.4Moscow 21.3 21.4Prague 20.1 20.3Riga 18.2 17.0Shanghai 18.2 19.2Kuala Lumpur 17.8 20.3Bogota 17.5 20.3Bangkok 16.9 18.8Lima 16.2 18.8Budapest 15.9 15.9Bucharest 14.0 14.0Beijing 13.4 14.4Mexico City 12.1 12.9Sofia 11.5 12.2Manila 9.6 9.2Cairo 8.3 8.9Mumbai 8.3 9.2New Delhi 7.6 8.5Nairobi 6.7 6.3Jakarta 6.4 7.0Kiev 6.1 6.3
MethodologyGross hourly wages are calculated from the survey’s gross annual earnings data divided by the annual num-ber of working hours. Net hourly earnings are calculated by removing taxes, social security and other special deductions from gross annual income for each city, and dividing it by annual working hours. Hourly wages are weighted according to the distribution of our 15 profes-sions.
1 Listed according to gross value of the index
* New York City = Index 100

10 Prices and earnings 2015
Domestic purchasing power
Taken separately, price and earnings data has proven inter-esting to interpret, but, when compared, such data enables us to reach conclusions about worldwide purchas-ing power. If one takes net hourly pay as the benchmark, earners in Luxembourg have the highest purchasing power, more than 10 times greater than for earners in Jakarta, the city exhibiting the lowest purchasing power of all surveyed cities in 2015.
What are my wages actually worth?
Our basket of goods represents the monthly consumption of a three-person family in Europe. The residents of major cities in Switzerland and the USA can afford 20 and 18 baskets per year respectively, while those of Western Euro-pean cities such as London, Lyon and Oslo can buy a bas-ket every month. Our basket becomes a challenge for the inhabitants of cities in Asia and Africa (who can afford only a basket every four months, on average). This can be partly explained by differing consumption habits, but it also indicates that families in some cities need supplemen-tary incomes to support a European standard of life.
Domestic purchasing power subject to…
CitiesGross
hourly pay Net
hourly pay
Net annual income
Luxembourg 147.1 134.3 123.8Zurich 120.8 130.5 135.1Geneva 122.6 127.5 128.3Miami 121.5 122.1 122.6Los Angeles 115.1 116.0 121.1Nicosia 98.0 106.7 107.2Vienna 103.6 105.4 95.8Sydney 111.5 104.2 103.2Munich 103.2 104.0 96.9Berlin 101.9 102.8 98.5Montreal 101.4 102.6 99.1Frankfurt 101.2 102.0 97.0Chicago 102.0 101.1 111.2New York City 100.0 100.0 100.0Lyon 90.4 96.9 85.5Dublin 99.1 92.6 88.7Paris 86.5 92.4 80.2Brussels 108.4 90.9 84.5Toronto 91.5 89.1 95.7Oslo 94.4 86.6 81.7London 89.2 85.3 80.4Tokyo 84.4 85.2 94.7Amsterdam 100.0 85.1 79.6Helsinki 91.2 84.5 75.9Stockholm 98.9 82.9 79.4Auckland 84.6 82.9 89.4Rome 89.5 80.8 76.0Manama 68.6 79.6 89.5Madrid 84.0 76.2 71.4Barcelona 81.8 74.1 69.4Hong Kong 67.8 70.4 99.3Milan 75.7 68.5 62.7Copenhagen 104.8 67.2 61.8Johannesburg 70.5 66.0 66.0Dubai 56.8 65.9 78.0Tel Aviv 64.6 65.8 72.6Seoul 57.9 63.4 66.4Athens 65.9 62.3 60.7Sao Paulo 55.6 62.2 61.3Ljubljana 62.2 60.6 60.8Lisbon 59.1 59.3 56.1Doha 49.7 57.8 65.1Taipei 52.2 57.6 66.7Bratislava 55.1 53.5 53.4Rio de Janeiro 44.5 50.4 47.6Santiago de Chile 43.7 47.6 53.6Warsaw 47.5 45.9 43.7Tallinn 47.9 44.5 41.8Vilnius 42.3 41.7 38.7Moscow 40.3 40.7 36.3Istanbul 40.9 40.1 44.3Kuala Lumpur 34.2 38.8 40.7Bogotá 32.6 37.8 42.9Buenos Aires 32.2 37.4 38.4Riga 39.6 37.3 36.8Lima 31.2 36.3 38.4Prague 34.2 34.8 33.0Budapest 33.2 33.5 34.7Bangkok 29.1 32.9 39.0Bucharest 28.3 32.3 31.6Sofia 29.2 31.0 30.5Shanghai 27.9 29.6 32.9Mexico City 22.5 23.9 29.3Beijing 22.1 23.9 25.4Mumbai 18.4 20.3 25.0New Delhi 16.7 18.6 22.3Manila 18.4 17.9 18.9Cairo 16.5 17.7 20.0Kiev 16.5 16.4 16.2Nairobi 13.0 12.8 15.2Jakarta 11.7 12.8 14.6
Overview
MethodologyTo calculate the first two parts of the purchasing power indicator, we divided gross and net hourly wages for each city by the respective cost of our basket of goods, excluding rent, and indexed relative to New York City. The third part is calculated as an indexed ranking based on how many baskets a worker can purchase annually. We divided net annual income for each city by the cost of the basket (excluding rent). This indicator is sorted by the indexed purchasing power of net hourly wages. Rent prices were excluded, as their variability among the housing choices presented in our survey may lead to different rankings of cities in combined price and earnings indicators.
* New York City = Index 100
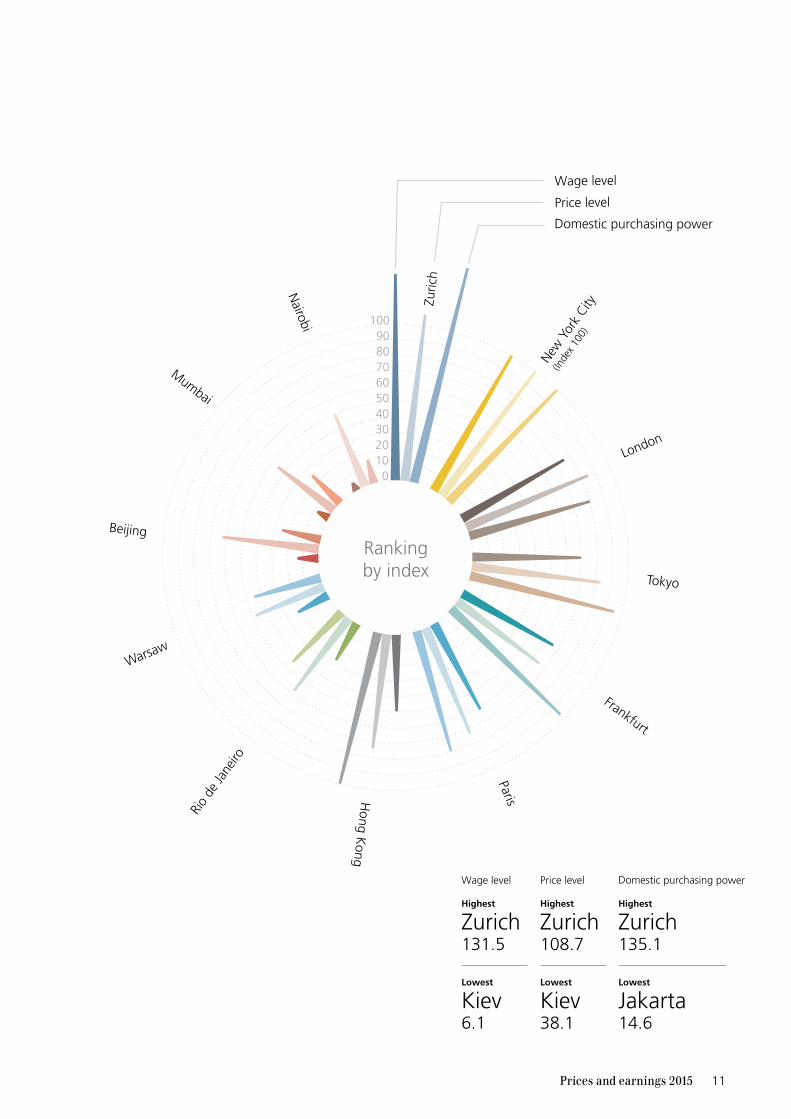
11Prices and earnings 2015
Price level
Domestic purchasing power
Wage level
Rankingby index
1009080706050403020100
Zuric
h
Mumbai
Warsaw
Nairobi
Rio
de Ja
neiro
Beijing
Frankfurt
ParisHong K
ong
Tokyo
London
New
Yor
k Ci
ty
(Inde
x 100
)
Zurich135.1
Highest
Jakarta14.6
Lowest
Zurich108.7
Highest
Kiev38.1
Lowest
Zurich131.5
Highest
Kiev6.1
Lowest
Domestic purchasing powerPrice levelWage level

12 Prices and earnings 2015
Working time required to buy...
Some consumer goods are available all over the globe. We decided to feature four in our section that calculates how much time an average worker in each city must work to earn enough to purchase each one. As staple consumer goods, the McDonald’s Big Mac and the Apple iPhone will be the same quality and nature whether bought in Doha or Rio de Janeiro. This makes their worldwide prices and affordability comparable. Workers in Hong Kong only have to work on average nine minutes to be able to buy a Big Mac, while workers in Nairobi have to work almost three hours.
Who works harder to buy a Big Mac?
The distribution of city rankings changes according to the reference goods being bought. Oslo, in the lower half of the table for buying bread, jumps to the top for rice. Work-ers there can afford it in one-eighteenth of the time that their counterparts in New Delhi require. For the iPhone, workers in cities such as Zurich and New York City require on average less than three days on the job to be able to grab one. In contrast, workers in Kiev must labor, on aver-age, over 13 weeks to earn enough for the same phone. Workers in Buenos Aires cannot access official markets to purchase the iPhone 6 locally.
Overview
MethodologyPrices of each product were an average from all survey participants and, where possible, were compared to the manufacturers’ official local retail price. The price of each product was then divided by the net hourly wage for our 15 professions and converted to either minutes or hours.
Working time required to buy
Cities1 Big Mac
in min.1 kilo of bread
in min.1 kilo of rice
in min.1 iPhone 6
16GB, in hrs.
Amsterdam 16 7 7 49.8Athens 26 20 34 98.2Auckland 13 13 5 44.6Bangkok 37 47 17 149.6Barcelona 21 14 7 59.1Beijing 42 40 36 217.8Berlin 13 9 13 43.3Bogotá 35 18 18 143.7Bratislava 24 13 15 100.8Brussels 16 14 9 46.1Bucharest 44 11 28 219.1Budapest 44 14 20 183.7Buenos Aires 29 57 21 n.a.Cairo 62 32 66 353.4Chicago 11 10 6 28.4Copenhagen 20 13 11 54.6Doha 18 19 12 69.9Dubai 17 9 13 55.8Dublin 15 6 8 43.4Frankfurt 13 10 14 41.6Geneva 11 5 4 21.6Helsinki 16 10 10 44.4Hong Kong 9 18 13 51.9Istanbul 34 22 23 132.2Jakarta 67 70 58 468.0Johannesburg 17 10 13 86.9Kiev 55 26 44 627.2Kuala Lumpur 23 17 13 136.3Lima 38 45 15 192.2Lisbon 22 16 8 88.6Ljubljana 15 11 25 85.4London 12 6 16 41.2Los Angeles 11 10 5 27.2Luxembourg 10 12 7 28.2Lyon 16 10 12 47.2Madrid 19 13 7 60.5Manama 20 5 11 62.7Manila 87 83 34 334.2Mexico City 78 46 22 217.6Miami 11 11 7 27.0Milan 18 16 14 53.4Montreal 13 12 5 32.1Moscow 20 12 24 158.3Mumbai 40 27 49 349.4Munich 13 7 5 40.9Nairobi 173 44 62 468.0New Delhi 50 23 73 360.3New York City 11 12 16 24.0Nicosia 11 5 9 44.9Oslo 19 20 4 37.6Paris 15 10 9 42.2Prague 30 11 15 143.2Riga 34 20 26 172.5Rio de Janeiro 32 18 9 139.9Rome 18 10 14 53.7Santiago de Chile 32 15 13 130.8Sao Paulo 25 16 5 109.2Seoul 18 22 19 57.2Shanghai 35 37 25 163.8Sofia 40 14 28 231.3Stockholm 17 18 11 46.9Sydney 11 10 5 34.0Taipei 13 10 14 69.2Tallinn 29 15 12 115.5Tel Aviv 21 12 12 75.3Tokyo 10 14 10 40.5Toronto 15 12 7 37.2Vienna 12 10 6 40.0Vilnius 29 19 17 131.6Warsaw 25 20 24 141.6Zurich 11 5 5 20.6n.a. = not available

13Prices and earnings 2015
Zurich Tokyo New York City
London Frankfurt Paris
Hong Kong Rio de Janeiro Beijing
Warsaw Nairobi
20.6 hrs11 min5 min5 min
40.5 hrs10 min14 min10 min
41.2 hrs12 min6 min16 min
41.6 hrs14 min10 min13 min
24 hrs11 min12 min16 min
42.2 hrs15 min10 min9 min
51.9 hrs9 min18 min13 min
217.8 hrs42 min40 min36 min
141.6 hrs25 min20 min24 min
349.5 hrs40 min27 min49 min
Mumbai
468 hrs173 min44 min62 min
139.9 hrs32 min18 min9 min
60 hours(5 days)
60 minutes(1 hour)
1 Big Mac1 kilo of bread1 kilo of rice
1 iPhone 6 16GB

14 Prices and earnings 2015
Exchange rates used and inflation
Changing exchange rates should – in theory and in the long run – compensate for differences in inflation across countries and cities. If US inflation is 2% higher than the Eurozone’s for an extended time, the US dollar should depreciate 2% per year against the euro. However, exchange rates tend to fluctuate more than inflation differ-ences across currency areas, due to political events, eco-nomic developments, and/or monetary policy decisions by central banks. This helps to explain the relative movements of cities in our rankings.
The Swiss National Bank dropped the 1.20 EURCHF floor on January 15, 2015. The impact of this decision was still being reflected in exchange rates a few months later, when we were collecting data. The Swiss franc appreci-ated 5% against the US dollar between the beginning of the year and April. This greatly affected our indicators, as Zurich and Geneva both rose to the top in price and wage levels. Similarly, the euro had lost almost one-quarter of its value against the US dollar from mid-2014 until the end of the first quarter of 2015, which caused Eurozone cities to plunge in our price and wage-level rankings.
How stable is my currency?
The trade and financial sanctions imposed on Russia by Western Europe and the USA since the Ukraine conflict in mid-2014 has had a sizeable impact on the Russian ruble, which has lost almost 42% of its value in US dollar terms since 2012. The Ukrainian hryvnia also experienced an over 64% drop relative to the US dollar after the Ukrainian central bank stopped supporting its reserves in early 2014. This also led to 12% local inflation that year. Both Russia and Ukraine plummeted in our rankings, with Kiev now at the bottom of our price and wage-level charts.
Overview
Economic and political instability in South America greatly affected exchange rates, placing certain countries in unfa-vorable positions. The Brazilian real has depreciated almost 35% against the US dollar since 2012 due to continuously declining foreign trade. This resulted in official inflation figures of over 6% in 2013 and 2014. Countries like Argentina and Colombia faced similar fates.
The Asian scene is mixed. The Japanese yen lost value but the South Korean won appreciated versus the US dollar. Japan has yet to experience the growth promised by Abe-nomics, introduced in 2013, though inflation has risen from 0.0% in 2012 to 2.7% in 2014. The South Korean won has gained over 6% against the US dollar since 2012, with inflation falling from 2.2% in 2012 to 1.3% in 2014.

15Prices and earnings 2015
Exchange rates
Cities
Local currency
(LC)
Comparison Exchange
Value USD/LC 2015 1
USD/LC ∆%∆2015/2012 2
EUR/LC 2015 1
EUR/LC ∆%∆2015/2012 2
Amsterdam EUR 1 1.081 –16.50 1.000 –Athens EUR 1 1.081 –16.50 1.000 –Auckland NZD 1 0.759 –3.31 0.702 15.66Bangkok THB 1 0.031 –4.40 0.028 14.53Barcelona EUR 1 1.081 –16.50 1.000 –Beijing CNY 1 0.161 1.90 0.149 21.97Berlin EUR 1 1.081 –16.50 1.000 –Bogotá COP 100 0.040 –28.82 0.037 –14.57Bratislava EUR 1 1.081 –16.50 1.000 –Brussels EUR 1 1.081 –16.50 1.000 –Bucharest RON 1 0.245 –16.32 0.227 0.25Budapest HUF 100 0.361 –19.19 0.334 –3.25Buenos Aires ARS 1 0.113 –49.98 0.104 –40.04Cairo EGP 1 0.131 –20.83 0.121 –5.19Chicago USD 1 1.000 – 0.925 19.81Copenhagen DKK 1 0.145 –16.89 0.134 –0.45Doha QAR 1 0.275 0.01 0.254 19.82Dubai AED 1 0.272 –0.03 0.252 19.79Dublin EUR 1 1.081 –16.50 1.000 –Frankfurt EUR 1 1.081 –16.50 1.000 –Geneva CHF 1 1.041 –3.47 0.963 15.64Helsinki EUR 1 1.081 –16.50 1.000 –Hong Kong HKD 1 0.129 0.15 0.119 19.98Istanbul TRY 1 0.377 –32.50 0.349 –19.17Jakarta IDR 1000 0.077 –28.92 0.071 –14.85Johannesburg ZAR 1 0.083 –33.19 0.077 –19.94Kiev UAH 1 0.044 –64.39 0.041 –57.32Kuala Lumpur MYR 1 0.276 –15.41 0.255 1.33Lima PEN 1 0.321 –14.92 0.297 2.04Lisbon EUR 1 1.081 –16.50 1.000 –Ljubljana EUR 1 1.081 –16.50 1.000 –London GBP 1 1.496 –6.92 1.383 11.47Los Angeles USD 1 1.000 – 0.925 19.81Luxembourg EUR 1 1.081 –16.50 1.000 –Lyon EUR 1 1.081 –16.50 1.000 –Madrid EUR 1 1.081 –16.50 1.000 –Manama BHD 1 2.652 –0.01 2.453 19.47Manila PHP 1 0.023 –4.25 0.021 14.52Mexico City MXN 1 0.066 –11.77 0.061 5.70Miami USD 1 1.000 – 0.925 19.81Milan EUR 1 1.081 –16.50 1.000 –Montreal CAD 1 0.810 –18.92 0.749 –2.89Moscow RUB 1 0.019 –42.86 0.018 –31.50Mumbai INR 1 0.016 –14.67 0.015 1.94Munich EUR 1 1.081 –16.50 1.000 –Nairobi KES 100 1.070 –10.57 0.990 7.43New Delhi INR 1 0.016 –14.67 0.015 1.94New York City USD 1 1.000 – 0.925 19.81Nicosia EUR 1 1.081 –16.50 1.000 –Oslo NOK 1 0.127 –25.75 0.117 –11.12Paris EUR 1 1.081 –16.50 1.000 –Prague CZK 1 0.039 –23.38 0.036 –8.29Riga EUR 1 1.081 n.a.3 1.000 n.a.3
Rio de Janeiro BRL 1 0.328 –35.64 0.303 –22.94Rome EUR 1 1.081 –16.50 1.000 –Santiago de Chile CLP 100 0.163 –20.07 0.151 –4.33Sao Paulo BRL 1 0.328 –35.64 0.303 –22.94Seoul KRW 100 0.092 5.49 0.085 26.32Shanghai CNY 1 0.161 1.90 0.149 21.97Sofia BGN 1 0.553 –16.53 0.511 –0.01Stockholm SEK 1 0.116 –19.64 0.107 –3.76Sydney AUD 1 0.773 –23.35 0.715 –8.25Taipei TWD 1 0.032 –5.25 0.030 13.50Tallinn EUR 1 1.081 –16.50 1.000 –Tel Aviv ILS 1 0.254 –3.30 0.235 15.90Tokyo JPY 1 0.008 –33.23 0.008 –20.01Toronto CAD 1 0.810 –18.92 0.749 –2.89Vienna EUR 1 1.081 –16.50 1.000 –Vilnius EUR 1 1.081 n.a.4 1.000 n.a.4
Warsaw PLN 1 0.269 –11.86 0.248 5.62Zurich CHF 1 1.041 –3.47 0.963 15.64
Overview
Source: Bloomberg1 Average exchange rates
for survey period (March – April 2015)
2 Movement in exchange rate from 2012 to 2015:
appreciation of local currency (LC) +; depreciation of local currency (LC) –
3 Eurozone member since Jan. 2014
4 Eurozone member since Jan. 2015
n.a. = not available

16 Prices and earnings 2015
Inflation 2012 – 2014 1Cities 2012 2013 2014
Amsterdam 2.5 2.5 1.0Athens 1.5 –0.9 –1.3Auckland 0.9 1.3 0.8Bangkok 3.0 2.2 1.9Barcelona 2.4 1.4 –0.1Beijing 2.7 2.6 2.0Berlin 2.0 1.5 0.9Bogotá 3.2 2.0 2.9Bratislava 3.6 1.4 –0.1Brussels 2.8 1.1 0.3Bucharest 3.3 4.0 1.1Budapest 5.7 1.7 –0.2Buenos Aires 2 10.8 10.9 23.9Cairo 7.1 9.4 10.1Chicago 2.1 1.5 1.6Copenhagen 2.4 0.8 0.6Doha 1.9 3.1 3.1Dubai 0.7 1.1 2.3Dublin 1.7 0.5 0.2Frankfurt 2.0 1.5 0.9Geneva –0.7 –0.2 0.0Helsinki 2.8 1.5 1.0Hong Kong 4.1 4.4 4.4Istanbul 8.9 7.5 8.9Jakarta 4.3 6.4 6.4Johannesburg 5.7 5.4 6.4Kiev 0.6 –0.3 12.2Kuala Lumpur 1.7 2.1 3.1Lima 3.7 2.8 3.2Lisbon 2.8 0.3 –0.3Ljubljana 2.6 1.8 0.2London 2.8 2.6 1.5Los Angeles 2.1 1.5 1.6Luxembourg 2.7 1.7 0.6Lyon 2.0 0.9 0.5Madrid 2.4 1.4 –0.1Manama 2.8 3.2 2.8Manila 3.2 3.0 4.1Mexico City 4.1 3.8 4.0Miami 2.1 1.5 1.6Milan 3.0 1.2 0.2Montreal 1.5 0.9 1.9Moscow 5.1 6.8 7.8Mumbai 9.3 10.9 6.4Munich 2.0 1.5 0.9Nairobi 9.4 5.7 6.9New Delhi 9.3 10.9 6.4New York City 2.1 1.5 1.6Nicosia 2.4 –0.4 –1.4Oslo 0.7 2.1 2.0Paris 2.0 0.9 0.5Prague 3.3 1.4 0.3Riga 2.2 0.0 0.6Rio de Janeiro 5.4 6.2 6.3Rome 3.0 1.2 0.2Santiago de Chile 3.0 1.8 4.4Sao Paulo 5.4 6.2 6.3Seoul 2.2 1.3 1.3Shanghai 2.7 2.6 2.0Sofia 3.0 0.9 –1.4Stockholm 0.9 0.0 –0.2Sydney 1.8 2.4 2.5Taipei 2 1.9 0.8 1.2Tallinn 3.9 2.8 –0.1Tel Aviv 1.7 1.5 0.5Tokyo 0.0 0.4 2.7Toronto 1.5 0.9 1.9Vienna 2.5 2.0 1.6Vilnius 3.1 1.1 0.1Warsaw 3.6 1.0 0.1Zurich –0.7 –0.2 0.0
Overview
Source: World Bank, International Monetary Fund
1 Annual change of average consumer prices (in percent)
2 Source: National statistical office

Price comparison

18 Prices and earnings 2015
Total expenditure on goods and services
Price comparison
Total expenditure on goods and services aims to measure the average cost of living in each of the surveyed cities, and the results are astounding. Zurich, the most expensive city in our survey, has a cost of living 185% higher than that of Kiev, our least expensive city. Expenditure in mid-dle-ranking cities such as Shanghai, Berlin, and São Paulo is on average 75% less than that in Zurich, and 60% more than in Kiev.
What is the cost of living?
The differences in prices between goods and services are significant. Non-tradable items, or items whose quality differs greatly with geographic location, such as haircuts, schooling and hotel rooms, have the greatest range in prices among cities. For example, the price of a haircut in Oslo (most expensive) is twenty times higher than in Jakarta (least expensive). Among tradable goods, such as rice, an iPhone, or a women’s dress suit, the price differ-ence is much less – rice is only seven times more expensive in New York City than in São Paulo, where prices are the highest and lowest, respectively.
MethodologyTotal expenditure calculations are based on the cost of a basket of 122 goods and services, and weighted accord-ing to the monthly spending habits of a three-person European family. The weighted price levels are then indexed to our reference city, New York City. Prices for goods and services were converted to USD by exchange rates found on pages 14 – 15.
Total expenditure on goods and services
Cities USD 1 Index
Amsterdam 2,182 65.3Athens 1,970 58.9Auckland 2,766 82.8Bangkok 1,923 57.5Barcelona 2,112 63.2Beijing 2,052 61.4Berlin 2,117 63.3Bogotá 1,791 53.6Bratislava 1,781 53.3Brussels 2,245 67.2Bucharest 1,464 43.8Budapest 1,591 47.6Buenos Aires 2,352 70.4Cairo 1,606 48.1Chicago 2,792 83.5Copenhagen 2,941 88.0Doha 2,166 64.8Dubai 2,375 71.1Dublin 2,351 70.3Frankfurt 2,200 65.8Geneva 3,546 106.1Helsinki 2,485 74.3Hong Kong 2,435 72.9Istanbul 2,166 64.8Jakarta 1,783 53.3Johannesburg 1,557 46.6Kiev 1,273 38.1Kuala Lumpur 1,736 52.0Lima 1,743 52.2Lisbon 1,856 55.5Ljubljana 1,806 54.0London 2,832 84.7Los Angeles 2,540 76.0Luxembourg 2,418 72.3Lyon 2,165 64.8Madrid 2,024 60.6Manama 2,227 66.6Manila 1,714 51.3Mexico City 1,829 54.7Miami 2,542 76.1Milan 2,603 77.9Montreal 2,548 76.2Moscow 1,735 51.9Mumbai 1,500 44.9Munich 2,189 65.5Nairobi 1,682 50.3New Delhi 1,520 45.5New York City* 3,342 100.0Nicosia 2,016 60.3Oslo 3,105 92.9Paris 2,426 72.6Prague 1,523 45.6Riga 1,529 45.8Rio de Janeiro 1,936 57.9Rome 2,242 67.1Santiago de Chile 1,765 52.8Sao Paulo 1,984 59.4Seoul 2,646 79.2Shanghai 2,168 64.9Sofia 1,304 39.0Stockholm 2,569 76.9Sydney 2,690 80.5Taipei 2,249 67.3Tallinn 1,819 54.4Tel Aviv 2,405 72.0Tokyo 2,776 83.1Toronto 2,609 78.1Vienna 2,187 65.4Vilnius 1,702 50.9Warsaw 1,632 48.8Zurich 3,632 108.7
1 Monthly expenditure of an average European family
* New York City = Index 100

19Prices and earnings 2015
1,500
750
2,250
0
3,000
3,750
Totalexpenditure on
goods andservices
Zuric
h
Mum
bai
Warsaw
Nairobi
Rio de Janeiro
Beijin
g
Frankfurt
Paris
Hong Kong
Tokyo
London
New
Yor
k Ci
ty
(Inde
x)
ZurichUSD 3,632
Highest
KievUSD 1,273
Lowest
Prices in USD

20 Prices and earnings 2015
Price comparison
Food
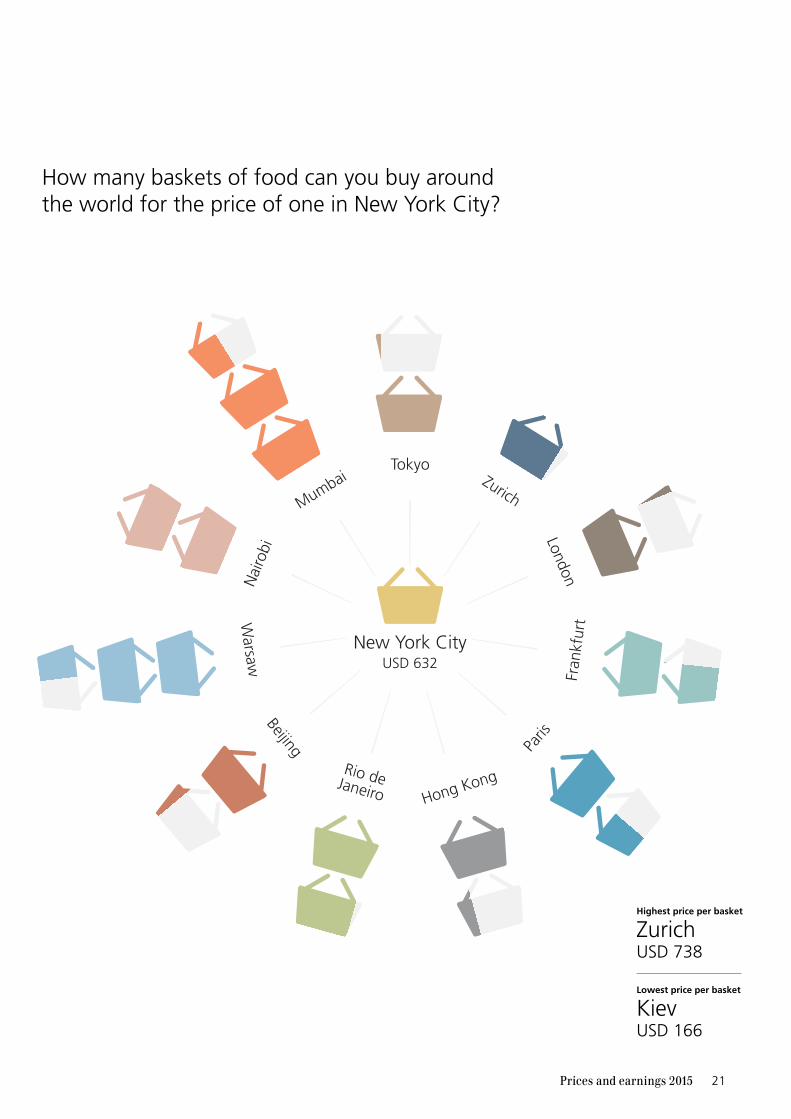
Food prices are especially useful for studies like this one. Although food products vary in quality and type, the prod-ucts chosen for the survey are similar enough everywhere to be comparable. The worldwide average price for our basket of 39 food items is almost USD 400. People living in Zurich, with the highest cost, have to pay 4.5 times more for the food in their shopping carts than those in Kiev, where costs are the lowest.
Where is the best place to shop for food?
The cost of single goods varies according to the city. Resi-dents of Zurich have to pay USD 3.50 to buy one kilo (two pounds) of bread. In Bucharest, this amount shrinks to 71 cents. Similarly, a kilo of rice costs USD 3.10 in Tokyo, but only USD 1.40 in Manila. In 55 cities, meat is on aver-age more expensive than fish. Meat lovers should flock to Kiev, where the average price for one kilo of meat is around USD 2.60, and steer clear of Zurich and Geneva, where meat is 10 times the price. Those who eat a lot of fish should go to Shanghai or Rio de Janeiro, where one kilo of fish is around USD 2.20, an eighth of the price you would pay for the same fish in Zurich.
MethodologyOur basket of food items includes staples such as bread, milk and chicken. They determine the price of our food baskets most because they are frequently consumed. So we give more weight to them in our basket than to other foodstuffs. There is a problem with this logic, though, since it assumes that global preferences will be the same as they are in Europe. A three-person family in Asia, for example, will probably not consume as much dairy and meat as a family in Europe.
Food
Cities USD Index
Amsterdam 300 47.5Athens 343 54.3Auckland 464 73.4Bangkok 518 82.0Barcelona 350 55.4Beijing 533 84.3Berlin 419 66.3Bogotá 289 45.7Bratislava 302 47.9Brussels 379 60.0Bucharest 248 39.3Budapest 289 45.8Buenos Aires 462 73.1Cairo 374 59.2Chicago 586 92.8Copenhagen 471 74.6Doha 426 67.5Dubai 461 72.9Dublin 386 61.2Frankfurt 379 60.0Geneva 623 98.6Helsinki 399 63.2Hong Kong 511 80.9Istanbul 410 65.0Jakarta 358 56.6Johannesburg 273 43.3Kiev 166 26.3Kuala Lumpur 292 46.3Lima 317 50.2Lisbon 299 47.4Ljubljana 377 59.8London 568 89.9Los Angeles 516 81.6Luxembourg 444 70.3Lyon 413 65.3Madrid 315 49.8Manama 378 59.8Manila 333 52.7Mexico City 249 39.4Miami 583 92.3Milan 405 64.2Montreal 532 84.2Moscow 336 53.3Mumbai 253 40.1Munich 390 61.7Nairobi 318 50.3New Delhi 233 36.9New York City* 632 100.0Nicosia 303 48.0Oslo 536 84.8Paris 425 67.3Prague 251 39.7Riga 253 40.0Rio de Janeiro 330 52.3Rome 393 62.3Santiago de Chile 308 48.7Sao Paulo 303 48.0Seoul 688 108.9Shanghai 518 82.1Sofia 214 33.9Stockholm 437 69.1Sydney 541 85.7Taipei 460 72.9Tallinn 270 42.8Tel Aviv 414 65.5Tokyo 582 92.2Toronto 397 62.9Vienna 443 70.1Vilnius 269 42.6Warsaw 253 40.1Zurich 738 116.8* New York City = Index 100
21Prices and earnings 2015
How many baskets of food can you buy aroundthe world for the price of one in New York City?
ZurichUSD 738
Highest price per basket
KievUSD 166
Lowest price per basket
Rio deJaneiro
Beijing
Warsaw
Mumbai
USD 632New York City
Zurich
Fran
kfur
t
Paris
London
Tokyo
Hong Kong
Nai
robi

22 Prices and earnings 2015
Price comparison
Women’s and men’s clothing
The business attire worn by men and women – usually a suit and dress shoes – is the same almost everywhere. But prices for these items vary widely across the globe. In Manila, a new wardrobe costs USD 230 on average, whereas in Chicago and Milan, both genders would have to spend over USD 1,100 for their new attire. International travelers can also get good deals in cities such as Jakarta, Kuala Lumpur, and Mumbai.
Where should I go to buy my new wardrobe? Clothing prices vary significantly between genders. On average, men’s clothes cost 30% more than women’s. Men pay the most in Geneva (more than twice the global average), and the least in Rio de Janeiro (about one-third the global average). For women, Chicago is the most expensive place to shop, at almost three times the aver-age. Auckland is the only city in our sample where the price of our clothing package is cheaper for men than women. In 64 of the surveyed cities, men’s business suits were our most expensive item, with an average cost of USD 290. Only in six cities was a woman’s individual clothing item more expensive than a man’s.
MethodologyThe price information gathered is based on purchases of good-quality clothing in large department stores, not in specialized shops or designer boutiques. The ward-robe for women includes a two-piece suit, a blazer, a dress, pantyhose and a pair of outdoor shoes. For men, the items were a business suit, a blazer, a shirt, a pair of blue jeans, socks, and a pair of outdoor shoes.
Women’s and men’s clothing
Cities
Women’sclothing
(USD)
Men’sclothing
(USD)
Index
Amsterdam 660 950 76.7Athens 590 750 63.8Auckland 650 580 58.6Bangkok 220 350 27.1Barcelona 570 840 67.1Beijing 400 630 49.0Berlin 440 620 50.5Bogotá 280 440 34.3Bratislava 220 300 24.8Brussels 440 710 54.8Bucharest 280 410 32.9Budapest 290 370 31.4Buenos Aires 510 760 60.5Cairo 250 520 36.7Chicago 1,270 1,300 122.4Copenhagen 650 790 68.6Doha 410 720 53.8Dubai 890 1,250 101.9Dublin 240 430 31.9Frankfurt 500 690 56.7Geneva 1,010 1,680 128.1Helsinki 550 1,100 78.6Hong Kong 350 480 39.5Istanbul 460 850 62.4Jakarta 170 300 22.4Johannesburg 220 390 29.0Kiev 300 370 31.9Kuala Lumpur 150 260 19.5Lima 250 300 26.2Lisbon 280 650 44.3Ljubljana 360 520 41.9London 520 680 57.1Los Angeles 650 1,090 82.9Luxembourg 640 740 65.7Lyon 380 510 42.4Madrid 480 850 63.3Manama 280 620 42.9Manila 160 260 20.0Mexico City 340 540 41.9Miami 960 1030 94.8Milan 1160 1220 113.3Montreal 500 1100 76.2Moscow 400 630 49.0Mumbai 260 430 32.9Munich 720 940 79.0Nairobi 220 450 31.9New Delhi 220 450 31.9New York City* 1,040 1,060 100.0Nicosia 590 840 68.1Oslo 350 660 48.1Paris 480 830 62.4Prague 270 350 29.5Riga 290 400 32.9Rio de Janeiro 160 240 19.0Rome 410 840 59.5Santiago de Chile 280 360 30.5Sao Paulo 350 510 41.0Seoul 900 1,070 93.8Shanghai 310 500 38.6Sofia 360 610 46.2Stockholm 550 1,280 87.1Sydney 580 580 55.2Taipei 720 860 75.2Tallinn 510 820 63.3Tel Aviv 550 720 60.5Tokyo 790 1,140 91.9Toronto 450 990 68.6Vienna 560 720 61.0Vilnius 390 720 52.9Warsaw 500 670 55.7Zurich 680 1,110 85.2* New York City = Index 100
23Prices and earnings 2015
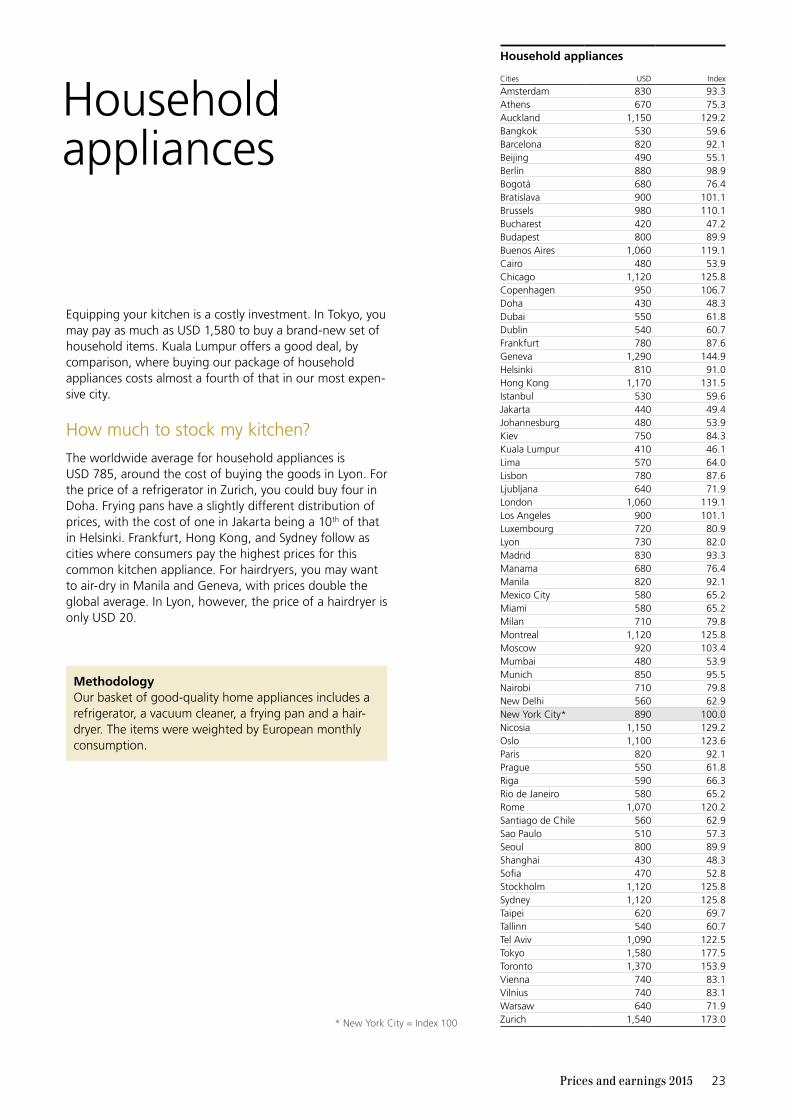
Household appliances
Equipping your kitchen is a costly investment. In Tokyo, you may pay as much as USD 1,580 to buy a brand-new set of household items. Kuala Lumpur offers a good deal, by comparison, where buying our package of household appliances costs almost a fourth of that in our most expen-sive city.
How much to stock my kitchen?
The worldwide average for household appliances is USD 785, around the cost of buying the goods in Lyon. For the price of a refrigerator in Zurich, you could buy four in Doha. Frying pans have a slightly different distribution of prices, with the cost of one in Jakarta being a 10th of that in Helsinki. Frankfurt, Hong Kong, and Sydney follow as cities where consumers pay the highest prices for this common kitchen appliance. For hairdryers, you may want to air-dry in Manila and Geneva, with prices double the global average. In Lyon, however, the price of a hairdryer is only USD 20.
MethodologyOur basket of good-quality home appliances includes a refrigerator, a vacuum cleaner, a frying pan and a hair-dryer. The items were weighted by European monthly consumption.
Household appliances
Cities USD Index
Amsterdam 830 93.3Athens 670 75.3Auckland 1,150 129.2Bangkok 530 59.6Barcelona 820 92.1Beijing 490 55.1Berlin 880 98.9Bogotá 680 76.4Bratislava 900 101.1Brussels 980 110.1Bucharest 420 47.2Budapest 800 89.9Buenos Aires 1,060 119.1Cairo 480 53.9Chicago 1,120 125.8Copenhagen 950 106.7Doha 430 48.3Dubai 550 61.8Dublin 540 60.7Frankfurt 780 87.6Geneva 1,290 144.9Helsinki 810 91.0Hong Kong 1,170 131.5Istanbul 530 59.6Jakarta 440 49.4Johannesburg 480 53.9Kiev 750 84.3Kuala Lumpur 410 46.1Lima 570 64.0Lisbon 780 87.6Ljubljana 640 71.9London 1,060 119.1Los Angeles 900 101.1Luxembourg 720 80.9Lyon 730 82.0Madrid 830 93.3Manama 680 76.4Manila 820 92.1Mexico City 580 65.2Miami 580 65.2Milan 710 79.8Montreal 1,120 125.8Moscow 920 103.4Mumbai 480 53.9Munich 850 95.5Nairobi 710 79.8New Delhi 560 62.9New York City* 890 100.0Nicosia 1,150 129.2Oslo 1,100 123.6Paris 820 92.1Prague 550 61.8Riga 590 66.3Rio de Janeiro 580 65.2Rome 1,070 120.2Santiago de Chile 560 62.9Sao Paulo 510 57.3Seoul 800 89.9Shanghai 430 48.3Sofia 470 52.8Stockholm 1,120 125.8Sydney 1,120 125.8Taipei 620 69.7Tallinn 540 60.7Tel Aviv 1,090 122.5Tokyo 1,580 177.5Toronto 1,370 153.9Vienna 740 83.1Vilnius 740 83.1Warsaw 640 71.9Zurich 1,540 173.0* New York City = Index 100
24 Prices and earnings 2015
Price comparison
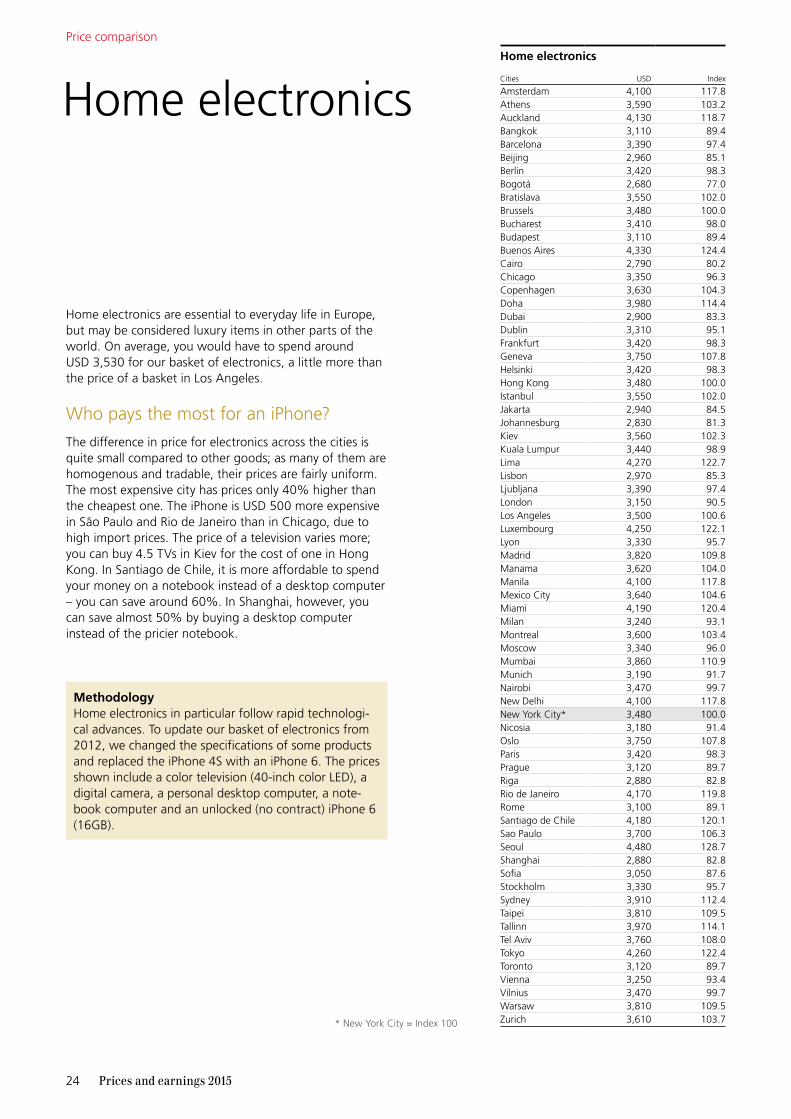
Home electronics
Home electronics are essential to everyday life in Europe, but may be considered luxury items in other parts of the world. On average, you would have to spend around USD 3,530 for our basket of electronics, a little more than the price of a basket in Los Angeles.
Who pays the most for an iPhone?
The difference in price for electronics across the cities is quite small compared to other goods; as many of them are homogenous and tradable, their prices are fairly uniform. The most expensive city has prices only 40% higher than the cheapest one. The iPhone is USD 500 more expensive in São Paulo and Rio de Janeiro than in Chicago, due to high import prices. The price of a television varies more; you can buy 4.5 TVs in Kiev for the cost of one in Hong Kong. In Santiago de Chile, it is more affordable to spend your money on a notebook instead of a desktop computer – you can save around 60%. In Shanghai, however, you can save almost 50% by buying a desktop computer instead of the pricier notebook.
MethodologyHome electronics in particular follow rapid technologi-cal advances. To update our basket of electronics from 2012, we changed the specifications of some products and replaced the iPhone 4S with an iPhone 6. The prices shown include a color television (40-inch color LED), a digital camera, a personal desktop computer, a note-book computer and an unlocked (no contract) iPhone 6 (16GB).
Home electronics
Cities USD Index
Amsterdam 4,100 117.8Athens 3,590 103.2Auckland 4,130 118.7Bangkok 3,110 89.4Barcelona 3,390 97.4Beijing 2,960 85.1Berlin 3,420 98.3Bogotá 2,680 77.0Bratislava 3,550 102.0Brussels 3,480 100.0Bucharest 3,410 98.0Budapest 3,110 89.4Buenos Aires 4,330 124.4Cairo 2,790 80.2Chicago 3,350 96.3Copenhagen 3,630 104.3Doha 3,980 114.4Dubai 2,900 83.3Dublin 3,310 95.1Frankfurt 3,420 98.3Geneva 3,750 107.8Helsinki 3,420 98.3Hong Kong 3,480 100.0Istanbul 3,550 102.0Jakarta 2,940 84.5Johannesburg 2,830 81.3Kiev 3,560 102.3Kuala Lumpur 3,440 98.9Lima 4,270 122.7Lisbon 2,970 85.3Ljubljana 3,390 97.4London 3,150 90.5Los Angeles 3,500 100.6Luxembourg 4,250 122.1Lyon 3,330 95.7Madrid 3,820 109.8Manama 3,620 104.0Manila 4,100 117.8Mexico City 3,640 104.6Miami 4,190 120.4Milan 3,240 93.1Montreal 3,600 103.4Moscow 3,340 96.0Mumbai 3,860 110.9Munich 3,190 91.7Nairobi 3,470 99.7New Delhi 4,100 117.8New York City* 3,480 100.0Nicosia 3,180 91.4Oslo 3,750 107.8Paris 3,420 98.3Prague 3,120 89.7Riga 2,880 82.8Rio de Janeiro 4,170 119.8Rome 3,100 89.1Santiago de Chile 4,180 120.1Sao Paulo 3,700 106.3Seoul 4,480 128.7Shanghai 2,880 82.8Sofia 3,050 87.6Stockholm 3,330 95.7Sydney 3,910 112.4Taipei 3,810 109.5Tallinn 3,970 114.1Tel Aviv 3,760 108.0Tokyo 4,260 122.4Toronto 3,120 89.7Vienna 3,250 93.4Vilnius 3,470 99.7Warsaw 3,810 109.5Zurich 3,610 103.7* New York City = Index 100

25Prices and earnings 2015
Housing
Housing is a basic need, and its prices depend greatly on regional preferences and demographic trends. For some cities, there is a large difference between the price to rent an apartment built to Western standards versus local ones. In Bogotá, for example, a furnished two-room apartment is 122% more expensive per month than its typical local vari-ant. On average, local rents were 20% less per month than those for Western-style apartments.
Where can I pay less rent?
A furnished two-room apartment in Hong Kong costs around USD 4,410 to rent per month – four times the monthly rent in Johannesburg. That is still not the highest though: rent in New York City costs USD 200 more per month for a similar apartment. For this price, you could rent an apartment for 17 months in Sofia. The general pic-ture is the same for unfurnished three-room apartments. In London, these cost USD 3,350 per month. For that price, you could rent two apartments, one in Amsterdam and one in Beijing.
MethodologyTo estimate the worldwide costs of housing, we consid-ered the prices for three different types of apartments. For two of these types, we standardized requirements to Western preferences, with a furnished two-room apart-ment and an unfurnished three-room apartment. We only looked at newly built apartments which with a bathroom and a kitchen. Prices included utilities (energy and water taxes), but not the use of a garage. To capture local standards, our survey asked for the price of an apartment of typical size, location, and amenities for the respective city. All three housing options were weighted equally.
Housing
Cities
Furnished 2-room
apartment
Unfurnished 3-room
apartmentNormal
local rent1
Amsterdam 1,140 1,620 1,220Athens 740 850 770Auckland 1,060 1,390 1,250Bangkok 820 1,040 500Barcelona 780 820 740Beijing 1,150 1,630 1,390Berlin 850 1,140 690Bogotá 840 1,210 380Bratislava 670 720 580Brussels 1,300 1,490 1,340Bucharest 420 610 370Budapest 620 760 640Buenos Aires 810 1,040 710Cairo 640 780 500Chicago 2,520 2,960 2,210Copenhagen 1,420 2,020 1,650Doha 2,230 2,500 2,050Dubai 2,320 3,240 1,380Dublin 1,650 2,360 1,760Frankfurt 990 1,360 1,220Geneva 2,810 2,700 1,610Helsinki 1,460 1,600 1,440Hong Kong 4,410 4,220 2,590Istanbul 890 1,080 970Jakarta 530 750 260Johannesburg 1,080 1,500 690Kiev 400 540 390Kuala Lumpur 570 630 560Lima 760 890 800Lisbon 710 1,020 760Ljubljana 760 1,080 540London 2,840 3,350 2,360Los Angeles 1,670 2,210 1,990Luxembourg 1,940 2,430 2,130Lyon 640 820 670Madrid 940 1,340 900Manama 1,120 1,470 890Manila 890 900 190Mexico City 990 1,410 770Miami 1,840 2,180 1,970Milan 1,090 1,490 1,340Montreal 640 670 590Moscow 1,080 1,540 1,020Mumbai 770 970 550Munich 1,210 1,580 1,370Nairobi 700 790 480New Delhi 570 720 640New York City 4,620 4,320 3,890Nicosia 690 950 690Oslo 1,940 2,150 1,940Paris 1,670 2,090 1,610Prague 510 630 550Riga 680 910 360Rio de Janeiro 1,380 1,540 590Rome 1,220 1,600 1,280Santiago de Chile 990 1,090 710Sao Paulo 930 1,330 910Seoul 970 1,270 1,140Shanghai 1,120 1,330 1,090Sofia 270 350 310Stockholm 1,240 1,350 880Sydney 2,050 2,940 1,780Taipei 2,030 2,740 1,840Tallinn 670 920 690Tel Aviv 1,520 1,790 1,160Tokyo 1,370 1,920 1,730Toronto 1,110 1,250 1,120Vienna 1,010 1,120 800Vilnius 590 820 550Warsaw 590 840 630Zurich 2,500 2,390 1,770
1 The figures given are values for average rent prices (monthly gross rents) for local households.

26 Prices and earnings 2015
Price comparison
Public transport
Public transport is a big expense for international travelers, since locals usually pay reduced tariffs. Getting around can be pricy – if you are planning a trip to Stockholm or Lon-don, where fares are 2.5 times above the worldwide aver-age.
Are taxis expensive everywhere?
Taking a cab in Oslo is expensive. A five-kilometer (three-mile) trip costs USD 32. For the same amount, you could travel more than 66 km (41 miles) in Cairo. Travelling by bus, tram or metro costs on average USD 1.60 worldwide per trip. In Copenhagen the cost is three times higher. In Buenos Aires though, you can travel 10 km (six miles) for less than one-third that amount. For the cost of a ticket in Copenhagen, you could travel the equivalent of 285 km (180 miles) in Kiev, almost the full distance between Lux-embourg and Paris.
Sixty-one of our cities had railway infrastructure, where a 200 km journey would cost on average USD 27. Zurich, London, and Munich stand out as the most expensive places to travel by train – with prices being at least two times the global average. For the price of a 200 km (125 mile) train ride in Geneva, you could travel an astounding 15,400 km (9,570 miles) in Manila, or the distance between Montreal and Auckland.
Public transport
Cities
Bus, Tramor Metro
(USD)Taxi
(USD)
Train
(USD)
Amsterdam 2.71 16.22 27.95Athens 1.37 5.01 15.14Auckland 3.16 19.72 40.59Bangkok 0.74 1.85 3.26Barcelona 2.32 10.25 25.37Beijing 0.48 4.42 15.59Berlin 2.89 14.78 55.14Bogotá 0.72 1.71 n.a.Bratislava 0.90 6.31 8.96Brussels 2.23 12.72 22.81Bucharest 0.46 3.31 14.26Budapest 1.26 7.28 15.15Buenos Aires 0.51 4.75 n.a.Cairo 0.22 2.40 4.59Chicago 1.92 12.75 37.00Copenhagen 4.63 15.45 49.03Doha 0.92 3.66 n.a.Dubai 1.09 6.26 n.a.Dublin 3.15 11.35 30.50Frankfurt 2.97 14.97 59.47Geneva 3.12 20.58 77.55Helsinki 2.88 15.24 33.91Hong Kong 1.28 3.65 26.23Istanbul 0.74 5.66 14.08Jakarta 0.28 2.66 8.49Johannesburg 0.79 6.34 16.67Kiev 0.16 1.59 3.28Kuala Lumpur 0.37 2.79 8.68Lima 0.74 6.42 n.a.Lisbon 1.82 8.11 23.25Ljubljana 1.53 5.51 14.03London 4.04 10.09 74.02Los Angeles 1.50 15.65 36.67Luxembourg 2.16 22.34 31.56Lyon 1.95 12.04 32.54Madrid 1.98 11.35 29.08Manama 0.80 7.96 n.a.Manila 0.45 3.00 1.01Mexico City 0.33 3.66 n.a.Miami 2.25 14.43 33.45Milan 1.62 17.30 28.58Montreal 2.63 17.57 52.08Moscow 0.88 7.88 24.60Mumbai 0.74 1.81 1.75Munich 2.92 14.02 59.83Nairobi 0.64 7.14 10.09New Delhi 0.37 1.54 10.08New York City 2.75 11.67 52.50Nicosia 1.62 8.38 n.a.Oslo 3.80 32.10 61.77Paris 1.95 12.43 43.84Prague 1.18 6.00 8.44Riga 1.30 6.74 7.78Rio de Janeiro 1.19 5.07 n.a.Rome 1.62 14.24 27.03Santiago de Chile 1.08 7.08 9.11Sao Paulo 1.12 6.48 n.a.Seoul 1.06 4.45 23.09Shanghai 0.38 3.13 12.01Sofia 0.55 3.04 7.55Stockholm 4.17 18.56 41.79Sydney 2.58 11.52 6.80Taipei 0.54 4.63 11.32Tallinn 1.73 6.54 11.79Tel Aviv 1.75 10.98 18.75Tokyo 1.47 7.31 51.77Toronto 2.43 15.88 38.46Vienna 2.34 14.42 43.36Vilnius 0.90 4.52 10.46Warsaw 0.91 5.64 13.70Zurich 3.75 27.59 73.39
MethodologyPrices of public transport are based on the price of a single ticket on a bus, tram, or subway, for a journey of approximately 10 km or at least 10 stops. Prices for a taxi include a five-kilometer ride during the day within city limits, including a service tip. Prices for a train ticket rep-resent a 2nd class single ticket for a journey of 200 km.
n.a. = not available
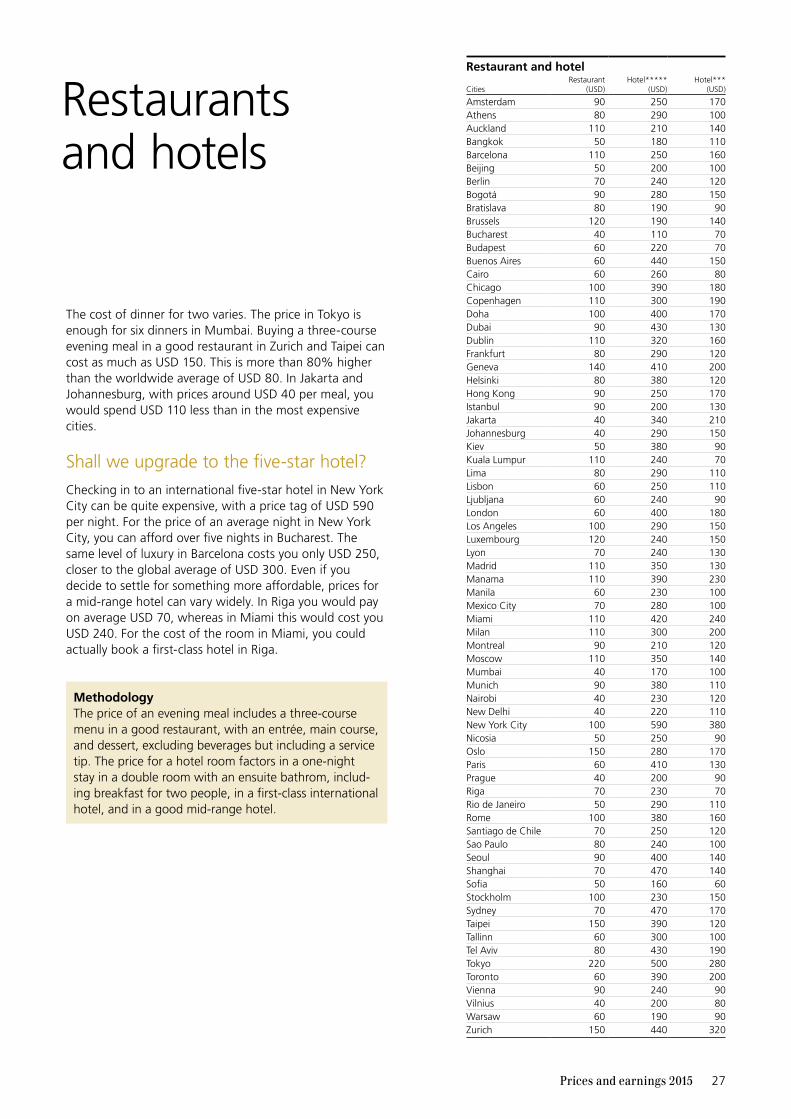
27Prices and earnings 2015
Restaurants and hotels
The cost of dinner for two varies. The price in Tokyo is enough for six dinners in Mumbai. Buying a three-course evening meal in a good restaurant in Zurich and Taipei can cost as much as USD 150. This is more than 80% higher than the worldwide average of USD 80. In Jakarta and Johannesburg, with prices around USD 40 per meal, you would spend USD 110 less than in the most expensive cities.
Shall we upgrade to the five-star hotel?
Checking in to an international five-star hotel in New York City can be quite expensive, with a price tag of USD 590 per night. For the price of an average night in New York City, you can afford over five nights in Bucharest. The same level of luxury in Barcelona costs you only USD 250, closer to the global average of USD 300. Even if you decide to settle for something more affordable, prices for a mid-range hotel can vary widely. In Riga you would pay on average USD 70, whereas in Miami this would cost you USD 240. For the cost of the room in Miami, you could actually book a first-class hotel in Riga.
Restaurant and hotel
CitiesRestaurant
(USD)Hotel*****
(USD)Hotel***
(USD)
Amsterdam 90 250 170Athens 80 290 100Auckland 110 210 140Bangkok 50 180 110Barcelona 110 250 160Beijing 50 200 100Berlin 70 240 120Bogotá 90 280 150Bratislava 80 190 90Brussels 120 190 140Bucharest 40 110 70Budapest 60 220 70Buenos Aires 60 440 150Cairo 60 260 80Chicago 100 390 180Copenhagen 110 300 190Doha 100 400 170Dubai 90 430 130Dublin 110 320 160Frankfurt 80 290 120Geneva 140 410 200Helsinki 80 380 120Hong Kong 90 250 170Istanbul 90 200 130Jakarta 40 340 210Johannesburg 40 290 150Kiev 50 380 90Kuala Lumpur 110 240 70Lima 80 290 110Lisbon 60 250 110Ljubljana 60 240 90London 60 400 180Los Angeles 100 290 150Luxembourg 120 240 150Lyon 70 240 130Madrid 110 350 130Manama 110 390 230Manila 60 230 100Mexico City 70 280 100Miami 110 420 240Milan 110 300 200Montreal 90 210 120Moscow 110 350 140Mumbai 40 170 100Munich 90 380 110Nairobi 40 230 120New Delhi 40 220 110New York City 100 590 380Nicosia 50 250 90Oslo 150 280 170Paris 60 410 130Prague 40 200 90Riga 70 230 70Rio de Janeiro 50 290 110Rome 100 380 160Santiago de Chile 70 250 120Sao Paulo 80 240 100Seoul 90 400 140Shanghai 70 470 140Sofia 50 160 60Stockholm 100 230 150Sydney 70 470 170Taipei 150 390 120Tallinn 60 300 100Tel Aviv 80 430 190Tokyo 220 500 280Toronto 60 390 200Vienna 90 240 90Vilnius 40 200 80Warsaw 60 190 90Zurich 150 440 320
MethodologyThe price of an evening meal includes a three-course menu in a good restaurant, with an entrée, main course, and dessert, excluding beverages but including a service tip. The price for a hotel room factors in a one-night stay in a double room with an ensuite bathrom, includ-ing breakfast for two people, in a first-class international hotel, and in a good mid-range hotel.

28 Prices and earnings 2015
Services
Cities1 USD IndexHaircut women
Haircut men
Amsterdam 555 74.7 49.37 36.76Athens 461 62.1 20.36 14.78Auckland 695 93.7 63.98 36.42Bangkok 323 43.6 12.81 9.53Barcelona 530 71.4 36.04 19.79Beijing 351 47.3 9.27 5.24Berlin 447 60.3 31.63 16.49Bogotá 425 57.2 14.03 8.28Bratislava 371 49.9 23.43 12.79Brussels 578 77.9 43.97 25.95Bucharest 305 41.1 13.05 8.02Budapest 311 41.8 22.85 12.63Buenos Aires 536 72.3 23.37 20.92Cairo 340 45.9 21.84 6.12Chicago 645 86.9 54.00 32.33Copenhagen 760 102.4 67.99 52.55Doha 545 73.4 32.05 13.28Dubai 538 72.6 43.11 16.79Dublin 615 82.8 43.25 13.24Frankfurt 514 69.3 43.97 29.19Geneva 954 128.6 83.97 44.07Helsinki 523 70.5 43.97 36.04Hong Kong 410 55.3 30.96 30.96Istanbul 464 62.5 21.37 12.57Jakarta 311 42.0 4.63 4.50Johannesburg 390 52.5 11.81 8.20Kiev 208 28.0 9.90 7.24Kuala Lumpur 378 50.9 15.16 10.84Lima 414 55.8 14.97 8.55Lisbon 394 53.1 27.03 10.63Ljubljana 346 46.6 33.88 17.30London 703 94.8 49.34 24.92Los Angeles 562 75.7 57.00 34.33Luxembourg 586 79.0 67.76 27.93Lyon 546 73.6 42.53 22.71Madrid 569 76.6 27.03 19.50Manama 583 78.5 23.87 13.26Manila 361 48.6 6.18 5.40Mexico City 455 61.3 15.34 11.50Miami 533 71.9 26.33 15.67Milan 566 76.2 38.11 24.06Montreal 560 75.4 35.28 23.14Moscow 395 53.2 41.00 28.70Mumbai 194 26.2 13.50 5.96Munich 529 71.3 51.18 32.80Nairobi 355 47.8 10.35 5.35New Delhi 215 29.0 11.91 5.29New York City* 742 100.0 73.33 36.67Nicosia 433 58.3 38.38 16.76Oslo 817 110.2 95.04 77.72Paris 605 81.5 48.26 26.31Prague 302 40.7 25.58 12.89Riga 309 41.7 24.87 13.70Rio de Janeiro 455 61.4 40.89 14.76Rome 512 69.0 48.65 17.30Santiago de Chile 444 59.8 21.97 12.48Sao Paulo 515 69.4 22.96 14.21Seoul 410 55.3 15.64 9.43Shanghai 447 60.3 16.93 10.10Sofia 316 42.6 15.89 11.33Stockholm 557 75.0 54.80 48.82Sydney 667 89.9 38.64 21.64Taipei 517 69.7 29.04 26.89Tallinn 330 44.5 28.83 14.78Tel Aviv 548 73.8 55.92 21.61Tokyo 663 89.4 37.64 33.18Toronto 584 78.7 26.31 14.84Vienna 446 60.2 48.65 18.74Vilnius 306 41.3 27.03 16.22Warsaw 309 41.6 23.73 15.22Zurich 996 134.3 86.71 50.79
Services
Services are a part of our daily lives – we read the news-paper, pick up our dry cleaning, get our hair cut, and meet someone for coffee, possibly all in one morning. For this section, we collected prices for a basket of 27 different services. Worldwide, this basket costs an average of USD 490, but this varies widely across cities.
Where should I get my hair cut?
The quality of services, unlike that of food, is hard to cap-ture uniformly. Services are not exportable or tradable goods. There is a strong correlation between local wages and the prices for services, which results in extreme price differences for our basket. Zurich and Geneva, which lead our wage-level rankings, also come out on top for the prices of services. In these two cities our basket costs USD 990 and USD 955, respectively. In Kiev, Mumbai, and New Delhi on the other hand, the same basket can be bought for less than half of the global average price.
Haircuts, and especially the price difference for them between men and women, are an interesting example. In Jakarta and Hong Kong, women pay on average almost the same as men, whereas in Dublin and Cairo, the price for women is almost three times higher than for men. This imbalance is seen across the globe, with women’s haircuts costing on average 40% more than men’s. For the price of one women’s haircut in Oslo, men could afford to get their hair cut around 18 times in Nairobi.
MethodologyOur basket covers a variety of services, such as a haircut, an hour of household help, dry cleaning, TV and internet fees, a language course and a ticket to a sports event. The basket is weighted according to the monthly con-sumption of a European family.
Price comparison
* New York City = Index 100

29Prices and earnings 2015
Zurich Tokyo New York City
London
Hong Kong
Frankfurt Paris
Rio de Janeiro Beijing
Warsaw Nairobi Mumbai
13.50 5.9610.35 5.3523.73 15.22
30.95 30.95
49.34 24.92
86.71 50.79
43.97 29.19
37.64 33.18
40.89 14.76 9.27 5.24
48.26 26.31
73.33 36.67
Women’s haircut Men’s haircut
USD 100
USD 50USD 75
USD 25
USD 0 Prices in USD
JakartaUSD 4.50
Lowest
OsloUSD 77.72
Highest
JakartaUSD 4.63
Lowest
OsloUSD 95.04
Highest
Women’s haircut Men’s haircut

30 Prices and earnings 2015
City breaks
Avid international travelers may be interested in the cost of a trip to one of our cities. For example, rental cars vary greatly in price. In Rio de Janeiro, a rental car can cost you around USD 25, a tenth of the cost of a rental in Oslo. Over half of our cities offer rental cars for under USD 110 per day, less than half of the price of one in Paris, our sec-ond-most expensive city for rental cars. Postage had one of the greatest price variances; the price of sending a letter was 58 times more expensive in Bogotá than in Kiev. Fif-ty-nine cities have postage prices under USD 0.95.
Riga or Zurich for a night away?
An average city break costs USD 615. Zurich and Geneva are the most expensive cities to visit, costing 70% and 65% more, respectively, than the average. Other pricy des-tinations include Tokyo, New York City and Oslo, where the cost of our package is well above USD 950. For that amount, an entire three-night round-trip from Bucharest (USD 260) to Sofia (USD 300) to Vilnius (USD 380) could be organized.
MethodologyThe cost of a city break was for two people, with an overnight stay in a first-class hotel, two dinners at a restaurant including a bottle of wine, a taxi ride, two tickets for public transportation, a rental car (100 km), a paperback book, a phone call and postage for a letter. The prices listed do not include travel to and from the destination.
Price comparison
City breaks
Cities USD Index
Amsterdam 570 55.3Athens 530 51.5Auckland 580 56.3Bangkok 320 31.1Barcelona 600 58.3Beijing 350 34.0Berlin 620 60.2Bogotá 590 57.3Bratislava 450 43.7Brussels 580 56.3Bucharest 260 25.2Budapest 430 41.7Buenos Aires 700 68.0Cairo 480 46.6Chicago 700 68.0Copenhagen 780 75.7Doha 740 71.8Dubai 790 76.7Dublin 660 64.1Frankfurt 700 68.0Geneva 1,020 99.0Helsinki 800 77.7Hong Kong 640 62.1Istanbul 440 42.7Jakarta 690 67.0Johannesburg 450 43.7Kiev 550 53.4Kuala Lumpur 550 53.4Lima 560 54.4Lisbon 460 44.7Ljubljana 490 47.6London 750 72.8Los Angeles 620 60.2Luxembourg 720 69.9Lyon 650 63.1Madrid 650 63.1Manama 720 69.9Manila 450 43.7Mexico City 540 52.4Miami 780 75.7Milan 670 65.0Montreal 570 55.3Moscow 710 68.9Mumbai 300 29.1Munich 830 80.6Nairobi 380 36.9New Delhi 340 33.0New York City* 1,030 100.0Nicosia 550 53.4Oslo 980 95.1Paris 890 86.4Prague 500 48.5Riga 460 44.7Rio de Janeiro 470 45.6Rome 710 68.9Santiago de Chile 570 55.3Sao Paulo 500 48.5Seoul 670 65.0Shanghai 670 65.0Sofia 300 29.1Stockholm 610 59.2Sydney 690 67.0Taipei 820 79.6Tallinn 540 52.4Tel Aviv 650 63.1Tokyo 1,000 97.1Toronto 710 68.9Vienna 630 61.2Vilnius 380 36.9Warsaw 490 47.6Zurich 1,050 101.9* New York City = Index 100

Wage comparison

32 Prices and earnings 2015
Wages differ greatly across geographic regions and professions, making them vital for deter-mining purchasing power. Zurich and Geneva have the highest gross wages by far, over USD 10/hour greater than Luxembourg (third-highest gross salary), and over 20 times greater than Jakarta’s gross wages.
More often than not, how much you get paid for work is not how much you take home, although for workers in Dubai, Doha and Bue-nos Aires, with 0% tax rates and low employee social security contribution rates, this is the case. Workers in Copenhagen, on the other hand, surrender almost 45% of their wage to taxes. Net wages in Zurich and Geneva are the highest, even with all deductions, and are, on average, almost 23 times higher than those in Kiev, with the lowest.
How does my salary compare to others?New York City had the greatest variance across gross wages, signaling a different salary level for different levels of education; an educated department manager makes on average almost USD 120,000 more than a female factory worker. Kiev has the most uniform gross wages, with an average difference between these two professions of around USD 6,000.
The employment sector also makes a difference regarding compensation. Average industrial sector employees made 8% more than average service sector workers, when considering unweighted gross salaries (see pages 39 – 41) across all cities. In some places this difference can be significant, such as in São Paulo, with a difference of almost 75%. For others, it was minimal, such as in Paris, with almost no sector difference.
MethodologyOur wage comparison covers 15 different occupations in administrative, business, com-munication, construction, educational, finance, healthcare, hospitality, manufactur-ing, retail, and transportation sectors. Worker profiles vary in age, family status, work expe-rience and education. Job descriptions can be found on page 38. All professions are weighted to reflect the European workforce, where industrial sector workers comprise 27% of the workforce, and service sector employees nearly 73%.
To ensure that wage information for local workers is presented accurately, incomes from cross-border commuters were excluded. We compared job profiles for full-time (100%) workers to ensure comparability, and scaled up any information on part-time workers on the assumption that wage was a linear func-tion of percentage of work. Since the sample size of our wage data is smaller than that used by local governments for their calculat-tions, the results are not statistically compara-ble.
Gross wages may include possible supplemen-tary benefits, such as bonuses, vacation pay, meal or housing allowances, or family assis-tance. Net wages take into account taxes and social security contributions. Hourly wages are calculated by taking into account annual working hours, found on page 36.
NoteProfessions were weighted according to Eurostat statistics for the working population composition of EU countries.
International wagecomparison
Wage comparison

33Prices and earnings 2015
40
30
20
Gross and nethourly pay
Gross hourly pay in USD Net hourly pay in USD
Am
ster
dam
Zurich
Warsaw
Vilnius
Vienna
Toronto
Tokyo
Tel Aviv
TallinnTaipeiSydneyStockholm
SofiaShanghaiSeoul
Sao PauloSantiago de Chile
Rome
Rio de Janeiro
Riga
Prague
Paris
Oslo
Nicosia
New York City
New Delh
i
Nairobi
Mun
ichM
umba
iM
osco
wM
ontr
eal
Mila
nM
iam
iM
exic
o C
ityM
anila
Man
ama M
adrid
Lyon
Luxembourg
Los Angeles
LondonLjubljana
LisbonLim
aKuala Lum
pur
Kiev
Johannesburg
Jakarta
Istanbul
Hong Kong
Helsinki
Geneva
Frankfurt
Dublin
Dubai
DohaCopenhagenChicago
CairoBuenos A
iresBudap
estBuchare
stBr
usse
ls
Brat
islav
a
Bogo
tá
Berli
n
Beiji
ng
Barc
elon
a
Bang
kok
Auc
klan
d
Ath
ens
KievUSD 1.93
ZurichUSD 41.29
KievUSD 1.65
ZurichUSD 38.40
Highest LowestHighest Lowest
Net hourly payGross hourly pay

34 Prices and earnings 2015
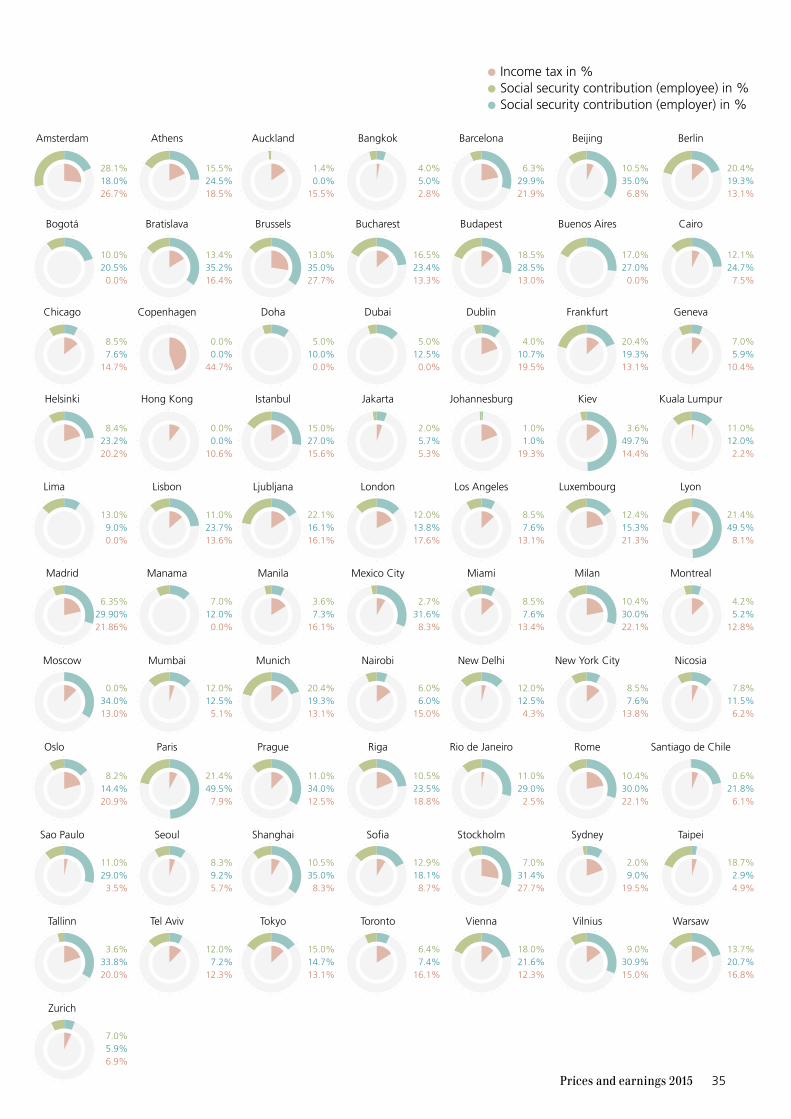
Most countries rely on taxes, social security pay-ments and other deductions to finance their national budgets and social security systems. Countries such as Bahrain, the UAE and Qatar finance themselves by selling local raw materi-als, and do not have an income tax system. Argentina, Peru and Colombia only impose tax on high earners and foreign citizens. Hence, six of our cities have no recorded income tax.
Who pays the most tax?
Income taxes hurt most in Copenhagen, where the average tax for our professions was around 45%. Average tax worldwide was almost 13%, but varies among cities, as income tax rates are calculated by each country and/or city to ensure its own finances. Some countries have very high income tax and social security contribution rates, but provide a full array of social services to their residents. Stockholm has an average tax rate of nearly 28%, but residents have largely free access to education and childcare.
Social security contributions average 10% of gross wages for the employee and 19% for the employer. Workers in Moscow, Hong Kong and Copenhagen make no contributions to social security. In France, however, employers contrib-ute over 49%, more than twice employees’ con-tribution. 27% of all governments shift the bur-den of social security to the employee. Workers in Auckland, for example, carry full responsibil-ity for social security.
Taxes and social security contributions
Wage comparison
MethodologyWe collected tax and social security informa-tion using PwC’s “Worldwide Tax Summa-ries,” and corroborated our results with sur-vey participants and other sources. Taxes were averaged for each profession, weighted and then calculated as a percentage. Social security burden information for employees and employers was gathered from PwC and KPMG sources.
Our net wages (see pages 32–33) are calcu-lated by deducting social security contribu-tions from gross wages, and then subtracting taxes. Hourly wages in individual cities were calculated by dividing average annual gross or net wages by the average number of hours worked per year.
Public sector spending and social security systems in individual countries (and in individ-ual cities) vary greatly, so the percentage of deductions ranges widely.
NoteCapital gains, VAT, property and indirect income deductions were excluded from tax and social security contribution calculations.
Cities such as Zurich, Geneva and Hong Kong have basic private medical insurance that is obligatory, regardless of income level. It is not a part of the social security system and the price of it is not deducted from salaries. So social security contributions only reflect public social contributions, not necessarily all social contributions made by employees. This also limits comparability of these cities with others.
35Prices and earnings 2015
28.1%18.0%26.7%
15.5%24.5%18.5%
1.4%0.0%
15.5%
4.0%5.0%2.8%
6.3%29.9%21.9%
10.5%35.0%6.8%
20.4%19.3%13.1%
10.0%20.5%0.0%
13.4%35.2%16.4%
13.0%35.0%27.7%
16.5%23.4%13.3%
18.5%28.5%13.0%
17.0%27.0%0.0%
12.1%24.7%7.5%
8.5%7.6%
14.7%
0.0%0.0%
44.7%
5.0%10.0%0.0%
5.0%12.5%0.0%
4.0%10.7%19.5%
20.4%19.3%13.1%
7.0%5.9%
10.4%
8.4%23.2%20.2%
0.0%0.0%
10.6%
15.0%27.0%15.6%
2.0%5.7%5.3%
1.0%1.0%
19.3%
3.6%49.7%14.4%
11.0%12.0%2.2%
13.0%9.0%0.0%
11.0%23.7%13.6%
22.1%16.1%16.1%
12.0%13.8%17.6%
8.5%7.6%
13.1%
12.4%15.3%21.3%
21.4%49.5%8.1%
6.35%29.90%21.86%
7.0%12.0%0.0%
3.6%7.3%
16.1%
2.7%31.6%8.3%
8.5%7.6%
13.4%
10.4%30.0%22.1%
4.2%5.2%
12.8%
0.0%34.0%13.0%
12.0%12.5%5.1%
20.4%19.3%13.1%
6.0%6.0%
15.0%
12.0%12.5%4.3%
8.5%7.6%
13.8%
7.8%11.5%6.2%
8.2%14.4%20.9%
21.4%49.5%7.9%
11.0%34.0%12.5%
10.5%23.5%18.8%
11.0%29.0%2.5%
10.4%30.0%22.1%
0.6%21.8%6.1%
11.0%29.0%3.5%
8.3%9.2%5.7%
10.5%35.0%8.3%
12.9%18.1%8.7%
7.0%31.4%27.7%
2.0%9.0%
19.5%
18.7%2.9%4.9%
3.6%33.8%20.0%
12.0%7.2%
12.3%
15.0%14.7%13.1%
6.4%7.4%
16.1%
18.0%21.6%12.3%
9.0%30.9%15.0%
13.7%20.7%16.8%
7.0%5.9%6.9%
Athens
Bratislava
Copenhagen
Hong Kong
Lisbon
Manama
Mumbai
Paris
Seoul
Tel Aviv
Auckland
Brussels
Doha
Istanbul
Ljubljana
Manila
Munich
Prague
Shanghai
Tokyo
Bangkok
Bucharest
Dubai
Jakarta
London
Mexico City
Nairobi
Riga
Sofia
Toronto
Barcelona
Budapest
Dublin
Johannesburg
Los Angeles
Miami
New Delhi
Rio de Janeiro
Stockholm
Vienna
Berlin
Cairo
Geneva
Kuala Lumpur
Lyon
Montreal
Nicosia
Santiago de Chile
Taipei
Warsaw
Amsterdam
Bogotá
Chicago
Helsinki
Lima
Madrid
Moscow
Oslo
Sao Paulo
Tallinn
Zurich
Beijing
Buenos Aires
Frankfurt
Kiev
Luxembourg
Milan
New York City
Sydney
Vilnius
Rome
Social security contribution (employer) in %Social security contribution (employee) in %Income tax in %

36 Prices and earnings 2015
Working hours and vacation days
Annual working hours have a great impact on purchasing power and quality of life – a high hourly income and a low number of working hours indicates a higher quality of life than the reverse. All workaholics should move to Hong Kong, where working hours average over 50 per week, with only 17 days of holiday annually. Those who like time off should consider finding a job in Paris, where people work only around 35 hours per week (in line with new government regulations) and have 29 days of paid vacation. They are on the job annually 1,000-plus fewer hours than their counterparts in Hong Kong.
Do I spend too much time at work?
On average, workers worldwide spend over 40 hours per week at their workplace, and receive over 4.5 weeks of paid vacation. That said, employees in Shanghai must live with only seven days off, almost a fifth of the vacation days of those in Manama. But legal holidays help make workers’ lives manageable. Bangkok averages only nine days of paid vacation but 16 days of legal holidays, giving a total holiday time of 25 days, or around five weeks. São Paulo has the highest combined amount of time off, with an average of 50 days, or around 10 weeks. Lisbon has the lowest num-ber of legal holidays, with only five days, which is one work week in the city.
MethodologyAnnual vacations are those considered as paid vacation days (legal holidays not included). They were calculated through survey responses, and averaged over all profes-sions. Annual working hours were calculated through the number of hours worked per day, the number of days worked per week, with the vacation and legal holiday time deducted. Working hour information was not weighted to the profession’s representation in the European workforce.
Wage comparison
Working hours and vacation days
CitiesWorking hours
per yearPaid vacation days
per year
Amsterdam 1,726 27Athens 1,800 23Auckland 1,992 16Bangkok 2,191 9Barcelona 1,731 28Beijing 1,963 10Berlin 1,769 29Bogotá 2,096 15Bratislava 1,845 26Brussels 1,717 18Bucharest 1,807 23Budapest 1,910 26Buenos Aires 1,899 16Cairo 2,082 25Chicago 2,030 14Copenhagen 1,697 25Doha 2,082 24Dubai 2,186 30Dublin 1,770 31Frankfurt 1,757 28Geneva 1,859 27Helsinki 1,659 29Hong Kong 2,606 17Istanbul 2,043 18Jakarta 2,102 12Johannesburg 1,847 19Kiev 1,817 26Kuala Lumpur 1,935 15Lima 1,957 31Lisbon 1,748 23Ljubljana 1,853 25London 1,740 25Los Angeles 1,928 14Luxembourg 1,703 32Lyon 1,631 29Madrid 1,731 26Manama 2,076 34Manila 1,951 21Mexico City 2,261 17Miami 1,854 19Milan 1,691 26Montreal 1,783 18Moscow 1,647 31Mumbai 2,277 21Munich 1,721 29Nairobi 2,184 22New Delhi 2,214 26New York City 1,847 27Nicosia 1,855 22Oslo 1,744 25Paris 1,604 29Prague 1,753 28Riga 1,823 20Rio de Janeiro 1,745 30Rome 1,736 32Santiago de Chile 2,082 17Sao Paulo 1,818 31Seoul 1,934 15Shanghai 2,051 7Sofia 1,821 22Stockholm 1,770 25Sydney 1,829 24Taipei 2,141 13Tallinn 1,738 30Tel Aviv 2,038 17Tokyo 2,055 17Toronto 1,985 19Vienna 1,678 27Vilnius 1,716 30Warsaw 1,757 26Zurich 1,912 24

Appendix

38 Prices and earnings 2015
Industrial sector
Construction workerUnskilled or semi-skilled laborer without technical training, approximate age and status: 25, single
Department managerHead of production department with more than 100 employees in a sizable company in the metal processing, machinery, or tool-making industry; full vocational training and considerable profes-sional experience, approximate age and status: 40, married, two children
Electrical engineerEmployed by an industrial firm in the electrical equipment, electric power, or similar industry; completed studies at a university or institute of higher technical education; at least five years of practical experience, approximate age and status: 35, married, two children
Female industrial workerUnskilled or semi-skilled operator in a medi-um-sized plant in the textile industry, approximate age and status: 25, single
Industrial technicianSkilled mechanic with vocational training and con-siderable experience with a large company in the metal-working and tool industry, approximate age and status: 35, married, two children
Services sector
Automobile mechanicCompleted training or apprenticeship, at least five years of experience, approximate age and status: 25, single
Bank credit clerkCompleted apprenticeship, at least 10 years of experience, approximate age and status: 35, single
Bus driverEmployed by a municipal transport system, at least 10 years of driving experience, approximate age and status: 35, married, two children
Call center agentTrained agent at an inbound call/service center in the telecommunications or technology sector, approximate age and status: 25, single
Cook (chef de partie)Cook in a kitchen with a fairly large staff in a respected restaurant or hotel, deputy of the head chef or chef de partie, supervises two to three cooks, completed vocational training as cook, about 10 years of experience, approximate age and status: 30, single
Female sales assistantSales in the ladies’ apparel department of a large department store, specialized training in sales, several years of experience, approximate age and status: 25, single
Hospital nurseCompleted apprenticeship or studies, at least 10 years of experience, approximate age and status: 35, married, two children
Primary public school teacherTeaching for about 10 years in government-oper-ated schools, approximate age and status: 35, married, two children
Product managerManager in pharmaceutical, chemical or food industry, about five years of experience, tertiary educational degree, middle management, approxi-mate age and status: 35, married
Secretary/personal assistantSecretary of a department manager in an indus-trial firm, at least five years of experience; knowl-edge of PCs and one foreign language, approxi-mate age and status: 25, single
Job descriptions
Appendix

39Prices and earnings 2015
AppendixGross annual incomes (in USD) in the industrial sector
CitiesDepartment
managerFemale
industrial workerConstruction
workerIndustrial
technicianElectrical engineer
Amsterdam 51,379 25,796 26,135 42,374 42,587Athens 54,176 10,324 10,073 22,581 17,222Auckland 78,286 34,809 37,950 58,739 63,351Bangkok 29,611 5,080 5,055 11,719 12,730Barcelona 44,698 16,365 20,655 24,440 41,382Beijing 19,107 5,358 4,712 6,197 14,621Berlin 76,888 23,894 25,466 38,689 61,813Bogotá 20,494 3,235 4,364 9,245 15,556Bratislava 58,396 16,978 22,358 19,465 25,125Brussels 70,864 32,068 32,137 42,974 52,944Bucharest 14,466 4,372 4,783 7,074 12,020Budapest 22,437 5,459 5,159 8,672 19,781Buenos Aires 18,728 10,277 9,921 12,489 16,929Cairo 26,570 1,993 1,888 8,609 11,318Chicago 107,820 38,965 42,000 43,500 94,299Copenhagen 72,099 42,012 36,684 45,202 79,845Doha 56,039 8,241 5,824 22,251 54,940Dubai 73,494 6,533 5,299 25,315 65,328Dublin 59,837 23,013 29,955 46,456 48,143Frankfurt 56,305 26,993 27,182 42,705 63,594Geneva 130,704 57,094 58,302 84,079 109,649Helsinki 47,383 27,736 30,643 43,079 50,419Hong Kong 64,505 29,414 29,930 37,671 55,474Istanbul 41,052 7,086 9,583 18,652 34,609Jakarta 10,190 2,023 3,011 3,844 10,885Johannesburg 40,648 9,453 5,420 34,799 58,426Kiev 8,005 2,384 3,225 2,822 4,208Kuala Lumpur 44,868 6,173 7,066 8,562 18,616Lima 20,438 6,576 7,220 12,586 18,663Lisbon 21,231 14,938 11,539 19,545 20,684Ljubljana 33,532 20,224 12,815 24,993 27,647London 57,910 33,583 31,966 54,121 61,296Los Angeles 85,500 30,667 38,000 55,000 82,333Luxembourg 115,857 32,442 30,279 61,787 67,194Lyon 52,306 23,485 23,320 28,865 52,698Madrid 44,525 17,335 21,992 31,314 31,631Manama 58,353 13,527 9,549 35,542 56,231Manila 12,870 2,190 2,208 3,303 10,842Mexico City 14,581 3,019 2,063 8,856 7,521Miami 116,393 33,160 28,887 72,777 96,657Milan 55,332 21,988 22,243 34,771 52,736Montreal 105,607 45,452 39,804 50,252 54,224Moscow 13,835 6,653 7,144 10,962 18,749Mumbai 16,200 2,791 2,087 5,045 11,847Munich 87,211 29,281 23,634 36,234 66,500Nairobi 14,846 2,324 1,958 2,719 4,911New Delhi 14,705 2,952 1,688 4,396 8,069New York City 142,500 19,055 29,415 47,000 100,055Nicosia 64,660 47,582 22,872 30,893 48,426Oslo 76,080 42,267 41,210 52,411 54,947Paris 52,696 21,304 24,383 28,501 51,937Prague 17,073 8,939 8,205 12,910 15,067Riga 16,770 7,437 11,627 11,442 14,342Rio de Janeiro 36,872 4,479 7,658 22,986 36,006Rome 63,803 30,482 27,179 36,549 46,320Santiago de Chile 20,375 7,935 10,062 15,656 33,944Sao Paulo 58,271 5,450 6,228 44,746 31,750Seoul 32,026 17,486 28,161 26,965 35,892Shanghai 31,759 5,229 7,730 9,741 18,368Sofia 18,002 5,131 5,142 5,905 7,464Stockholm 80,042 33,665 40,208 42,291 54,172Sydney 92,460 48,957 62,355 59,493 70,195Taipei 79,811 11,048 20,435 24,205 27,852Tallinn 45,851 8,742 12,755 17,302 22,277Tel Aviv 43,208 21,451 15,899 31,482 45,805Tokyo 74,239 31,578 41,825 63,407 53,536Toronto 63,164 40,445 36,992 55,165 70,083Vienna 65,262 26,360 31,532 39,182 57,146Vilnius 24,844 4,947 10,414 18,319 14,655Warsaw 33,829 7,444 8,695 19,021 16,275Zurich 159,705 47,934 62,276 75,691 123,676

40 Prices and earnings 2015
Appendix Gross annual incomes (in USD) in the services sector
CitiesBus
driverAutomobile
mechanicCall center
agentCook
(chef de partie)Hospital
nurse
Amsterdam 35,340 28,328 27,960 32,251 41,006Athens 17,708 9,786 10,527 19,832 14,638Auckland 35,659 39,760 29,969 35,909 50,794Bangkok 8,234 11,033 5,025 14,143 19,854Barcelona 29,153 22,926 22,759 34,064 29,463Beijing 8,090 6,649 3,679 7,294 9,789Berlin 28,227 31,189 19,320 44,208 34,269Bogotá 6,254 6,678 5,078 8,831 9,006Bratislava 12,779 11,420 22,922 22,385 8,795Brussels 38,251 34,800 32,739 36,879 41,870Bucharest 11,601 7,868 6,965 11,010 6,385Budapest 9,023 7,349 9,117 14,567 7,672Buenos Aires 17,246 12,991 10,212 14,526 11,655Cairo 2,202 4,283 2,884 10,095 4,195Chicago 31,714 55,679 36,804 43,879 67,950Copenhagen 45,819 43,295 42,413 49,296 52,402Doha 9,312 11,171 14,284 16,482 17,306Dubai 18,237 14,880 13,283 64,784 27,583Dublin 39,016 27,920 25,610 32,273 45,084Frankfurt 32,993 31,594 22,846 39,424 31,805Geneva 64,590 66,145 51,014 75,875 79,665Helsinki 34,743 33,623 24,630 29,527 33,415Hong Kong 27,608 25,289 24,512 51,573 58,313Istanbul 11,611 11,347 6,649 75,239 13,437Jakarta 3,103 3,103 2,548 8,801 2,200Johannesburg 10,339 12,111 6,791 51,307 14,664Kiev 2,944 5,789 2,983 9,576 1,946Kuala Lumpur 6,184 9,132 8,617 18,810 12,806Lima 6,383 8,409 6,998 9,768 9,206Lisbon 28,100 16,149 10,562 25,773 15,752Ljubljana 14,748 19,511 20,646 20,159 17,142London 37,402 32,718 25,986 41,107 41,359Los Angeles 39,783 40,733 33,733 53,567 75,000Luxembourg 85,578 40,228 32,442 41,093 88,822Lyon 27,791 20,579 28,474 29,780 25,676Madrid 33,170 23,492 15,922 31,339 26,783Manama 17,665 36,232 12,732 68,962 33,770Manila 3,083 2,897 4,330 3,367 4,783Mexico City 1,813 3,083 3,342 17,109 12,286Miami 38,317 38,025 28,076 60,122 69,484Milan 29,270 22,068 18,438 42,319 38,534Montreal 46,218 37,114 27,790 40,532 45,286Moscow 13,381 11,945 8,694 11,491 7,787Mumbai 3,185 2,017 3,239 12,741 5,216Munich 34,427 32,330 24,470 35,540 33,454Nairobi 2,741 3,094 3,884 4,494 3,865New Delhi 4,204 4,619 3,249 6,689 6,583New York City 63,800 47,678 29,560 63,725 91,600Nicosia 31,290 27,049 26,657 37,159 29,881Oslo 48,184 48,184 44,380 49,452 50,297Paris 26,959 22,890 24,001 34,625 34,759Prague 11,285 9,400 9,674 12,869 10,378Riga 10,570 11,876 8,736 8,632 8,127Rio de Janeiro 7,680 7,479 3,597 20,260 19,970Rome 32,035 29,843 19,934 54,888 32,983Santiago de Chile 11,348 13,365 8,058 14,222 23,529Sao Paulo 9,001 7,857 4,942 22,257 18,411Seoul 40,475 27,839 18,406 23,008 31,290Shanghai 7,983 8,521 5,519 13,556 14,524Sofia 7,110 7,369 8,714 10,914 4,169Stockholm 37,915 36,681 37,086 37,714 42,963Sydney 45,040 47,668 32,646 39,062 48,404Taipei 22,668 16,634 15,330 48,840 20,144Tallinn 12,068 14,058 10,572 19,033 14,274Tel Aviv 29,448 25,176 24,230 38,423 31,421Tokyo 39,106 38,437 33,460 46,008 47,179Toronto 44,613 31,987 23,652 38,870 52,919Vienna 36,031 35,637 31,429 29,493 32,789Vilnius 12,761 12,626 6,505 22,038 8,140Warsaw 10,372 10,818 7,798 17,513 9,781Zurich 77,028 68,886 54,967 81,224 76,581

41Prices and earnings 2015
Gross annual incomes (in USD) in the services sector
Cities Bank credit clerk Product managerSecretary/personal
assistantFemale sales
assistantPrimary public school teacher
Amsterdam 37,748 49,641 31,019 27,624 43,487Athens 20,219 33,848 12,135 14,004 18,546Auckland 34,468 62,593 46,660 27,426 47,182Bangkok 22,815 17,951 11,286 7,053 7,425Barcelona 32,427 64,163 22,163 18,636 31,301Beijing 4,583 28,403 4,648 6,197 8,650Berlin 48,938 56,631 28,433 23,577 53,938Bogotá 10,331 67,629 10,970 4,508 8,682Bratislava 23,935 34,305 12,869 10,652 12,247Brussels 44,632 50,943 36,060 35,114 41,293Bucharest 8,711 20,236 5,778 7,146 5,431Budapest 11,472 21,736 9,364 6,337 9,149Buenos Aires 16,431 22,410 14,253 14,508 10,191Cairo 10,838 10,270 4,326 3,671 1,398Chicago 47,040 109,207 44,929 42,088 69,074Copenhagen 66,462 82,992 50,736 32,819 52,860Doha 40,656 49,080 23,624 17,471 29,668Dubai 24,171 89,826 18,691 15,243 30,759Dublin 37,840 82,186 28,837 27,035 44,835Frankfurt 48,490 58,020 32,586 25,769 52,100Geneva 121,684 119,595 75,417 46,683 88,922Helsinki 32,888 53,785 32,706 30,777 39,787Hong Kong 61,151 52,378 30,446 26,318 56,764Istanbul 15,823 24,156 12,265 9,515 12,725Jakarta 2,432 11,580 5,906 2,200 2,501Johannesburg 12,773 47,117 15,581 6,570 13,173Kiev 3,923 6,567 3,452 3,009 1,714Kuala Lumpur 7,569 19,182 9,591 7,166 12,218Lima 13,432 23,273 10,154 6,217 8,837Lisbon 26,494 16,149 15,291 12,479 26,848Ljubljana 24,967 28,990 19,180 12,620 22,755London 29,587 106,077 28,606 26,984 38,197Los Angeles 68,633 94,000 42,267 38,067 54,667Luxembourg 75,698 50,826 38,930 29,847 94,229Lyon 49,744 59,469 27,724 23,358 30,096Madrid 38,541 44,878 21,448 20,855 33,019Manama 36,285 49,759 19,734 19,150 31,829Manila 5,783 35,295 3,474 2,389 5,192Mexico City 6,240 30,327 12,815 3,707 6,782Miami 51,157 111,037 38,002 29,065 63,870Milan 44,085 47,582 26,253 21,260 30,441Montreal 49,752 75,663 36,729 17,533 48,534Moscow 13,986 19,505 11,189 9,148 11,378Mumbai 4,966 22,859 5,447 4,149 3,446Munich 45,253 62,627 34,947 27,406 45,598Nairobi 6,741 15,756 6,741 3,480 2,300New Delhi 5,394 6,848 7,167 3,631 8,011New York City 53,695 119,000 39,080 26,500 80,500Nicosia 40,553 56,181 27,997 31,063 41,748Oslo 50,720 67,627 43,957 38,885 46,493Paris 55,260 54,421 26,661 26,538 32,024Prague 13,881 18,472 10,581 9,442 10,427Riga 11,696 27,109 9,735 5,509 6,666Rio de Janeiro 13,962 33,690 13,080 4,218 9,690Rome 36,317 57,008 16,978 25,380 27,756Santiago de Chile 17,594 32,731 10,015 8,692 13,307Sao Paulo 12,613 51,575 14,007 11,299 14,010Seoul 58,408 33,131 17,118 14,633 37,180Shanghai 16,945 30,017 10,457 7,356 10,651Sofia 6,889 12,748 6,630 4,666 4,476Stockholm 46,278 80,878 35,707 34,969 39,205Sydney 41,227 86,318 37,001 39,938 60,294Taipei 20,074 56,768 14,480 12,350 24,911Tallinn 14,491 18,816 12,025 11,376 12,371Tel Aviv 30,753 70,942 24,736 21,361 25,220Tokyo 52,281 55,418 36,806 27,312 62,917Toronto 33,198 65,723 33,607 28,748 62,363Vienna 42,770 54,483 40,791 26,570 34,125Vilnius 18,771 19,516 7,408 5,688 9,660Warsaw 11,393 28,966 10,470 8,749 12,887Zurich 107,124 127,031 69,684 54,462 110,815

42 Prices and earnings 2015
Appendix
UBS Chief Investment Office WM’s investment views are prepared and published by Wealth Management and Retail & Corporate or Wealth Management Americas, Business Divisions of UBS AG (regulated by FINMA in Switzerland), its subsidiary or affiliate (“UBS”). In certain countries UBS AG is referred to as UBS SA. This material is for your information only and is not intended as an offer, or a solicitation of an offer, to buy or sell any investment or other specific product. Certain services and products are subject to legal restrictions and cannot be offered worldwide on an unrestricted basis and/or may not be eligible for sale to all investors. All information and opinions expressed in this material were obtained from sources believed to be reliable and in good faith, but no representation or warranty, express or implied, is made as to its accuracy or completeness (other than disclosures relating to UBS). All information and opinions as well as any prices indicated are current as of the date of this report, and are subject to change without notice. The market prices provided in performance charts and tables are closing prices on the respective principal stock exchange. The analysis contained herein is based on numerous assumptions. Different assumptions could result in materially different results. Opinions expressed herein may differ or be contrary to those expressed by other business areas or divisions of UBS as a result of using different assumptions and/or criteria. UBS and any of its directors or employees may be entitled at any time to hold long or short positions in investment instruments referred to herein, carry out trans-actions involving relevant investment instruments in the capacity of principal or agent, or provide any other services or have officers, who serve as directors, either to/for the issuer, the investment instrument itself or to/for any company commercially or financially affiliated to such issuers. At any time, investment decisions (including whether to buy, sell or hold securities) made by UBS and its employees may differ from or be contrary to the opinions expressed in UBS research publications. Some investments may not be readily realizable since the market in the securities is illiquid and therefore valuing the investment and identifying the risk to which you are exposed may be difficult to quantify. UBS relies on information barriers to control the flow of information contained in one or more areas within UBS, into other areas, units, divisions or affiliates of UBS. Futures and options trading is considered risky. Past performance of an investment is no guarantee for its future performance. Additional information will be made available upon request. Some investments may be subject to sudden and large falls in value and on realization you may receive back less than you invested or may be required to pay more. Changes in foreign exchange rates may have an adverse effect on the price, value or income of an investment. The analyst(s) responsible for the preparation of this report may interact with trading desk personnel, sales personnel and other constituencies for the purpose of gathering, synthesizing and interpreting market information. Tax treatment depends on the individual circumstances and may be subject to change in the future. UBS does not provide legal or tax advice and makes no representations as to the tax treatment of assets or the investment returns thereon both in general or with reference to specific client’s circumstances and needs. We are of necessity unable to take into account the particular investment objectives, financial situation and needs of our individual clients and we would recommend that you take financial and/or tax advice as to the implications (including tax) of investing in any of the products mentioned herein. This material may not be reproduced or copies circulated without prior authority of UBS. UBS expressly pro-hibits the distribution and transfer of this material to third parties for any reason. UBS accepts no liability whatsoever for any claims or lawsuits from any third parties arising from the use or distribution of this material. This report is for distribution only under such circumstances as may be permitted by applicable law. In developing the Chief Investment Office (CIO) economic forecasts, CIO economists worked in collaboration with economists employed by UBS Investment Research. Forecasts and estimates are current only as of the date of this publication and may change without notice. For information on the ways in which UBS CIO WM manages conflicts and maintains independence of its investment views and publication offering, and research and rating methodologies, please visit www.ubs.com/research. Additional information on the relevant authors of this publication and other CIO publication(s) referenced in this report; and copies of any past reports on this topic; are available upon request from your client advisor.
External Asset Managers/External Financial Consultants: In case this research or publication is provided to an External Asset Manager or an External Financial Consultant, UBS expressly prohibits that it is redistributed by the External Asset Manager or the External Financial Consultant and is made available to their clients and/or third parties. Australia: 1) Clients of UBS Wealth Management Australia Ltd: This notice is issued by UBS Wealth Management Australia Ltd ABN 50 005 311 937 (Holder of Australian Financial Services Licence No. 231127): This Document is general in nature and does not con-stitute personal financial product advice. The Document does not take into account any person’s objectives, financial situation or needs, and a recipient should obtain advice from an independent financial adviser and consider any relevant offer or disclosure document prior to making any investment decisions. 2) Clients of UBS AG: This notice is issued by UBS AG ABN 47 088 129 613 (Holder of Australian Financial Services Licence No 231087): This Document is issued and distributed by UBS AG. This is the case despite anything to the contrary in the Document. The Document is intended for use only by “Wholesale Clients” as defined in section 761G (“Wholesale Clients”) of the Corporations Act 2001 (Cth) (“Corporations Act”). In no circumstances may the Document be made available by UBS AG to a “Retail Client” as defined in section 761G of the Corporations Act. UBS AG’s research services are only available to Wholesale Clients. The Document is general information only and does not take into account any person’s investment objectives, financial and taxation situation or particular needs. Bahamas: This publication is distributed to private clients of UBS (Bahamas) Ltd and is not intended for distribution to persons designated as a Bahamian citizen or resident under the Bahamas Exchange Control Regulations. Bahrain: UBS AG is a Swiss bank not licensed, supervised or regulated in Bahrain by the Central Bank of Bahrain and does not undertake banking or investment business activities in Bahrain. Therefore, Clients have no protection under local banking and investment services laws and regulations. Belgium: This publication is not intended to constitute a public offering or a comparable solicitation under Belgian law, but might be made available for information purposes to clients of UBS Belgium, branch of UBS (Luxembourg) SA, registered with the National Bank of Belgian and authorized by the “Financial Services and Markets Authority”, to which this publication has not been submitted for approval. Brazil: Prepared by UBS Brasil Administradora de Valores Mobiliários Ltda, entity regulated by Comissão de Valores Mobiliários (“CVM”) Canada: In Canada, this publication is distributed to clients of UBS Wealth Management Canada by UBS Investment Management Canada Inc. Dubai: Research is issued by UBS AG Dubai Branch within the DIFC, is intended for professional clients only and is not for onward distri-bution within the United Arab Emirates. France: This publication is distributed by UBS (France) S.A., French “société anonyme” with share capital of € 125.726.944, 69, boulevard Haussmann F-75008 Paris, R.C.S. Paris B 421 255 670, to its clients and prospects. UBS (France) S.A. is a provider of investment services duly authorized according to the terms of the “Code Monétaire et Financier”, regulated by French banking and financial authorities as the “Autorité de Contrôle Prudentiel et de Résolution.” Germany: The issuer under German Law is UBS Deutschland AG, Bockenheimer Landstrasse 2–4, 60306 Frankfurt am Main. UBS Deutschland AG is authorized and regulated by the “Bundesanstalt für Finanzdienstleistungsaufsicht”. Hong Kong: This publication is distributed to clients of UBS AG Hong Kong Branch by UBS AG Hong Kong Branch, a licensed bank under the Hong Kong Banking Ordinance and a registered institution under the Securities and Futures Ordinance. India: Distributed by UBS Securities India Private Ltd. 2/F, 2 North Avenue, Maker Maxity, Bandra Kurla Complex, Bandra (East), Mumbai (India) 400051. Phone: +912261556000. SEBI Registration Numbers: NSE (Capital Market Segment): INB230951431, NSE (F&O Segment) INF230951431, BSE (Capital Market Segment) INB010951437. Indonesia: This research or publication is not intended and not prepared for purposes of public offering of securities under the Indonesian Capital Market Law and its implementing regulations. Securities mentioned in this material have not been, and will not be, registered under the Indonesian Capital Market Law and Regulations. Israel: UBS AG is registered as a Foreign Dealer in cooperation with UBS Wealth Management Israel Ltd, a wholly owned UBS subsidiary. UBS Wealth Management Israel Ltd is a licensed Portfolio Manager which engages also in Investment Marketing and is regulated by the Israel Securities Authority. This publication shall not replace any investment advice and/or investment marketing provided by a relevant licensee which is adjusted to your personal needs. Italy: This publication is distributed to the clients of UBS (Italia) S.p.A., via del vecchio politecnico 3, Milano, an Italian bank duly authorized by Bank of Italy to the provision of financial services and supervised by “Consob” and Bank of Italy. UBS Italia has not participated in the production of the publication and of the research on investments and financial anal-ysis herein contained. Jersey: UBS AG, Jersey Branch, is regulated and authorized by the Jersey Financial Services Commission for the conduct of banking, funds and investment business. Luxembourg: This publication is not intended to constitute a public offer under Luxembourg law, but might be made available for information purposes to clients of UBS (Luxembourg) S.A., 33A avenue J.F. Kennedy, L-1855 Luxembourg, R.C.S. Luxembourg B 11142, a regulated bank under the supervision of the “Commission de Surveillance du Secteur Financier” (CSSF), to which this publication has not been submitted for approval. Mexico: This document has been distributed by UBS Asesores México, S.A. de C.V., a company which is not part of UBS Grupo Financiero, S.A. de C.V. or of any other Mexican financial group and whose obligations are not guaranteed by any third party. UBS Asesores México, S.A. de C.V. does not guarantee any yield whatsoever. Netherlands: This publication is not intended to constitute a public offering or a comparable solicitation under Dutch law, but might be made available for information purposes to clients of UBS Bank (Netherlands) B.V., a regulated bank under the supervision of “De Nederlansche Bank” (DNB) and “Autoriteit Financiële Markten” (AFM), to which this publication has not been submitted for approval. New Zealand: This notice is distributed to clients of UBS Wealth Management Australia Limited ABN 50 005 311 937 (Holder of Australian Financial Services Licence No. 231127), Chifley Tower, 2 Chifley Square, Sydney, New South Wales, NSW 2000, by UBS Wealth Management Australia Ltd. You are being provided with this UBS publication or material because you have indicated to UBS that you are a client certified as a wholesale investor and/or an eligible investor (“Certified Client”) located in New Zealand. This publication or material is not intended for clients who are not Certified Clients (“Non-Certified Clients”), and if you are a Non-Certified Client you must not rely on this publication or material. If despite this warning you nevertheless rely on this publication or material, you hereby (i) acknowledge that you may not rely on the content of this publication or material and that any recommendations or opinions in this publication or material are not made or provided to you, and (ii) to the maximum extent permitted by law (a) indemnify UBS and its associates or related entities (and their respective directors, officers, agents and advisers (each a “Relevant Person”) for any loss, damage, liability or claim any of them may incur or suffer as a result of, or in connection with, your unauthorised reliance on this publication or material and (b) waive any rights or remedies you may have against any Relevant Person for (or in respect of) any loss, damage, liability or claim you may incur or suffer as a result of, or in connection with, your unauthorised reliance on this publication or material. Saudi Arabia: This publication has been approved by UBS Saudi Arabia (a subsidiary of UBS AG), a Saudi Arabian closed joint stock company incorporated in the Kingdom of Saudi Arabia under commercial register number 1010257812 having its registered office at Tatweer Towers, P.O. Box 75724, Riyadh 11588, Kingdom of Saudi Arabia. UBS Saudi Arabia is authorized and regulated by the Capital Market Authority of Saudi Arabia. Singapore: Please contact UBS AG Singapore branch, an exempt financial adviser under the Singapore Financial Advisers Act (Cap. 110) and a wholesale bank licensed under the Singapore Banking Act (Cap. 19) regulated by the Monetary Authority of Singapore, in respect of any matters arising from, or in connection with, the analysis or report. Spain: This publication is distributed to clients of UBS Bank, S.A. by UBS Bank, S.A., a bank registered with the Bank of Spain. Taiwan: This material is provided in accordance with laws of Taiwan, in agreement with or at the request of clients. UAE: This research report is not intended to constitute an offer, sale or delivery of shares or other securities under the laws of the United Arab Emirates (UAE). The contents of this report have not been and will not be approved by any authority in the United Arab Emirates including the UAE Central Bank or Dubai Financial Authorities, the Emirates Securities and Commodities Authority, the Dubai Financial Market, the Abu Dhabi Securities market or any other UAE exchange. UK: Approved by UBS AG, authorised and regulated by the Financial Market Supervisory Authority in Switzerland. In the United Kingdom, UBS AG is authorised by the Prudential Regulation Authority and subject to regulation by the Financial Conduct Authority and limited regulation by the Prudential Regulation Authority. Details about the extent of our regulation by the Prudential Regulation Authority are available from us on request. A member of the London Stock Exchange. This publication is distributed to private clients of UBS London in the UK. Where products or services are provided from outside the UK, they will not be covered by the UK regulatory regime or the Financial Services Compensation Scheme. USA: This document is not intended for distribution into the US and/or to US persons. UBS Securities LLC is a subsidiary of UBS AG and an affiliate of UBS Financial Services Inc., UBS Financial Services Inc. is a subsidiary of UBS AG.
Version May 2015.© UBS 2015. The key symbol and UBS are among the registered and unregistered trademarks of UBS. All rights reserved.

Prices and earnings 2015
PublisherUBS Switzerland AG, CIO WM Research, P.O. Box, CH-8098 Zurich, Switzerland
Chief EconomistDr. Andreas Höfert
Chief Economist SwitzerlandDr. Daniel Kalt
Project managers, Authors/AnalysisCaroline Steiblin Frank-Stephan Graef
Project TeamCaroline Steiblin Frank-Stephan Graef Dennis BartlomeFrank Neugebauer
EditorsAndrew DeBooPatricia Fletcher
TranslationCLS Communication AG, Zurich
IllustrationMichael GallikerRodrigo Jimenez
Cover photoiStock
DesktopCIO Digital & Print Publishing
Feedback/Contact [email protected]
Printersgalledia ag, Flawil, Switzerland
Prices and Earnings also has a microsite www.ubs.com/pricesandearnings
Prices and Earnings appears in English (USD), German (EUR), and French (EUR). The application Prices & Earnings (for iOS) can be downloaded from iTunes.The Newsstand version can be down-loaded on any iOS device.
This edition was released on 17 September 2015.
© UBS Switzerland AG 2015

ab
Prices and earnings on UBS Newsstand
City comparisons at your fingertips
Prices and earnings can also be read on the UBS Newsstand (available on the iTunes App Store in selected countries).
UBS Wealth Management