price based intelligent automatic generation and …
TRANSCRIPT

i
PRICE BASED INTELLIGENT AUTOMATIC
GENERATION AND CONTROL
A Thesis submitted To Gujarat Technological University
For the Award of
Doctor of Philosophy
In
Electrical Engineering
By
Prajapati Yogeshkumar Ramanlal
[129990909002]
Under supervision of
Supervisor
Dr. Vithal N Kamat
Co-supervisor
Dr.Jatinkumar J Patel
GUJARAT TECHNOLOGICAL UNIVERSITY
AHMEDABAD
January - 2021

ii
PRICE BASED INTELLIGENT AUTOMATIC
GENERATION AND CONTROL
A Thesis submitted To Gujarat Technological University
For the Award of
Doctor of Philosophy
In
Electrical Engineering
By
Prajapati Yogeshkumar Ramanlal
[129990909002]
Under supervision of
Supervisor
Dr. Vithal N Kamat
Co-supervisor
Dr. Jatinkumar J Patel
GUJARAT TECHNOLOGICAL UNIVERSITY
AHMEDABAD
January - 2021

iii
© [PRAJAPATI YOGESHKUMAR RAMANLAL]

iv
DECLARATION
I declare that the thesis entitled Price Based Intelligent Automatic Generation and
Control submitted by me for the degree of Doctor of Philosophy is the record of research
work carried out by me during the period from 2012 to 2019 under the supervision of Dr.
Vithal N Kamat and this has not formed the basis for the award of any degree, diploma,
associateship, fellowship, titles in this or any other University or other institution of
higher learning.
I further declare that the material obtained from other sources has been duly
acknowledged in the thesis. I shall be solely responsible for any plagiarism or other
irregularities, if noticed in the thesis.
Signature of the Research Scholar: Date: 27/01/2021
Name of Research Scholar: Prajapati Yogeshkumar Ramanlal
Place: Vallabh Vidyanagar

v
CERTIFICATE
I certify that the work incorporated in the thesis Price Based Intelligent Automatic
Generation and Control submitted by Shri Prajapati Yogeshkumar Ramanlal was
carried out by the candidate under my supervision / guidance. To the best of my
knowledge: (i) the candidate has not submitted the same research work to any other
institution for any degree / diploma, Associateship, Fellowship or other similar titles (ii)
the thesis submitted is a record of original research work done by the Research Scholar
during the period of study under my supervision, and (iii) the thesis represents
independent research work on the part of the Research Scholar.
Signature of Supervisor:
Date: 27/01/2021
Name of Supervisor: Dr. Vithal N Kamat
Place: Baroda Meters Limited, Vithal Udyonagar
Signature of Co-Supervisor:
Date: 27/01/2021
Name of Co-Supervisor: Dr. Jatinkumar J Patel
Place: G H Patel College of Engineering & Technology
Electrical Engineering Department,
Vallabh Vidyanagar

vi
Course-work Completion Certificate
This is to certify that Mr. Prajapati Yogeshkumar Ramanlal enrolment no.
129990909002 is a PhD scholar enrolled for PhD program in the branch Electrical
Engineering of Gujarat Technological University, Ahmedabad.
(Please tick the relevant option(s))
He has been exempted from the course-work (successfully completed during M. Phil
Course)
He has been exempted from Research Methodology Course only (successfully
completed during M. Phil Course)
He has successfully completed the PhD course work for the partial requirement for
the award of PhD Degree. His performance in the course work is as follows-
Grade Obtained in Research
Methodology
(PH001)
Grade Obtained in Self Study Course
(Core Subject)
(PH002)
BC BB
Signature of Supervisor:
(Dr. Vithal N Kamat)
Signature of Co-Supervisor:
(Dr. Jatinkumar J Patel)
vii
Originality Report Certificate
It is certified that PhD Thesis titled Price Based Intelligent Automatic Generation
and Control has been examined by us. We undertake the following:
a. Thesis has significant new work / knowledge as compared already published or
are under consideration to be published elsewhere. No sentence, equation,
diagram, table, paragraph or section has been copied verbatim from previous work
unless it is placed under quotation marks and duly referenced.
b. The work presented is original and own work of the author (i.e. there is no
plagiarism). No ideas, processes, results or words of others have been presented
as Author own work.
c. There is no fabrication of data or results which have been compiled / analysed.
d. There is no falsification by manipulating research materials, equipment or
processes, or changing or omitting data or results such that the research is not
accurately represented in the research record.
e. The thesis has been checked using Turnitin (copy of originality report attached)
and found within limits as per GTU Plagiarism Policy and instructions issued
from time to time (i.e. permitted similarity index <=10%).
Signature of the Research Scholar: D Date: 27/01/2021
Name of Research Scholar: Prajapati Yogeshkumar Ramanlal
✓ Place: BVM Engineering College, Vallabh Vidyanagar.
Signature of Supervisor: Date: 27/01/2021
Name of Supervisor: Dr. Vithal N Kamat
Place: Baroda Meters Limited, Vithal Udyognagar.
Signature of Co-Supervisor: Date: 27/01/2021
Name of Co-Supervisor: Dr. Jatinkumar J Patel
Place: G H Patel College of Engineering & Technology
Electrical Engineering Department,Vallabh Vidyanagar

viii

ix

x
PhD THESIS Non-Exclusive License to
GUJARAT TECHNOLOGICAL UNIVERSITY
In consideration of being a PhD Research Scholar at GTU and in the interests of the
facilitation of research at GTU and elsewhere, I, Prajapati Yogeshkumar Ramanlal having
(Enrollment No. 129990909002) hereby grant a non-exclusive, royalty free and perpetual
license to GTU on the following terms:
a) GTU is permitted to archive, reproduce and distribute my thesis, in whole or in
part, and/or my abstract, in whole or in part ( referred to collectively as the
“Work”) anywhere in the world, for non-commercial purposes, in all forms of
media;
b) GTU is permitted to authorize, sub-lease, sub-contract or procure any of the acts
mentioned in paragraph (a);
c) GTU is authorized to submit the Work at any National / International Library,
under the authority of their “Thesis Non-Exclusive License”;
d) The Universal Copyright Notice (©) shall appear on all copies made under the
authority of this license;
e) I undertake to submit my thesis, through my University, to any Library and
Archives. Any abstract submitted with the thesis will be considered to form part
of the thesis.
f) I represent that my thesis is my original work, does not infringe any rights of
others, including privacy rights, and that I have the right to make the grant
conferred by this non-exclusive license.
g) If third party copyrighted material was included in my thesis for which, under the
terms of the Copyright Act, written permission from the copyright owners is
required, I have obtained such permission from the copyright owners to do the
acts mentioned in paragraph (a) above for the full term of copyright protection.
h) I retain copyright ownership and moral rights in my thesis, and may deal with the
copyright in my thesis, in any way consistent with rights granted by me to my
University in this non-exclusive license.
i) I further promise to inform any person to whom I may hereafter assign or license
my copyright in my thesis of the rights granted by me to my University in this
non-exclusive license.

xi
j) I am aware of and agree to accept the conditions and regulations of PhD including
all policy matters related to authorship and plagiarism.
Signature of the Research Scholar:
Name of Research Scholar: Prajapati Yogeshkumar Ramanlal
Date: 27/01/2021
Place: BVM Engineering College
Signature of Supervisor:
Name of Supervisor: Dr, Vithal N Kamar
Date: 27/01/2021.
Place: Baroda Meters Limited, Vithal Udyonagar
Seal:
Signature of Co-Supervisor:
Name of Co-Supervisor: Dr. Jatinkumar J Patel
Date: 27/01/2021
Place: G H Patel College of Engineering & Technology
Electrical Engineering Department,
Vallabh Vidyanagar

xii

xiii
ABSTRACT
In an interconnected power system, the frequency deviates due to the mismatch between
load demand and generation and as well due to the power feeding to the grid from the
renewable energy sources that are highly intermittent. At generator side, the primary and
secondary loop of Automatic Generation Control (AGC) helps regulate deviations in the
frequency in a slow manner due to governor action. Moreover, Availability Based Tariff
Mechanism (ABT) has been implemented to regulate the grid frequency in which the
Unscheduled Interchange (UI) price is also closely linked with secondary frequency
control. Even smart controllers with different techniques for AGC operation are proposed
to regulate frequency on the generator side using different practices by the industries as
well as by researchers, and satisfactory results have no achieved. Also, due to new
policies of the government, such as price based AGC that considers generation marginal
cost and UI price, as well as the introduction of Electrical Vehicles (EVs) that can also
perform as a nonlinear load during their charging time, is proposed to regulate frequency.
Here, due to slow response of generators against sudden load variation, uncontracted
load, governor dead band, generation rate constraint and fluctuating power of grid-
connected due to renewable energy sources the actual system characteristics becomes
non-linear. Also, due to the frequent operation of the generator with these non-linearities,
there is unnecessary fuel consumption, increased wear and tear on generators and an
increase in UI prices of ABT. It also causes tripping of the generators sometimes.
In the present work, for improving existing AGC mechanism, the general framework for
deriving the state-space model of two area restructured power system having 2 numbers
of Generating Companies (GENCOs) with the thermal-thermal non-reheat unit in each
area, and 2 numbers of Distribution Companies (DISCOs) with renewable energy sources
have been considered. The model for UI price of ABT mechanism (CERC, 2016) has
been used to analyze AGC performance based on real-time price linked to frequency. The
marginal cost of the generator and UI price are considered for the price based operation
of the AGC. The fleet of Electrical Vehicles (EVs) operated by bidirectional charger
followed by battery charging/discharging characteristics considered. The suggested
diversified transmission link through which Load Frequency Control (LFC) simulated,
improves the Area Control Error (ACE) due to EVs.

xiv
AGC operation for two area restructured power system incorporated with renewable
energy source have simulated in MATLAB / Simulink environment with and without
EVs. The proposed concept has been shown to cope better than the existing AGC
mechanism. By comparing the results, the effectiveness of the proposed control scheme
for the reduction in the deviations of frequency, generator power and UI price has shown.
Normally, to charge and discharge the EV battery, PI controllers are used to tracking the
load continuously. But due to nonlinearity and uncertainty of load, performance of PI
controller becomes poor. So, fuzzy-based PI controllers are used. It can track better as
compared to PI controllers to reduce the frequency deviations and settling time too. The
comparative analysis between PI and Fuzzy PI controllers are presented.

xv
Acknowledgement
I would like to express my sincere gratitude to all who have inspired and provided the
best support for completing entire research work. On this occasion, I am heartily thankful
to the management of Charutar Vidya Mandal and my parent institute Birla Vishvakarma
Mahavidyalaya.
I am highly thankful to the Principal of BVM, Dr Indrajit Patel for providing all kind of
facility during my entire PhD work. I am also obliged by Head, Electrical Engineering
Department, Dr N G Mishra for providing me infrastructural support where and when
required.
It is my sincere gratitude from the bottom of the heart to my supervisor(s) Dr. Vithal N
Kamar and Dr. Jatinkumar J Patel who have provided opportunity to work and their
continuous support to complete this task under their guidance.
I am also thankful to Gujarat Technological University (GTU) Vice-Chancellor,
Registrar and PhD section for all necessary supports during my work. My gratitude
towards to DPC members Dr. B. R Parekh and Dr. C. D. Kotwal also for their valuable
suggestions, corrections and continuous evaluations of my research work.
This research is dedicated to my family members including my parents, wife shweta, my
children Trijal and Swara, who became a source of continuous encouragement and
provided unconditional support without any voice of dissent or discomfort.
Above all, I am very much thankful to my “इष्टदेव” Lord “Swaminarayan” and
Guruhari “Shree Mahant Swami Maharaj” without whose blessings this entire
research work would have been meaningless for me.
There are several others who have played a significant role in the completion of this entire
work whose names I may have failed to mention here, I extend my sincere thanks to all
who have contributed directly or indirectly in achieving this goal.
Prajapati Yogeshkumar Ramanlal

xvi
Table of Content
Chapter 1 Introduction 1
1.1 Introduction 1
1.2 Deregulation of a power system 1
1.3 Electricity market structural design and classification 2
1.3.1 Electricity market structural design 2
1.4 Market Classification 3
1.4.1 Classification according to Power Market 3
1.4.2 Classification according to the Time of Operation 4
1.5 Ancillary Services 5
1.5.1 Types of Ancillary Services 5
1.5.1.1 Ancillary Services to control Frequency 5
1.5.1.2 Ancillary Services to control Power System
Network
6
1.5.2 Functions of Ass 6
1.5.3 Driving force for development and need of Ancillary
services for India
7
1.5.4 Issues with the growth of ancillary services 7
1.5.5 Benefits of ancillary services 8
1.6 Issues in Indian Power Sector 8
1.7 Challenges in the Indian Power Sector 9
1.8 Frequency Regulation in Indian Power System 10
1.8.1 Primary Control Loop 11
1.8.2 Secondary Control Loop 11
1.8.3 Emergency Control 11
1.9 ABT Mechanism 12
1.10 UI Modelling 14
1.11 A detail description of the state of the art of the research 14
1.12 Thesis objectives and chapter organization 17
Chapter 2 Review of Literature 20
2.1 Introduction 20
2.2 LFC in Single and Multi Area Power System 21
2.3 LFC using Artificial Intelligent Techniques 23
2.3.1 Genetic Algorithm 23
2.3.2 Neural Network 24
2.3.3 Fuzzy Logic 24
2.4 LFC using Other Soft Computing Techniques 25
2.4.1 Particle Swarm Optimization (PSO) 25
2.4.2 Bacterial Foraging Algorithm (BFOA) 25
2.4.3 Tabu Search Algorithm (TSA) 26
2.4.4 Other Optimization Control Techniques 26
2.5 LFC with AC-DC Parallel Tie line 27
2.6 LFC with Flexible AC Transmission System (FACTS) 27
2.7 LFC Based on Other theory 27
2.7.1 Different feedback theory 27
2.7.2 Hierarchical Load Frequency Control 28

xvii
2.7.3 LFC Using Internal Model Control 28
2.7.4 Load Frequency Control Using Observer 29
2.8 LFC based on by consideration of communication delay 29
2.9 LFC Based on different Learning Techniques 29
2.10 LFC with Distributed Energy Generation 30
2.10.1 LFC in Micro Grid 30
2.10.2 LFC in Smart Grid 31
2.10.3 LFC with DR 31
2.10.4 LFC with a V2G control 31
2.10.5 LFC with Hybrid System 32
2.11 LFC in Deregulated Power System 36
2.12 Electrical Energy Storage 38
2.13 Conclusion 38
Chapter 3 Price Based AGC Operation 40
3.1 Introduction 40
3.2 Grid operation in India 40
3.2.1 Scheduling and Dispatch under ABT mechanism 42
3.3 Reforms in Indian Power Systems 45
3.4 Price based AGC block diagram with the control scheme 45
3.5 Mathematical Modeling 48
3.6 Conclusion 49
Chapter 4 AGC operation in Restructured Power System 50
4.1 Introduction 50
4.2 About Restructured Power System 50
4.3 System Under Examination 51
4.3.1 Mathematical modelling of two area restructured
power system
51
4.3.2 AGC operation Under Different Market 54
4.3.2.1 Poolco Based Market 55
4.3.2.2 Bilateral Market 55
4.3.3.3 Bilateral Market with Contract Violation 55
4.3.3 Comparison Between Various Markets 56
4.3.4 Simulation and Results 56
4.4 Price based AGC operation under ABT mechanism 59
4.5 AGC operation during Peak Hours Off-Peak Hours 61
4.6 Conclusion 65
Chapter 5 Energy Storage for Frequency Regulation 66
5.1 Introduction 66
5.2 The need for Electrical Energy Storage 66
5.3 Grid Frequency Regulation Using Electrical Vehicle 66
5.4 Proposed Block Diagram for EV 68
5.5 Price Based AGC Operation in Coordination with EV 71
5.5.1 Poolco Based Transaction 71
5.5.2 Bilateral Transaction 74
5.5.3 Bilateral Transaction with Contract Violation 76
5.6 Conclusion 81
Chapter 6 AGC operation with Renewable Energy Sources (RES) 82
6.1 Introduction 82
6.2 Solar Energy System with Price Based AGC Operation 83

xviii
6.2.1 Block Diagram of Two Area Restructured Power
System with Solar Energy System
83
6.2.2 AGC Operation Under Different Market Conditions 85
6.3 Wind Energy System with Price Based AGC Operation 93
6.3.1 Description of Two Area Restructured Power System 94
6.3.2 AGC Operation Under Different Market Conditions 94
6.4 Conclusion 103
Chapter 7 Price based Automatic Generation Control Using fuzzy-based
Grid Connected Electrical Vehicles
105
7.1 Introduction 105
7.2 Description of the Model 105
7.3 EV Battery Charging Controller 106
7.4 Intelligent Price Based AGC Operation Under the Different
Market
107
7.4.1 Poolco based contract 107
7.4.2 Bilateral contract 111
7.4.3 Bilateral contract with a contract violation 115
7.5 Conclusion 120
Chapter 8 Summary, Conclusion and Future Scope 122
8.1 Original contribution by the thesis 122
8.2 Conclusion 123
8.3 Future Scope 125
List of References 126
List of Publication 156
Appendices 158

xix
List of Abbreviations
ABT Availability Based Tariff
ACE Area Control Error
AFC Alkaline Fuel Cell
AGC Automatic Generation Control
AHC Adapting Hill Climbing
AI Artificial Intelligence
APF ACE Participation Matrix
AS Ancillary Services
BCO Bee Colony Optimization
BESS Bacterial Foraging Optimization Algorithm
BFOA Bacterial Foraging Optimization Algorithm
CAES Compressed Air Energy Storage
CDLC Central Direct Load Control
CERC Central Electricity Regulatory Commission
CPP Captive Power Plants
DB Dead Band
DDC Dynamic Demand Control
DE Differential Evolution
DERs Distributed Energy Resources
DESS Distributed Energy Storage System
DFIG Doubly-Fed Induction Generator
DG Diesel Engine Generator
DGVCL Dakshin Gujarat Vij Company Limited
DISCO Distribution Companies
DMFC Direct Methanol Fuel Cell
DPM Disco Participation Matrix
DR Demand Response
DSSV Detailed Structured Singular Value
EES Electrical Energy Storage
ERC Electricity Regulatory Commission
ERCOT Electric Reliability Council of Texas
EV Electrical Vehicle
FACTS Flexible AC Transmission System
FC Fuel Cells
FESS Flywheel Energy Storage System
FG Fuzzy Logic
FGMO Free Governor Mode Of Operation
FGMO Free Governor Mode of Operation
FO Foraging Optimization
G2V Grid to Vehicle
GA Genetic Algorithm
GALMI Genetic Algorithm Linear Matrix Inequalities
GCE Generation Control Error
GCE Generation Control Error
GDC Generalized Droop Control

xx
GENCO Generation Companies
GHG Green House Gas
GoI Government of India
GRC Generation Rate Constraint
GUVNL Gujarat Urja Vikas Nigam Limited
HTTES High-Temperature Thermal Energy Storage
IEGC Indian Electricity Grid Code
ILMI Iterative Linear Matrix Inequalities
IPP Independent Power Producer
IPS Interconnected Power System
ISGSs Inter-State Generating Stations
ISO Independent System Operator
LCOA lozi Map-Based Chaotic Algorithm
LFC Load Frequency Control
LMI Linear Matrix Inequalities
LMIs Linear Matrix Inequalities
LTTES Low-Temperature Thermal Energy Storage
M Medium
MCFC Molten Carbonate Fuel Cell
MES Mechanical Energy Storage
MGPC Multivariable Generalized Predictive Control
MGVCL Madya Gujarat Vij Company Limited
MOO Minimal Order Observer
MPC Model Predictive Control
NB Negative Big
NLDC National Load Dispatch Centers
NN Neural Network
NS Negative Small
PAFC Phosphoric Acid Fuel Cell
PB Positive Big
PEM Proton Exchange Membrane
PEMFC Polymer Electrolyte Membrane Fuel Cell
PGVCL Pachim Gujarat Vij Company Limited
PHEV Hybrid Electrical Vehicle
PHS Pumped Hydro Storage
PI Proportional Integral
PS Positive Small
PSASRAI Power System Ancillary Service Requirement Assessment Indices
PSO Particle Swarm Optimization
PVs Photovoltaic Systems
PX Power Exchange
Rescos Retail Energy Services Companies
RESs Renewable Energy Sources
RFC Regenerative Fuel Cells
RL Reinforcement Learning
RLDC Regional Load Dispatch Centers
S Small
SERC State Electricity Regulatory Commission
SLDC State Load Dispatch Centers

xxi
SMES Super Magnetic Energy Storage
SOC State of Charge
SOEC Solid Oxide Electrolysis Cells
SOFC Solid Oxide Fuel Cell
SSPS Solid-State Phase Shifter
SVC Static Var Compensators
TATRIPS Two Area Thermal Reheat Interconnected Power System
TCPS Thyristor Controlled Phase Shifter
TES Thermal Energy Storage
TRANSCO Transmission Companies
TSA Tabu Search Algorithm
TSO Transmission System Operator
UC Unit Commitment
UGVCL Uttar Gujarat Vij Company Limited
UI Unscheduled Interchange
V2G Vehicle to Grid
VB Very Big
VIU Vertically Integrated Utility
VIU Vertically Integrated Utility
WTG Wind Turbine Generators
Z Zero
xxii
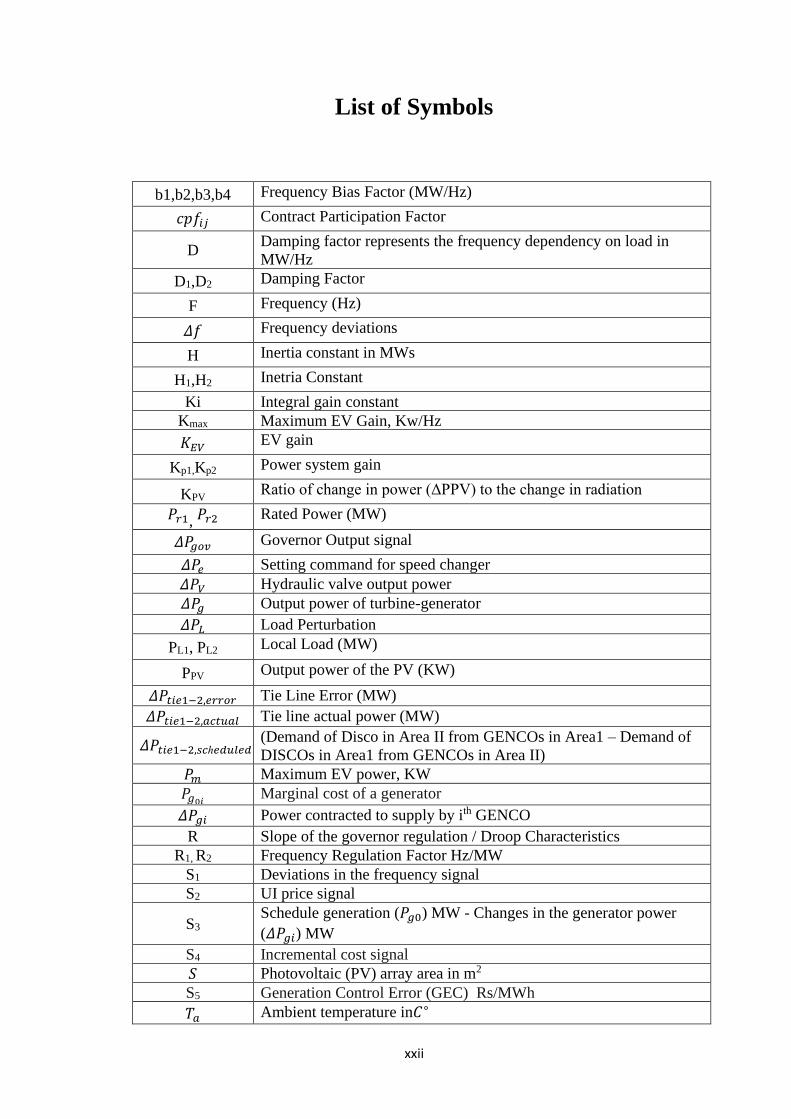
List of Symbols
b1,b2,b3,b4 Frequency Bias Factor (MW/Hz)
𝑐𝑝𝑓𝑖𝑗 Contract Participation Factor
D Damping factor represents the frequency dependency on load in
MW/Hz
D1,D2 Damping Factor
F Frequency (Hz)
𝛥𝑓 Frequency deviations
H Inertia constant in MWs
H1,H2 Inetria Constant
Ki Integral gain constant
Kmax Maximum EV Gain, Kw/Hz
𝐾𝐸𝑉 EV gain
Kp1,Kp2 Power system gain
KPV
Ratio of change in power (ΔPPV) to the change in radiation
𝑃𝑟1, 𝑃𝑟2 Rated Power (MW)
𝛥𝑃𝑔𝑜𝑣 Governor Output signal
𝛥𝑃𝑒 Setting command for speed changer
𝛥𝑃𝑉 Hydraulic valve output power
𝛥𝑃𝑔 Output power of turbine-generator
𝛥𝑃𝐿 Load Perturbation
PL1, PL2 Local Load (MW)
PPV Output power of the PV (KW)
𝛥𝑃𝑡𝑖𝑒1−2,𝑒𝑟𝑟𝑜𝑟 Tie Line Error (MW)
𝛥𝑃𝑡𝑖𝑒1−2,𝑎𝑐𝑡𝑢𝑎𝑙 Tie line actual power (MW)
𝛥𝑃𝑡𝑖𝑒1−2,𝑠𝑐ℎ𝑒𝑑𝑢𝑙𝑒𝑑 (Demand of Disco in Area II from GENCOs in Area1 – Demand of
DISCOs in Area1 from GENCOs in Area II)
𝑃𝑚 Maximum EV power, KW
𝑃𝑔0𝑖 Marginal cost of a generator
𝛥𝑃𝑔𝑖 Power contracted to supply by ith GENCO
R Slope of the governor regulation / Droop Characteristics
R1, R2 Frequency Regulation Factor Hz/MW
S1 Deviations in the frequency signal
S2 UI price signal
S3 Schedule generation (𝑃𝑔0) MW - Changes in the generator power
(𝛥𝑃𝑔𝑖) MW
S4 Incremental cost signal
𝑆 Photovoltaic (PV) array area in m2
S5 Generation Control Error (GEC) Rs/MWh
𝑇𝑎 Ambient temperature in𝐶∘

xxiii
𝑇ℎ Hydraulic valve time constant
𝑇𝑡 Time constant of a turbine
T12 Tie-Line time constant (s)
Tg1,Tg2,Tg3,Tg4 Governor Time Constant (s)
Tp1,Tp2 Power system time constant (s)
Tt1,Tt2,Tt3,Tt 4 Turbine Time Constant (s)
Tw Wind Turbine time constant (s)
𝜌𝑖 UI price signal
𝛾𝑖 Marginal Cost signal
𝜂 Conversion efficiency
𝜑 Solar insolation in (kw/m2)

xxiv
List of Figures
Fig. No Title Page No.
1.1 Deregulation in Power System 3
1.2 Automatic Generation Control (AGC) Process 10
1.3 Operation of AGC loops
12
1.4 UI price vs frequency chart (CERC, 2016) 14
3.1 National Grid in India 41
3.2 Hierarchical Structure of Power Grid in India 42
3.3 Function of Indian Power System Entities 42
3.4 Process of Schedule and Dispatch Under ABT Mechanism 44
3.5 ABT based AGC loop 45
3.6 Flow Chart for GCE Calculation 47
3.7 Control Scheme for price based AGC 47
4.1 Block Diagram of Two Area Restructured Power System 54
4.2 (a) GENCO1 power deviations of Area1 (MW) 56
4.2 (b) GENCO2 power deviations of Area1 (MW), (c) GENCO3
power deviations of Area1 (MW), (d) GENCO4 power
deviations of Area2 (MW)
57
4.2 (e) Area1 Frequency deviations (Hz), (f) Area2 Frequency
deviations (Hz), (g) Tie Line Power deviations (MW)
58
4.3 UI price vs frequency chart (CERC, 2016) 59
4.4 (a) Area1 UI Price deviations (Rs/MWh), (b) Area2 UI Price
deviations (Rs/MWh)
69
4.5 (a) GENCOs power (Mw), (b) Area1 and Area2 Frequency
Deviations (Hz)
63
4.5 (c) Area1 UI price (Rs/Mwh), (d) Area2 UI price (Rs/Mwh),
(e) Tie line power (MW)
64
5.1 Proposed block diagram for the grid frequency regulation 68
5.2 EV battery operating characteristics to Charge and Discharge 70
5.3 (a) Load deviation response of generated power of Area 1, (b)
Load deviation response of generated power of Area 2, (c)
Frequency deviation response of Area 1 and Area 2
72
5.3 (d) Tie line power deviation, (e) Area1 UI Price (Rs/Mwh), (f)
UI Price (Rs/Mwh)
73
5.4 (a) Load deviation response of generated power of Area 1 74
5.4 (b) Load deviation response of generated power of Area 2, (c)
Frequency deviation response of Area 1 and Area 2, (d) Tie line
power deviation
75
5.4 (e) Area1 UI Price (Rs/Mwh), (f) UI Price (Rs/Mwh) 76
5.5 (a) Load deviation response of generated power of Area 1, (b)
Load deviation response of generated power of Area 2
77
5.5 (c) Frequency deviation response of Area 1 and Area 2, (d) Tie
line power deviation, (e) Area1 UI Price (Rs/Mwh)
78
5.5 (f) UI Price (Rs/Mwh) 79
6.1 Model for output fluctuation of (PV) solar power 83
6.2 Two area restructured power system 84

xxv
6.3 Impact of Solar Power on (a) GENCO1 Power Deviation, (b)
GENCO2 Power Deviation, (c) GENCO3 Power Deviation
86
6.3 Impact of Solar Power on (d) GENCO4 Power Deviation, (e)
Area1 Frequency Deviation, (f) Area2 Frequency Deviation
87
6.3 Impact of Solar Power on (g) Tie Line Power Deviation, (h)
Area1 UI Price (Rs/Mwh), (i) Area2 UI Price (Rs/Mwh)
88
6.4 Impact of a Fleet of EVs on (a) GENCO1 Power Deviation, (b)
GENCO2 Power Deviation, (c) GENCO3 Power Deviation
86
6.4 Impact of a Fleet of EVs on (d) GENCO4 Power Deviation, (e)
Area1 Frequency Deviation, (f) Area2 Frequency Deviation
87
6.4 Impact of a Fleet of EVs on (g) Tie Line Power Deviation, (h)
Area1 UI Price (Rs/Mwh), (i) Area2 UI Price (Rs/Mwh)
88
6.5 Impact of Solar Power on (a) GENCO1 Power Deviation, (b)
GENCO2 Power Deviation
89
6.5 Impact of Solar Power on (c) GENCO3 Power Deviation, (d)
GENCO4 Power Deviation, (e) Area1 Frequency Deviation
90
6.5 Impact of Solar Power on (f) Area2 Frequency Deviation, (g)
Tie Line Power Deviation, (h) Area1 UI Price (Rs/Mwh),
91
6.5 Impact of Solar Power on (i) Area2 UI Price (Rs/Mwh) 92
6.6 Impact of Solar Power on (a) GENCO1 Power Deviation, (b)
GENCO2 Power Deviation
89
6.6 Impact of Solar Power on (c) GENCO3 Power Deviation, (d)
GENCO4 Power Deviation, (e) Area1 Frequency Deviation
90
6.6 Impact of Solar Power on (f) Area2 Frequency Deviation, (g)
Tie Line Power Deviation, (h) Area1 UI Price (Rs/Mwh),
91
6.6 Impact of Solar Power on (i) Area2 UI Price (Rs/Mwh) 92
6.7 Block diagram representation two area restructured power
system with Wind Turbine (WT)
95
6.8 Block diagram of Wind Power Plant 95
6.9 Impact of Wind Power on (a) GENCO1 Power Deviation, on
(b) GENCO2 Power Deviation, (c) GENCO3 Power Deviation
96
6.9 Impact of Wind Power, (d) GENCO4 Power Deviation, (e)
Area1 Frequency Deviation, (f) Area2 Frequency Deviation
97
6.9 Impact of Wind Power on (g) Tie Line Power Deviation, (h)
Area1 UI Price (Rs/Mwh), (i) Area2 UI Price (Rs/Mwh)
98
6.10 Impact of Wind Power on (a) GENCO1 Power Deviation, on
(b) GENCO2 Power Deviation, (c) GENCO3 Power Deviation
96
6.10 Impact of Wind Power, (d) GENCO4 Power Deviation, (e)
Area1 Frequency Deviation, (f) Area2 Frequency Deviation
97
6.10 Impact of Wind Power on (g) Tie Line Power Deviation, (h)
Area1 UI Price (Rs/Mwh), (i) Area2 UI Price (Rs/Mwh)
98
6.11 Impact of Wind Power on (a) GENCO1 Power Deviation, (b)
GENCO2 Power Deviation
99
6.11 Impact of Wind Power on (c) GENCO3 Power Deviation, (d)
GENCO4 Power Deviation, (e) Area1 Frequency Deviation
100
6.11 Impact of Wind Power on (f) Area2 Frequency Deviation, (g)
Tie Line Power Deviation, (h) Area1 UI Price (Rs/Mwh),
101
6.11 (i) Area2 UI Price (Rs/Mwh) 102
6.12 Impact of Wind Power on (a) GENCO1 Power Deviation, (b)
GENCO2 Power Deviation
99
xxvi
6.12 Impact of Wind Power on (c) GENCO3 Power Deviation, (d)
GENCO4 Power Deviation, (e) Area1 Frequency Deviation
100
6.12 Impact of Wind Power on (f) Area2 Frequency Deviation, (g)
Tie Line Power Deviation, (h) Area1 UI Price (Rs/Mwh),
101
6.12 (i) Area2 UI Price (Rs/Mwh) 102
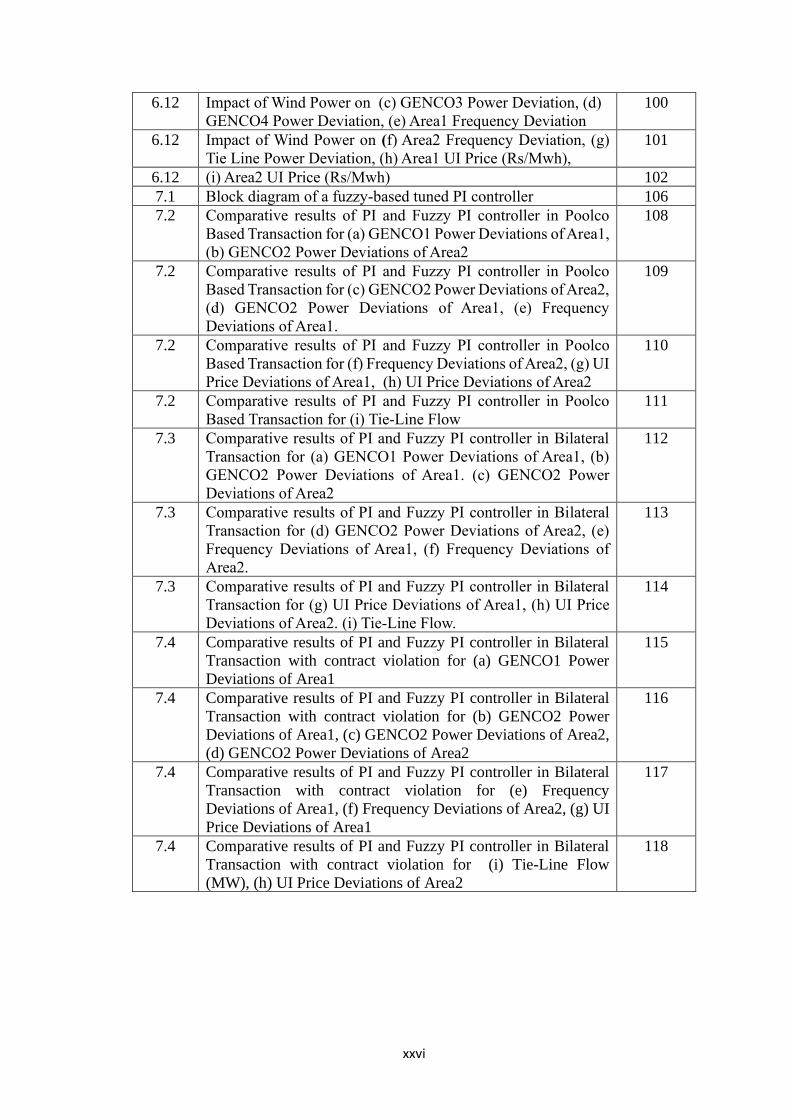
7.1 Block diagram of a fuzzy-based tuned PI controller 106
7.2 Comparative results of PI and Fuzzy PI controller in Poolco
Based Transaction for (a) GENCO1 Power Deviations of Area1,
(b) GENCO2 Power Deviations of Area2
108
7.2 Comparative results of PI and Fuzzy PI controller in Poolco
Based Transaction for (c) GENCO2 Power Deviations of Area2,
(d) GENCO2 Power Deviations of Area1, (e) Frequency
Deviations of Area1.
109
7.2 Comparative results of PI and Fuzzy PI controller in Poolco
Based Transaction for (f) Frequency Deviations of Area2, (g) UI
Price Deviations of Area1, (h) UI Price Deviations of Area2
110
7.2 Comparative results of PI and Fuzzy PI controller in Poolco
Based Transaction for (i) Tie-Line Flow
111
7.3 Comparative results of PI and Fuzzy PI controller in Bilateral
Transaction for (a) GENCO1 Power Deviations of Area1, (b)
GENCO2 Power Deviations of Area1. (c) GENCO2 Power
Deviations of Area2
112
7.3 Comparative results of PI and Fuzzy PI controller in Bilateral
Transaction for (d) GENCO2 Power Deviations of Area2, (e)
Frequency Deviations of Area1, (f) Frequency Deviations of
Area2.
113
7.3 Comparative results of PI and Fuzzy PI controller in Bilateral
Transaction for (g) UI Price Deviations of Area1, (h) UI Price
Deviations of Area2. (i) Tie-Line Flow.
114
7.4 Comparative results of PI and Fuzzy PI controller in Bilateral
Transaction with contract violation for (a) GENCO1 Power
Deviations of Area1
115
7.4 Comparative results of PI and Fuzzy PI controller in Bilateral
Transaction with contract violation for (b) GENCO2 Power
Deviations of Area1, (c) GENCO2 Power Deviations of Area2,
(d) GENCO2 Power Deviations of Area2
116
7.4 Comparative results of PI and Fuzzy PI controller in Bilateral
Transaction with contract violation for (e) Frequency
Deviations of Area1, (f) Frequency Deviations of Area2, (g) UI
Price Deviations of Area1
117
7.4 Comparative results of PI and Fuzzy PI controller in Bilateral
Transaction with contract violation for (i) Tie-Line Flow
(MW), (h) UI Price Deviations of Area2
118

xxvii
List of Table
Table No Title Page No.
4.1 DPM Matrix 52
4.2 Calculated Parameters for all cases 56
4.3 Two Area Power System (GUVNL) 61
4.4 Area1 (MGVCL,DGVCL) 62
4.5 Area2 (UGVCL,PGVCL) 62
5.1 Calculated Power At GENCOs And Tie Line (Poolco Based
Transaction)
72
5.2 Calculated Power At GENCOs And Tie Line (Bilateral
Transaction)
74
5.3 Calculated Power At GENCOs And Tie Line 77
5.4 Summary of Comparison with EV and Without EV 79
6.1 Calculated Power At GENCOs and Tie Line (Poolco Based
Transaction)
85
6.2 Calculated Power At GENCOs And Tie Line (Bilateral
Transaction)
89
6.3 Comparative Analysis of PV and EV integration 92
6.4 Calculated Power At GENCOs And Tie Line (Poolco Based
Transaction)
96
6.5 Calculated Power At GENCOs And Tie Line (Bilateral
Transaction)
99
6.6 Comparative Analysis of WT and EV integration 102
7.1 Fuzzy logic Rules 107
7.2 Calculated Power At GENCOs And Tie Line (Poolco Based
Transaction)
108
7.3 Calculated Power At GENCOs And Tie Line (Bilateral
Transaction)
112
7.4 Calculated Power At GENCOs And Tie Line (Contract
Violation)
115
7.5 Comparative Analysis of PI and FGPI integration 118

xxviii
List of Appendices
Title Page No.
Appendix A Challenges in the Indian Power Sector 158
Appendix B Mathematical modelling of AGC 163
Appendix C System Data 165
Appendix D Classification of Energy Storage (ES) 166
Appendix E Fuzzy Logic 172

1
CHAPTER 1
Introduction
1.1 Introduction
There are tremendous changes in electricity to generate, transmit and distribute in past
days. In the various parts around the world, an electrical grid is differentiated concerning
their design, ownership, operating process and pattern. An electricity utility market is a
monopoly under their control. These utilities are private or government-owned and
regulated by the government. The Indian government has started the “Power for All"
mission to give power supply to all the people. India has one “National Grid” with an
installed power generation capacity of 360.788 GW as on 31st August 2019. To operate
and control power in a large grid is centralized, secure, reliable and cost-effective. Since
a long time, economists of the electricity area had started thinking and questioning for
the market discipline-oriented operation. Presently, the electricity market is the open-
access market. For the transmission owning utilities, it is necessary to provide equal
access to third parties. It has made the competition possible.
1.2 Deregulation of A Power System
The process of changing the electricity rules and regulation of electricity is known as the
deregulation of a power system. It controls the electric industry and gives consumers the
option of power suppliers. So, the customers will be benefited to get electrical power with
a lower rate due to the price competition between electric industries. It improves the
process of use of electricity and economic efficiency. The common structural design of
the deregulation is presented in Fig 1.
The main objectives behind deregulation are:
➢ To supply power for all realistic load.

Introduction
2
➢ To encourage competition between generation and supply.
➢ To give quality service and continuous power supply.
The advantages associated with deregulation are:
➢ Efficient utilization of electric network capacity
➢ To optimize the supply of energy
➢ It clears the electricity rates to consumers.
➢ Reduction in electricity rates.
➢ Use of efficient technology by replacing old and bad technologies.
➢ Restructuring in price signal has improved the efficiency of usage.
➢ Improvement in the choice of the consumer to purchase electricity.
➢ Power will supply to a shortage area
➢ Ancillary services prices reduced.
1.3 Electricity Market Structural Design And Classification
1.3.1 Electricity Market Structural Design
There are four players such as GENCO, TRANSCO, DISCO & ISO in the electricity
market [237]. The market architecture of an IPS is presented in Fig. 1.1.
A. GENCOs: It is an independent entity and runs one or more generators. Generator
running schedule depends on the power bids in a competitive market. It can also
negotiate for power generation from others if their generation is not available.
B. TRANSCOs: These companies are the owners of the transmission line and
operated by themselves. It provides transmission line and electricity transport
from the generator to all customer. On behalf of their services, they seek a
transmission tariff.
C. DISCOs: The DISCOs operate the local electrical distribution system in their own
area. They purchase wholesale power from the spot market. Also, they purchase
power from the direct contracts between GENCOs and DISCOs.
D. ISO: It is taking care of reliable and harmless operation of IPS. It will not take
part in electricity market trading and run independently.

CHAPTER 1
3
E. Customers: The customers have various options to purchase power and use in
deregulation.
F. Retailers: It is the electric power retailer.
Generation
Transmission
Distribution
Costomer
GENCOs
TRANSCOs
DISCOs
Costomer
PX
ISO
Rescos
Before After
Deregulation
Deregulation
Deregulation
FIGURE 1.1 Deregulation in Power System.
1.4 Market Classification
The markets are classified in two ways according to Power Market and the Time of
Operation.
1.4.1 Classification According to Power Market
The classification of the market is as follows.
Energy market: A market in which electricity trading is competitive is known
as an energy market. This centralizes mechanism makes energy trading easier
between buyers and suppliers. After the submission of bids by sellers and buyers,
the electricity market clearing price will determine. Electrical energy rates are
reliable for market participants as well as consumers.
Introduction
4
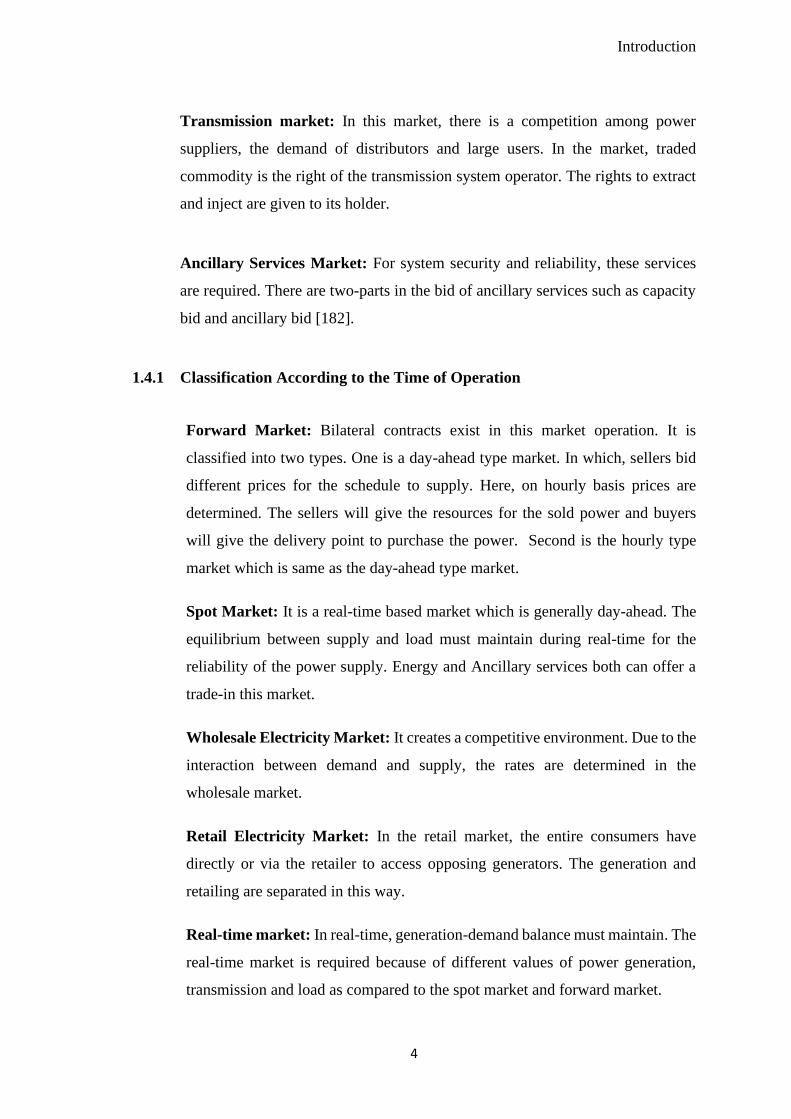
Transmission market: In this market, there is a competition among power
suppliers, the demand of distributors and large users. In the market, traded
commodity is the right of the transmission system operator. The rights to extract
and inject are given to its holder.
Ancillary Services Market: For system security and reliability, these services
are required. There are two-parts in the bid of ancillary services such as capacity
bid and ancillary bid [182].
1.4.1 Classification According to the Time of Operation
Forward Market: Bilateral contracts exist in this market operation. It is
classified into two types. One is a day-ahead type market. In which, sellers bid
different prices for the schedule to supply. Here, on hourly basis prices are
determined. The sellers will give the resources for the sold power and buyers
will give the delivery point to purchase the power. Second is the hourly type
market which is same as the day-ahead type market.
Spot Market: It is a real-time based market which is generally day-ahead. The
equilibrium between supply and load must maintain during real-time for the
reliability of the power supply. Energy and Ancillary services both can offer a
trade-in this market.
Wholesale Electricity Market: It creates a competitive environment. Due to the
interaction between demand and supply, the rates are determined in the
wholesale market.
Retail Electricity Market: In the retail market, the entire consumers have
directly or via the retailer to access opposing generators. The generation and
retailing are separated in this way.
Real-time market: In real-time, generation-demand balance must maintain. The
real-time market is required because of different values of power generation,
transmission and load as compared to the spot market and forward market.

CHAPTER 1
5
Pool Market: In this market, mainly customer (buyer) and supplier (seller) are
participating. Both will submit bids and prices of energy into the pool. System
Operator (SO) will determine locational marginal prices.
Bilateral Market: In this market, buyer and seller both will participate in
delivering and receipt of power. This process may be direct or through some
broker. The role of SO is only to verify the availability of sufficient transmission
capacity for the execution of the transaction.
1.5 Ancillary Services (ASs)
Ancillary services help to support the interconnected grid to transmit reliable, quality and
secure power [182]. On 10th April 2013 CERC has introduced different ASs for the
country power market. It is designed for supplementing efforts to keep power quality,
reliability and safety of the interconnected grid. Worldwide, the ASs becomes most
popular in the electricity supply system. Also, in India, along with the grid restructuring,
ancillary services such as frequency stability, voltage stability, generation storages,
scheduling, and dispatch are introduced and developed. An introduction of the ASs in an
effective way is discussed in [267]. Ancillary services are classified as follows.
1.5.1 Types of ASs.
1. Ancillary Services to control Frequency
2. Ancillary Services to regulate the grid Network
1.5.1.1 Ancillary Services to Control Frequency
It maintains the frequency in the preferred range. The generation and load should be
balanced in real-time. Generators are running under the AGC loop help to normalize the
frequency. AGC loop works in mainly three levels of control, (a) Primary loop of
frequency control with a reaction period from 5 to 10 seconds, (b) Secondary loop of
frequency control with a reaction period from 10 seconds to 10 minutes and (c)
Emergency / Tertiary loop of frequency control with a reaction period from 10 to 30

Introduction
6
minutes. The governors by AGC and demand-side management both help to regulate
frequency.
1.5.1.2 Ancillary Services to Control Power System Network
The power system network parameter in a prescribed range is maintained. The
Generators, Synchronous Condensers, FACTS devices, Capacitors, Inductors and DERs
help to provide network-controlled services. The network-controlled ancillary service is
also distributed for the following purpose.
a) Power flow control: - This service use in the IPS for power flow control.
b) Voltage control: - This service use to keep the voltage within a specified range,
the primary, secondary and tertiary loop helps to maintain voltage.
c) System restart: - These types of services are hold for emergency conditions. It
helps to restart the system from blackout situations. System backup capacity is
required to return the system into normal operating mode, after a partial or major
blackout.
Based on the requirement of the service, ancillary services are further classified as
follows.
• Services essential to do a daily operation.
• Services essential to stop unfortunate accidents.
• Services essential to restore all systems after the blackout.
1.5.2 Functions of ASs
The functions of Ass are listed below.
i) Regulation: - To keep generation-demand balance minute to minute.
ii) Load following: - To do load-generation equilibrium at the end of the scheduling
period.
iii) Operating reserve: To provide the unloaded generators interconnected with grid
immediately in case of transmission or generation outages.
iv) Provide support to regulate voltage and reactive power: Regulation of voltage by
managing the reactive power with the help of capacitor banks and generator.
v) System black start capability:- Generation unit can restart the generation due to
blackout without any help from the grid side. Also, to help another unit to start.

CHAPTER 1
7
vi) Network stability services: - Give support from generation sources for the stability
of the transmission line by using fast responding equipment.
1.5.3 Driving Force for Development and Need of Ass for India
The following are the driving force for the existence of ASs in the Indian power
market.
i) Various buyers as well as sellers of power in the electrical power market.
ii) Restructuring of a power system.
iii) Shortage of enough reserves.
iv) Frequency controller.
v) The slow action of AGC loops such as primary, secondary, and tertiary.
vi) Sudden load shedding.
vii) Power shortage during peak hours.
1.5.4 Issues with the Growth of AS
1. Power cuts in power system:- Power cuts are due to the reasons such as inadequate
infrastructure, variable load condition and the inability of DISCOs to purchase
expensive power, etc.
2. Fluctuating nature of renewable power:- Due to the variable nature of renewable
power, it affects scheduling and pricing. Also, the prediction of renewable power
is difficult, which increases more challenges to regulate the frequency.
3. Power requirement during peak hour:- Because of the uncertain rise in the demand
during peak hours, the generation-demand imbalance creates. So, the stored
power is required.
4. Network issues: - Damage in the network due to thermal overload, instability of
frequency and voltage.
5. Identify ancillary service for effective solution:- Identification required ancillary
service to maintain system reliability. Also, provision of payment against
ancillary services.

Introduction
8
1.5.5 Benefits of Ancillary Services
The ancillary services help to fulfill the customer electricity requirement, gives financial
inspiration and utilization of distributed sources potential, thus use undispatched
generation. It helps to stabilize the grid more stable. The performance of ancillary
services discussed in detail [75]. The following are the steps to control the issues faced
in providing AS.
1. To make regulatory policy to design and procure market mechanism.
2. To prepare the framework of AS providers.
3. The framework of policy to provide ancillary services, the rule framework for the
provision of AS.
4. Guideline of tariffs for power procurement aspects so that price can be affordable
to the consumer.
5. FGMO helps to regulate frequency. Distributed generation sources can also
participate in frequency regulation as an ancillary service.
Because of assorted nature and requirements of the Indian power sector, it is a
requirement to increase the reliability and quality of power system network.
1.6 Issues in Indian Power Sector
Worldwide India is third in electricity production and fourth in consumption [297]. India
has 319.60 GW installed generating capacity [298] and 360.788 GW as on 31st August
2019. The following issues are noted in the Indian power system.
Power Generation
In India, NTPC is the biggest power generation company from coal. It has an
installed capacity of 55126 MW, declared in the annual audit report of May 2019.
Up to 2032, the capacity will expand 128000 MW [300]. Because of poor coal
quality and insufficient stock, the plant load factor is low [299]. Also, India lacks
private investment in the coal sector. There is a monopoly in the production of
coal by Coal Indian limited. Because of these reasons, the utilization rate of
operational plants will reduce the generated capacity and results in poor financial
growth.

CHAPTER 1
9
Power Transmission
India’s largest power transmission utility is the Power Grid Corporation of India
(PGCI) [303]. It has a transmission capacity of 90650 MW as on February 2019.
It manages the grid through National Load Dispatch Centre (NLDC) at a national
and regional level grid. The issues at this level are the design of tariff rates,
Investment and to allot space and media for the transmission of the electric power
[302].
Power Distribution
As per electricity Act 2003 in Open Access market customer and DISCOs can
buy electric power directly from the generating companies. But awareness at
costumer level is required. One of the salient features in the open-access market
is the competition between the utilities. Major issues in the power distribution are
the reduction in the technical and commercial losses, power quality, availability
of independent feeder, automation for power distribution and availability based
tariff [301].
1.7 Challenges in the Indian Power Sector
In India, the total generating capacity was 157 GW on 31st March 2010. It increased to
360 GW in 2019. There is a drastic increase in demand, and the power shortage will be
there in the near future [47].
A. Demand supply gap
India has increased peak demand recorded from 119 GW in 2009 to 183 GW in 2019.
The demand has continuously increased, as shown in Fig. A.5 (Appendix A). In 2009
the peak demand and the met peak demand were 119 GW and 104 GW. The deficits were
-12.7%. In 2019 the peak demand was 183 GW and met peak demand was 182 GW with
the deficits -0.7%. Day by day, the generation has to increase against the demand.
Presently, the deficits are reducing, as shown in Fig. A.6 (Appendix A).

Introduction
10
B. Huge Transmission & Distribution Losses
Transmission and Distribution Losses during the year 2012-13 was 23.04 %. Every year
the losses are reduced. In the year of 2016-17 losses were 21.42%. Statistics of
Transmission and Distribution Losses is presented in Fig. A.9 (Appendix A).
1.8 Frequency Regulation in Indian Power System
In an interconnected power system, unexpected demand variation causes generation-
demand imbalance. It results in the fluctuations of frequency from its fundamental value.
It affects power system operation and control. Also, affects the reliability and security of
the grid. It reduces the efficiency of the network by damage in the equipment, reduces
the load efficiency, and increases the overloading of overhead lines and triggering the
protective systems. The grid frequency can control by controlling the speed of the
generator. So, it can maintain by regulating the speed of the generator. The governor
mechanism regulates the speed. The real-time speed of the machine is sense and changes
in speed in the form of error signal are generated. Following the error signal, an integral
controller helps to control the turbine input by moving the steam valve.
In the AGC operation, generator runs constantly to follow the load. An expense will be
less in AGC operation. The AGC stabilize the fluctuations in frequency as well as tie-
line flow. In the AGC process, there are mainly two frequency loops as shown in Fig. 1.2
A first control loop is primary control loop operates in a self-regulating mode to regulate
frequency error. This loop attends normal frequency deviations. But, the frequency
cannot be regulated fully due to the governor slow response [261][125]. After a few
seconds, the secondary control loop will operate for the control of remaining fluctuations
in frequency and power. In this loop, the controller with the integral control helps to
minimize the error. It is also defined as a supplementary control loop or LFC loop. Due
to some reasons such as loss of generation, load shedding or some fault, there is a major
inequity between generation and load. It creates rapid changes in frequency. The
emergency control loop will operate to establish frequency. The mathematical modeling
for the AGC operation is given in Appendix B.

CHAPTER 1
11
Controller
Speed
Changer
Motor
Speed
governor
Hydraulic
Amplifier
Frequency
sensor Load
GeneratorTurbine
Steam / Water
Primary Control Loop
Secondary Control Loop
f
mP
cP
tieP
FIGURE 1.2 Automatic Generation Control (AGC) Process.
1.8.1 Primary Control Loop
Primary control loop makes initial coarse adjustment of frequency. It reacts between 2 to
20 seconds (depending on the type of turbine) to adjust turbine mechanical torque against
load variation. The governor senses the variation in the speed. Following the changes in
the speed, the hydraulic amplifier generates necessary mechanical forces for the
movement of the main valve. The mechanical power regulated by moving (open or close)
the valve. By varying the turbine power, the frequency can regulate. The input (steam or
water) of the prime mover is regulated constantly against the frequent changes in the
frequency. In India, the speed governors of generators were allowed to respond with
frequency ranges from 47.5 to 51.5 Hz under the AGC operation to regulate frequency
using tie-line bias control [35]. Purpose of AGC to control megawatt is discussed in
[203].
1.8.2 Secondary Control Loop
It is also known as LFC which has a key role during AGC operation. This loop is
performing its function via frequency deviation. The resulting signal generated from the
dynamic controller helps to change the speed of the speed changer. The speed changer
generates an error signal to operate the governor. The error signal is used to restore the
frequency.
1.8.3 Emergency Control
During the events such as load shedding, emergency control action should perform to
avoid the risk of generation loss or system shutdown. Due to the fall in the frequency

Introduction
12
below 50 Hz, the load shedding would be used. It is an emergency control action by
curtailing system load to maintain system reliability.
In Fig. 1.3 operation of primary, secondary and emergency control loops are presented.
All generators will react quickly for the event 1. Then the system frequency normalizes
with a fixed value, but due to the droop in the generator, the frequency will settle down
on different value. The value of set frequency is proportionate to the changes. Due to the
different value of set frequency, the power will flow on tie-line. It will differ from
scheduled value. In event 1, fall out in the frequency is not very fast, and the AGC system
will get enough time to regain the frequency by balancing the power. As observed from
event 2, the fallout in the frequency is very fast, and if it crosses the permissible limit,
then emergency control actions such as load shedding will initiate. Emergency control is
another level of control in AGC operation. In case of insufficient secondary reserves,
sometimes there will meet a requirement to trip the power, redistribute the output of the
generator or control from the demand side.
FIGURE 1.3 Operation of AGC loops.
1.9 ABT Mechanism
In July 2002 the ABT introduced [29]. There is a total of three charges such as Capacity
charge, Energy charge and UI charge. The scheme named availability because the
generating company will be paid higher if the average real availability of the plant is
higher than real availability and payment will lower if an average actual availability
achieved is lower.

CHAPTER 1
13
A. Capacity Charge (Fixed Charge):
It is associated with the plant accessibility such as its ability to transport power on a daily
basis.
The yearly payment to the generating company is depending on the plant availability.
B. Energy Charge (Variable Charges):
In the power plant, the cost of fuel is a variable for power generation. It is according to
the scheduled generation as a substitute of actual generation. So its name is a variable
charge.
C. Unscheduled Interchange (UI) Charge:
For the frequency greater than 50 Hz, the UI rates are low and frequency less than 50 Hz
UI rates are high. In each 15-minute time block deviations has been recorded by ABT
meters. User has to pay UI charge in case of over drawl. During the low-frequency
condition high UI charge applied, which controls the excess drawl and low throughout
high-frequency situation means excess energy in the grid.
Advantages of ABT Mechanism
It plays a role dramatically in the operation of Indian regional grid.
1. ABT mechanism improves grid discipline by controlling the grid parameters.
2. It limits the high-frequency period.
3. Provides better grid discipline by controlling the grid parameters.
4. In real-time, it is possible to make the load and generation balance.
5. It provides the facility of over drawls / under drawls within the frequency band.
A state will be benefited by overdrawing from the grid during high frequency.
6. It allows the bilateral transaction among the states.
7. Utilization of hydel resources during the high cost of power due to frequency-
based UI price and incremental cost.
8. Intra-regional trading of power is possible.
9. In balancing the generation and load.

Introduction
14
10. Improve the output capability of the plant by providing incentives during peak
hours.
11. Fixed charges are applicable based on the availability, and the variable charge
will be applicable during off-peak hours.
12. Lowering in the frequency is due to the over drawl during the peak hours. By the
high rate of UI charges during peak hours low-frequency problem is solved.
1.10 UI modelling
In India, ABT mechanism is applied by CERC for pricing bulk power. Out of all three
components, the third component UI Charge is linked to frequency. UI rates will be low
when the frequency is more that 50 Hz and UI rates are higher for the frequency below
50 Hz. ABT meters record deviations from the schedule in 15-minute time blocks. For
price based operation, data of UI curve from CERC, 2016 are used (see Fig. 1.4), where
the set frequency ranges between 49.7 and 50.05 Hz. For the frequency range between
50.05 Hz to 50.00 Hz, the charges for each 0.01 Hz step is equivalent to 35.60 paisa /
kWh and 20.84 paisa / kWh in the frequency range below 50 Hz to below 49.7 Hz.
0
1000
2000
3000
4000
5000
6000
7000
8000
9000
UI C
har
ges
(IN
R/K
wh
)
Frequency (Hz)
FIGURE 1.4 UI price vs frequency chart (CERC, 2016).
1.11 A Detail Description of the State of the Art of the Research
Worldwide electric power utilities had adopted the deregulated market scenario and the
restructuring process is undergoing [233]. The GENCOs, TRANSCOs, DISCOs as well
as ISOs are the individual entities in the restructured power system. In the current state
DISCOs having the authorization to do a deal with the same area GENCOs. It is known

CHAPTER 1
15
as “Poolco Based Transaction” and also with any other control areas which are known as
“Bilateral Transaction”. The entire contract will in the supervision of ISO. For reliability
of power supply, many ancillary services such as reactive power control, voltage stability,
and minimization of transmission losses, load balancing, scheduling, dispatch and energy
balancing have been provided by system operators. In such a situation either ISO or TSO
has been entrusted with the deal of procurement of these services. It has been observed
that AGC, also known as “LFC” is widely accepted for ancillary service in practice
[289][41]. The various problems of LFC after deregulation has been discussed [224].
Operation of Price based AGC in a deregulated environment been encouraged as the
future business environment for electric utility [162] and the case study with different
load following contracts have been represented in [59]. Price based AGC outline is
reported in [212] by doing operational changes in the AGC for Bilateral as well as Poolco
based market. In a competitive electricity market, frequency regulation linked to price is
professionally used by investigators [291]. Under the ABT mechanism, the controller
purpose is to reduce the frequency variations and reschedule generating unit for the
economical operation. So, the frequency linked UI price with the generation marginal
cost can be included in the system running under a conventional AGC mechanism to
satisfy the objective. In this direction, Tyagi and Srivastava [287] have developed a
mathematical framework. In which the frequency is transformed into the UI price signal
in the secondary loop, which is known as ‘ABT loop’. Then UI price is matched with the
generator marginal cost, which produces an error signal ‘GCE’. This GEC helps to nullify
the frequency deviations followed to the reference power setting by the generation
control. But due to the UI price and marginal cost mismatch problem in running the
model. Modified GEC scheme has been proposed in [49] to over the above problem with
the GCE generation. Here, GEC is generated by comparing the UI cost, the marginal cost
and the reference UI price. This model has been checked under CERC 2009 regulations.
The GCE is the difference of either UI price and marginal cost or UI price and reference
UI price or sometimes even zero. If the frequency fluctuates from the rated value by
considering the fixed value of the UI prices with system marginal cost near to or more
than the reference UI price then, it can conclude that the control method is highly sensitive
for the variable values of the UI price and marginal cost. ABT based LFC loop for an IPS
presented in [112]. Also, in the multi-area network, the price based LFC is applied in
[94], but it not successful to normalize the frequency. It is concluded that by making the

Introduction
16
generation-load balance, the frequency deviations can nullify during the loading-
unloading condition. Big penalties to be paid by GENCO for inactive participation to
control frequency against load variation. During the day, for each 15 min duration, an
average frequency is monitored and the UI charges will be calculated against frequency
value. To minimize UI charges GENCO set the generation. By following this issue an
effort has been made to build up a new control design to reduce the UI prices and
generation fuel expenditure to normalize the frequency against deviations.
Still, the process is hard for the synchronous generator to track the load deviation
completely due to slow dynamic response [112]. Also, because of frequent power
changes with the integration of renewable energy sources, it has been difficult to regulate
frequency due to insufficient regulation reserve capacity and rapid power imbalance
[226][234]. Thermal and hydro units can be used to regulate frequency. Due to limited
regulation capacity, slow response according to the power demand changes and frequent
operation of generator decreases its life as well as efficiency [310]. Finally increases
generation cost, labor cost and maintenance cost due to wear and tear of generators [61].
Under these circumstances, a usual frequency control by the governor for rapid load
changes due to its slow response becomes very difficult. Also, sometimes either voltage
or frequency will fall out or the generator fails.
Based on recent literature so far, AGC has been reformulated in restructured environment
by implementing various methods like PSO [243], BFOA [141], artificial intelligence
methods like genetic algorithm [219], NN [27], fuzzy logic [142], distribution energy
storage technologies like BESS [252], Flywheel [307], super capacitor [186], LFC with
SMES [247], battery swapping station [15] and many more. Among this variety of
feasible solutions, BESS is an extensive choice and recent technological aspect now a
day due to quick and fast action for lessening overshoots of frequency deviations in the
restructuring of power system [85]. Electrical vehicles are large distributed battery energy
storage and will use broadly in upcoming transportation system [104] and has the
potential to provide the distributed spinning reserve to the power system. The Customer
side Electrical vehicles (EV) will use widely due to the limited life of petroleum products,
less battery charging cost and for the reduction in greenhouse gasses [182]. In [204]
potential to overcome load frequency control problem with an electric vehicle, An EV
swapping station [105] and energy storage system (BESS) with appropriate results [216]

CHAPTER 1
17
has been discussed. In present smart grid power system, renewable power is intermittent
and there is a need for controllable energy storage. The battery of EV can be used to
combine as a buffer and energy storage against the energy generated by renewable plants
[85]. The V2G and G2V schedule can be managed by vehicle users [293] followed by
battery SOC condition to suppress frequency fluctuation in two area IPS [182]. To
enhance both performance and robustness for an operation of V2G and G2V mode a
bidirectional controller with scheduled charging is required. For the bidirectional
operation to track the load changes constantly bidirectional charge controllers are used in
practice.
In this work, the strategy for EV bidirectional operation of charger for load frequency
control by participating in AGC operation has been proposed and results with and without
an EV integration to load frequency control have been simulated.
1.12 Thesis Objectives and Chapter Organization
The main objective of present work as per the issues discussed and concern literature are
as follows.
Frequency deviations caused by the uncertain load variation and changes in power
pumped by RES into the grid require to be investigated. For this to come up with the
solutions for the various issues such as minimization of settling time and peak overshoots
in frequency deviation and also UI price will be the main focus of my research. To
regulate the deviations in frequency, generator power and tie-line flow we plan to devise
new control mechanism.
To achieve these objectives, the scope of work includes:
1. To develop a mathematical model of 2 area restructured IPS with a thermal-thermal
non-reheat unit that can identify the deviations in the frequency as well as power.
Also, to simulate the same in MATLAB / Simulink environment.
2. Using the model developed, to observe the deviations in frequency and power during
AGC operation under Poolco based contract and Bilateral contract conditions of
GENCOs and DISCOs.

Introduction
18
3. To devise a new control strategy for bidirectional charging / discharging of EVs that
can help aggregated EVs to participate in minimizing the frequency and power
fluctuations.
4. To analyze the results of the new control mechanism for verification of its
effectiveness in the AGC operation.
The thesis has to organize in eight chapters. The present chapter introduces the
deregulated power system with different types of competitive electricity markets and real-
time markets. Also, the types and need of ancillary services are discussed. Moreover, the
ABT mechanism with its importance is discussed. In ABT the modeling of UI curve is
presented. In the section of a brief description of the state of the art of the research, the
potential of EV to participate in the AGC operation under different market conditions is
presented. .
Chapter 2 represents the review of literatures of different techniques used for AGC
operation to regulate frequency. The techniques discussed are LFC using different soft
computing methods such as PSO, BFOA, the LFC based on AI techniques such as FG,
NN and GA, LFC in smart grid and micro grid, and application of distributed energy
storage systems such as BESS, Flywheel, Super capacitor, SMES and Battery swapping
station to regulate the frequency. Finally, the potential of EV is presented to regulate
frequency.
Chapter 3 describes the issues as well as challenges in power generation, its transmission
and distribution in the grid. Also, issue of frequency regulation and its solution by ABT
mechanism is presented. By using the UI component of ABT mechanism the AGC has
been discussed.
In Chapter 4, the mathematical model of two area restructured power system for AGC
operation is presented and simulated. The results of deviations in the frequency, generator
power, tie-line flow and UI charges are presented during the AGC operation. Moreover,
the AGC operation during peak hour and off-peak hour is presented.
Chapter 5 highlights the different types and needs of ESS for grid frequency regulation.
From these storage technologies, EV has been focused due to its quick response. An EV
model with bidirectional charging / discharging characteristics is presented with the
diversified transmission link for the participation in AGC. The comparative results of the

CHAPTER 1
19
deviations in GENCO power, tie line flow, and frequency and UI price with EV and
without EV are presented and discussed.
In Chapter 6 describes an impact of solar energy and wind energy on frequency as well
as UI price during the AGC operation. The solution to reduce the deviation range of
frequency and UI price is presented under the different market with comparative results.
Chapter 7 presents the fuzzy logic application. The AGC is presented by considering the
UI price. The comparative results with PI and FGPI controllers are presented and
discussed.
In Chapter 8 discussions of the original contributions, conclusion and the future scopes
are presented.
.

20
CHAPTER 2
Review of Literature
Now days, LFC is very popular ancillary service in interconnected power system
functioning as reduction in the Generation Control Error (GCE). This presented chapter
over here refers worldwide history of various types of controllers and applied smart
control strategies in generation, transmission and distribution areas of IPS. Additionally,
in deregulated power system different types of energy storage at distribution area are
reviewed and highlighted for upcoming research work. It has been observed from
rigorous review of different research papers that in a smart-grid due to the RESs nature
and unpredictable daily as well as seasonal load variations an imbalance between supply
and demand has been created, which results in deviations in the frequency. After the
review of proposed paper, researchers can able to understand issues related to energy
storage at distribution end in the context of LFC.
2.1 Introduction
Today, the grid is a smart-grid. In a large grid, many types of power plants are connected
to supply power to the load. It becomes essential to maintain fluctuations in the frequency
as well as tie-line flow against load disturbance when more than one power systems are
connected. The frequency of network deviates, because of the unexpected load change.
The nature of RESs is uneven, which causes frequency and power deviations too. Much
research work has been carried on LFC issue of conventional power system as well as a
deregulated power system. Study based on LFC problem with different soft computing
techniques such as GA, NN, FG, PSO, BFP, TSA has been carried out. Also, many
researchers have tried to solve LFC problem using AC-DC tie line, FACTS, considering
communication delay, different learning techniques and different types of DESS. Further
study on communication delay, RESs penetration and need for electrical storage with
different types of storages have also been carried out. Storage potential in BESS as

CHAPTER 2
21
centralized and decentralized distributed electrical vehicles has found tremendous
potential to regulated frequency. Presently, in the competition of the deregulated power
system, different companies sell unbundled power with lower rates. Also, a lot of
ancillary service is introduced like voltage and frequency regulation, load balancing, peak
power savings, etc. LFC as ancillary services is becoming most important today. Here,
the LFC techniques with various control strategies are outlined.
2.2 LFC in Single and Multi Area Power System
The different techniques in single area network are presented. The LFC issue of single
area network with delay margin by using Lyapounuv theory with the dependent criterion
and LMIs techniques is represented [144]. Based on the comparative analysis the results
for single area network by consideration of GRC without the controller, full state
controller and with optimal output feedback are represented [264]. Lili Dong has
presented LFC in single area thermal system. It has reheat, non-reheat and hydraulic unit
considered. The design was based on active disturbance rejection control [69]. Other
approach of AGC with output vector control feedback theory with the inclusion of AC /
DC-link is presented in [126]. The LFC problem in a single area having hydro unit with
the multi-pipe scheme is presented [242]. Decentralize LFC for multi-area power system
also discussed [197].
The different techniques in multi area LFC are presented by authors. Conventional
controller using PID controller based application is presented for LFC [5] and PI based
LFC in a decentralized mode is also proposed by M. Aldeen [175]. Different approach
using sliding Mode is use to regulate frequency for a multi-area network [151]. In multi-
area network impact of time delay [117] during LFC operation and real-time
implementation are also important. Similarly, an impact due to communication delay is
very important, which is presented with results in [232] for three area thermal system.
There are lot of smart technologies are used for LFC such as AI. In this context in the
three area power system, GA based PI controller performance is presented by Fatemeh
Daneshfar [86]. Similarly, in this multi area power system intelligent approach using GA
based RF learning algorithm applied for LFC. Here, area participation factor is used to
from the participation of GENCOs [82]. An author of [36] has discussed LFC issue in
two area IPS considering with GRC and DB and the solution is proposed using the hybrid
evolutionary fuzzy PI controller. This fuzzy logic operated by GA is applied and analyzed

Review of Literature
22
for multi-area LFC problem with better performance [308]. The GA superiority is
presented by comparative study between GA and LMI technique [71].
Application of various distributed energy storage also presented for LFC. The redox flow
battery storage application for LFC operation with results is presented in [129]. Another
storage application in Multi-area is presented by three different controllers such as fuzzy-
based SMES, PI base SMES and without SMES for LFC [25]. By in synchronizing SMES
with SSPS, regulation of the frequency is possible [134]. In [33] Tripathi had represented
adaptive AGC control with SMES. The application of SMES as an adaptive controller
during LFC operation can reduce the deviations in the frequency [239]. The BESS helps
to suppress the deviations in the frequency [57].
AGC with generalized approach for multi-area system [204] and in a discreet mode with
ACE [184] is discussed. By this discreet controller the possibilities in LFC are presented
in [6]. Similarly, an application of variable structural controller for AGC operation can
be used [309], which is presented for hydro-thermal unit. In another way, two area IPS
in a decentralized control mode [4] with structural singular value is also presented [277].
The design during the operation of decentralized LFC in a multi-area IPS is presented in
[273]. In [100] decentralize LFC with Governor and Voltage controls were proposed. In
[150] Two area IPS with decentralized approach for frequency control is presented. In
two area LFC problem is solved in [223] with excitation control method and voltage
perturbation method. In two-area IPS, the LFC based on tie-line control with the
nonlinearity is addressed in [32], in this context the GRC [274] and GDB [246] are also
considered to optimize the LFC parameter. With this non linearity and by considering the
stochastic nature of the load, AGC operation for LFC in two area system is addressed by
Dorais wami [227]. Manual operation of AGC is also reported, where regulation error is
reduced by tuning the controller parameter with human experience [22]. But in the
manual operation requires large experience. The conventional AGC operation in a
thermal power plant having reheat unit is reported by Nanda [222] with stability and
optimal setting point of view. Moreover, the frequency instability [209] study is also
presented. The step response of the governor in hydro unit during AGC operation is
discussed [279].
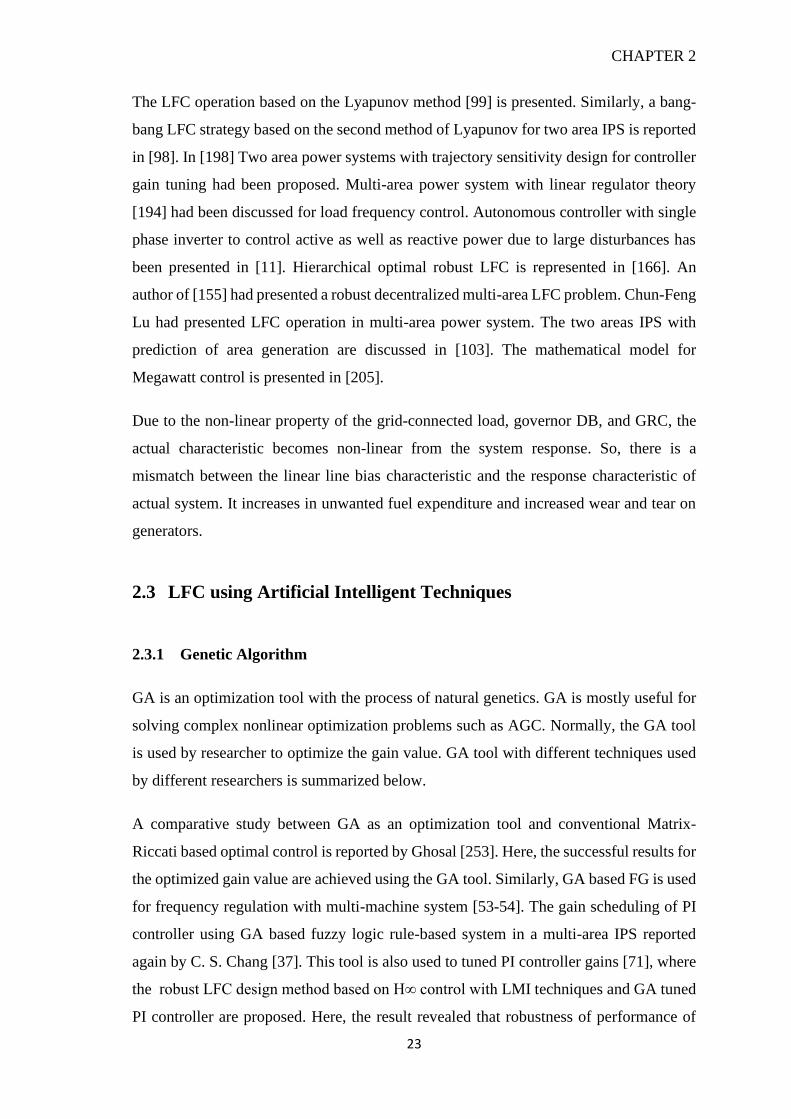
CHAPTER 2
23
The LFC operation based on the Lyapunov method [99] is presented. Similarly, a bang-
bang LFC strategy based on the second method of Lyapunov for two area IPS is reported
in [98]. In [198] Two area power systems with trajectory sensitivity design for controller
gain tuning had been proposed. Multi-area power system with linear regulator theory
[194] had been discussed for load frequency control. Autonomous controller with single
phase inverter to control active as well as reactive power due to large disturbances has
been presented in [11]. Hierarchical optimal robust LFC is represented in [166]. An
author of [155] had presented a robust decentralized multi-area LFC problem. Chun-Feng
Lu had presented LFC operation in multi-area power system. The two areas IPS with
prediction of area generation are discussed in [103]. The mathematical model for
Megawatt control is presented in [205].
Due to the non-linear property of the grid-connected load, governor DB, and GRC, the
actual characteristic becomes non-linear from the system response. So, there is a
mismatch between the linear line bias characteristic and the response characteristic of
actual system. It increases in unwanted fuel expenditure and increased wear and tear on
generators.
2.3 LFC using Artificial Intelligent Techniques
2.3.1 Genetic Algorithm
GA is an optimization tool with the process of natural genetics. GA is mostly useful for
solving complex nonlinear optimization problems such as AGC. Normally, the GA tool
is used by researcher to optimize the gain value. GA tool with different techniques used
by different researchers is summarized below.
A comparative study between GA as an optimization tool and conventional Matrix-
Riccati based optimal control is reported by Ghosal [253]. Here, the successful results for
the optimized gain value are achieved using the GA tool. Similarly, GA based FG is used
for frequency regulation with multi-machine system [53-54]. The gain scheduling of PI
controller using GA based fuzzy logic rule-based system in a multi-area IPS reported
again by C. S. Chang [37]. This tool is also used to tuned PI controller gains [71], where
the robust LFC design method based on H∞ control with LMI techniques and GA tuned
PI controller are proposed. Here, the result revealed that robustness of performance of

Review of Literature
24
GALMI is almost the same as that of the robust H∞ controllers. In another paper [207]
GA based PI controller is applied for the EVs battery incorporation with the grid-
connected RES. A comparative study based on a hybrid FGPI controller and hybrid GA-
PSO optimization techniques is presented in [42]. Some researchers had work in hydro
unit also. Aditya has discussed the design of GA for two area hydropower system model
[14]. In the hydro-thermal unit, a continuous-discrete mode for AGC framework is
presented and also in the hydro unit digital computer, the GA application is identified
[55]. Least square algorithm using GA for achieving real-time parameters for the optimal
value of gain for LFC is reported in [164]. Author of [171] had presented the control
parameter optimization using the GA technique for robust decentralized frequency
stability.
2.3.2 Neural Network
NN works on prediction based theory and corrects nonlinear relationship between input
and output.
The NN is investigated as an intelligent controller in conjunction with standard adaptive
LFC [88]. Automatic LFC using NN is developed to control the steam and water flow
[7], where the flow controller regulates the speed of the generator, which helps to regulate
frequency and generator output power. During the flow controller operation
nonlinearities affect in the AGC performance. The impact of nonlinearities such as DB
and reheat in a two area system reported in [63]. The robust decentralized design for LFC
is presented in [107]. This training based controller for better performance of the adaptive
controller then the NN based adaptive scheme is presented in [278].
2.3.3 Fuzzy Logic
Fuzzy logic can solve LFC problem based on knowledge and experience. Many
researchers have presented the superiority of FG controller. The superiority of FG than
the classical integral controller is presented [142]. With the nonlinearity such as DB and
DRC, LFC problem is simulated in four area networks [38] and better results are obtained
using FGPI controller. Similarly, the fuzzy rule-based PI controller gain scheduling is
presented by Denna et al [43]. In AGC operation of two area thermal unit [80], the fuzzy
controller application to regulate frequency is reported in [81]. For AGC with three area

CHAPTER 2
25
power system, the PSO tuned FG controller used, which is based on GA [243]. Chia and
Chun, has given an idea of gain tuning using GA based FG controller for a two-area
having thermal unit [54]. Here, the non-linearities as governor DB and GRC were
considered for better performance of FG. The different study with robust decentralized
control scheme based on C-Means clustering discussed [269] with the nonlinearity as
GRC was considered.
2.4 LFC using other Soft Computing Techniques
2.4.1 Particle Swarm Optimization (PSO)
PSO can be used on the concept of swarm intelligence. Highlights on PSO techniques
used by different researchers for better LFC operation are given below.
Aqeel S. Jaber has presented the PSO technique for LFC issue solution by tuning the
fuzzy logic input and output parameter [23]. For a hydropower plant, PSO and FG with
sliding mode control are presented in [229]. PSO technique is used by considering
parallel connected AC and HVDC tie line [254]. Author of [219] has presented hybrid
PSO for the tuning of PID controller gain value in the deregulated four-area system.
Based on the adaptive neuro-fuzzy inference system and PSO control scheme, LFC
dynamic response is simulated [251]. For two area IPS, the LFC using adaptive weighted
PSO and multi-objective PID controller is solved in [9].
2.4.2 Bacterial Foraging Algorithm (BFOA)
The BFOA theory is motivated by nature and operated in mainly four steps such as
swarming, duplication, removal and distribution [74]. Bacterial foraging is another
modern meta-heuristic method used to get solution of the complex problem. In context
to LFC, a comparative study of various integer order (IO) controllers are performed [257].
This integral controller and FOPID controller are compared for AGC operation. Here, the
thermal reheat unit and GRC are taken in multi-area for AGC performance. In [141]
Optimization for the governor speed regulation parameter (Ri) and frequency bias factor
(Bi) is evaluated. Moreover, the superiority of BFO against GA and classical optimization
techniques by gain tuning for the integral controller is presented. A similar approach of
using BFO algorithm to tune controller gain was also presented by many authors with the

Review of Literature
26
advantage of the proposed controller against conventional area controller and GA
optimized controller.
2.4.3 Tasu Search Algorithm (TSA)
The TSA initializes with some primary possible solution and tries to get a good result
based on hill-climbing algorithm. TSA uses past step to create a better solution. Saravuth
Pothiya has shown an innovative optimization method of an FGPI controller with the
multiple TSA [259]. The progress in learning of fuzzy rule-based system with the help of
heuristic symbolic is observed.
2.4.4 Other Optimization Control Techniques
The techniques such as Differential Evolution, mixed H2 / H∞ and LMI are reported by
various researchers listed below. By considering active power flow in [165] an FG rule-
based system was created for the selection of the finest controllers, its size of steps and
movements. In [177] M. Farahani S presented the method of optimized PID gains by the
LCOA to solve the LFC problem. LFC problem solutions with DE algorithm, which
optimize the PID gain [231]. It is noted that the controllers discussed are robust. The
parameters of the system and its operating range should wide from its nominal values.
Umesh Kumar Rout, have reported the PI controller performance analysis for AGC. The
operating of the PI controller is based on DE algorithm [288]. Similarly, Banaja Mohanty
controller parameters tuning of the DE algorithm highlighted and the comparative
analysis between DE, I, PI and PID with result is presented [31]. In thermal unit of single
area, for LFC a robust controller made by the Riccati-equation is used [101]. This Robust
controller using an m-synthesis approach, LFC in a deregulated IPS with thermal unit is
proposed [116]. A design of decentralized H∞ method for damping control of frequency
is discussed [30], which is in the LMI framework with the mixed-sensitivity formulation.
In deregulation with three areas, the LFC solution is suggested [119], where the mixed
H2 / H∞ robust control method is proposed. The design of the PI controller with H∞
static output feedback control theory is described for the LFC problem. The solution is
presented with the iterative LMI technique [294]. Robust controller design for LFC is
also reported [118][123].

CHAPTER 2
27
2.5 LFC with AC-DC Parallel Tie line
Researchers have highlighted an application of parallel AC-DC link for LFC [314]. In
which the HVDC link by using the centre of inertia (COI) signals is introduced, which
can keep a system frequency stable. In a deregulated multi-area system, parallel AC-
HVDC link considered to analyze the network dynamic behaviors. The performance of
LFC with parallel HVDC was found better than without HVDC. In [173] authors have
presented a wind turbine generator model delivered power via HVDC link controlled
through line commutated converter. Effectiveness of the inclusion of HVDC link for LFC
solution presented in [149][89]. The two and three area system with various subsystems
connected by asynchronous tie-lines is also reported [199].
2.6 LFC with Flexible AC Transmission System (FACTS)
The FACTS controllers help to enhance the transmission line capacity. The FACTS
controllers also help to regulate frequency. Some reported literatures are listed as follows.
A comparative analysis of SMES-SMES, TCPS-SMES and SSSC – SMES in AGC in a
IPS consists of hydro-hydro unit to regulate frequency is reported by P.Bhatt[220]. The
SSSC can regulate LFC in deregulated IPS [64]. Moreover P. Bhatt has investigated the
LFC for multi-unit hydropower system and thermal-hydro mixed unit [218]. Coordinated
control between TCPS and SMES has kept. Using craziness based PSO the integral
controller gains as well as parameters of TCPS/SMES being optimized. For the
restructured power system with three area [106], the LFC problem solution is provided
by the use of TCPS. The AGC regulator is operated by SVC, which is reported in [2].
Also, the TCPS is proposed for the tie-line flow regulation. In [128] presents the design
based GA for the decentralized controller with and without redox flow batteries together
with TCPS.
2.7 LFC Based on Other theory
2.7.1 Different Feedback Theory
For the solution of LFC for hydro, thermal and gas turbine units by controlling the
governor speed with PI state feedback controller [160], which regulates the parameter

Review of Literature
28
(R) and participation factor in AGC. Shoorangiz Shams have presented Quantitative
feedback theory (QFT) method for LFC [260]. Here, the comparative study of the QFT
based proposed controllers and the conventional controller is given to prove the
superiority of QFT. Rakshani et al. had designed a linear quadratic regulator for
frequency regulation [73]. The proposed regulator results with, full state feedback and
state observer methods are carried out. In a deregulated environment a robust
decentralized LFC is reported [180], where the solved is provided using H2/H∞ control
technique.
2.7.2 Hierarchical Load Frequency Control
The two level of hierarchical control discussed in [180]. Here, the first level of control
for each area was obtained after incorporating local information along with the others
coming from the other areas. In the second control level, a global solution based on
coordination strategy and a robust controller was obtained. The structure for AGC is
presented [131] with the effect of the nonlinear filter on frequency deviation harmonics
in Spanish. One more hierarchical AGC operation was presented by Marinovici et al.
[141], where for primary frequency control, the robust controller in a decentralized
manner was proposed to eliminate the frequency fluctuations as well as tie-line
fluctuations against disturbances in a IPS. A special type of study of the data integrity
attack on AGC performance with the market of electricity operation was reported [263].
In which the capability to maintain frequency by control algorithm by detecting the attack
and mitigation is presented. It helps to remove attacks due to low false ramp. For the
regulation of tie-line power and frequency [97] pluralistic LFC method presented with
two control area such as real control area (RCA) and a virtual control area (VCA). By
considering AGC operation in three area power system both schemes of pluralistic and
hierarchical control were presented [28] by the simulated study.
2.7.3 LFC Using Internal Model Control
To reduce the problem complexity in AGC, this method is used. The power system grid
is a complex network, so the internal model control (IMC) scheme is applied in LFC to
regulate frequency fluctuations. Internal model control (IMC) was successfully applied
for AGC. Application of IMC based on two degrees of liberty concept in LFC problem
is presented [295] and in [255] second-order plus dead time (SOPDT) is used instead of

CHAPTER 2
29
the full order system. Another scheme of Model Predictive Controller (MPC) for AGC
operation is reported [26], which followed by a NN model predictive controller is
reported [15].
2.7.4 LFC Using Observer
In an LFC, a lot of component of the power system is monitored which are connected
directly or indirectly. Hence, the observer plays a vital role in LFC and observes minute
to minute deviations condition of every components to remain within the limit. The
advantages of observer concept were successfully used to solve load frequency control
problems [77]. Observer also helps in monitoring, in this context the problem of
measuring and monitoring all the state variables at all time, a reduced observer controller
is designed [77]. Multi-area LFC issue in a large IPS was solved by of reduced-order
observer [121]. Also, dynamic responses were enhanced in the deregulated system. LFC
in two area system using a PI feedback controller based on quasi – decentralized
functional observers (QDFOs) theory. Proposed QDFOs theory reduces the complexity
of the system [312], where LFC solution is presented using decentralized sliding mode
control in IPS.
2.8 LFC Based on by Consideration of Communication Delay
Open access strategy in restructured power system makes the LFC problem more
complex. To overcome this open communication infrastructure is required. The time
delay is not fixed in an open communication network as compared to a traditional closed
communication network. Hence, more accuracy can be achieved in the AGC operation
by considering the communication delay. AGC with communication delays is also
presented in [304][200]. In [30] ILMI algorithm followed by H2/H∞ control method with
communication delay is used for the LFC problem. The Lyaponuv – theory combined
with LMIs method for LFC is discussed in [163] with delay and results of the dynamic
analysis of the LFC and delay boundary was achieved. A robust method to achieve a PID
based LFC scheme with communication delays is reported in [56].
2.9 LFC based on Different Learning Techniques

Review of Literature
30
For machine learning, dynamic programming is used in the RF environment. With a
multi-agent RF approach [275], PI controllers gain is tuned for LFC in multi-area IPS
[82]. During AGC operation to solve the issues to dispatch generation command
hierarchical reinforcement learning technique can be used [282]. Presently, for
restructured power system operating under the bilateral contract, complete classifier
method by continuous-valued inputs for LFC is reported [87] to regulate frequency
deviations.
2.10 LFC with Distributed Energy Generation
Renewable Energy Sources (RES) are predominantly used as distributed energy sources
in a micro-grid and smart grid. On the other hand, a smart grid employs analog as well as
digital communication technologies. LFC problem has been discussed by various authors
as follows.
2.10.1 LFC in Micro Grid
A micro-grid is a group of generation from RES, energy storage, and loads. The detailed
study on LFC in micro-grid [70] and the for the smart-grid [124] are reported. From the
study the types of LFC in the micro grid are as follows: 1. LFC using analysis of small
signal and 2. LFC scheme based on tuning techniques of parameters.
The micro grid with WTG, PVs, DG, FC, and aqua-electrolyzer and energy storage
systems are developed for AGC in [160-161]. In smart grid, applications of the different
controllers such as conventional as well as smart controllers are reported by many
researchers. The Ziegler-Nichols for the fine-tuning of gain is used [91], where small
signal analysis using battery and flywheel is described based on parameter tuning. An
application of AI for LFC in micro-grid [90] is discussed. The FGPID as a AI controller
is superior then non-FGPID controller [91]. Another control strategy of an optimal
FGPID controller followed by the BCO technique for governor operation of diesel
generator and blade pitch angle control of wind turbine is presented [271]. For LFC
problems using smart techniques such as AI, FO, PSO and GA are also reported
simultaneously. A fuzzy neural control method of AI is used for the indication of the
SOC status during forecasting of load and generation data [70]. Here, in the micro grid
with the wind, solar, storage and load are considered. The operation of the combined

CHAPTER 2
31
sources in micro-grid creates the instability in voltage as well as frequency. For that in a
micro grid, a GDC scheme proposed [114] to overcome the problem. LFC solution for a
micro grid with a PV system is presented by MOO. In this, a load deviation index was
calculated using estimated load power. A low pass filter of second-order used to produce
base power from PV unit.
2.10.2 LFC in Smart Grid
In a smart grid, LFC is classified in two ways, LFC with the incorporation of (DR) and
LFC with a V2G control. LFC with the incorporation of DR and V2G is presented.
2.10.3 LFC with DR
The DR control strategy consists of four main participants such as the balancing
authority, a DR aggregator and the distribution utility with customers. The DR control
strategy which is mentioned to as CDLC. It includes three operating modes such as
normal operation, frequency deviation range followed by AHC control, frequency and
returned to its normal value followed by step by step load manipulation strategy.
The power balance during AGC operation by DDC is reported by Devika Jay [66], where
the PI controller parameters were optimized using Lyapunov technique. Another DP
response application [169] with the coordination of different spinning reserve constraints
is reported. This real-time DR is proposed [159] to increase the RES penetration level for
LFC. In a smart grid, a comprehensive central DR algorithm was developed for LFC
[238]. For the frequency, sensitive load frequency deviations are investigated using the
DR scheme under smart grid environment [111]. In another study, followed by DR all
the distributed energy sources participated uniformly.
2.10.4 LFC with a Vehicle to Grid (V2G) Control
Many researchers have reported V2G and G2V technology for LFC. The V2G control
has three state conditions such as vehicles charging, idle and discharging conditions.
Secondary frequency control using PHEVs presented. Here, the duty cycle coordinated
scheme is described with the controllable thermal load in the household [193]. In this
scheme, a decentralized combined unit of heat-power generation considered with the

Review of Literature
32
MPC strategy. The BESS is used to solve the LFC problem due to RESs integration [280].
With the integration of Megawatt (MW) class distributed PV systems, a numerical
solution is presented [187] with the study of EVs An author of [145] has proposed the
multiple model predictive control (MMPC) method applied for PHEV for charging/
discharging battery and SOC control, which helps to stabilize the frequency. EV requires
the charging controller, for that the smart charging control scheme is reported [310] for
distributed EVs for Load frequency control. For commercial purpose, a fleet of EV in
coordination with an aggregator is proposed commercially to generate revenues [189]. In
a micro-grid including EVs and DG, their coordination based on MGPC technique for
LFC is suggested [147]. The LFC with grid-connected 50,000 PEVs for V2G operation
with a smart charging algorithm in real-time is considered and economic analysis is
studied [281]. The study to manage energy between wind and PEV has been carried out
[262] because of the dynamically quick action of an EV battery. It shows the capability
to balance supply and demand. Moreover, V2G coordinated control method studied for
the smart grid having WT [265]. For the EV charger AI applications are also reported by
researchers. In this context the fuzzy logic
based charging / discharging control approach for the LFC due to the presence of PV
and DG in the smart grid [65]. Dual benefits such as energy harvesting during peak period
and greenhouse gas reduction using EVs in the benefit of the environment are discussed
[58].
2.10.5 LFC with Hybrid System
Minute- Minute Wind Variation
Wind speed creates more disturbances in LFC problem. So, it is required to maintain
frequency control against minute to minute variations in wind speed.
The dynamic performance with wind penetration to regulate frequency has been carried
out [50][109], where different wind events such as die put, wind rise, wind lulls, wind
gusts and sudden loss of wind farm are observed minute to minute. Similarly, dynamic
analysis of AGC based on the ERCOT model reported by Chavez et al [119], where a
stochastic model was analyzed to reduce frequency deviations.

CHAPTER 2
33
BESS
The BESS has great potential to regulate frequency. Different types of battery
applications are reported in LFC. The RF battery is used [283] for the quick response
characteristic, where the RF battery capacity should be ten times more than fossil fuel
operated plant. D. Kottick has presented a single area LFC with 30 MW batteries for LFC
in the Israeli isolated network [60]. Various work for LFC in two area network using GA
based controller parameter tuning [241] is reported, where the BESS helps to nullify the
frequency as well as tie-line fluctuations [252]. Observer method is also reported. Using
a disturbance observer method with the estimation of the load by generalized predictive
control method [16] better performance can achieved. BESS was considered in parallel
with the wind farm. The frequency domain analysis is micro-grid [70] by considering
WTG, DEG, two FCs, PV and the EESs consist of a BESS and a flywheel is presented.
Here, an aqua- electrolyzer absorbs some part of generated energy from PV or WTG for
the generation of hydrogen during frequency control. The LFC based on MPC [179]
technique with real-time data measurement from an existing grid is proposed. Liang
Liang has proposed the LFC of two area network with wind power and large scale BESS
[172]. This BESS battery based on droop characteristic proposed [272], which can solve
issue in LFC during its parallel operation. From the operation and economic point of
view, this battery is presented as best option after two years of test operation in berline in
1987 [108]. The BESS also helps in the presence of the GRC and DB, in this context Lu
and Lui had presented LFC solution using BESS [57].
Flywheel
The Flywheel has tremendous potential to store the energy. An optimal sizing model for
the Flywheel ESS by considering the initial cost, maintenance and operation cost is
reported in [307]. Here, the control strategy is developed to regulate the SOC of FESS.
In a restructured IPS, FESS performance to regulate grid frequency incorporation with
wind turbine generator is studied [256] and reported. Here, the GA tuned PID controller
to control generator output power is used.
Super Capacitor
The super capacitor bank for the improvement of LFC problem is used with the FG
controller is highlighted in [186].

Review of Literature
34
SMES
Similar to other energy storage devices SMES has an extraordinary potential to store
energy and quick response. This stored can be used during the AGC operation to regulate
the frequency. The LFC issue in multi-area power system a comparative study with and
without SMES impact is reported [268] with time-domain analysis [236]. In two area IPS
for better frequency regulation, the SMES operated by fuzzy logic is presented [247].
Similarly, fuzzy gain scheduling for SMES is also performed well [53][185].
This SMES control strategy by using the IGBT converter technology is presented by
Tripathi and Juengst [245], which improves the results. In multi area IPS Other
sophisticated control with solid-state phase shifter for SMES is used [135] for
improvement in the LFC. In the presence of non-linearity such as GDB in thermal-
thermal reheat unit, the SMES performed better in LFC operation. An impact of
distributed small sized SMES unit application for LFC improvement is reported by S.
Banerjee [240], where an Adaptive AGC with storage as SMES is considered and the
comparative study of adaptive and non-adaptive has been presented against load
disturbances.
LFC without Storage
Various methods of without storage during LFC operation are reported which are
summarized as follows.
In the LFC problem for IPS containing thermal, WT and solar unit using standard data of
39-bus and 24-bus test system were analyzed [51]. Here, the fluctuations because of the
load, solar and wind power were considered. In other technique, to steady the frequency
fluctuations, a two-tier structure for a multi-machine system was proposed [102]. In one
more study of [191] power and frequency oscillations, a comparative study between
conventionally operated full-power converter wind plants and the newly proposed
frequency controlling wind plants have been studied. Newly proposed frequency
controller gave an optimistic result. Effect of WT farms on the dynamic behavior of the
grid is reported by Mats Wang-Hansen [192] that WT increases the fluctuations in the
frequency and it needs the storage to regulate the frequency. AGC in multi-area IPS was
tested on the 10 machines New England system [113]. For testing, an agent-based
intelligent control scheme of Bayesian Networks (BNs) used. One more study based on

CHAPTER 2
35
wind energy integration with distributed agent-based control architecture using NERC
reliability management rules was presented [190]. From the above study it is realize that
power from RESs increases in the deviations of power and frequency, so there is a need
of storage in the smart grid. By using participation of wind farm, LFC solution is
proposed set-point controlling scheme [168], but due to the uneven property of wind
velocity frequency deviates [96]. By taking the IEEE 14 bus system, AGC for fixed and
variable speed wind machine is presented using the Newton-Raphson algorithm [174]
and in [188] the DFIG with a conventional generator for LFC is presented. The power
delivering ability of DFIG of reduces the speed and release the stored mechanical energy
during frequency regulation is presented [228][140][201]. More discussion on LFC using
participation of DFIG is also presented with its impact on LFC [62][230][241]. To reduce
the deviation due to WT, the solution using pitch angle control method [211][235] and
with HVDC [84] are reported. Solar integration is also increases, so the LFC problem
due to integration of PV power feeding into the grid is reported [122]. Fuel cell
application is also reported [20] with an impact on LFC with the presence of BESS and
SMES units. In a smart-grid to coordinate the different sources the coordinator is
required. In this context the FG for WT [115] and in an isolated power system including
solar and diesel power plant [170] for better gain is reported. In [225] authors have
proposed to do changes in UC, economic dispatch, regulation of LFC when wind
generation capacity level is important. Another approach with frequency linked price in
a two-area network including DFIG based wind turbine LFC problem is discussed
[8][311].
Other Distributed Generation
In [270] LFC problem is presented for a small hydropower plant by controlling dump
load, where the rating of the load is approximately same to the rated output of the
generator. In [161] author has point out an impact of solid oxide fuel cells in the
distributed generation. In [83] Katiraei et al. have focused on real-reactive power
management strategies in a micro-grid consists of electronically interfaced DG units. An
author of [210] has proposed the small-signal analysis in independent hybrid DG system.
For the AGC analysis unexpected load variation and uneven wind speed are considered
in addition to solar radiation. Also, the hybrid systems have different RESs such as WT,
PV, FC and DG and need storage. For the storage purpose, the EES such as battery and
flywheel units are considered. In [18] an author has addressed the conventional AGC
Review of Literature
36
structure with its drawbacks. To eliminate the drawbacks of old AGE, the new control
scheme for AGC with cyber architecture has been proposed. It contains DES in a smart
grid. In [127] the LFC for a wind-hydro unit as an independent micro-grid is presented.
The control technique of DC power feeding system in cooperation with power maker and
distributors is presented in [221]. The LFC problem solution by GA based PI control
strategy for an independent hybrid system is presented in [292].
2.11 LFC in Deregulated Power System
In this section, the LFC problem solution by different methods in the restructured network
discussed. The LFC in a multi-area network is addressed in [196][287] and solution using
ANN-based PI controller is discussed. In deregulation AGC one ancillary service. AGC
operation in deregulated IPS with various contracts such as POOLCO based, Bilateral
and Bilateral contract with contract violation is presented [219][233][289]. Jose Luis and
Martınez Ramos have proposed an AGC in a decentralized manner, which is running at
the Spanish system and compared to the actual Spanish power system [146]. O. P. Rahi
have presented different ASs in restructured power system such as frequency regulation,
energy balance, spinning reserve, supplemental services, dynamic scheduling, reactive
power management, voltage regulation, transmission losses minimization and black start
capability [202]. The load following service in a bilateral contract in a competitive mode
is presented [33][78][143] as ASs.
Different control strategy using smart controllers are reported by various authors, which
are listed below. The AGC operation is presented in the multi-area thermal unit [133] and
there is issue due to nonlinearity as a GRC [257] in LFC operation. Here, the comparative
study between different integer order controller (IC) and fraction order PID controller
was evaluated. AI is also applied for LFC. In this context an application of GA tuned
FGPID controller [21] for LFC issue in IPS is reported. Similarly, ANN based operation
of AGC design in multi-area IPS by considering GRC and DB [256] is presented. Here,
comparative study was evaluated between ANN and GA based controller. Another
controller performance for LFC, where gain tuning is based on reduced-order observer
method is discussed [154]. Ajay of [208] has presented AGC of thermal-hydro and
thermal-thermal system with GRC in a deregulated atmosphere with the comparative
performance of PI and PID controller. Application of with and without thyristor
controlled phase shifter using PSO [106] and thyristerised controller switched-capacitor

CHAPTER 2
37
[17] is reported. In this, a design of the PI controller linear matrix inequalities (LMI)
algorithm is used. Finally is compared with an H2/H1 control technique. Daniele Menniti
has presented LFC study based on flexible AC transmission line controller [64]. Young-
Hyun Moon has presented a two-level methodology for AGC operation [313], where the
upper-level AGC deals for frequency regulation and generation distribution to IPPs with
respect to the value of ACE and the lower level AGC deals with only optimal generation
allocation.
To reduce the frequency fluctuations in deregulated power system method based on u-
synthesis is discussed [116], where the inefficiency of classical AGC based on ACE is
presented and proposed the Ramp following controller for LFC. The Ziegler Nicholas
controller is proposed for an individual system to tune Kp and Ki of the PI controller. By
considering the LFC problem [258] a bilateral market transaction a fractional order (OF)
controller is placed for all the areas. The optimal parameters of OF controller are chosen
by flower pollination algorithm. T. Anil Kumar has presented dynamic performance of
LFC solution using parallel AC-DC [276]. An adaptive controller named as feedback
error learning (FEL) is projected for AGC operation by comparing the performance of
the controller’s dynamically [158]. S. Farook of [249] has presented AGC with PID
controller parameter optimization using an evolutionary real coded genetic algorithm
(RCGA) in deregulated multi-area hydro-thermal and hydro-gas power system. The
controllers presented here have degraded performance in deregulated environment, which
can be realize from comparative study for AGC operation [217].
In deregulated power system, storage technologies are also highlighted by many authors.
Kalyan Chatterjee has presented the effect of BESS for LFC in a deregulated electricity
market scenario by considering GRC and DB [157]. LFC using different types of storage
technologies is discussed in the following section.
2.12 Electrical Energy Storage System
The frequency and power fluctuations occur because of sudden changes in the load and
RES power. So, energy storage demand increases day by day. The different storages are
categorized by following the function, response times, and time duration of suitable
storage [306]. It can give fast and active response for power is categorized in the different
types. One type is the MES such as pumped hydro storage, compressed air and flywheel.

Review of Literature
38
Similarly, FC and hydrogen are TESS. The electrochemical storages are classified as Li-
on, lead-acid and redox flow and NaS batteries. The chemical energy storage is hydrogen,
the electrical energy as a capacitor, super capacitor and SMES. Tremendous potential in
physical storage worldwide had been discussed [46]. The solution of LFC problem using
electrical energy storage technologies is addressed [152][296] and an ideal solution for a
extended lifetime with fewer expenses, more energy and power density is presented. The
LFC problem with penetration of RES is also addressed [61] with the discussion on wear
and tear of a generator during AGC operation. The solution using a hybrid electrical
vehicle is proposed in the power system [214], where an author had proposed PHEVs /
PEVs technology with higher energy efficiency, fewer carbon emissions,
environmentally friendly and easily available. An impact of V2G technique on the
demand side with utility interconnection has been discussed by many researchers.
The different controllers and controller strategies are also used for the frequency
regulation during AGC operation. In this context an EV by proposed diversified (AC/DC)
transmission link is discussed [1]. An application of fractional order PID controller is
presented for the coordination between EV and conventional plant. EV has been
addressed to regulate LFC in a micro-grid. Gains of the PID controller is tuned by PSO
based ANN technique for the stable results of frequency deviations [19]. Grey Wolf
Optimization technique for quick operation of distributed generator as an EV is proposed,
which results in a reduction in the deviations with settlement time [24]. The author of
[266] has addressed the requirement of the controller for the LFC problem when
renewable energy is integrated into the grid. The Grey Wolf Optimization method is use
with the integration of RES. Reviews on traditional controller, combined and artificial
controllers addressed [67] and there is a need for storage technology. In [195] a smart
grid with the integration of EV and RES, LFC problem is addressed. The PI controller
design based on AI techniques such as FG, FOPID followed by fuzzy-Model Predictive
Control (MPC) is presented. In [156] author has pointed out the problem of time-varying
delay during the involvement of EV agent for LFC. Delay dependent stability criteria are
proposed based on the Lyapunov theory and LMIA.
2.13 Conclusion
An effort has been put for a critical literature survey on the LFC problem. A review of
LFC under conventional as well as restructured IPS with and without grid-connected style

CHAPTER 2
39
is carried out. The repeated AGC operation of the governor will increase wear and tear.
Also, the dynamic response of the governor is slow. Moreover, the conventional and
smart controllers have degraded performance against the disturbances. So, a lot of
research potential exists in energy storage technologies. We have made an attempt to tap
this potential in chapter 5, chapter 6 and chapter 7.
40
CHAPTER 3
Price Based AGC Operation
3.1 Introduction
In chapter 2 different LFC techniques of AGC are presented. In India, ABT was
implemented for frequency regulation. Before the ABT implementation in 2003, there
were uncertain frequency fluctuations. So, ABT was implemented for grid operation and
control as well frequency regulation. In AGC the secondary loop is closely linked with
UI price of ABT. It makes price based AGC operation in a real-time.
India is the fast-growing economies as compared to other countries in the world. To
provide enough electricity supply is one of the top priorities of the GoI. The power
generation capacity increased since last few years, but gradually the demand is growing
more as compared to supply, which has created a shortage of 10.6 to 12.1 per cent energy
over the years. The problems such as high transmission and distribution losses, issues in
the supply of fuel and poor economic condition of utilities created due to the shortage of
power supply. To enhance the electrical network capacity of the generation, transmission
and distribution, GoI has initiated many steps. The Electricity Act 2003 was introduced
to encouraging the competition and trading activities in the Indian Power Industries.
In this chapter, the Indian grid operation is presented. The ABT mechanism, with its
advantages and scheduling-dispatch process under ABT mechanism, is presented.
3.2 Grid Operation in India
Grid power operation and control is a critically important function of the nation to deliver
power for the end consumer. During the electrical grid operation control, the security,
reliability, economy and efficiency should be taken care of. In 1991, the first
interconnection between North Eastern and Eastern grids was established in India. Then
Western Grid was interconnected in March 2003 with the above grid. In 2006, the

CHAPTER 3
41
Northern grid was connected. The southern Grid was alone pending to be interconnected
with central Grid. After the installation of the 765 kV Raichur-Solapur transmission line,
the grid was synchronized on 31st December 2013 [206] [132].
Power System Operation Corporation Ltd (POSOCO) is given the responsibility for the
Indian grid. POSOCO will facilitate for the inter-state power transmission across India
through its NLDC and five Regional Load Dispatch Centers. There are total five regional
grids in India are there: Northern Regional (NR) Grid, Southern Regional (SR) Grid,
Eastern Regional (ER) Grid, Western Regional (WR) Grid, and North- East Regional
(NER) grid. The Indian structure of transmission network is represented in Fig. 3.1.
POSOCO is also an administrator of the wholesale electricity market of India and making
the balance between demand and generation every 15 minutes in line with the regulations
of the CERC.
The Indian transmission network is organized in a hierarchical manner, which is shown
in Fig. 3.2. At the state level, the grids (state grid) consist of a transmission line below
400 VK. All state grids consist of the State Generating Stations (SGSs), small IPPs and
CPPs in states are grid-connected. The state grids are connected with the regional grid.
The regional grid mainly comprises of transmission lines of 400 kV and above. Up to the
year 2002, each region operated as a separate AC system, with interregional links. There
was an exchange of power between different regions through HVDC links. Presently,
there is a single grid in India, and all regional grids are synchronously connected.
The Function of Indian IPS Entities are presented in Fig. 3.3. At the regional level, the
RLDCs are responsible for the grid operation. Similarly, in the SLDCs are responsible
for grid operation. The CERC had given a guideline for interstate power transfer and the
SERC has to give guideline to transfer Intra-state power. In the IEGC the various utility
roles and responsibility, the guideline to schedule and dispatch, the planning code,
responsibilities and need in real-time operation are defined. CERC issues this IEGC.
Similarly, state grid codes are issued by SERCs.

Price Based AGC Operation
42
National Grid
Northern Regional
(NR) Grid
Southern Regional
(SR) Grid
Western Regional
(WR) Grid
Eastern Regional
(ER) Grid
North-Eastern
Regional (NER) Grid
Delhi
Hariyana
Himachal Pradesh
Hammu Kashmir
Punjab
Rajashtan
Uttar Pradesh
Uttaranchal
Goa
Diu Daman
Gujarat
Madhya Pradesh
Chattisgarh
Andhra Pradesh
Karnataka
Kerala
Tamil Nadu
Rondichery
Maharastra
Dadra Nagar Haveli
Bihar
Jharkhand
West Bengal
Orissa
Sikkim
Assam
Arunachal Pradesh
Meghalaya
Tripura
Manipur
Nagaland
Mizoram
FIGURE 3.1 National Grid in India.
3.2.1 Scheduling and Dispatch under ABT mechanism
The various states in the various regions in the country have ISGSs. These ISGSs have
their bulk consumers and beneficiaries. In the region, ISGSs will declare its next day
expected output generating capacity to Regional Load Dispatch Centers (RLDC). RLDC
will convey the information of the output capacity of generating stations to the State Load
Dispatch Centers (SLDCs). The SLDCs look after the best ways to fulfill the load demand
of their customers throughout 24 hours. To meet the load demand, SLDC collects
generation data from its own generating stations and ISGSs. SLDCs also take care of the
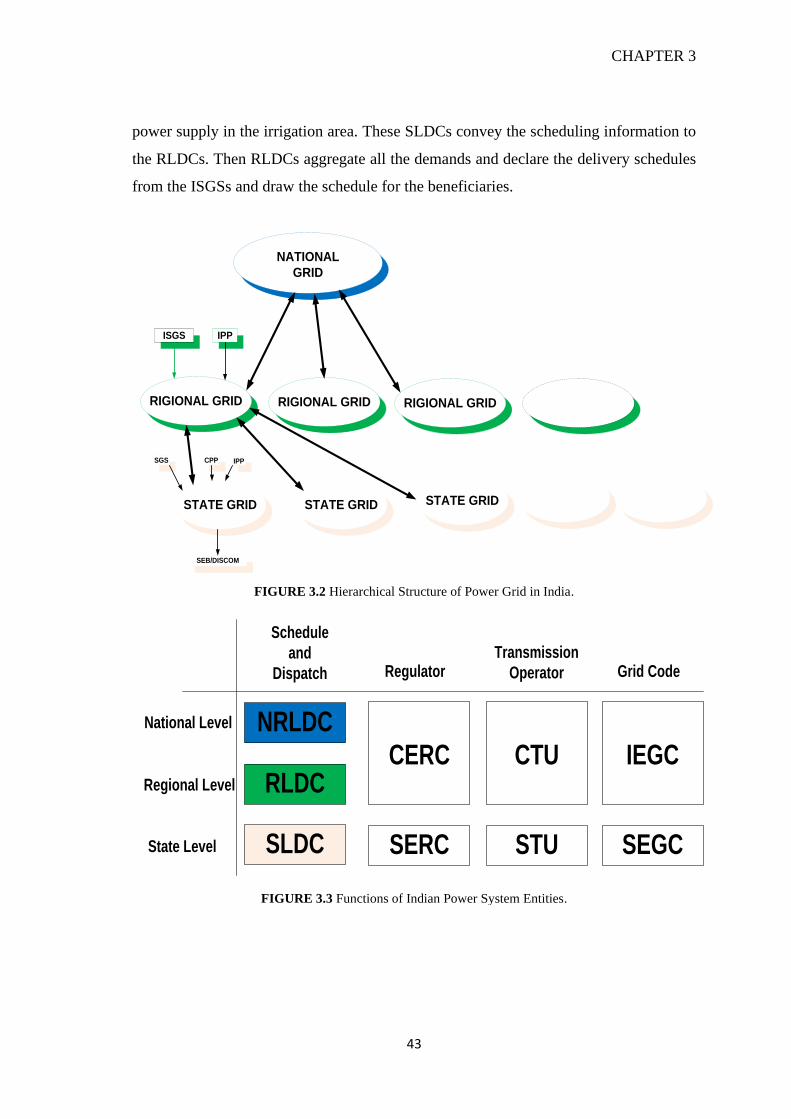
CHAPTER 3
43
power supply in the irrigation area. These SLDCs convey the scheduling information to
the RLDCs. Then RLDCs aggregate all the demands and declare the delivery schedules
from the ISGSs and draw the schedule for the beneficiaries.
NATIONAL
GRID
RIGIONAL GRID RIGIONAL GRID RIGIONAL GRID
STATE GRID STATE GRID STATE GRID
SEB/DISCOM
ISGS IPP
IPPSGS CPP
FIGURE 3.2 Hierarchical Structure of Power Grid in India.
NRLDC
RLDC
SLDC
CERC
SERC
CTU
STU
IEGC
SEGC
Schedule
and
Dispatch RegulatorTransmission
Operator Grid Code
National Level
Regional Level
State Level
FIGURE 3.3 Functions of Indian Power System Entities.

Price Based AGC Operation
44
ISGSs can revise the output capability in case of contingencies; beneficiaries can revise
their requisition. The RLDCs will be rescheduled accordingly. In Fig. 3.4 the scheduling
and dispatch process is presented under the ABT mechanism.
The generation and load are regulated by following the schedule. The deviations are
allowed within limits, so that they do not affect the system security. These deviations are
determined over every 15-minute interval. For the recording purpose, ABT meter is used.
The UI price depends on frequency. The recorded energy consumption is matched with
the scheduled energy in this 15-minute duration. The difference in scheduled energy and
recorded energy is UI energy. By averaging the frequency of each 15-minute interval
through the day, the UI rates get finalized. This scheduled energy and actual energy are
metered for each ISGSs and each geographical State for every 15-minute time block.
FIGURE 3.4 Process of Schedule and Dispatch Under ABT Mechanism.
I
S
G
S
R
L
D
C
S
L
D
C
Declared
Availabilty
Injection
Schedule
Entitlments
DC Revision
Drawl Schedule
Requisitions and
Agreements
Final Injection
Schedule
Final Drawl
Schedule
D-1 Day
D Day
00:00 To
24:00
Hrs
10:00 hrs
15:00 hrs
18:00 hrs
22:00 hrs
08:00 hrs
Revisions During
Current Delay
Revision in
Requisition
Revisions During
Current Delay

CHAPTER 3
45
3.3 Reforms in Indian Power Systems
Under the Electricity Act 2003, freedom is given to increase the competition of power
trading [285]. Because of the weak economic condition of the SEBs, the GOI has started
to attract the private sector industry for energy generation by making changes in the IE
Act 2010 and EC ACT 1948. Simultaneously, steps for privatization of the generating,
transmitting and distributing companies of the SEBs were initiated. After the
implementation of the ERC act in 1998, the rules of the Central Electricity Regulatory
(CERC) were laid down.
3.4 Price based AGC Operation
The mathematical model for AGC operation including UI price and marginal cost is
represented in Figure 3.5. In real-time operation of the generator, the generating unit will
automatically respond to UI price signal(𝜌𝑖). As per the control mechanism, the UI price
signal (𝜌𝑖) is observed by each generator. Now, (𝜌𝑖) is compared with the marginal cost
of a generator(𝑃𝑔0𝑖). The difference of (𝜌𝑖) and(𝑃𝑔0𝑖), represented as Generation Control
Error (GCE).
Frequency
to Price
1
1
+sTgi 1
1
+sTti
Power Plant
Generation to
Marginal Cost
iR
1
-+
++
-+
++
UI Price
ifgiP
-+
LiP
1+sT
K
pi
pi
Step Load Change
refP
)( i
)( i
Marginal Cost
Fundamental Frequency )( 0f
Scheduled Generation
ControlleriGCE
)(0 igP
FIGURE 3.5 Control Scheme for price based AGC.
The GCE is a signal is generated from the GCE logic block. Now, the controller reacts
to run the generator following the error signal. If (𝜌𝑖) > (𝑃𝑔𝑜𝑖) then, the GCE signal is

Price Based AGC Operation
46
positive. It means generators can profit by increasing more generation. On the other hand,
if the GCE signal is negative, the generators can be profitable by decreasing the power
generation.
The mathematical block diagram of Fig. 3.5 is represented with the primary loop and
secondary control loops in Fig. 3.6. Here, the secondary control loop is represented by
ABT based loop. In Primary frequency control loop, which is under the FGMO,
generators respond against changes in the frequency. In the secondary frequency control
loop UI price signal is used.
Generator Power System
Fundamental
Frequency
UI Price
Schedule
Generation
Marginal Cost
Controller
Droop
-+
+
+
+
Changes in Local Load
Changes in tie line Power
f
LiP
0f
giP
giP0gP
Primary Frequency
ControltieP
Secondary
Frequency Control
GCE
1S
2S
+
3S
4S
5S
FIGURE 3.6 ABT based AGC loop.
This price-based AGC scheme is represented in Fig. 3.7, where the change in the
frequency is represented by the signal S1. The signal S2 is frequency to UI price signal
according to CERC (2016). Signal S3 represents the addition of the scheduled generation

CHAPTER 3
47
and the changes at the generator output. The calculated marginal cost is represented by
signal S4. Generation Control Error (GCE) is represented by signal S5, which is the
difference in the marginal cost and UI price signals.
04 )( S
YesNo
)()()( 425 SSGCES −=
Yes
No
02 )( S
Yes
No
025 )()( −= SGCES
No
0)(5 =GCES
Yes
)()( 42 SS
)()( 42 SS
Yes
Read ,
FIGURE 3.7 Flow Chart for GCE Calculation.
Here, the positive value of GEC represents generators earn by accelerating the generation
level and the negative value of GEC represents the generators that profit by reducing the
generation level. The mathematical modelling of Price based AGC represented in the
following section.

Price Based AGC Operation
48
3.5 Mathematical Modeling of Price Based AGC
The frequency deviates by 𝛥𝑓 Hz, during the step changes of the load MW occur in the
power system, the. The deviations in the frequency 𝛥𝑓 are added to the fundamental
frequency f0 to generate signal S1 (3.1). The signal S2 is calculated as per the UI charges
based on the frequency norms published by the respective year. Now, S2 is calculated as
per the following logic as shown in the flow chart (Fig. 3.6) to generate the GEC S5
Rs/MWh.
𝑆1 = 𝛥𝑓 + 𝑓0, (3.1)
Where 𝑓0is the fundamental frequency in Hz
If S1<=49.7 Hz ; S2=8032 Rs/MWH
elseif S1<=50 Hz ; S2=1780+20856*(50- S1) Rs/MWH
elseif S2<=50.05 Hz ; S2=35600*(50.05- S1) Rs/MWH
else S2=0 Rs/MWH.
S3 is the difference between the scheduled generation (𝑃𝑔0) MW and the changes in the
generator power (𝛥𝑃𝑔𝑖) MW as given by (3.2).
𝑆3 = 𝑃𝑔0 + 𝛥𝑃𝑔𝑖 (3.2)
Now, in the signal UI S2 is compared with the S4. (Incremental cost signal of the
generator) and the controller generates GEC signal S5. (3.3) gives the signal S4 for each
generator.
𝑆4 = 2 ∗ 𝑐𝑖 ∗ 𝑆3 + 𝑏𝑖 Rs/MWh (3.3)
Here, the positive value of GEC represents generators earn by accelerating the generation
level and the negative value of GEC represents the generators that profit by reducing the
generation level.
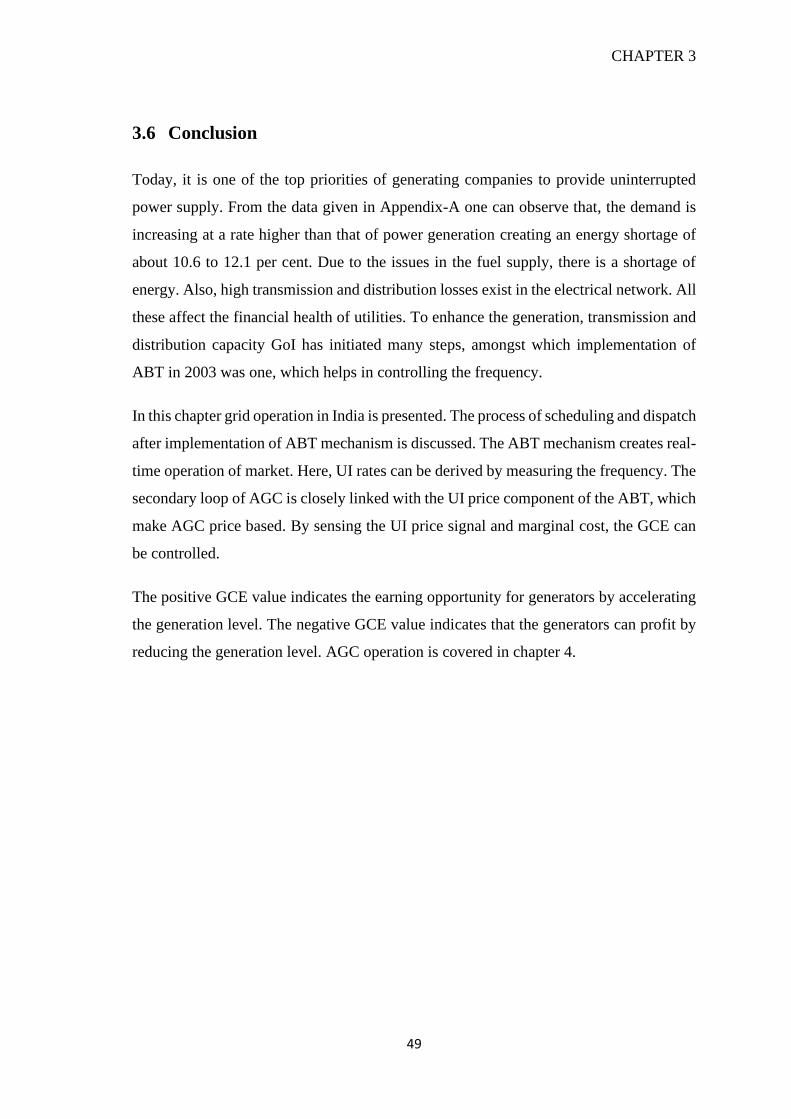
CHAPTER 3
49
3.6 Conclusion
Today, it is one of the top priorities of generating companies to provide uninterrupted
power supply. From the data given in Appendix-A one can observe that, the demand is
increasing at a rate higher than that of power generation creating an energy shortage of
about 10.6 to 12.1 per cent. Due to the issues in the fuel supply, there is a shortage of
energy. Also, high transmission and distribution losses exist in the electrical network. All
these affect the financial health of utilities. To enhance the generation, transmission and
distribution capacity GoI has initiated many steps, amongst which implementation of
ABT in 2003 was one, which helps in controlling the frequency.
In this chapter grid operation in India is presented. The process of scheduling and dispatch
after implementation of ABT mechanism is discussed. The ABT mechanism creates real-
time operation of market. Here, UI rates can be derived by measuring the frequency. The
secondary loop of AGC is closely linked with the UI price component of the ABT, which
make AGC price based. By sensing the UI price signal and marginal cost, the GCE can
be controlled.
The positive GCE value indicates the earning opportunity for generators by accelerating
the generation level. The negative GCE value indicates that the generators can profit by
reducing the generation level. AGC operation is covered in chapter 4.

50
CHAPTER 4
Automatic Generation Control in Restructured
Power System
4.1 Introduction
This chapter highlights the AGC operation. Due to the uncertain load fluctuations the
mismatch is created between the generation and demand. This results in the deviations of
tie-line flow as well as frequency. To nullify the tie-line flow, generators running under
the AGC loop respond. During this AGC operation the generator output, frequency and
tie-line flow deviates.
The previous chapter 3 deals with the ABT loop/secondary control loop of AGC. In this
chapter the study of conventional AGC under restructured market environment is
presented. Dynamic study of GENCO power deviations, frequency deviations and UI
price deviation by load fluctuation under Poolco based contract, Bilateral contracts and
contract violation is simulated. For the simulation DISCO participation has been
considered throughout the work. Also, power, frequency and UI price are observed during
peak-hours and off-peak hours.
4.2 About Restructured Power System
Worldwide electric power utilities had adopted the deregulated market scenario and the
restructuring process is undergoing [92].GENCOs, TRANSCOs and DISCOs, as well as
ISOs, are the individual body in the restructured IPS. Presently, the DISCOs have the
authorization to do an agreement with the same area GENCOs. It is known as "Poolco
Based Transaction". If they do an agreement with the outside area, then it is called as
"Bilateral Transaction". Both the contracts are supervised by ISO. For the reliability of
power supply, many ancillary services such as reactive power management, voltage

CHAPTER 4
51
control, loss minimization, scheduling-dispatch as well as energy balancing have been
provided by system operators. In such a situation either ISO or TSO has been entrusted
with the deal of procurement of these services. It has been observed that AGC / LFC is
widely accepted as an ancillary service in practice [40]. The various issue of LFC during
the operation and control of IPS after deregulation has been discussed [224]. The
operation of price based AGC in a newly restructured power system was inspired as a
future business environment for electric utility [284] and the case study with different
load following contracts have also been represented [18]. Here, a customer can contract
alone with a different utility.
Though, it is hard for the synchronous generator to track the demand completely because
electricity characteristics have a limitation on the instantaneous procedure between
generation and utilization due to slow dynamic response [65]. Also, because of frequent
power changes by RES like solar and wind power generation in an existing grid, it
becomes difficult to regulate frequency due to insufficient regulation reserve capacity
and rapid power imbalance [10]. Thermal and hydro units can be used to regulate
frequency. Due to limited regulation capacity, slow response according to the power
demand changes and frequent operation of generator decreases the life of the governor as
well as turbine [4]. Finally increases generation cost, labour cost and repairs cost due to
wear and tear [218]. Under these circumstances, a usual frequency control by the time-
consuming action of the governor will not capable to follow the rapid load variation,
which fallout into either voltage or frequency deviation or even tripping of generator [4].
4.3 System Under Examination
An isolated two area restructured IPS is considered for AGC operation, which is shown
in Fig.1.
4.3.1 Mathematical modelling of two area restructured power system
For simplicity and better understanding of contracts, the DPM is considered [289]. Table
I represents the DPM matrix of the power system with two area exposed in Fig. 4.1. The
pairs of GENCO1 (Thermal Power plant1) - DISCO1, GENCO2 (Hydro Power Plant2) -
DISCO2 in Area1 and GENCO3 (Thermal Power plant3) - DISCO3, GENCO4 (Thermal
Power plant4) - DISCO4 in Area2 is considered. In the table, the number of rows stands

Automatic Generation Control in Restructured Power System
52
for the GENCOs (G) number and the column stands for the DISCOs (D) number. This
matrix represents the agreement of DISCOs with GENCOs. It is known as “DPM”. The
equivalent DPM is given as follows.
TABLE 4.1 DPM Matrix
Area1 Area2
DISCO1 DISCO2 DISCO3 DISCO4
Area1 GENCO1 G1-D1 G1-D2 G1-D3 G1-D4
GENCO2 G2-D1 G2-D2 G2-D3 G2-D4
Area2 GENCO3 G3-D1 G3-D2 G3-D3 G3-D4
GENCO4 G4-D1 G4-D2 G4-D3 G4-D4
G=GENCO, D=DISCO
𝐷𝑃𝑀 = [
𝑐𝑝𝑓11 𝑐𝑝𝑓12 𝑐𝑝𝑓13 𝑐𝑝𝑓14𝑐𝑝𝑓21 𝑐𝑝𝑓22 𝑐𝑝𝑓23 𝑐𝑝𝑓24𝑐𝑝𝑓31 𝑐𝑝𝑓32 𝑐𝑝𝑓33 𝑐𝑝𝑓34𝑐𝑝𝑓41 𝑐𝑝𝑓42 𝑐𝑝𝑓43 𝑐𝑝𝑓44
] (1)
From the above matrix “Contract Participation Factor (cpf)”, brings the contract
information to track the power of GECNO and load from DISCO. The cpf can be
calculated from (2). The diagonal elements give information of agreement among the
GENCOs and DISCOs of the same area. The off-diagonal elements give information
about an agreement among the GENCOs of one area and DISCOs of outside area.
Assume the DISCO3 demands 150 MW powers, out of which 30 MW is demanded from
DISCO1, 45 MW from DISCO2, 60 MW from DISCO3 and 15 MW from DISCO4. The
variables of DPM of (1) are defined as by (2). The changes in the GENCO power can
calculate from (3). The following mathematical formulas are used for the analysis of the
two area restructured IPS [289].
∑𝑐𝑝𝑓𝑖𝑗 = 1
𝑖
(2)
𝑐𝑝𝑓13 =30
150=⥂ 0.2, 𝑐𝑝𝑓23 =
45
150= 0.3,
𝑐𝑝𝑓33 =60
150= 0.4, 𝑐𝑝𝑓43 =
15
150= 0.1.
The power contracted to supply by ith GENCO is given by,
𝛥𝑃𝑔𝑖 = ∑ 𝑐𝑝𝑓𝑖𝑗𝛥𝑃𝐿𝑗
𝐷𝐼𝑆𝐶𝑂4
𝑗=1
(3)
Where 𝛥𝑃𝐿𝑗represents DISCOj total load demand as presented in (4).
𝛥𝑃𝐿1,𝐿𝑂𝐶 = 𝛥𝑃1 + 𝛥𝑃2, ⥂⥂⥂ (4)

CHAPTER 4
53
𝛥𝑃𝐿2,𝐿𝑂𝐶 = 𝛥𝑃31 + 𝛥𝑃4
Due to the changes in the load, the tie line scheduled power is given by (5) and (6).
𝛥𝑃𝑡𝑖𝑒1−2,𝑠𝑐ℎ𝑒𝑑𝑢𝑙𝑒𝑑 = (𝑑𝑒𝑛𝑎𝑑𝑜𝑓𝐷𝐼𝑆𝐶𝑂𝑠𝑖𝑛𝑎𝑟𝑒𝑎𝐼𝐼𝑓𝑟𝑜𝑚𝐺𝐸𝑁𝐶𝑂𝑠𝑖𝑛𝑎𝑟𝑒𝑎1) − (𝑑𝑒𝑛𝑎𝑛𝑑𝑜𝑓𝐷𝐼𝑆𝐶𝑂𝑠𝑖𝑛𝑎𝑟𝑒𝑎𝐼𝑓𝑟𝑜𝑚𝐺𝐸𝑁𝐶𝑂𝑠𝑖𝑛𝑎𝑟𝑒𝑎𝐼𝐼)
(5)
𝛥𝑃𝑡𝑖𝑒,12,𝑠𝑐ℎ𝑒𝑑𝑢𝑙𝑒 =∑∑𝑐𝑝𝑓𝑖𝑗𝛥𝑃𝐿𝑗
4
𝑗=3
2
𝑖=1
−∑∑𝑐𝑝𝑓𝑖𝑗𝛥𝑃𝐿𝑗
2
𝑖=1
4
𝑗=3
(6)
The tie line actual power is given by (5).
𝛥𝑃𝑡𝑖𝑒1−2,𝑎𝑐𝑡𝑢𝑎𝑙 = (2𝜋𝑇12𝑠
) (𝛥𝐹1 − 𝛥𝐹2) (5)
𝛥𝑃𝑡𝑖𝑒1−2,𝑒𝑟𝑟𝑜𝑟 = 𝛥𝑃𝑡𝑖𝑒1−2,𝑎𝑐𝑡𝑢𝑎𝑙 − 𝛥𝑃𝑡𝑖𝑒1−2,𝑠𝑐ℎ𝑒𝑑𝑢𝑙𝑒𝑑 (6)
The error in the tie line by (6) helps to generate ACE in the respective area as in the
modern power system [289]. This ACE can be calculated by (7).
𝐴𝐶𝐸1 = 𝐵1𝛥𝑓1 + 𝛥𝑃𝑡𝑖𝑒1−2,𝑒𝑟𝑟𝑜𝑟 𝐴𝐶𝐸2 = 𝐵2𝛥𝑓2 + 𝑎12𝛥𝑃𝑡𝑖𝑒1−2,𝑒𝑟𝑟𝑜𝑟
(7)
𝑎12 = −𝑃𝑟1𝑃𝑟2
(8)
Where, 𝑃𝑟1 is area 1 rated capacity and 𝑃𝑟2is area2 rated capacity.
The DPM matrix helps GENCO for giving power to respective DISCO. The effect on
power system dynamics because of the sudden load fluctuation has been applied by the
input𝛥𝑃𝐿,𝐿𝑂𝐶. Now, the LFC signal generated from ACE due to unbalance between load
and supply. Dispatching of the LFC signal will through ACE participation matrix to the
GENCOs are considered i.e. 𝑎𝑝𝑓11, 𝑎𝑝𝑓12, 𝑎𝑝𝑓21 and 𝑎𝑝𝑓22 . The controller does a
significant function in the generation of an Error signal, which is distributed for GENCOs
according to apfs. The gain of the controller is tuned integral control law as given in (9).
𝑈𝑖 = −𝐾1𝑖∫𝐴𝐶𝐸𝑖𝑑𝑡 (9)

Automatic Generation Control in Restructured Power System
54
Local
Load1
DIS
CO
-1
DIS
CO
-2
apf1
apf2
+
cpf11
cpf12
cpf13
cpf14
cpf21
cpf22
cpf23
cpf24
-
-
+
-
AREA1
1
1
R2
1
R
3
1
R 4
1
R
-
+
1
1
1 +sTg 1
1
1 +sTt
1
1
3 +sTg
Thermal Power Plant1
Thermal Power Plant2
Local
Load1
apf3
apf4
+-
-
Thermal Power Plant 3
Thermal Power Plant4
1
1
4 +sTg
1
1
3 +sTt
1
1
4 +sTt
11
1
+sT
K
p
p
12
2
+sT
K
p
p+
-
s
T12
+
-
+
+
-
--
--
--
++
+
+
++
+
+
DIS
CO
-3
DIS
CO
-4
cpf31
cpf32
cpf33
cpf34
cpf41
cpf42
cpf43
cpf44
++
+
+
++
+
+
+-+
+
+
++
AREA2
+-+
Demand of
DISCO2 in Area1
to GENCOs in
Area2
Demand of
DISCO2 in Area1
to GENCOs in
Area2
Controller1
Controller2
1b
2b
12a
12a
ACE1
ACE2
1
1
2 +sTt1
1
2 +sTg
1F
2F
1F
2F
FIGURE 4.1 Block Diagram of Two Area Restructured Power System.
4.3.2 AGC Operation Under Market
The AGC operation under different market conditions has been carried out. The different
contracts taken into consideration are as follows.

CHAPTER 4
55
1. POOLCO based contract
2. Bilateral contract
3. Bilateral contract with a contract violation.
The two area system with Base MVA of 2000 MVA and the rated capacity of 2000 MW
is considered [289]. The system data of the isolated network are shown in Table C.1 of
Appendix C. For the three markets the AGC operation is given below.
4.3.2.1 Case1: Poolco Based Market
In this market, the load change of 10% (200 MW) in area1 is considered. Participation of
GECNOs is presented by apfs, where apf1 = apf2 = 0.5 and apf3 = apf4 = 0.5. In this, only
DISCO1 and DISCO2 demanding the load. DISCO3 and DISOC4 do not claim the
exchange of power from any generating company. The DPM for the Poolco based market
is presented in (18).
𝑫𝑷𝑴 = [
𝟎. 𝟓 𝟎. 𝟓 𝟎 𝟎𝟎. 𝟓 𝟎. 𝟓 𝟎 𝟎𝟎 𝟎 𝟎 𝟎𝟎 𝟎 𝟎 𝟎
] (18)
4.3.2.2 Case2: Bilateral Market
In bilateral market, contract exists among GENCOs and DISCOs of the same area as well
as different area. The DPM is given in (19). Here, it is considered that each DISCO is
demanding 10% power from GENCOs. The participation of each GENCO in AGC will
be followed by𝑎𝑝𝑓𝑠, which is given as apf1= 0.75, apf2 = 0.25, apf3 =0.5 and apf4=0.5.
The DPM for the bilateral market is given by (19).
𝐷𝑃𝑀 = [
0.5 0.25 0 0.30.2 0.25 0 00 0.25 1 0.70.3 0.25 0 0
] (19)
4.3.2.3 Case3: Bilateral Market with Contract Violation
The contract may violate by DISCO due to excess power demand. This excess power is
uncontracted with any GENCO. The GENCO have to supply for the uncontracted power
of the same area. For visualization of a contract violation, excess power of 10% (200

Automatic Generation Control in Restructured Power System
56
MW) demanded by DISCO in area2 is considered. It is replicated in the area as a local
load. It is not the contract demand, so there is no change in DPM elements.
4.3.3 Comparison between the Various Markets
The following Table 4.2 represents the different calculated values of the power for the
above three cases.
TABLE 4.2 Calculated Parameters for all Cases
Parameters Case1 Case2 Case3
GENCO1 power deviations of Area1 (MW) 100 105 180
GENCO2 power deviations of Area1 (MW) 100 45 70
GENCO3 power deviations of Area1
(MW),
0 195 195
GENCO4 power deviations of Area1
(MW),
0 55 55
Tie Line Power deviations (MW) 0 -50 -50
4.3.4 Simulation and Result Analysis
Due to the sudden load variation, the dynamic behavior with unexpected load changes
has been represented in Fig. 4.2 (a) to (g) for the different parameters. Fig. 4.2 (a) to (d)
represents the changes in all GENCO power. Similarly, Fig. 4.2 (e) and (f) represents the
changes in the frequency in Area1 and Area2. Due to the contract exist in both the areas,
the deviations in the tie line is presented in Fig. 4.2 (g).
FIGURE 4.2 (a) GENCO1 power deviations of Area1 (MW).)
0 5 10 15 20 25 30 35 40 45 500
50
100
150
200
250
300
Time(s)
GE
NC
O1(
MW
)
Case1
Case2
Case3

CHAPTER 4
57
(b)
(c)
(d)
FIGURE 4.2 (b) GENCO2 power deviations of Area1 (MW), (c) GENCO3 power deviations of Area1
(MW), (d) GENCO4 power deviations of Area2 (MW)
0 5 10 15 20 25 30 35 40 45 500
20
40
60
80
100
120
140
160
180
Time(s)
GEN
CO2(
MW
)
Case1
Case2
Case3
0 5 10 15 20 25 30 35 40 45 50-50
0
50
100
150
200
250
Time(s)
GEN
CO3(
MW
)
Case1
Case2
Case3
0 5 10 15 20 25 30 35 40 45 50-40
-20
0
20
40
60
80
100
120
140
Time(s)
GEN
CO4(
MW
)
Case1
Case2
Case3
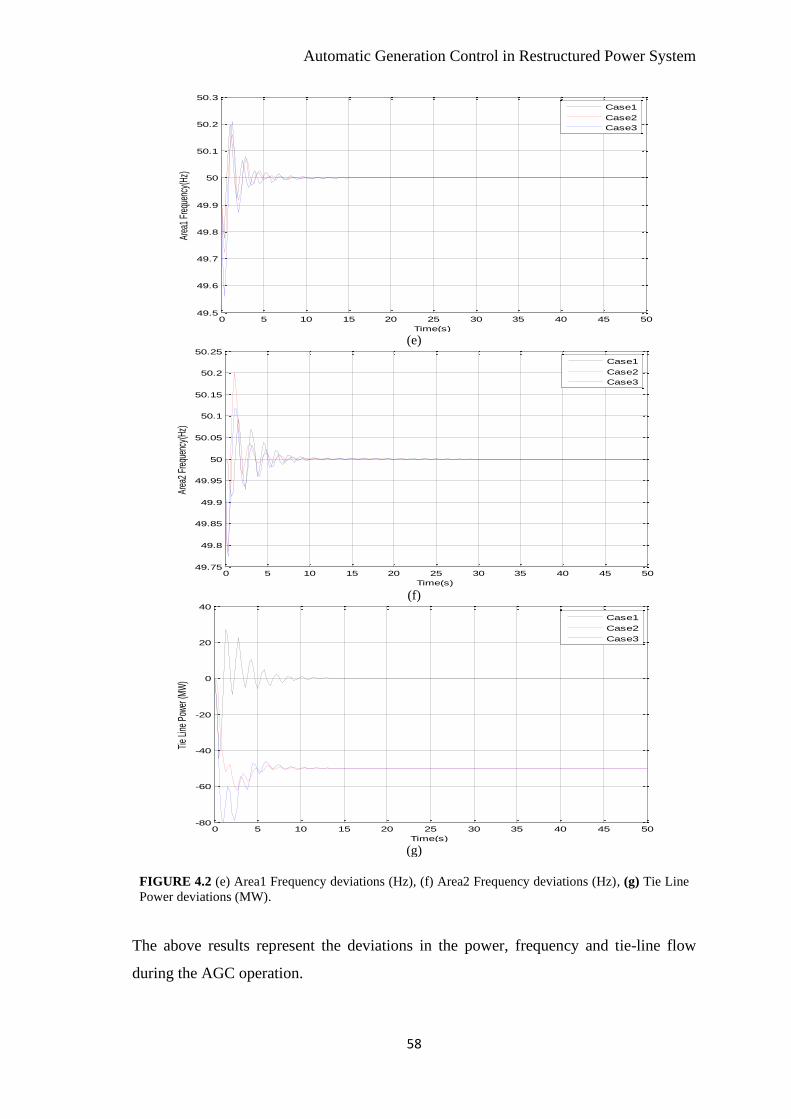
Automatic Generation Control in Restructured Power System
58
(e)
(f)
(g)
FIGURE 4.2 (e) Area1 Frequency deviations (Hz), (f) Area2 Frequency deviations (Hz), (g) Tie Line
Power deviations (MW).
The above results represent the deviations in the power, frequency and tie-line flow
during the AGC operation.
0 5 10 15 20 25 30 35 40 45 5049.5
49.6
49.7
49.8
49.9
50
50.1
50.2
50.3
Time(s)
Area
1 Fr
eque
ncy(
Hz)
Case1
Case2
Case3
0 5 10 15 20 25 30 35 40 45 5049.75
49.8
49.85
49.9
49.95
50
50.05
50.1
50.15
50.2
50.25
Time(s)
Area
2 Fr
eque
ncy(
Hz)
Case1
Case2
Case3
0 5 10 15 20 25 30 35 40 45 50-80
-60
-40
-20
0
20
40
Time(s)
Tie
Line
Pow
er (M
W)
Case1
Case2
Case3
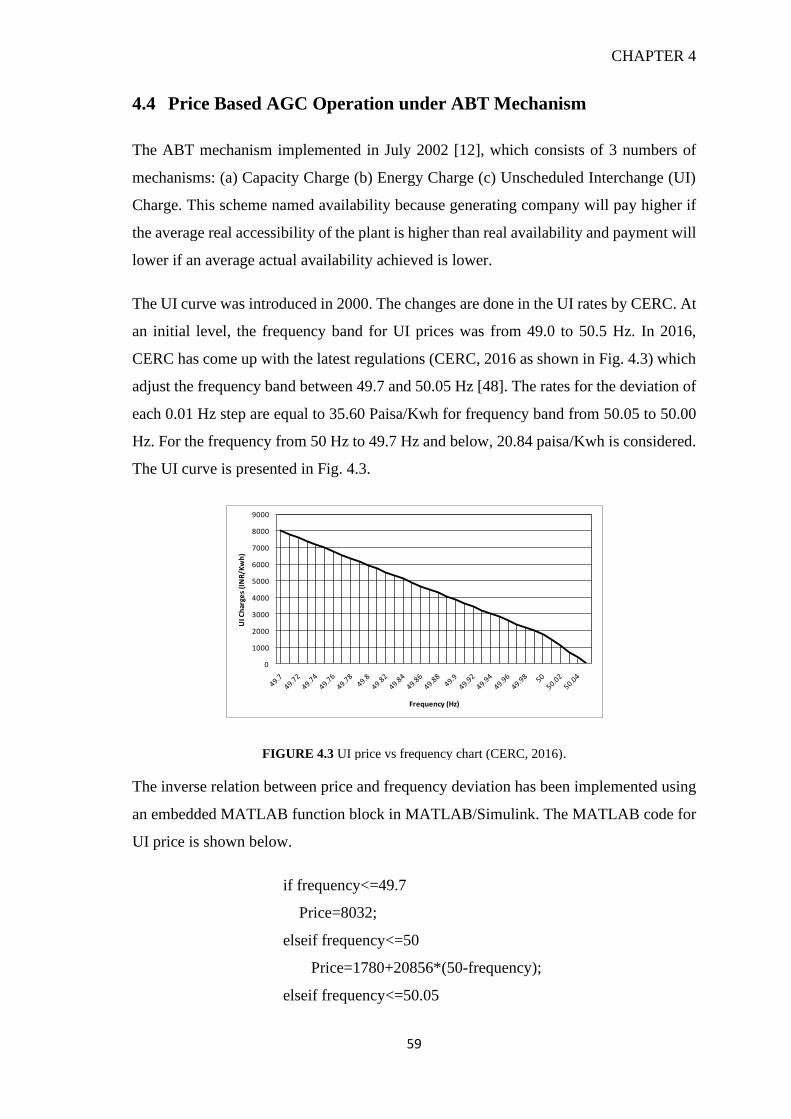
CHAPTER 4
59
4.4 Price Based AGC Operation under ABT Mechanism
The ABT mechanism implemented in July 2002 [12], which consists of 3 numbers of
mechanisms: (a) Capacity Charge (b) Energy Charge (c) Unscheduled Interchange (UI)
Charge. This scheme named availability because generating company will pay higher if
the average real accessibility of the plant is higher than real availability and payment will
lower if an average actual availability achieved is lower.
The UI curve was introduced in 2000. The changes are done in the UI rates by CERC. At
an initial level, the frequency band for UI prices was from 49.0 to 50.5 Hz. In 2016,
CERC has come up with the latest regulations (CERC, 2016 as shown in Fig. 4.3) which
adjust the frequency band between 49.7 and 50.05 Hz [48]. The rates for the deviation of
each 0.01 Hz step are equal to 35.60 Paisa/Kwh for frequency band from 50.05 to 50.00
Hz. For the frequency from 50 Hz to 49.7 Hz and below, 20.84 paisa/Kwh is considered.
The UI curve is presented in Fig. 4.3.
0
1000
2000
3000
4000
5000
6000
7000
8000
9000
UI C
har
ges
(IN
R/K
wh
)
Frequency (Hz)
FIGURE 4.3 UI price vs frequency chart (CERC, 2016).
The inverse relation between price and frequency deviation has been implemented using
an embedded MATLAB function block in MATLAB/Simulink. The MATLAB code for
UI price is shown below.
if frequency<=49.7
Price=8032;
elseif frequency<=50
Price=1780+20856*(50-frequency);
elseif frequency<=50.05

Automatic Generation Control in Restructured Power System
60
Price=35600*(50.05-frequency);
else
Price=0;
End
In Fig. 4.4 (a) and (b) the simulated results of UI price against load deviations for the
Poolco based market, bilateral market and bilateral market with contract violations are
presented.
(a)
(b)
FIGURE 4.4 (a) Area1 UI Price deviations (Rs/MWh), (b) Area2 UI Price deviations (Rs/MWh).
The above results represent the deviations in the UI charges during the AGC operation.
UI charge helps to regulate the frequency. Presently, the governor in the AGC loop helps
to stabilize deviations.
0 5 10 15 20 25 30 35 40 45 500
1000
2000
3000
4000
5000
6000
7000
8000
9000
Time(s)
Are
a1 U
I P
rice (
Rs/M
wh))
Case1
Case2
Case3
0 5 10 15 20 25 30 35 40 45 500
1000
2000
3000
4000
5000
6000
7000
Time(s)
Are
a2 U
I P
rice
(Rs/
Mw
h)
Case1
Case2
Case3
CHAPTER 4
61
4.5 AGC Operation during Peak Hours and Off-Peak Hours
Price Based Operation of AGC under Peak Hours-Off Hours is simulated in
MATLAB/Simulink under the bilateral market transaction. Here, the load variation
during peak- hour and off-peak hour is considered and simulated for 24 hours under the
availability based (ABT) tariff mechanism. Unscheduled Interchange (UI) charges of
ABT have calculated against frequency deviations. The charges of peak hours are high
as compared to off-peak hours. The results of tie line error, frequency deviations, and
changes in power deviations and UI charges vs. frequency are represented. For the
analysis in MATLAB/ Simulink the data used for area1 and area2 (GUVNL, 2016)
presented in Table 4.3, Table 4.4 and Table 4.5.
TABLE 4.3 Two Area Power System (GUVNL)
Sr.No Parameter Unit Area-1 Area-2
1 Thermal-hydro Thermal-Thermal
2 Pr MW 3000 2600
3 Base MVA MVA 3400 2600
4 PL MW 3000 2000
5 f Hz 50 50
6 H S 5 5
7 D pu/Hz 0.02 0.013
8 Tg S 0.08 0.08
9 Tt S 0.3 0.3
10 Tr S 10 10
11 Kr S 0.5 0.5
12 B puMW/Hz 0.425 0.425
13 R puMW/Hz 2.4 2.4
14 T12 0.545 0.545
15 Kd 2.4 2.4
16 Kp 2.4 2.4
17 Ki 4.5 4.5
18 Tw 1 1
19 Tp S 10 15
20 Kp puMW/Hz 50 75
21 % load variation MW 300 200
22 % load variation
Case-1 puMW 0.2 (300) 0
23 % load variation
Case-2 puMW 0.2 (300) 0.2 (200)
24 Uncontracted load puMW 0 260
25 % load variation
Case-3 puMW 0.2 (300) 0.3

Automatic Generation Control in Restructured Power System
62
The simulation for 24 hours of operation with peak hours (morning 6 to 11 and evening
6 to 11) and off-peak hours (11 am to 18 pm and 11 pm to 6 am) for bilateral transaction
is carried out. Here, all the DISCOs do the agreement with the GENCOs for power, which
is followed by the DPM as shown in (19). It is assumed that DISCOs in area1 demands
3000 MW power and DISCOs in area2 demands 2000 MW power of respective
GENCOs. The “𝑐𝑝𝑓𝑠” and 𝑎𝑝𝑓𝑠 guide the GENCO to participation in AGC operation.
The result of GENCO power deviations, area frequency deviations, UI prices deviations
and flow on the tie-line are presented in Fig. 4.5 (a) to (e). The load variation
TABLE 4.4 Area1 (MGVCL and DGVCL)
Sr.No Plant Location Capacity Total MW
1
Thermal
Ukai TPS 850
2820 2 Wanakbori I to VI 1,260
3 Wanakbori VII 210
4 Ukai Expansion 6 500
5 Hydro
Ukai Hydro 305 547
6 Kadana Hydro 242
7
Gas
Utran Gas Based 135
2600
8 Dhuvaran Gas Based - Stage-I 107
9 Dhuvaran Gas Based - Stage-II 112
10 Utran Extension 375
11 GPEC,surat 655
12 GIPCL II (165) 165
13 GIPCL-SLPP 250
14 GSEG 156
15 GIPCL - I (145) 145
16 GMDC - Akrimota 250
17 GIPCL, Expansion 250
18
Solar
Mithapur 50
71 19 Kambhar 15
20 Baroda 5
21 Sanand 1
22 Total 6038
TABLE 4.5 Area2 (UGVCL and PGVCL)
Sr.No Plant Location Capacity Total MW
1
Thermal
Gandhinagar I to IV 660
1700
2 Gandhinagar V 210
3 Sikka TPS 240
4 Kutch Lignite I to III 215
5 Kutch Lignite IV 75
6 ESSAR 300
7 Solar Charankha 850 850
8 Total 2550

CHAPTER 4
63
in the generation of both areas is considered during 24 Hrs of operation. During the peak
hour operation of power system DISCOs in area1 which are MGVCL and DGVCL
demands 225 MW each and DISCOs of area2, which are UGCVL and PGVCL demands
for 125 MW each and during an off-peak hour operation of power system DISCOs in
area1 which are MGVCL and DGVCL demands 150 MW each and DISCOs of area2
which are UGCVL and PGVCL demands for 50 MW each. For peak hours from 6 am to
11 am and from 6 pm to 11 pm, the 15% (450 MW in area1 and 150 MW in area2) load
changes considered in both areas. Similarly, during off-peak hours, the 10% (300 MW in
area1 and 200 MW in area2) load changes considered in both areas. An area participation
factors (apfs) and DPM matrix are assumed as follows. The changes in generated power
are calculated on an average basis for both area for peak- hours and off-peak hours of
operations of the power system are given as bellow. The area participation factors are
given as follows and DPM from (19) is considered.
𝑎𝑝𝑓1 = 0.75, 𝑎𝑝𝑓2 = 1 − 𝑎𝑝𝑓1 = 0.25, 𝑎𝑝𝑓3 = 0.5, 𝑎𝑝𝑓4 = 1 − 𝑎𝑝𝑓3 = 0.5.
(a)
(b)
FIGURE 4.5 (a) GENCOs power (Mw), (b) Area1 and Area2 Frequency Deviations (Hz).
0 5 10 15 20 24-200
-100
0
100
200
300
400
Time (Hour)
GE
NC
O P
ow
er
(MW
)
GENCO1 (MW)
GENCO2 (MW)
GENCO3 (MW)
GENCO4 (MW)
0 5 10 15 20 2449.6
49.7
49.8
49.9
50
50.1
50.2
50.3
50.4
Time (Hour)
Fre
quen
cy (
Hz)
Area1 Frequency (Hz)
Area2 Frequency (Hz)

Automatic Generation Control in Restructured Power System
64
(c)
(d)
(e)
FIGURE 4.5 (c) Area1 UI price (Rs/Mwh), (d) Area2 UI price (Rs/Mwh), (e) Tie line power (MW).
The above results represent the AGC operation during peak and off-peak hours. During
the AGC operation in peak hours the deviations in the frequency and UI price are more
as compared to off-peak hours. The deviations are for short time due to sudden changes
in the load, which can compensate by some quick responding device.
49.6 49.7 49.8 49.9 50 50.1 50.2 50.3 50.40
1000
2000
3000
4000
5000
6000
7000
8000
9000
Area1 Frequency (Hz)
Are
a1 U
I P
rice
(Rs/
Mw
h)
49.8 49.85 49.9 49.95 50 50.05 50.1 50.15 50.20
1000
2000
3000
4000
5000
6000
Area2 Frequency (Hz)
Are
a2 U
I P
rice
(Rs/
Mw
h)
0 5 10 15 20 24-100
-90
-80
-70
-60
-50
-40
-30
-20
-10
0
Time (Hour)
Tie
Lin
e (M
W)

CHAPTER 4
65
4.6 Conclusion
A Bilateral market as well as Poolco based market exists among the DISCOs and the
GENCOs in control areas. The “DPM” guides the AGC operation under the contracts.
Frequency linked UI price based operation of the generators running under AGC mode
is observed under the restructured power network. We can conclude that the generating
stations under AGC loop respond to the price signals manually as well as automatically.
The repeated operation of governor during the AGC increases repairs expense because of
wear and tear. Also, UI charges increases against the changes in the frequency. From the
result analysis, one can conclude that the frequent operation of the generator is not healthy
for them. The frequency can be regulated from the load side. The frequency fluctuations
are for a short time and occur frequently. So, the EES can help to give a quick response
against the frequency fluctuation. From the critical literature review, we can observe that
there is a tremendous potential in BESS as storage and to regulate frequency. BESS as a
load and source can participate in AGC for LFC, which is covered in chapter 5.

66
CHAPTER 5
Energy Storage for Frequency Regulation
5.1 Introduction
An energy storage device can help to regulate frequency. There is a tremendous potential
in EESS applications in power system. The different types of EESS are presented in
Appendix D. Among all the storage technologies, EVs as a distributed BESS can give
better, quick and fast service in frequency regulation [40][85]. Here, a diversified
transmission link is proposed. It distributes the LFC signal to all EVs through aggregators
for the participation in AGC. According to the ACE value an EV can charge or discharge
its battery.
5.2 The need for Electrical Energy Storage
In India, electricity requirement has increased after the announcement of the "Power for
All" target to give 24x7 hours of electricity by 2019. It also has announced plans to
increase 40% of electricity generation from RES by 2030. Due to uncertain renewable
power the grid is facing the problem of frequency fluctuations. There is a requirement of
fast responding ancillary services for frequency stability. BESS has a huge prospective
to regulate the frequency. Applications of BESS play a vital role to enhance system
frequency stability.
5.3 Grid Frequency Regulation Using Electrical Vehicle
As it is mentioned in the introduction, the grid frequency can be controlled by balancing
load against generation. To keep frequency near to 50 Hz, it is required to reserve a
definite amount of real power for frequency regulation. The service of EV to regulate the
frequency is called as vehicle to grid (V2G) and grid service to vehicle (G2V) service.
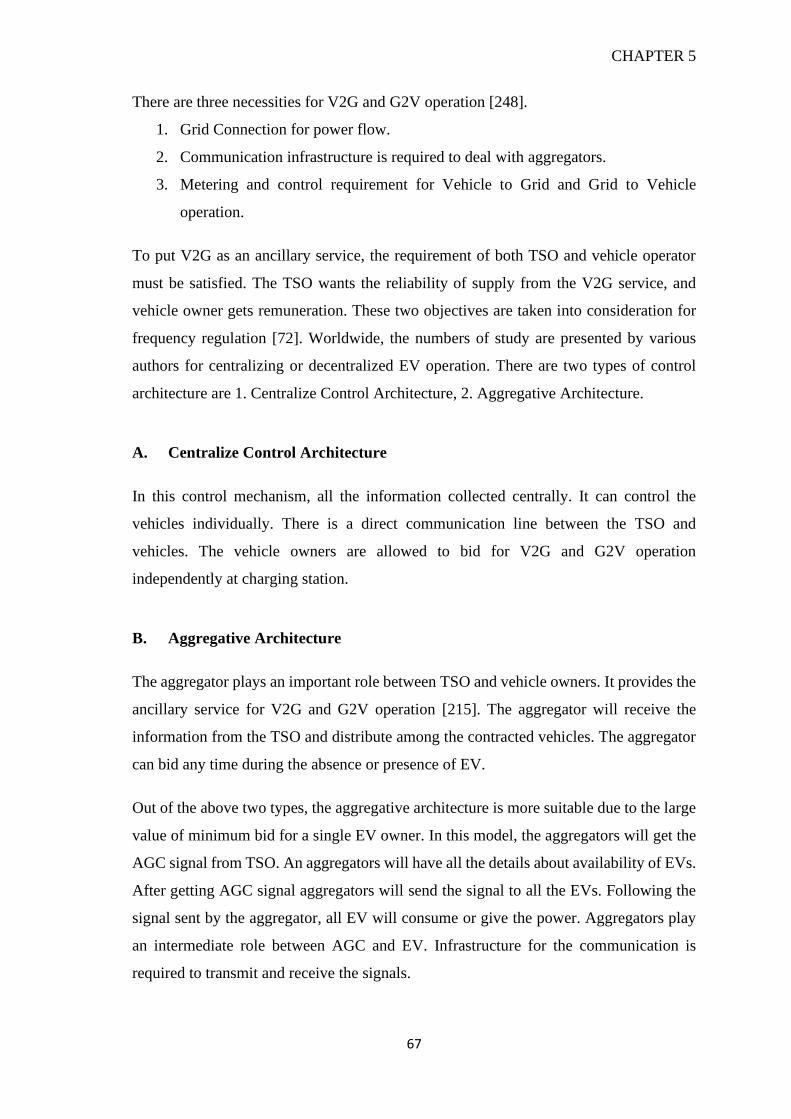
CHAPTER 5
67
There are three necessities for V2G and G2V operation [248].
1. Grid Connection for power flow.
2. Communication infrastructure is required to deal with aggregators.
3. Metering and control requirement for Vehicle to Grid and Grid to Vehicle
operation.
To put V2G as an ancillary service, the requirement of both TSO and vehicle operator
must be satisfied. The TSO wants the reliability of supply from the V2G service, and
vehicle owner gets remuneration. These two objectives are taken into consideration for
frequency regulation [72]. Worldwide, the numbers of study are presented by various
authors for centralizing or decentralized EV operation. There are two types of control
architecture are 1. Centralize Control Architecture, 2. Aggregative Architecture.
A. Centralize Control Architecture
In this control mechanism, all the information collected centrally. It can control the
vehicles individually. There is a direct communication line between the TSO and
vehicles. The vehicle owners are allowed to bid for V2G and G2V operation
independently at charging station.
B. Aggregative Architecture
The aggregator plays an important role between TSO and vehicle owners. It provides the
ancillary service for V2G and G2V operation [215]. The aggregator will receive the
information from the TSO and distribute among the contracted vehicles. The aggregator
can bid any time during the absence or presence of EV.
Out of the above two types, the aggregative architecture is more suitable due to the large
value of minimum bid for a single EV owner. In this model, the aggregators will get the
AGC signal from TSO. An aggregators will have all the details about availability of EVs.
After getting AGC signal aggregators will send the signal to all the EVs. Following the
signal sent by the aggregator, all EV will consume or give the power. Aggregators play
an intermediate role between AGC and EV. Infrastructure for the communication is
required to transmit and receive the signals.
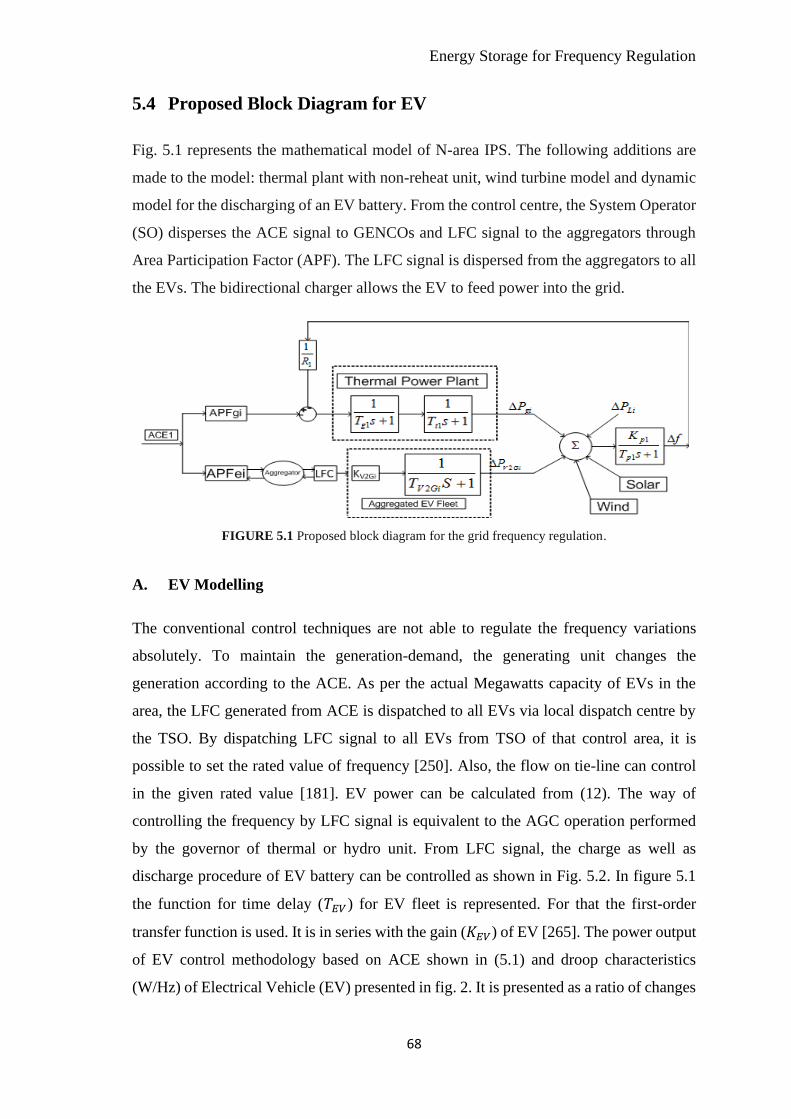
Energy Storage for Frequency Regulation
68
5.4 Proposed Block Diagram for EV
Fig. 5.1 represents the mathematical model of N-area IPS. The following additions are
made to the model: thermal plant with non-reheat unit, wind turbine model and dynamic
model for the discharging of an EV battery. From the control centre, the System Operator
(SO) disperses the ACE signal to GENCOs and LFC signal to the aggregators through
Area Participation Factor (APF). The LFC signal is dispersed from the aggregators to all
the EVs. The bidirectional charger allows the EV to feed power into the grid.
FIGURE 5.1 Proposed block diagram for the grid frequency regulation.
A. EV Modelling
The conventional control techniques are not able to regulate the frequency variations
absolutely. To maintain the generation-demand, the generating unit changes the
generation according to the ACE. As per the actual Megawatts capacity of EVs in the
area, the LFC generated from ACE is dispatched to all EVs via local dispatch centre by
the TSO. By dispatching LFC signal to all EVs from TSO of that control area, it is
possible to set the rated value of frequency [250]. Also, the flow on tie-line can control
in the given rated value [181]. EV power can be calculated from (12). The way of
controlling the frequency by LFC signal is equivalent to the AGC operation performed
by the governor of thermal or hydro unit. From LFC signal, the charge as well as
discharge procedure of EV battery can be controlled as shown in Fig. 5.2. In figure 5.1
the function for time delay (𝑇𝐸𝑉) for EV fleet is represented. For that the first-order
transfer function is used. It is in series with the gain (𝐾𝐸𝑉) of EV [265]. The power output
of EV control methodology based on ACE shown in (5.1) and droop characteristics
(W/Hz) of Electrical Vehicle (EV) presented in fig. 2. It is presented as a ratio of changes

CHAPTER 5
69
in power to the changes in frequency. Frequency range from 49.7 to 50.04 has been
considered as per CEA, India in 2016.
𝐴𝐶𝐸𝑖 = 𝛽𝛥𝑓𝑖 + 𝛥𝑃𝑖𝑗 (5.1)
Where, 𝛥𝑃𝑖𝑗 indicate from area II to an area I tie-line power flow.
The output of charging power (5.2) can be measured with the help of droop
characteristics𝐾𝐸𝑉,
𝑃𝐸𝑉1 = {𝐾𝐸𝑉1𝛥𝑓(|𝐾𝐸𝑉1𝛥𝑓|) ≤ 𝑃𝑚𝑃𝑚(𝑃𝑚 < |𝐾𝐸𝑉1𝛥𝑓|)
(5.2)
Where, 𝐾𝐸𝑉1 stands for the EV gain responsible for the power exchange for V2G
followed by the SOC deviation range. 𝑃𝑚is the maximum EV power.
Discharging power𝑃𝐸𝑉2 is calculated by (5.3). Load Frequency Control (LFC) signal is
calculated from (5.4), which is the ratio of ACE and characteristics constant.
𝑃𝐸𝑉2 = {
𝐾𝑚𝛥𝑓(0 < 𝐾𝑚𝛥𝑓 ≤ 𝑃𝑚)
𝑃𝑚(𝑃𝑚 < 𝐾𝑚𝛥𝑓)
0(𝐾𝑚𝛥𝑓 < 0) (5.3)
𝐿𝐹𝐶 = −𝐴𝐶𝐸𝑖
𝐾𝐸𝑉𝑖 (5.4)
𝐾𝐸𝑉𝑖 = The change in battery charging power divided by the change in frequency. LFC
signal is dispersed to all EVs for controlling the charging power.
Linear characteristics of frequency between 49.7 to 50.04 (CERC, 2016) Hz is considered
as presented in Fig. 5.3 [138]. The dispatched value of ACE is proportional to the degree
of a gradient. For positive ACE the LFC signal will negative, which increases the EV
battery charging power. The negative value of ACE increases in the EV battery
discharging power.
B. EV Charge-Discharge Control
For the controlling of charging and discharging power against frequency deviations
𝑃𝐸𝑉1and𝑃𝐸𝑉2 respectively LFC based PI controller can be used, which will use to adjust

Energy Storage for Frequency Regulation
70
Frequency (Hz)
50
Dis
char
ging
Cha
rgin
g
mP
mf
V2G
-G2V
Pow
er (
W)
50.01 50.02 50.03 50.0449.9449.8749.7 49.79
ACE<0
ACE>0
mK
FIGURE 5.2 EV battery operating characteristics to Charge and Discharge.
the value of gain𝐾𝐸𝑉. The PI controller will track variations in the value of frequency.
The value of 𝐾𝐸𝑉 is subject to the upper and lower boundary of a SOC (SOC=Actual
capacity/ Rated capacity) value. The maximum and minimum values assumed for SOC
are 90% and 30% respectively. To track the SOC deviations of the battery, an Integral
Absolute Error (IAE) method application is used in both areas. IAE I of area1 and area2
are represented by (5.5) and (5.6) respectively.
IAE of 𝛥𝑆𝑂𝐶𝐴𝑟𝑒𝑎1 = ∫ |𝛥𝑆𝑂𝐶𝐴𝑟𝑒𝑎1|∞
0𝑑𝑡
(5.5)
IAE of 𝛥𝑆𝑂𝐶𝐴𝑟𝑒𝑎2 = ∫ |𝛥𝑆𝑂𝐶𝐴𝑟𝑒𝑎2|∞
0𝑑𝑡 (5.6)
IAE values of the SOC deviations can be calculated from (5.5) and (5.6) by multiplying
the number of EVs [44]. The IAE value is subjected to a minimum and maximum gain
value, which is presented in (5.7) and (5.8).
𝐾𝑝𝑖𝑝𝑖,𝑚𝑎𝑥𝑝𝑖,𝑚𝑖𝑛 (5.7)
𝐾𝐼𝑖𝐼𝑖,𝑚𝑎𝑥𝐼𝑖,𝑚𝑖𝑛 (5.8)
Where, i= area1 and area2, 𝐾𝑝𝑖,𝑚𝑖𝑛and𝐾𝐼𝑖,𝑚𝑖𝑛are minimum gain value PI controller.
Similarly, 𝐾𝑝𝑖,𝑚𝑎𝑥and𝐾𝐼𝑖,𝑚𝑎𝑥 are the maximum gain values PI controller.

CHAPTER 5
71
5.5 Price Based AGC Operation In Coordination with EV
The AGC operation under different market conditions has been performed. The different
cases of the contracts are as follows.
1. POOLCO based contract
2. Bilateral contract
The operation AGC is simulated by considering isolated two areas IPS as shown in Fig.
4.1. The Base MVA of 2000 MVA and capacity of 2000 MW is considered [289]. The
system parameters of are given in Appendix-C. The AGC function is observed under the
following three markets. For the analysis data as shown in Appendix-B are used.
5.5.1 POOLCO based contract
In this contract, the changes in a load of area 1 only are considered. Participation of
GECNOs is presented by apf, where apf1 = apf2 = 0.5 and apf3 = apf4 = 0.5. In this case of the
poolco based transaction only DISCO1 and DISCO2 are demanding the load. DISCO3
and DISOC4 do not claim the exchange of power from any generating company. The
DPM presented as,
𝑫𝑷𝑴 = [
𝟎. 𝟓 𝟎. 𝟓 𝟎 𝟎𝟎. 𝟓 𝟎. 𝟓 𝟎 𝟎𝟎 𝟎 𝟎 𝟎𝟎 𝟎 𝟎 𝟎
] (5.9)
Sudden load fluctuation of 200 MW in area1 has been only considered for the
visualization of AGC operation and dynamics. Dynamic behaviour with unexpected load
changes with and without EVs is represented in Fig. 5.3 (a) to (f). The Fig. 5.3 (a) to (b)
represents the GENCO power. The Fig. 5.3 (c) represents the frequency fluctuation and
Fig. 5.3 (d) shows the fluctuation in the tile line flow. The area1 UI price (Rs/Mwh) and
Area2 UI price (Rs/Mwh) deviations are presented in Fig. 5.3 (e) to (f). As only area1
have nonzero load demand, so momentary rise and fall of frequency in area1 are larger
than in area2. Due to no contract exists between GENCOs of and DISCOs of the different
area; the tie-line power is zero. Calculated values of the GENCO power are presented in
Table 5.1.

Energy Storage for Frequency Regulation
72
TABLE 5.1 Calculated Power At GENCOs And Tie Line (Poolco Based Transaction)
Change in Generation Tie
Line Unit G-1 G-2 G-3 G-4
MW 100 100 0 0 0
(a)
(b)
(c)
FIGURE 5.3 (a) Load deviation response of generated power of Area1, (b) Load deviation response of
generated power of Area2, (c) Frequency deviation response of Area1 and Area2.
0 5 10 15 20 25 30 35 40 45 500
20
40
60
80
100
120
140
160
Time (s)
Pow
er
(MW
)
GENCO 1 Without EV
GENCO 2 Without EV
GENCO 1 With EV
GENCO 2 With EV
0 5 10 15 20 25 30 35 40 45 50-30
-20
-10
0
10
20
30
Time (s)
Pow
er
(MW
)
GENCO 3 Without EV
GENCO 4 Without EV
GENCO 3 With EV
GENCO 4 With EV
0 5 10 15 20 25 30 35 40 45 5049.75
49.8
49.85
49.9
49.95
50
50.05
50.1
50.15
50.2
50.25
Time (s)
Fre
quency (
Hz)
Area 1 Freq (Hz) Without EV
Area 2 Frwq (Hz) Without EV
Area 1 Freq (Hz) With EV
Area 2 Freq (Hz) With EV

CHAPTER 5
73
(d)
(e)
(f)
FIGURE 5.3 (d) Tie line power deviation, (e) Area1 UI Price (Rs/Mwh), (f) Area2 UI Price
(Rs/Mwh).
From the results it is observed that, the peak overshoots and deviations in the power, tie
line, frequency and UI price has been reduced with grid-connected EVs.
0 5 10 15 20 25 30 35 40 45 50-50
-40
-30
-20
-10
0
10
20
30
Time (s)
Pow
er
(MW
)
Tie Line Without EV
Tie Line With EV
0 5 10 15 20 25 30 35 40 45 500
1000
2000
3000
4000
5000
6000
7000
Time(s)
Are
a1 U
I P
rice (
Rs/M
wh))
Without EV
With EV
0 5 10 15 20 25 30 35 40 45 501200
1400
1600
1800
2000
2200
2400
2600
2800
Time(s)
Are
a2 U
I P
rice
(Rs/
Mw
h))
Without EV
With EV

Energy Storage for Frequency Regulation
74
5.5.2 Bilateral Transaction
In this, a contract exists among the GENCOs and the DISCOs of the same and different
areas. The DPM is given in (19). It is assumed that each DISCO is demanding 10% (100
MW) power. To supply the power the GENCO participation is given by 𝑎𝑝𝑓𝑠 where,
𝑎𝑝𝑓1 = 0.75, 𝑎𝑝𝑓2 = 1 − 𝑎𝑝𝑓1 = 0.25, ,𝑎𝑝𝑓3 = 0.5, 𝑎𝑝𝑓4 = 1 − 𝑎𝑝𝑓3 = 0.5
𝐷𝑃𝑀 = [
0.5 0.25 0 0.30.2 0.25 0 00 0.25 1 0.70.3 0.25 0 0
] (5.10)
Here, the total load changes of 200 MW in area1 and area2 have been considered. Impact
with EV and without EVs is represented in Fig. 5.4 (a) to (f). The GENCOs power is
presented in Fig. 5.4 (a) and (b). Fig. 5.4 (c) shows the results of frequency deviations
and Fig. 5.4 (d) shows the tie line flow. The deviations in the UI price (Rs/Mwh) are
presented in Fig. 5.4 (e) and (f). The calculated values of GENCO power are shown in
Table 5.2.
TABLE 5.2 Calculated Power At GENCOs And Tie Line (Bilateral Transaction)
Change in Generation Tie
Line Unit G-1 G-2 G-3 G-4
MW 105 45 195 55 -50
(a)
FIGURE 5.4 (a) Load deviation response of generated power of Area 1.
0 5 10 15 20 25 30 35 40 45 500
20
40
60
80
100
120
140
160
180
Time (s)
Pow
er
(MW
)
GENCO 1 Without EV
GENCO 2 Without EV
GENCO 1 With EV
GENCO 2 With EV

CHAPTER 5
75
(b)
(c)
(d)
FIGURE 5.4 (b) Load deviation response of generated power of Area 2, (c) Frequency deviation
response of Area 1 and Area 2, (d) Tie line power deviation.
0 5 10 15 20 25 30 35 40 45 500
50
100
150
200
250
TIme (s)
Pow
er
(MW
)
GENCO 3 Without EV
GENCO 4 Without EV
GENCO 3 With EV
GENCO 4 With EV
0 5 10 15 20 25 30 35 40 45 5049.7
49.75
49.8
49.85
49.9
49.95
50
50.05
50.1
50.15
50.2
Time (s)
Fre
quen
cy (
Hz)
Area 1 Freq (Hz) Without EV
Area 2 Freq (Hz) Without EV
Area 1 Freq (Hz) With EV
Area 2 Freq (Hz) With EV
0 5 10 15 20 25 30 35 40 45 50-70
-60
-50
-40
-30
-20
-10
0
Time (s)
Pow
er
(MW
)
Tie Line Without EV
Tie Line With EV

Energy Storage for Frequency Regulation
76
(e)
(f)
FIGURE 5.4 (e) Area1 UI Price (Rs/Mwh) ,(f) Area2 UI Price (Rs/Mwh).
From the above results it is noted that, the peak overshoots and deviations in the power,
tie line, frequency and UI price has been reduced with grid-connected EVs.
5.5.3 Bilateral Transaction with Contract Violation
The contract may violate by DISCO due to excess power demand. This excess power is
uncontracted with any GENCO. The GENCO have to supply for the uncontracted power
of the same area. For visualization of a contract violation, case 2 is considered with excess
power of 100 MW demanded by DISCO in area2. It is replicated in the area as a local
load, not as the contract demand, so there is no change in DPM elements. An overall load
deviation in the area is (𝛥𝑃𝐿1,𝐿𝑂𝐶) = (DISCO1+ DISCO2) Total Load = (100+100)+100
= 300 MW. Likewise, in area II the total local load = (DISCO3 + DISCO4)load = 200
MW.
0 5 10 15 20 25 30 35 40 45 500
1000
2000
3000
4000
5000
6000
7000
8000
Time(s)
Are
a1 U
I P
rice (
Rs/M
wh))
Without EV
With EV
0 5 10 15 20 25 30 35 40 45 500
500
1000
1500
2000
2500
3000
3500
4000
4500
5000
Time(s)
Are
a2 U
I P
rice
(Rs/
Mw
h))
Without EV
With EV

CHAPTER 5
77
Comparative results of the different parameters with and without EVs are shown in Fig.
5.5 (a) to (f). Fig. 5.5 (a) to (b) shows the simulated results of the GENCOs power. The
Fig.5.5 (c) shows the results of frequency deviations and Fig. 5.5 (d) shows the tie-line
flow. The deviations in the UI price (Rs/Mwh) are presented in Fig. 5.5 (e) and Fig. 5.5
(f). The calculated values of GENCOs power are presented Table 5.3.
Table 5.3 Calculated Powers at GENCOs And Tie Line
Change in Generation Tie
Line Unit G-1 G-2 G-3 G-4
MW 180 70 195 55 -50
(a)
(b)
FIGURE 5.5 (a) Load deviation response of generated power of Area1, (b) Load deviation response of
generated power of Area 2
0 5 10 15 20 25 30 35 40 45 500
50
100
150
200
250
300
Time(s)
Pow
er
(MW
)
GENCO 1 Without EV
GENCO 2 Without EV
GENCO 1 WIth EV
GENCO 2 With EV
0 5 10 15 20 25 30 35 40 45 500
50
100
150
200
250
Time (s)
Pow
er
(MW
)
GENCO 3 Without EV
GENCO 4 Without EV
GENCO 3 With EV
GENCO 4 With EV

Energy Storage for Frequency Regulation
78
(c)
(d)
(e)
FIGURE 5.5 (c) Frequency deviation response of Area 1 and Area 2, (d) Tie line power deviation,
(e) Area1 UI Price (Rs/Mwh),
0 5 10 15 20 25 30 35 40 45 5049.5
49.6
49.7
49.8
49.9
50
50.1
50.2
50.3
Time (s)
Fre
quen
cy (
Hz)
Area1 Freq (Hz) Without EV
Area2 Freq (Hz) Without EV
Area1 Freq (Hz) With EV
Area2 Freq (Hz) With EV
0 5 10 15 20 25 30 35 40 45 50-120
-100
-80
-60
-40
-20
0
Time (s)
Pow
er
(MW
)
Tie Line Without EV
Tie Line WIth EV
0 5 10 15 20 25 30 35 40 45 500
1000
2000
3000
4000
5000
6000
7000
8000
9000
Time(s)
Are
a1 U
I P
rice
(Rs/
Mw
h)
Without EV
With EV

CHAPTER 5
79
(f)
FIGURE 5.5 (f) UI Price (Rs/Mwh)
In Table 5.4 represents the results of frequency and time for without and with EVs
integration in a grid. Frequency stability can be achieved with EV.
TABLE 5.4 Summary of Comparison with EV and Without EV
Case Controller
Settling Time (s) Peak Overshoots No. of
Oscillations >50 Hz <50 Hz
Area1 Area2 Area1 Area2 Area1 Area2 Area1 Area2
F UI F UI F UI F UI F UI F UI F UI F UI
1
Without
EV 12 12 12 12 50.2 0 50.09 0 49.77 6500 49.92 2600 11 11 10 10
With EV 5 5 5 5 50.08 0 50.02 0 49.85 5000 49.98 2250 5 5 6 6
2
Without
EV 13 13 13 13 50.16 0 50.2 0 49.73 7200 49.77 4900 8 8 8 8
With EV 10 10 10 10 50.05 0 50.1 0 49.84 5200 49.85 4500 5 5 5 5
3
Without
EV 11 11 11 11 50.25 0 50.12 0 49.56 8000 49.78 6500 8 8 8 8
With EV 9 9 9 9 50.1 0 50.03 0 49.57 7900 49.95 4900 6 6 6 6
The above results are discussed in the following section.
POOLCO based Market
In case of the power system operating under Poolco based market with EV, the Area1
frequency operating range is 50.2 - 49.77 Hz (Fig.5.3(c)) , the UI price operating range
is 0 - 6500 Rs/Mwh (Fig. 5.3 (e)), no of oscillations in the frequency are 11
(Fig.5.4(c))and frequency settling time is 12 s (Fig.5.3(c)). In case of grid connected EV
the frequency operating range reduces to 50.08 - 49.85 Hz (Fig.5.3 (e)), the UI price
operating range reduces to 0 - 5000 Rs/Mwh (Fig.5.3 (f)), the no of oscillation in the
frequency are reduces 5 and frequency settling time reduces to 5 s (Fig.5.3(c)).
0 5 10 15 20 25 30 35 40 45 500
1000
2000
3000
4000
5000
6000
7000
Time(s)
Are
a2 U
I P
rice
(Rs/
Mw
h)
Without EV
With EV

Energy Storage for Frequency Regulation
80
Similarly, in Area2 without EV the frequency operating range 50.09 - 49.92Hz
(Fig.5.3(c)), the UI price operating range 0 - 2600 Rs/Mwh (Fig.5.3(e)), no of oscillations
are 10 and frequency settling time is 12 s (Fig.5.3(c)). In case of grid connected EV the
frequency operating range reduces to 50.2 - 49.98 Hz (Fig.5.3(c)), the UI price reduces
to 0 - 2200 Rs/Mwh (Fig.5.3 (f)), the no of oscillations are reduces to 6 (Fig.5.3(c)) and
frequency settling time reduces to 5 s (Fig.5.3(c)).
By comparing the results of with and without EV from the simulation and Table 5.4,
better results achieved with EV for reduction in an operating range of frequency,
operating range of UI charges, frequency settlement time and frequency oscillation.
Bilateral Market
In case of the power system operating under Bilateral market with EV, the Area1
frequency operating range is 50.16 - 49.73 Hz (Fig.5.4(c)) , the UI price operating range
is 0 - 7200 Rs/Mwh (Fig.5.4(e)), no of oscillations in the frequency are 8 (Fig.5.3(c)) and
frequency settling time is 13 s (Fig.5.4(c)). In case of grid connected EV the frequency
operating range reduces to 50.05 - 49.84 Hz (Fig.5.4(c)), the UI price operating range
reduces to 0 - 5200 Rs/Mwh (Fig.5.4 (f)), the no of oscillation in the frequency are
reduces 5 (Fig.5.4(c)) and frequency settling time reduces to 10 s (Fig.5.4(c)).
Similarly, in Area2 without EV the frequency operating range 50.2 - 49.77Hz
(Fig.5.4(c)), the UI price operating range 0 - 4900 Rs/Mwh (Fig.5.4(e)), no of oscillations
are 8 and frequency settling time is 10 s (Fig.5.4(c)). In case of grid connected EV the
frequency operating range reduces to 50.1 - 49.85 Hz (Fig.5.4(c)) (Fig.5.4(c)), the UI
price reduces to 0 - 4500 Rs/Mwh (Fig.5.4(f)), the no of oscillations are reduces to 5
(Fig.5.4(c)) and frequency settling time reduces to 10 s (Fig.5.4(c)).
By comparing the results of with and without EV from the simulation and Table 5.4,
better results are achieved with EV for reduction in an operating range of frequency,
operating range of UI charges, frequency settlement time and frequency oscillation.
Bilateral Market with Contract Violation
In case of the power system operating Bilateral market with contract violation with EV,
the Area1 frequency operating range is 50.25 - 49.57 Hz (Fig.5.5(c)) , the UI price
operating range is 0 - 8000 Rs/Mwh (Fig.5.5(e)), no of oscillations in the frequency are
8 (Fig.5.5(c)) and frequency settling time is 11 s (Fig.5.5(c)). In case of grid connected

CHAPTER 5
81
EV the frequency operating range reduces to 50.01 - 49.57 Hz (Fig.5.5(c)), the UI price
operating range reduces to 0 - 7900 Rs/Mwh (Fig.5.5 (e)), the no of oscillation in the
frequency are reduces 6 (Fig.5.5(c)) and frequency settling time reduces to 9 s
(Fig.5.5(c)). Similarly, in Area2 without EV the frequency operating range 50.12 - 49.78
Hz (Fig.5.5(c)), the UI price operating range 0 - 6500 Rs/Mwh (Fig.5.5(f)), no of
oscillations are 8 and frequency settling time is 11 s (Fig.5.5(c)). In case of grid connected
EV the frequency operating range reduces to 50.03 - 49.95 Hz (Fig.5.5(c)), the UI price
reduces to 0 - 4900 Rs/Mwh (Fig.5.5 (f)), the no of oscillations are reduces to 6
(Fig.5.5(c)) and frequency settling time reduces to 9 s (Fig.5.5(c)).
By comparing the results of with without EV from the simulation and Table 5.4, better
results achieved with EV for reduction in an operating range of frequency, operating
range of UI charges, frequency settlement time and frequency oscillation.
5.6 Conclusion
From the previous section it can be observed that the proposed fleet of aggregated EVs
can control load frequency by participating in AGC. From the results, it has been realized
that the time to settle the normal frequency value, its oscillations peak overshoots are
reduced when EVs are grid-connected. Also, deviations in UI charges, its peak overshoots
and settling time are reduced during the charging/discharging operating mode of EVs.
So, distributed EVs perform a key function in the network which is to reduce the burden
on governor during AGC operation of synchronous generators.

82
CHAPTER 6
AGC Operation with Renewable Energy Sources
6.1 Introduction
Now a day’s electric grid is fast getting transformed into a smart grid and AGC operation
has become complex. With an integration of RESs the deviations in the frequency are
increasing. The percentage of RESs is steadily increasing day by day. As on 31st March
2018, India has 22 GW solar and 34 GW wind installed capacity. After the generation of
power from a renewable source, feeding that power into the grid is a sensitive point. Even
though India is encouraging the initiatives for green energy integration into the grid, it is
still a big challenge to develop infrastructure for the same. Installation of the renewable
projects takes 12-18 months, while transmission line takes up to five years. All of these
create a big challenge. For example, in India because of the variation in wind power, 50%
of the wind power generation is backed down by the Tamil Nadu State Load Dispatch
Centre (CERC, 2016). It causes financial loses for wind generators.
In Chapter 4, AGC operation without the grid connected RESs is discussed. Day by day
an integration of RESs increases [224]. The generated power from RESs is intermittent
in nature. Also, distance is a major constraint for the transmission of renewable power.
Moreover, India lacks a storage facility. Due to nature of RES, the deviations in the
frequency and UI price increases. Also, the AGC operation becomes complex [305].
In this chapter deviation in the frequency, GENCO power, Tie line flow and UI rates are
presented when RES power is fed into the grid. The above electrical parameters are highly
fluctuating due to both load variation and renewable power. A solution using storage as
a grid-connected fleet of electrical vehicles/ hybrid electrical vehicles is presented. It
helps to lessen the peak overshoots and time period of the oscillations in the load
frequency, power and UI rates.

CHAPTER 6
83
6.2 Solar Energy System with Price Based AGC Operation
6.2.1 Block Diagram of Two area Restructure Power System with Solar System
In this section two areas restructure power system with thermal-hydro and the thermal-
thermal unit has been considered for the AGC operation, shown in Fig. 6.2. Area1 has
GENCO1 (Thermal Unit) and GENCO2 (Hydro unit) with two distribution companies
MGVCL as DISCO1 and DGVCL as DISOC2. Similarly, Area2 has GENCO3 (Thermal
Unit) and GENCO4 (Thermal Unit) with two distribution companies UGVCL as
DISCO3 and PGVCL as DISCO4.The contract of DISCO and GENCO is monitored by
ISO followed by DPM [289].
The following solar model is assumed to understand an impact of the solar plant. (6.1)
represents the power output [65] of the PV system.
𝑃𝑃𝑉 = 𝜂𝑆𝜑{1 − 0.005(𝑇𝑎 + 25} (6.1)
The conversion efficiency is ranging from 8 to 15 %. The 𝜂and𝑆 has a constant value.
The output power of PV depends only on 𝑇𝑎 and 𝜑.
The PV model dynamic equation is presented in (6.2).
𝐾𝑃𝑉 =𝐺𝑃𝑉
1 + 𝑠𝑇𝑃𝑉=𝛥𝑃𝑃𝑉𝛥𝜑
(6.2)
Where KPV = Ratio of change in power (ΔPPV) to the change in radiation.
The AGC operation under different market conditions has been performed. The different
cases of the contracts are as follows.
The transfer function for the PV model is represented as given below in Fig. 6.1 [265].
FIGURE 6.1 Model for output fluctuation of (PV) solar power

AGC Operation with Renewable Energy Sources
84
FIGURE 6.2 Two area restructured power system

CHAPTER 6
85
6.2.2 AGC Operation under Different Market Condition
The operation AGC is simulated by considering isolated two area power system. The
Base MVA of 3400 MVA (Thermal-Hydro Unit) in Area1 and 2600 MVA (Thermal-
Thermal Unit) in Area2 with a rated capacity of 3000 MW and 2600 MW is considered.
The system parameters are shown in the Table 4.3, Table 4.4 and Table 4.5. The AGC
operation is observed under the following three markets.
1. POOLCO based Market
2. Bilateral Transaction
For the analysis in MATLAB/ Simulink, data for two area IPS used from Gujarat Urja
Vikas Nigam Limited ((GUVNL), 2016 are presented in Table 4.2 for Area1 and Table
4.3 for Area2.
6.2.2.1 Poolco Based Market
Load variation of 20% (300 MW) in area1 considered. Fig. 6.3 (a) to (i) represents the
results of fluctuations in power, frequency, tie line flow and UI price because of the
fluctuating temperament of solar power. In this, the power deviation of 300 MW of area1
is represented by 150 MW by GENCO1 and 150 MW by GENCO2. In this transaction,
GENCO3 and GENCO4 of area2 will not participate. For the reduction in the deviations,
the grid-connected fleet of EV is considered. EV helps to reduce the deviations, which
are presented in Fig. 6.4 (a) to (i). Fig. 6.4 (a) to (d) represents the of GENCO power
deviations, Fig. 6.4 (e) to (f) represents the results of frequency deviations, Fig. 6.4 (g)
represents the result of tie-line flow and Fig. 6.4 (h) and (i) represents the results of UI
prices. The calculated results of GENCO power and tie-line flow are presented in Table
6.1.
TABLE 6.1 Calculated Power at GENCOs And Tie Line (Poolco Based Transaction)
Change in Generation Tie
Line Unit G-1 G-2 G-3 G-4
MW 150 150 0 0 0
6.2.2.2 Bilateral Market
Load variation of 20% (300 MW) in area1 and 20% (300 MW) in area2 considered. Fig.
6.5 (a) to (i) represents the results of fluctuations in power, frequency, tie line flow and
UI price because of the fluctuating temperament of solar power.

AGC Operation with Renewable Energy Sources
86
(a) (a)
(b) (b)
(c) (c)
FIGURE 6.3 Impact of Solar Power on
(a) GENCO1 Power Deviation, (b) GENCO2 Power
Deviation, (c) GENCO3 Power Deviation.
FIGURE 6.4 Impact if a Fleet of EVs on
(a) GENCO1 Power Deviation, (b) GENCO2 Power Deviation, (c) GENCO3 Power Deviation.
0 5 10 15 20 25 30 35 40 45 500
50
100
150
200
250
300
350
Time(S)
GE
NC
O1(M
W)
Without PV Without EV
With PV
0 5 10 15 20 25 30 35 40 45 500
50
100
150
200
250
300
350
Time(S)
GE
NC
O1(M
W)
With PV
With EV
0 5 10 15 20 25 30 35 40 45 50-300
-250
-200
-150
-100
-50
0
50
100
150
200
Time(S)
GE
NC
O2(M
W)
Without PV Without EV
With PV
0 5 10 15 20 25 30 35 40 45 50-300
-250
-200
-150
-100
-50
0
50
100
150
200
Time(S)
GE
NC
O2(M
W)
With PV
With EV
0 5 10 15 20 25 30 35 40 45 50-20
-10
0
10
20
30
40
50
Time(S)
GE
NC
O3(M
W)
Without PV Without EV
With PV
0 5 10 15 20 25 30 35 40 45 50-20
-10
0
10
20
30
40
50
Time(S)
GE
NC
O3(M
W)
With PV
With EV

CHAPTER 6
87
(d) (d)
(e) (e)
(f) (f)
FIGURE 6.3 Impact of Solar Power on
(d) GENCO4 Power Deviation, (e) Area1 Frequency
Deviation, (f) Area2 Frequency Deviation.
FIGURE 6.4 Impact if a Fleet of EVs on
(d) GENCO4 Power Deviation, (e) Area1 Frequency
Deviation, (f) Area2 Frequency Deviation.
0 5 10 15 20 25 30 35 40 45 50-20
-10
0
10
20
30
40
50
Time(S)
GE
NC
O4(M
W)
Without PV Without EV
With PV
0 5 10 15 20 25 30 35 40 45 50-20
-10
0
10
20
30
40
50
Time(S)
GE
NC
O4(M
W)
With PV
With EV
0 5 10 15 20 25 30 35 40 45 5049.6
49.7
49.8
49.9
50
50.1
50.2
50.3
Time(S)
Fre
quency A
rea1(H
z)
Without PV Without EV
With PV
0 5 10 15 20 25 30 35 40 45 5049.6
49.7
49.8
49.9
50
50.1
50.2
50.3
Time(S)
Fre
quency A
rea1(H
z)
With PV
With EV
0 5 10 15 20 25 30 35 40 45 5049.8
49.85
49.9
49.95
50
50.05
50.1
Time(S)
Fre
quency A
rea2(H
z)
Without PV Without EV
With PV
0 5 10 15 20 25 30 35 40 45 5049.8
49.85
49.9
49.95
50
50.05
50.1
Time(S)
Fre
quency A
rea2(H
z)
With PV
With EV

AGC Operation with Renewable Energy Sources
88
(g) (g)
(h) (h)
(i) (i)
FIGURE 6.3 Impact of Solar Power on
(g) Tie Line Power Deviation, (h) Area1 UI Price
(Rs/Mwh), (i) Area2 UI Price (Rs/Mwh).
FIGURE 6.4 Impact of a Fleet of EVs on
(g) Tie Line Power Deviation, (h) Area1 UI Price
(Rs/Mwh), (i) Area2 UI Price (Rs/Mwh).
The power deviation of 300 MW of area1 is represented by 157.5 MW by GENCO1 and
67.5 MW by GENCO2. The power deviation of 300 MW of area2 is represented by 195
MW by GENCO1 and 55 MW by GENCO2. In this transaction, GENCO3 and GENCO4
0 5 10 15 20 25 30 35 40 45 50-100
-80
-60
-40
-20
0
20
40
Time(S)
Tie
Lin
e P
ow
er
(MW
)
Without PV Without EV
With PV
0 5 10 15 20 25 30 35 40 45 50-100
-80
-60
-40
-20
0
20
40
Time(S)
Tie
Lin
e P
ow
er
(MW
)
With PV
With EV
0 5 10 15 20 25 30 35 40 45 500
1000
2000
3000
4000
5000
6000
7000
8000
9000
Time(S)
UI
Price A
rea1(R
s/M
wh)
Without PV Without EV
With PV
0 5 10 15 20 25 30 35 40 45 500
1000
2000
3000
4000
5000
6000
7000
8000
9000
Time(S)
UI
Price A
rea1(R
s/M
wh)
With PV
With EV
0 5 10 15 20 25 30 35 40 45 500
1000
2000
3000
4000
5000
6000
Time(S)
UI
Price A
rea2(R
s/M
wh)
Without PV Without EV
With PV
0 5 10 15 20 25 30 35 40 45 500
1000
2000
3000
4000
5000
6000
Time(S)
UI
Price A
rea2(R
s/M
wh)
With PV
With EV

CHAPTER 6
89
of area2 will not participate. For the reduction in the deviations, the grid-connected fleet
of EV is considered. EV helps to reduce the deviations, which are presented in Fig. 6.6
(a) to (i). Fig. 6.6 (e) to (f) represents the results of frequency deviations, Fig. 6.6 (g)
represents the result of tie-line flow and Fig. 6.6 (h) and (i) represents the results of UI
prices. The calculated results of GENCO power including the tie-line flow are presented
in Table 6.2.
TABLE 6.2 Calculated Power At GENCO And Tie Line (Bilateral Transaction)
Change in Generation Tie
Line Unit G-1 G-2 G-3 G-4
MW 157.5 66 195 55 -50
(a) (a)
(b) (b)
FIGURE 6.5 Impact of Solar Power on
(a) GENCO1 Power Deviation, (b) GENCO2 Power
Deviation.
FIGURE 6.6 Impact if a Fleet of EVs on
(a) GENCO1 Power Deviation, (b) GENCO2 Power
Deviation.
0 5 10 15 20 25 30 35 40 45 500
50
100
150
200
250
300
350
400
Time(S)
GE
NC
O1(M
W)
Without PV Without EV
With PV
0 5 10 15 20 25 30 35 40 45 500
50
100
150
200
250
300
350
400
Time(S)
GE
NC
O1(M
W)
With PV
With EV
0 5 10 15 20 25 30 35 40 45 50-120
-100
-80
-60
-40
-20
0
20
40
60
80
Time(S)
GE
NC
O2(M
W)
Without PV Without EV
With PV
0 5 10 15 20 25 30 35 40 45 50-120
-100
-80
-60
-40
-20
0
20
40
60
80
Time(S)
GE
NC
O2(M
W)
With PV
With EV

AGC Operation with Renewable Energy Sources
90
(c) (c)
(d) (d)
(e) (e)
FIGURE 6.5 Impact of Solar Power on
(c) GENCO3 Power Deviation, (d) GENCO4 Power
Deviation, (e) Area1 Frequency Deviation.
FIGURE 6.6 Impact if a Fleet of EVs on
(c) GENCO3 Power Deviation, (d) GENCO4 Power
Deviation, (e) Area1 Frequency Deviation.
0 5 10 15 20 25 30 35 40 45 500
20
40
60
80
100
120
Time(S)
GE
NC
O4(M
W)
Without PV Without EV
With PV
0 5 10 15 20 25 30 35 40 45 500
50
100
150
200
250
Time(S)
GE
NC
O3(M
W)
With PV
With EV
0 5 10 15 20 25 30 35 40 45 500
20
40
60
80
100
120
Time(S)
GE
NC
O4(M
W)
Without PV Without EV
With PV
0 5 10 15 20 25 30 35 40 45 500
20
40
60
80
100
120
Time(S)
GE
NC
O4(M
W)
With PV
With EV
0 5 10 15 20 25 30 35 40 45 5049.6
49.7
49.8
49.9
50
50.1
50.2
50.3
50.4
Time(S)
Fre
quency A
rea1(H
z)
Without PV Without EV
With PV
0 5 10 15 20 25 30 35 40 45 5049.6
49.7
49.8
49.9
50
50.1
50.2
50.3
50.4
Time(S)
Fre
quency A
rea1(H
z)
With PV
With EV

CHAPTER 6
91
(f) (f)
(g) (g)
(h) (h)
FIGURE 6.5 Impact of Solar Power on
(f) Area2 Frequency Deviation, (g) Tie Line Power
Deviation, (h) Area1 UI Price (Rs/Mwh).
FIGURE 6.6 Impact if a Fleet of EVs on
(f) Area2 Frequency Deviation, (g) Tie Line Power
Deviation, (h) Area1 UI Price (Rs/Mwh).
0 5 10 15 20 25 30 35 40 45 5049.8
49.85
49.9
49.95
50
50.05
50.1
Time(S)
Fre
quency A
rea2(H
z)
Without PV Without EV
With PV
0 5 10 15 20 25 30 35 40 45 5049.8
49.85
49.9
49.95
50
50.05
50.1
Time(S)
Fre
quency A
rea2(H
z)
With PV
With EV
0 5 10 15 20 25 30 35 40 45 50-100
-90
-80
-70
-60
-50
-40
-30
-20
-10
0
Time(S)
Tie
Lin
e P
ow
er
(MW
)
Without PV Without EV
With PV
0 5 10 15 20 25 30 35 40 45 50-100
-90
-80
-70
-60
-50
-40
-30
-20
-10
0
Time(S)
Tie
Lin
e P
ow
er
(MW
)
With PV
With EV
0 5 10 15 20 25 30 35 40 45 500
1000
2000
3000
4000
5000
6000
7000
8000
9000
Time(S)
UI
Price A
rea1(R
s/M
wh)
Without PV Without EV
With PV
0 5 10 15 20 25 30 35 40 45 500
1000
2000
3000
4000
5000
6000
7000
8000
9000
Time(S)
UI
Price A
rea1(R
s/M
wh)
With PV
With EV

AGC Operation with Renewable Energy Sources
92
(i) (i)
FIGURE 6.5 Impact of Solar Power on
(i) Area2 UI Price (Rs/Mwh).
FIGURE 6.6 Impact if a Fleet of EVs on
(i) Area2 UI Price (Rs/Mwh).
The results of settling time, peak overshoots and oscillations of frequency as well as UI
price are given in the Table 6.3.
TABLE 6.3 Comparative Analysis of PV and EV integration
Case Condition
Frequency Settling
Time (s)
Peak Overshoots No. of
Oscillations in
Frequency >50 Hz <50 Hz
Area1 Area2 Area1 Area2 Area1 Area2 Area1 Area2
F UI F UI F UI F UI F UI F UI F UI F UI
Case
1
Without PV
14 14 15 15 50.14 0 50.04 0 49.65 8000 49.84 5300 8 8 8 8
With PV - - - - 50.15 0 50.05 0 49.65 8000 49.84 5300 25 25 25 25
With EV 6 6 14 14 50.04 0 50.03 0 49.79 6300 49.97 2500 12 12 10 10
Case
2
Without PV
10 10 18 18 50.23 0 50.07 0 49.63 8000 49.83 5700 7 7 9 9
With PV - - - - 50.24 0 50.08 0 49.62 8000 49.82 5800 Continuous
oscillations With EV 10 10 15 15 50.03 0 50.07 0 49.8 6000 49.87 4500
The above results are discussed in the following section.
Poolco Based Market
In case of the power system operating under Poolco based market with PV, the Area1
frequency operating range is 50.15 - 49.65 Hz (Fig. 6.4 (e)) , the UI price operating range
is 0 - 8000 Rs/Mwh (Fig. 6.4 (h)) respectively and the oscillations in the frequency are
continuous (Fig. 6.4 (e)). In case of grid connected EV the frequency operating range
reduces to 50.04 - 49.79 Hz (Fig. 6.4 (e)), the UI price operating range reduces to 0 -
6300 Rs/Mwh (Fig. 6.4 (h)) and the oscillation in the frequency are continuous (Fig. 6.4
0 5 10 15 20 25 30 35 40 45 500
1000
2000
3000
4000
5000
6000
Time(S)
UI
Price A
rea2(R
s/M
wh)
Without PV Without EV
With PV
0 5 10 15 20 25 30 35 40 45 500
1000
2000
3000
4000
5000
6000
Time(S)
UI
Price A
rea2(R
s/M
wh)
With PV
With EV

CHAPTER 6
93
(e)). Similarly, in Area2 with WT the frequency operating range 50.24 - 49.62 Hz (Fig.
6.4 (f)), the UI price operating range 0 - 8000 Rs/Mwh (Fig. 6.4 (i)) and the oscillations
are continuous (Fig. 6.4 (f)). In case of grid connected EV the frequency operating range
reduces to 50.03 - 49.8 Hz (Fig. 6.4 (f)), the UI price reduces to 0 - 6000 Rs/Mwh (Fig.
6.4 (i)), the no of oscillations are continuous (Fig. 6.4 (f)). By comparing the results of
with PV and with EV from the simulation and Table 6.3, better results achieved with EV
for reduction in an operating range of frequency as well as operating range of UI charges.
The frequency oscillations are continuous in both the cases, but the peak overshoot are
less in with EV.
Bilateral Market
In case of the power system operating under Bilateral market with PV, the Area1
frequency operating range is 50.24 - 49.62 Hz (Fig. 6.6 (e)) , the UI price operating range
is 0 - 8000 Rs/Mwh (Fig. 6.6 (h)) and the oscillations in the frequency are continuous
(Fig. 6.6 (e)). In case of grid connected EV the frequency operating range reduces to
50.03 - 49.8 Hz (Fig. 6.6 (e)) , the UI price operating range reduces to 0 - 6000 Rs/Mwh
(Fig. 6.6 (h)) and the oscillation in the frequency are reduces continuous (Fig. 6.6 (e)).
Similarly, in Area2 with WT the frequency operating range 50.08 - 49.82 Hz (Fig. 6.6
(f)), the UI price operating range 0 - 5800 Rs/Mwh (Fig. 6.6 (i)) and the oscillations are
continuous (Fig. 6.6 (f)). In case of grid connected EV the frequency operating range
reduces to 50.07 - 49.87 Hz (Fig. 6.6 (f)), the UI price reduces to 0 - 4500 Rs/Mwh (Fig.
6.6 (i)) and the oscillations are continuous (Fig. 6.6 (f)). By comparing the results of with
PV and with EV from the simulation and Table 6.3, better results achieved with EV for
reduction in an operating range of frequency as well as operating range of UI charges.
The frequency oscillations are continuous in both the cases, but the peak overshoot are
less in with EV.
6.3 Wind Energy System with Price Based AGC Operation
The nature of wind is unpredictable under weather conditions. In this section two area
restructured IPS with the thermal-thermal non-reheat unit has been considered with and
without wind power. The local load variations of 20% with and without wind power
fluctuations are considered.

AGC Operation with Renewable Energy Sources
94
6.3.1 Description of Two Area Restructured Power System
The network assumed for the analysis is presented in Fig.6.1. The power purchase
contract agreement of GENCOs and DISCOs is represented by DPM. The contract is
monitored by ISO. For the visualization of bilateral contract, the IPS of Gujarat has been
assumed and synthetically divided into Area1 and Area2 as shown in Fig. 6.7.
In Area1 and Area2 contains two numbers of GENCOs in their own area. Similarly, two
numbers of DISCOs are there in both areas. The power system is considered under
deregulated environment. The DPM represents the contract between GENCO and
DISCO. The wind turbine is considered to be connected in both area. Fig. 6.8 shows the
wind turbine model [286] with a hydraulic pitch actuator, and data fit pitch response. A
first-order system describes the dynamics of the wind power generating unit.
6.3.2 AGC Operation under Different Market Condition
The AGC operation under different market conditions has been performed. The different
cases of the contracts are as follows.
1. POOLCO based Market
2. Bilateral Market
The operation of AGC is simulated by considering isolated two area power system. The
Base MVA of 2000 MVA and rated capacity of 2000 MW has been considered. The
system parameters of the isolated network are shown in Appendix-C. The Electrical
Vehicle parameters considered from Appendix A. The parameters for the wind
considered are as follows.
Wind Power Unit:
TP1= TP2=0.41 S, KP1=1.25, KP2=1.
6.3.2.1 Poolco Based Market
The load variation of 10% (200 MW) in area1 considered. The load deviation of 200 MW
in area1 is represented by 100 MW by GENCO1 and 100 MW by GENCO2. In this
transaction, GENCO3 and GENCO4 of area2 will not participate. It is represented

CHAPTER 6
95
GENCO-1
GENCO-2
GENCO-3
GENCO-4
Electric Vehicles
Electric Vehicles
Local
Load1
Power System1
Power System2
DIS
CO
1
DIS
CO
2
DIS
CO
3
DIS
CO
4
apf1
apf2
apf3
apf4
+
cpf11
cpf12
cpf13
cpf14
cpf21
cpf22
cpf23
cpf24
cpf31
cpf32
cpf33
cpf34
-
-
+
+
+
-
-
-
-
-
-
cpf31
cpf32
cpf33
cpf34
+
+
+
+
+
+
+
++
+ +
+ +
+ +
Wind Power
Local
Load1
+-
-
AREA1
AREA2
++
++
-
++
++
+
-
Wind Power
FIGURE 6.7 Block diagram representation two area restructured power system with wind turbine.
)1(
3
S
K P
+21
1
PST+ S
STK PP
+
+
1
)1(12
Hydraulic pitch actuator Data fit pitch
response
+
-
CONTROLLER
DROOP
FIGURE 6.8 Block diagram of Wind Power Plant.
by Fig. 6.9 (a) to (i) represents the results of fluctuations in power, frequency, tie line
flow and UI price because of the fluctuating temperament of solar power. For reduction
in the deviations, the grid-connected fleet of EV is considered. An EV helps to reduce the
deviations, which are presented in Fig. 6.10 (a) to (i). The calculated power deviation
data are presented in Table 6.4. Fig. 6.10 (e) to (f) represents the results of frequency
deviations, Fig. 6.10 (g) shows the result of tie-line flow and Fig. 6.10 (h) and (i) represent
the results of UI prices.

AGC Operation with Renewable Energy Sources
96
TABLE 6.4 Calculated Power At GENCOs And Tie Line (Poolco Based Transaction)
Change in Generation Tie
Line Unit G-1 G-2 G-3 G-4
MW 100 100 0 0 0
(a) (a)
(b) (b)
(c) (c)
FIGURE 6.9 Impact of Wind Power on
(a) GENCO1 Power Deviation, (b) GENCO2 Power
Deviation, (c) GENCO3 Power Deviation.
FIGURE 6.10 Impact of a Fleet of EVs on
(a) GENCO1 Power Deviation, (b) GENCO2 Power
Deviation, (c) GENCO3 Power Deviation.
0 5 10 15 20 25 30 35 40 45 500
20
40
60
80
100
120
140
160
Time (S)
del P
g1 (
MW
)
Without WT
With WT
0 5 10 15 20 25 30 35 40 45 500
50
100
150
Time (S)
del P
g1 (
MW
))
Without EV
With EV
0 5 10 15 20 25 30 35 40 45 500
20
40
60
80
100
120
140
160
Time (S)
del P
g2 (
MW
)
Without WT
With WT
0 5 10 15 20 25 30 35 40 45 500
50
100
150
Time (S)
del P
g2 (
MW
))
Without EV
With EV
0 5 10 15 20 25 30 35 40 45 50-30
-20
-10
0
10
20
30
Time (S)
del P
g3 (
MW
)
Without WT
With WT
0 5 10 15 20 25 30 35 40 45 50-25
-20
-15
-10
-5
0
5
10
15
20
Time (S)
del P
g3 (
MW
))
Without EV
With EV

CHAPTER 6
97
(d) (d)
(e)
(e)
(f) (f)
FIGURE 6.9 Impact of Wind Power on
(d) GENCO4 Power Deviation, (e) Area1 Frequency
Deviation,(f) Area2 Frequency Deviation.
FIGURE 6.10 Impact of a Fleet of EVs on
(d)GENCO4 Power Deviation, (e) Area1 Frequency
Deviation,(f) Area2 Frequency Deviation.
0 5 10 15 20 25 30 35 40 45 50-30
-20
-10
0
10
20
30
Time (S)
del P
g4 (
MW
)
Without WT
With WT
0 5 10 15 20 25 30 35 40 45 50-25
-20
-15
-10
-5
0
5
10
15
20
Time (S)
del P
g4 (
MW
))
Without EV
With EV
0 5 10 15 20 25 30 35 40 45 5049.75
49.8
49.85
49.9
49.95
50
50.05
50.1
50.15
50.2
50.25
Time (S)
Fre
quency A
rea1 (
Hz)
Without WT
With WT
0 5 10 15 20 25 30 35 40 45 5049.75
49.8
49.85
49.9
49.95
50
50.05
50.1
50.15
50.2
50.25
Time (S)
Fre
quency A
rea1 (
Hz)
Without EV
With EV
0 5 10 15 20 25 30 35 40 45 5049.85
49.9
49.95
50
50.05
50.1
Time (S)
Fre
quency A
rea2 (
Hz)
Without WT
With WT
0 5 10 15 20 25 30 35 40 45 5049.85
49.9
49.95
50
50.05
50.1
Time (S)
Fre
quency A
rea2 (
Hz)
Without EV
With EV

AGC Operation with Renewable Energy Sources
98
(g) (g)
(h) (h)
(i) (i)
FIGURE 6.9 Impact of Wind Power on
(g) Tie Line Power Deviation, (h) Area1 UI Price
(Rs/Mwh), (i) Area2 UI Price (Rs/Mwh).
FIGURE 6.10 Impact of a Fleet of EVs on
(g) Tie Line Power Deviation, (h) Area1 UI Price
(Rs/Mwh), (i) Area2 UI Price (Rs/Mwh).
6.3.2.2 Bilateral Market
In this contract 20% (200 MW) load variation in area1 and area2 are considered. Fig.
6.11(a) to (i) represents the results of fluctuations in power, frequency, tie line flow and
0 5 10 15 20 25 30 35 40 45 50-50
-40
-30
-20
-10
0
10
20
30
Time (S)
Tie
Lin
e P
ow
er
(MW
)
Without WT
With WT
0 5 10 15 20 25 30 35 40 45 50-40
-30
-20
-10
0
10
20
30
Time (S)
Tie
Lin
e P
ow
er
(MW
)
Without EV
With EV
0 5 10 15 20 25 30 35 40 45 500
1000
2000
3000
4000
5000
6000
7000
Time (S)
UI
Price A
rea1 (
Rs/M
wh))
Without WT
With WT
0 5 10 15 20 25 30 35 40 45 500
1000
2000
3000
4000
5000
6000
7000
Time (S)
UI
Price A
rea1 (
Rs/M
wh)
Without EV
With EV
0 5 10 15 20 25 30 35 40 45 500
500
1000
1500
2000
2500
3000
3500
4000
Time (S)
UI
Price A
rea2 (
Rs/M
wh))
Without WT
With WT
0 5 10 15 20 25 30 35 40 45 500
500
1000
1500
2000
2500
3000
3500
4000
Time (S)
UI
Price A
rea2 (
Rs/M
wh)
Without EV
With EV

CHAPTER 6
99
UI price because of the fluctuating characteristics of the WT. The load deviation of 300
MW of area1 is represented by 105 MW by GENCO1 and 45 MW by GENCO2. The
power deviation of 300 MW of area2 is represented by 195 MW by GENCO1 and 55
MW by GENCO2. For the reduction in the deviations, the grid-connected fleet of EV is
considered. EV helps to reduce the deviations, which are presented in Fig. 6.12 (a) to (i).
The calculated power deviations values are presented in Table 6.5. Fig. 6.12 (e) to (f)
represents the results of frequency deviations, Fig. 6.12 (g) represents the result of tie-
line flow and Fig. 6.12 (h) and (i) represents the results of UI prices.
TABLE 6.5 Calculated Power At GENCO And Tie Line (Bilateral Transaction)
Change in Generation Tie
Line Unit G-1 G-2 G-3 G-4
MW 105 45 195 55 -50
(a) (a)
(b) (b)
FIGURE 6.11 Impact of Wind Power on
(a) GENCO1 Power Deviation, (b) GENCO2
Power Deviation
FIGURE 6.12 Impact if a Fleet of EVs on
(a) GENCO1 Power Deviation, (b) GENCO2
Power Deviation.
0 5 10 15 20 25 30 35 40 45 500
20
40
60
80
100
120
140
160
180
Time (S)
del P
g1 (
MW
))
Without WT
With WT
0 5 10 15 20 25 30 35 40 45 500
20
40
60
80
100
120
140
160
180
Time (S)
del P
g1 (
MW
))
Without EV
With EV
0 5 10 15 20 25 30 35 40 45 500
20
40
60
80
100
120
140
Time (S)
del P
g2 (
MW
))
Without WT
With WT
0 5 10 15 20 25 30 35 40 45 500
20
40
60
80
100
120
Time (S)
del P
g2 (
MW
))
Without EV
With EV

AGC Operation with Renewable Energy Sources
100
(c) (c)
(d) (d)
(e) (e)
FIGURE 6.11 Impact of Wind Power on
(c) GENCO3 Power Deviation, (d) GENCO4
Power Deviation, (e) Area1 Frequency Deviation.
FIGURE 6.12 Impact if a Fleet of EVs on
(c) GENCO3 Power Deviation, (d) GENCO4
Power Deviation, (e) Area1 Frequency Deviation.
0 5 10 15 20 25 30 35 40 45 500
50
100
150
200
250
Time (S)
del P
g3 (
MW
))
Without WT
With WT
0 5 10 15 20 25 30 35 40 45 500
50
100
150
200
250
Time (S)
del P
g3 (
MW
))
Without EV
With EV
0 5 10 15 20 25 30 35 40 45 500
20
40
60
80
100
120
Time (S)
del P
g4 (
MW
))
Without WT
With WT
0 5 10 15 20 25 30 35 40 45 500
20
40
60
80
100
120
Time (S)
del P
g4 (
MW
))
Without EV
With EV
0 5 10 15 20 25 30 35 40 45 5049.7
49.75
49.8
49.85
49.9
49.95
50
50.05
50.1
50.15
50.2
Time (S)
Fre
quency A
rea1 (
Hz))
Without WT
With WT
0 5 10 15 20 25 30 35 40 45 5049.75
49.8
49.85
49.9
49.95
50
50.05
50.1
50.15
Time (S)
Frequency A
rea1 (H
z))
Without EV
With EV

CHAPTER 6
101
(f) (f)
(g) (g)
(h) (h)
FIGURE 6.11 Impact of Wind Power on
(f) Area2 Frequency Deviation, (g) Tie Line Power
Deviation, (h) Area1 UI Price (Rs/Mwh).
FIGURE 6.12 Impact if a Fleet of EVs on
(f) Area2 Frequency Deviation, g) Tie Line Power
Deviation, (h) Area1 UI Price (Rs/Mwh).
0 5 10 15 20 25 30 35 40 45 5049.75
49.8
49.85
49.9
49.95
50
50.05
50.1
50.15
50.2
50.25
Time (S)
Fre
quency A
rea2 (
Hz)
Without WT
With WT
0 5 10 15 20 25 30 35 40 45 5049.75
49.8
49.85
49.9
49.95
50
50.05
50.1
50.15
50.2
50.25
Time (S)
Fre
quency A
rea2 (
Hz)
Without EV
With EV
0 5 10 15 20 25 30 35 40 45 50-80
-70
-60
-50
-40
-30
-20
-10
0
Time (S)
Tie
Lin
e P
ow
er
(MW
)
Without WT
With WT
0 5 10 15 20 25 30 35 40 45 50-80
-70
-60
-50
-40
-30
-20
-10
0
Time (S)
Tie
Lin
e P
ow
er
(MW
)
Without EV
With EV
0 5 10 15 20 25 30 35 40 45 500
1000
2000
3000
4000
5000
6000
7000
8000
Time (S)
UI
Price A
rea1 (
Rs/M
wh)
Without WT
With WT
0 5 10 15 20 25 30 35 40 45 500
1000
2000
3000
4000
5000
6000
7000
Time (S)
UI
Price A
rea1 (
Rs/M
wh)
Without EV
With EV

AGC Operation with Renewable Energy Sources
102
(i) (i)
FIGURE 6.11 Impact of Wind Power on
(i) Area2 UI Price (Rs/Mwh).
FIGURE 6.12 Impact if a Fleet of EVs on
(i) Area2 UI Price (Rs/Mwh).
TABLE 6.6 Comparative Analysis of WT and EV integration
Case
Condition
Settling Time (s) Peak Overshoots No. of
Oscillations >50 Hz <50 Hz
Area1 Area2 Area1 Area2 Area1 Area2 Area1 Area2
F UI F UI F UI F UI F UI F UI F UI F UI
1
Without WT
17 17 15 15 50.2 0 50.09 0 49.77 6500 49.93 3400 13 13 11 11
With WT 25 25 20 20 50.23 0 50.09 0 49.77 6500 49.92 3600 16 16 16 16
With EV 8 8 8 8 50.1 0 50.02 0 49.84 4900 49.98 2200 6 6 6 6
2
Without WT
11 11 13 13 50.15 0 50.2 0 49.75 7400 49.8 6300 9 9 9 9
With WT 15 15 15 15 50.14 0 50.24 0 49.74 7300 49.8 6300 12 12 11 11
With EV 10 10 11 11 50.05 0 50.1 0 49.86 5000 49.84 4900 5 5 5 5
The above results are discussed in the following section.
Poolco based Market
In case of the power system operating under Poolco based market with WT, the Area1
frequency operating range is 50.23 - 49.77 Hz , the UI price operating range is 0 - 6500
Rs/Mwh respectively , no of oscillations in the frequency are 16 and frequency settling
time is 25 s. In case of grid connected EV the frequency operating range reduces to
50.01 - 49.84 Hz, the UI price operating range reduces to 0 - 4900 Rs/Mwh, the no of
oscillation in the frequency are reduces 6 and frequency settling time reduces to 8 s.
Similarly, in Area2 with WT the frequency operating range 50.09 - 49.92 Hz, the UI price
operating range 0 - 3600 Rs/Mwh, no of oscillations are 16 and frequency settling time
is 20 s. In case of grid connected EV the frequency operating range reduces to 50.02 -
0 5 10 15 20 25 30 35 40 45 500
1000
2000
3000
4000
5000
6000
7000
Time (S)
UI
Price A
rea2 (
Rs/M
wh)
Without WT
With WT
0 5 10 15 20 25 30 35 40 45 500
1000
2000
3000
4000
5000
6000
7000
Time (S)
UI
Price A
rea2 (
Rs/M
wh)
Without EV
With EV

CHAPTER 6
103
49.98 Hz, the UI price reduces to 0 - 2200 Rs/Mwh, the no of oscillations are reduces to
8 and frequency settling time reduces to 6 s. By comparing the results of with WT and
with EV from the simulation and Table 6.6, better results achieved with EV for reduction
in an operating range of frequency, operating range of UI charges, frequency settlement
time and frequency oscillation.
Bilateral Market
In case of the power system operating under Bilateral market with WT, the Area1
frequency operating range is 50.14 - 49.74 Hz , the UI price operating range is 0 - 7300
Rs/Mwh, no of oscillations in the frequency are 12 and frequency settling time is 15 s. In
case of grid connected EV the frequency operating range reduces to 50.01 - 49.86 Hz,
the UI price operating range reduces to 0 - 5000 Rs/Mwh, the no of oscillation in the
frequency are reduces to 5 and frequency settling time reduces to 10 s. Similarly, in Area2
with WT the frequency operating range 50.24 - 49.8 Hz, the UI price operating range 0 -
6300 Rs/Mwh, no of oscillations are 11 and frequency settling time is 15 s. In case of
grid connected EV the frequency operating range reduces to 50.1 - 49.84 Hz, the UI price
reduces to 0 - 4900 Rs/Mwh, the no of oscillations are reduces to 5 and frequency settling
time reduces to 11 s. By comparing the results of with WT and with EV from the
simulation and Table 6.6, better results achieved with EV for reduction in an operating
range of frequency, operating range of UI charges, frequency settlement time and
frequency oscillation.
6.4 Conclusion
In the restructured power network, a number of generators running with AGC loop to
balance generation-load in all conditions. In the bilateral as well as poolco based market,
generators balance the frequency by complex AGC loop. Presently, in the smart-grid, the
power feeding by RESs such as wind turbine is uneven. It makes unbalance between
supply and demand. So, uneven load as well as RESs power creates more fluctuations
into the frequency and power. To short-out the problem of fluctuations in the frequency
and power, the quick responding storage is required. The RES can participate in day
ahead electricity market by adopting stationary energy source such as battery. In poolco
based market and bilateral market, the frequency settling time as well as numbers of

AGC Operation with Renewable Energy Sources
104
oscillation are less in case of grid connected EV as compared to without EV. So, the fast-
responding storage as EV battery is a best option.
The frequency, generator power, tie-line flow and UI charges deviations because of
sudden local load deviation, PV power fluctuations, as well as WT power fluctuation, are
presented in the simulation under POOLCO based and bilateral contract market. From
the study, it is realized that EVs can settle the deviations in the frequency, power as well
as UI price. The grid-connected fleet of electrical vehicles, presented in the simulation
helps to decrease the peak magnitude of the overshoots and time duration of frequency
oscillations, power deviations and UI rates.

105
CHAPTER 7
Price Based Automatic Generation Control Using
Fuzzy-Based Grid Connected EVs
7.1 Introduction
The grid connected fleet of EV is a better option as a fast responding device against
frequency deviations. Normally, to charge and discharge the EV battery, PI controllers
are used to tracking the load continuously. But due to nonlinearity and uncertainty of
load, performance of PI controller becomes poor. So, fuzzy-based PI controller can be
used. It can track better as compared to PI controller to reduce the frequency deviations
and settling time too.
The fuzzy logic theory depends on the experience from which people can take decisions.
The details of the fuzzy logic are given Appendix E. An application of FG controller to
adjust the PI controller gain is presented in this chapter. The restructured power system
in isolated mode with the thermal- hydro and thermal-thermal non-reheat system is
considered for AGC operation. The DPM has been used for making the contract between
DISCOs and GENCOs under the restructured environment. Dynamic study of frequency
deviations in the power system by load fluctuation under Poolco based market as well as
Bilateral markets with its violation conditions has been carried out and simulated. Finally,
the fleet of a electrical vehicle (EVs) as large battery energy storage has been proposed
due to its fast response against load variation like a generator-turbine unit of the thermal
power plant.
7.2 Description of the Model
Two area Automatic generation control (AGC) strategy using an electric vehicle as grid-
connected distributed energy storage has been proposed under the deregulated power
system along with a solar as grid-connected renewable energy source (Fig.6.1). The DPM
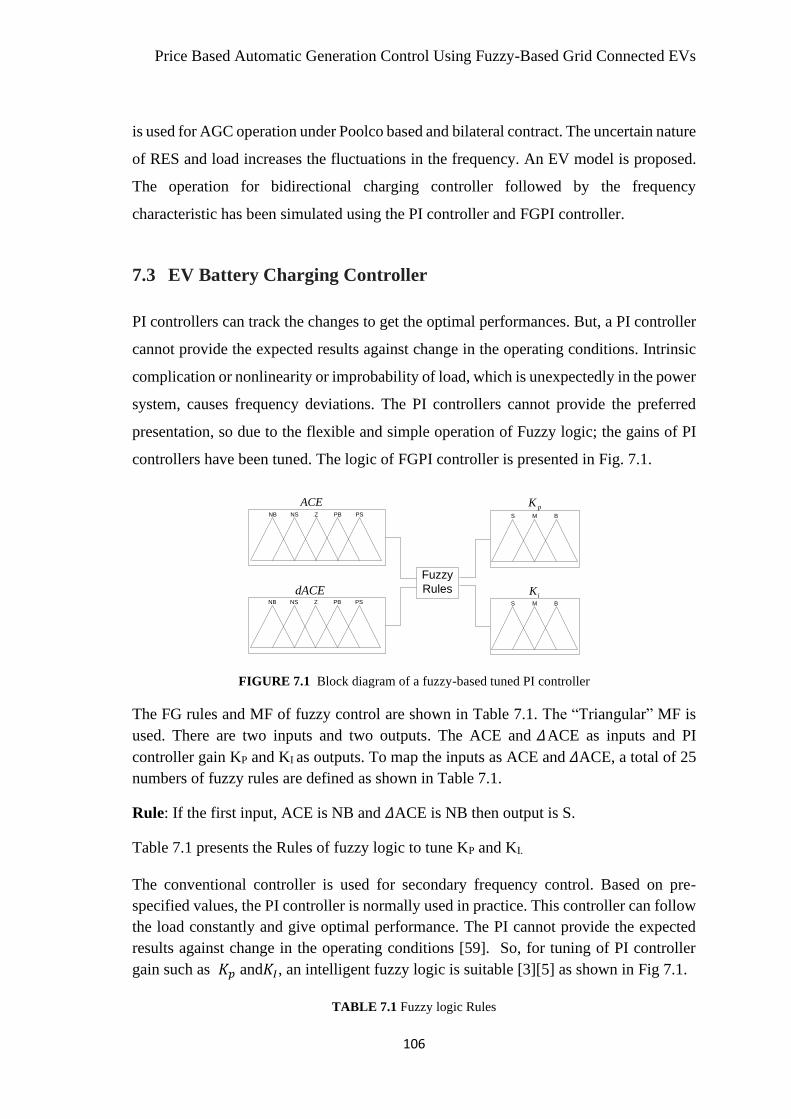
Price Based Automatic Generation Control Using Fuzzy-Based Grid Connected EVs
106
is used for AGC operation under Poolco based and bilateral contract. The uncertain nature
of RES and load increases the fluctuations in the frequency. An EV model is proposed.
The operation for bidirectional charging controller followed by the frequency
characteristic has been simulated using the PI controller and FGPI controller.
7.3 EV Battery Charging Controller
PI controllers can track the changes to get the optimal performances. But, a PI controller
cannot provide the expected results against change in the operating conditions. Intrinsic
complication or nonlinearity or improbability of load, which is unexpectedly in the power
system, causes frequency deviations. The PI controllers cannot provide the preferred
presentation, so due to the flexible and simple operation of Fuzzy logic; the gains of PI
controllers have been tuned. The logic of FGPI controller is presented in Fig. 7.1.
Fuzzy
Rules
ACE
dACE
pK
iK
NB NS Z PB PS
NB NS Z PB PS
S M B
S M B
FIGURE 7.1 Block diagram of a fuzzy-based tuned PI controller
The FG rules and MF of fuzzy control are shown in Table 7.1. The “Triangular” MF is
used. There are two inputs and two outputs. The ACE and 𝛥ACE as inputs and PI
controller gain KP and KI as outputs. To map the inputs as ACE and 𝛥ACE, a total of 25
numbers of fuzzy rules are defined as shown in Table 7.1.
Rule: If the first input, ACE is NB and 𝛥ACE is NB then output is S.
Table 7.1 presents the Rules of fuzzy logic to tune KP and KI.
The conventional controller is used for secondary frequency control. Based on pre-
specified values, the PI controller is normally used in practice. This controller can follow
the load constantly and give optimal performance. The PI cannot provide the expected
results against change in the operating conditions [59]. So, for tuning of PI controller
gain such as 𝐾𝑝 and𝐾𝐼, an intelligent fuzzy logic is suitable [3][5] as shown in Fig 7.1.
TABLE 7.1 Fuzzy logic Rules

CHAPTER 7
107
Input1 ACE
Input2 NB NS Z PS PB
𝜟𝑨𝑪𝑬
NB S S M M B
NS S M M B VB
Z M B B VB VB
PS B B VB VB VB
PB B VB VB VVB VVB
7.4 Intelligent Price Based AGC Operation under The Different
Market
The operation AGC is simulated under three different contract as a case study by
considering isolated two area power system of Base MVA of 2000 MVA and capacity
of 2000 MW. The parameters of the isolated network are presented in Appendix-B.
Case 1: POOLCO based Market
Case 2: Bilateral Market
Case 3: Bilateral Market with a contract violation
7.4.1 Poolco Based Market
In this market, the load change in area 1 only considered. Participation of GECNOs is
presented by apf as follows. Here, the apf1=0.5, apf2=0.5, apf3=0.5 and apf4=0.5 are
considered. Here, only DISCO1 and DISCO2 demanding the load. DISCO3 and DISOC4
do not claim the exchange of power from any generating company. The DPM presented
in (7.1) used for the simulation.
𝑫𝑷𝑴 = [
𝟎. 𝟓 𝟎. 𝟓 𝟎 𝟎𝟎. 𝟓 𝟎. 𝟓 𝟎 𝟎𝟎 𝟎 𝟎 𝟎𝟎 𝟎 𝟎 𝟎
]
(7.1)
Sudden load variation of 200 MW in area1 has only been considered for the visualization
of AGC operation and dynamics. Dynamic behaviour in case of unexpected load changes
by a comparative analysis of the PI controller and Fuzzy PI Controller (FPC) of EV
bidirectional charger represented in Fig. 7.4 (a) to (i). The peak overshoots and deviations
in the power, tie line, frequency and UI price has been reduced by FPC of grid-connected
EV. In Fig. 7.2 (a) to (d) deviations in the power of GENCOs are shown. In Fig. 7.2 (e)
and (f), since area1 have nonzero load demand, the momentary rise and fall of area1

Price Based Automatic Generation Control Using Fuzzy-Based Grid Connected EVs
108
frequency is larger than in area2. The deviations in the UI price (Rs/Mwh) are presented
in Fig. 7.2 (g) and (h). The tie-line power is zero due to no contract exists among the
GENCOs and the DISCOs of the different area. It is presented in Fig.7.2 (i). The
calculated values of generator power have been shown in Table 7.2.
TABLE 7.2 Calculated Power At GENCOs And Tie Line (Poolco Based Transaction)
Change in Generation Tie
Line Unit G-1 G-2 G-3 G-4
MW 100 100 0 0 0
(a)
(b)
FIGURE 7.2 Comparative results of PI and Fuzzy PI controller in Poolco Based Transaction for (a)
GENCO1 Power Deviations of Area1, (b) GENCO2 Power Deviations of Area2
0 5 10 15 20 25 30 35 40 45 500
20
40
60
80
100
120
140
160
Time(s)
GE
NC
O1 P
ow
er
(MW
))
PI Controller
Fuzzy PI Controller
0 5 10 15 20 25 30 35 40 45 500
20
40
60
80
100
120
140
160
Time(s)
GE
NC
O2
Pow
er (
MW
))
PI Controller
Fuzzy PI Controller
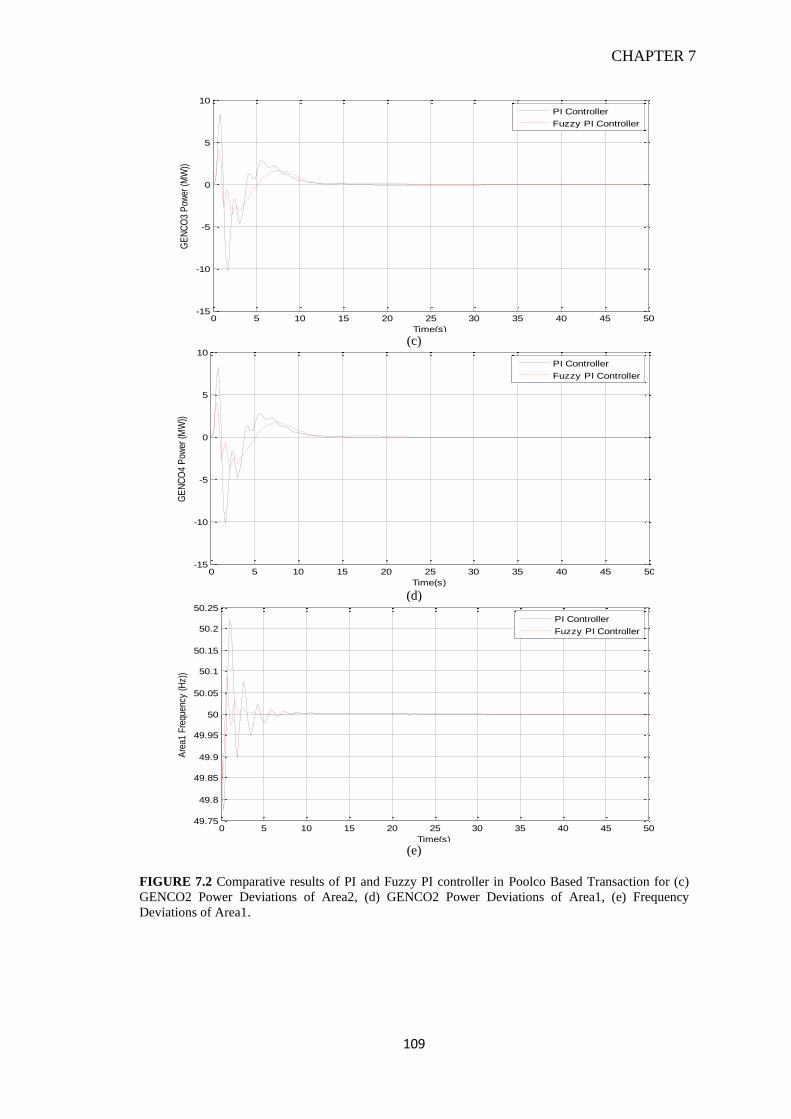
CHAPTER 7
109
(c)
(d)
(e)
FIGURE 7.2 Comparative results of PI and Fuzzy PI controller in Poolco Based Transaction for (c)
GENCO2 Power Deviations of Area2, (d) GENCO2 Power Deviations of Area1, (e) Frequency
Deviations of Area1.
0 5 10 15 20 25 30 35 40 45 50-15
-10
-5
0
5
10
Time(s)
GE
NC
O3
Pow
er (
MW
))
PI Controller
Fuzzy PI Controller
0 5 10 15 20 25 30 35 40 45 50-15
-10
-5
0
5
10
Time(s)
GE
NC
O4
Pow
er (
MW
))
PI Controller
Fuzzy PI Controller
0 5 10 15 20 25 30 35 40 45 5049.75
49.8
49.85
49.9
49.95
50
50.05
50.1
50.15
50.2
50.25
Time(s)
Are
a1 F
requ
ency
(H
z))
PI Controller
Fuzzy PI Controller

Price Based Automatic Generation Control Using Fuzzy-Based Grid Connected EVs
110
(f)
(g)
(h)
FIGURE 7.2 Comparative results of PI and Fuzzy PI controller in Poolco Based Transaction for
(f) Frequency Deviations of Area2, (g) UI Price Deviations of Area1, (h) UI Price Deviations of Area2.
0 5 10 15 20 25 30 35 40 45 5049.95
49.96
49.97
49.98
49.99
50
50.01
50.02
50.03
Time(s)
Are
a2 F
requ
ency
(H
z))
PI Controler
Fuzzy PI Controller
0 5 10 15 20 25 30 35 40 45 500
1000
2000
3000
4000
5000
6000
7000
Time(s)
Are
a1 U
I P
rice
(Rs/
Mw
h))
PI Controller
Fuzzy PI Controller
0 5 10 15 20 25 30 35 40 45 501200
1400
1600
1800
2000
2200
2400
2600
2800
Time(s)
Are
a2 U
I P
rice
(Rs/
Mw
h))
PI Controller
Fuzzy PI Controller

CHAPTER 7
111
(i)
FIGURE 7.2 Comparative results of PI and Fuzzy PI controller in Poolco Based Transaction for (i) Tie-
Line Flow.
7.4.2 Bilateral Market
The contract may get violated by a DISCO due to excess power demand. This excess
power is uncontracted with any GENCO. The GENCO has to supply the uncontracted
power of the same area. For visualization of a contract violation, an excess power of 10%
of demand by DISCO in area2 is considered. It is replicated in the area as a local load. It
is not the contract demand. So, there is no change in DPM elements. For the bilateral
transaction, the DPM is presented in (7.2). Here, the apf1=0.5, apf2=0.5, apf3=0.5 and
apf4=0.5 are considered.
𝐷𝑃𝑀 = [
0.5 0.25 0 0.30.2 0.25 0 00 0.25 1 0.70.3 0.25 0 0
] (7.2)
The load changes of 200 MW occurring in area1 and area2 is asuimed. Dynamic
behaviour in case of unexpected load changes by a comparative analysis of the PI
controller and Fuzzy PI Controller (FPC) of EV bidirectional charger is represented in
Fig. 7.3 (a) to (i). In Fig. 7.3 (a) to (d) the deviations in the GENCOs are shown. In Fig.
7.3 (e) and (f), since area1 have nonzero load demand, so momentary rise and fall of
frequency in area1 are larger than in area2. The deviations in the UI price (Rs/Mwh) are
presented in Fig. 7.3 (g) and (h). The tie-line flow is presented in Fig.7.3 (i). The
calculated values of generator power are presented in Table 7.3.
0 5 10 15 20 25 30 35 40 45 50-25
-20
-15
-10
-5
0
5
10
Time (s)
Tie
Lin
e F
low
(M
W)
PI Controller
Fuzzy PI Controller

Price Based Automatic Generation Control Using Fuzzy-Based Grid Connected EVs
112
TABLE 7.3 Calculated Power At GENCOs And Tie Line (Bilateral Transaction)
Change in Generation Tie
Line Unit G-1 G-2 G-3 G-4
MW 105 45 195 55 -50
(a)
(b)
(c)
0 5 10 15 20 25 30 35 40 45 500
20
40
60
80
100
120
Time(s)
GE
NC
O1
Pow
er (
MW
))
PI Controller
Fuzzy PI Controller
0 5 10 15 20 25 30 35 40 45 500
10
20
30
40
50
60
70
80
Time(s)
GE
NC
O2
Pow
er (
MW
))
PI Controller
Fuzzy PI Controller
0 5 10 15 20 25 30 35 40 45 500
50
100
150
200
250
Time(s)
GE
NC
O3
Pow
er (
MW
))

CHAPTER 7
113
FIGURE 7.3 Comparative results of PI and Fuzzy PI controller in Bilateral Transaction for (a) GENCO1
Power Deviations of Area1, (b) GENCO2 Power Deviations of Area1. (c) GENCO2 Power Deviations
of Area2.
(d)
(e)
(f)
FIGURE 7.3 Comparative results of PI and Fuzzy PI controller in Bilateral Transaction for (d)
GENCO2 Power Deviations of Area2, (e) Frequency Deviations of Area1, (f) Frequency Deviations of
Area2.
0 5 10 15 20 25 30 35 40 45 500
10
20
30
40
50
60
70
80
Time(s)
GE
NC
O4
Pow
er (
MW
))
PI Controller
Fuzzy PI Controller
0 5 10 15 20 25 30 35 40 45 5049.8
49.85
49.9
49.95
50
50.05
Time(s)
Are
a1 F
requ
ency
(Hz)
PI Controller
Fuzzy PI Controller
0 5 10 15 20 25 30 35 40 45 5049.8
49.85
49.9
49.95
50
50.05
50.1
50.15
50.2
Time(s)
Are
a2 F
requ
ency
(Hz)
PI Controller
Fuzzy PI Controller

Price Based Automatic Generation Control Using Fuzzy-Based Grid Connected EVs
114
(g)
(h)
(i)
FIGURE 7.3 Comparative results of PI and Fuzzy PI controller in Bilateral Transaction for (g) UI Price
Deviations of Area1, (h) UI Price Deviations of Area2. (i) Tie-Line Flow.
0 5 10 15 20 25 30 35 40 45 500
1000
2000
3000
4000
5000
6000
Time(s)
Are
a1 U
I P
rice(
Rs/
Mw
h)
PI Controller
Fuzzy PI Controller
0 5 10 15 20 25 30 35 40 45 500
1000
2000
3000
4000
5000
6000
Time(s)
Are
a2 U
I P
rice(
Rs/
Mw
h)
PI Controller
Fuzzy PI Controller
0 5 10 15 20 25 30 35 40 45 50-70
-60
-50
-40
-30
-20
-10
0
Time (s)
Tie
Lin
e F
low
(M
W)
PI Controller
Fuzzy PI Controller

CHAPTER 7
115
7.4.3 Bilateral Transaction with a Contract Violation
The contract may violate by DISCO due to excess power demand. This excess power is
uncontracted with any GENCO. The GENCO have to supply for the uncontracted power
of the same area. For visualization of a contract violation, Case 2 is considered with
excess power of 100 MW demanded by DISCO in Area2. It is indicated as a local load.
It is not the contract demand. So, there is no change in DPM elements. An overall load
deviation in the area I,(𝛥𝑃𝐿1,𝐿𝑂𝐶) = Load of DISCO1+ load of DISCO2= (100+100)+100
= 300 MW. Likewise, the total local load in area II = (DISCO3 + DISCO4) = 200 MW.
For EV bidirectional charger PI and FGPI controllers are considered for comparative
analysis. The comparative analysis by applying unexpected load is presented in Fig. 7.4(a)
to (i). Fig. 7.4 (a) to (d) presents the deviations in the GENCOs power. In Fig. 7.4 (e) and
(f), only area1 have nonzero load demand, so momentary rise and fall in area1 frequency
are larger than in area2. The deviations in the UI price (Rs/Mwh) are presented in Fig.
7.4 (g) and (h). There is no contract among the GENCOs and the DISCOs of the different
areas. So, the tie-line power is zero. The actual tie-line power is presented in Fig.7.4 (i).
Calculated values of generator power have been shown in Table 7.4.
Table 7.4 Calculated Power At GENCOs And Tie Line (Contract Violation)
Change in Generation Tie
Line
Unit G-1 G-2 G-3 G-4
MW 180 70 195 55 -50
(a)
FIGURE 7.4 Comparative results of PI and Fuzzy PI controller in Bilateral Transaction with contract
violation for (a) GENCO1 Power Deviations of Area1.
0 5 10 15 20 25 30 35 40 45 500
50
100
150
200
250
Time(s)
GE
NC
O1
Pow
er (
MW
))
PI Controller
Fuzzy PI Controller
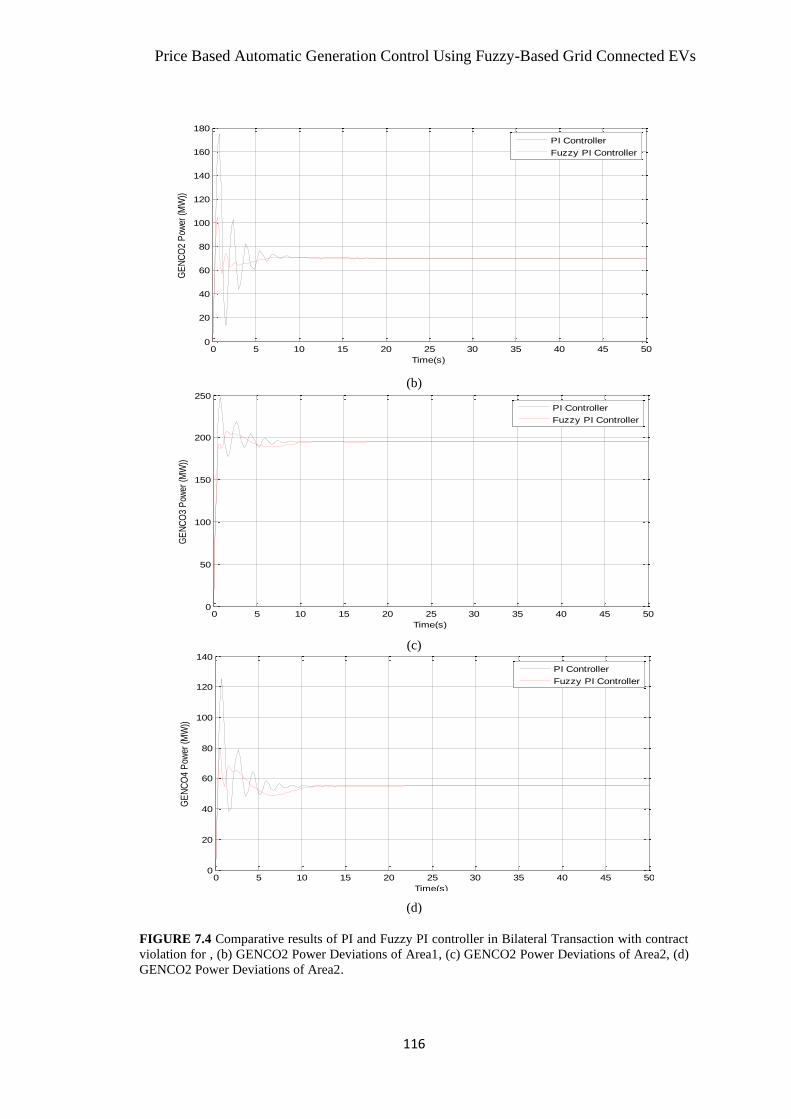
Price Based Automatic Generation Control Using Fuzzy-Based Grid Connected EVs
116
(b)
(c)
(d)
FIGURE 7.4 Comparative results of PI and Fuzzy PI controller in Bilateral Transaction with contract
violation for , (b) GENCO2 Power Deviations of Area1, (c) GENCO2 Power Deviations of Area2, (d)
GENCO2 Power Deviations of Area2.
0 5 10 15 20 25 30 35 40 45 500
20
40
60
80
100
120
140
160
180
Time(s)
GE
NC
O2
Pow
er (
MW
))
PI Controller
Fuzzy PI Controller
0 5 10 15 20 25 30 35 40 45 500
50
100
150
200
250
Time(s)
GE
NC
O3
Pow
er (
MW
))
PI Controller
Fuzzy PI Controller
0 5 10 15 20 25 30 35 40 45 500
20
40
60
80
100
120
140
Time(s)
GE
NC
O4
Pow
er (
MW
))
PI Controller
Fuzzy PI Controller

CHAPTER 7
117
(e)
(f)
(g)
FIGURE 7.4 Comparative results of PI and Fuzzy PI controller in Bilateral Transaction with contract
violation for (e) Frequency Deviations of Area1, (f) Frequency Deviations of Area2, (g) UI Price
Deviations of Area1.
0 5 10 15 20 25 30 35 40 45 5049.5
49.6
49.7
49.8
49.9
50
50.1
50.2
50.3
Time(s)
Are
a1 F
requ
ency
(Hz)
PI Controller
Fuzzy PI Controller
0 5 10 15 20 25 30 35 40 45 5049.75
49.8
49.85
49.9
49.95
50
50.05
50.1
50.15
Time(s)
Are
a2 F
requ
ency
(Hz)
PI Controller
Fuzzy PI Controller
0 5 10 15 20 25 30 35 40 45 500
1000
2000
3000
4000
5000
6000
7000
8000
9000
Time(s)
Are
a1 U
I P
rice(
Rs/
Mw
h)
PI Controller
Fuzzy PI Controller

Price Based Automatic Generation Control Using Fuzzy-Based Grid Connected EVs
118
(h)
(i)
FIGURE 7.4 Comparative results of PI and Fuzzy PI controller in Bilateral Transaction with contract
violation for (h) UI Price Deviations of Area2, (i) Tie-Line Flow (MW).
TABLE 7.5 Comparative Analysis of PI and FGPI integration
Cas
e
Controlle
r
Settling Time (s) Peak Overshoots No. of
Oscillations >50 Hz <50 Hz
Area1 Area2 Area1 Area2 Area1 Area2 Area
1
Area
2
F U
I F
U
I F
U
I F
U
I F UI F UI F UI F UI
1
PI 11 11 11 11 50.2
4 0
50.00
7 0
49.7
7
650
0
49.9
6
260
0 7 7 7 7
FGPI 5 5 10 10 50.0
8 0
50.00
1 0
49.8
5
500
0
49.9
8
220
0 5 5 6 6
2
PI 13 13 14 14 50.0
6 0 50.11 0
49.8
3
530
0
49.8
4
530
0 6 6 5 5
FGPI 10 10 10 10 50.0
5 0 50.05 0
49.8
3
530
0
49.8
6
500
0 5 5 4 4
3
PI 14 14 15 15 50.2 0 50.12 0 49.5
8 800
0 49.7
7 650
0 8 8 7 7
FGPI 12 12 10 10 50.0
5 0 50.07 0 49.7
780
0
49.8
5
490
0 8 8 4 4
0 5 10 15 20 25 30 35 40 45 500
1000
2000
3000
4000
5000
6000
7000
Time(s)
Are
a2 U
I P
rice(
Rs/
Mw
h)
PI Controller
Fuzzy PI Controller
0 5 10 15 20 25 30 35 40 45 50-80
-70
-60
-50
-40
-30
-20
-10
0
Time (s)
Tie
Lin
e F
low
(M
W)
PI Controller
Fuzzy PI Controller

CHAPTER 7
119
The above results are discussed in the following section.
Poolco Based Market
In case of PI controller for the power system operating under poolco based market, the
Area1 frequency operating range is 50.24 - 49.77 Hz (Fig. 7.2(e)) , the UI price operating
range is 0 - 6500 Rs/Mwh (Fig. 7.2(g)), no of oscillations in the frequency are 7 (Fig.
7.2(e)) and frequency settling time is 11 s (Fig. 7.2(e)). By using FGPI controller the
frequency operating range reduces to 50.08 - 49.98 Hz (Fig. 7.2(e)), the UI price
operating range reduces to 0 - 5000 Rs/Mwh (Fig. 7.2(g)), the no of oscillation in the
frequency are reduces 5 and frequency settling time reduces to 5 s (Fig. 7.2(e)). Similarly,
in Area2 with PI controller the frequency operating range 50.007 - 49.96 Hz (Fig. 7.2(f)),
the UI price operating range 0 - 2600 Rs/Mwh (Fig. 7.2(h)), no of oscillations are 7 (Fig.
7.2(f)) and frequency settling time is 11 s (Fig. 7.2(f)). By using FGPI controller the
frequency operating range reduces to 50.001 - 49.98 Hz (Fig. 7.2(f)), the UI price reduces
to 0 - 2200 Rs/Mwh (Fig. 7.2(h)), the no of oscillations are reduces to 10 (Fig. 7.2(f))
and frequency settling time reduces to 6 s (Fig.7.2(f)). By comparing the results of with
WT and with EV from the simulation and Table 7.5, better results achieved with EV for
reduction in an operating range of frequency, operating range of UI charges, frequency
settlement time and frequency oscillation.
Bilateral Market
In case of PI controller for the power system operating under bilateral market the Area1
frequency operating range is 50.06 - 49.83 Hz (Fig. 7.3(e)), the UI price operating range
is 0 - 5300 Rs/Mwh (Fig. 7.2(g)), no of oscillations are 13 (Fig. 7.3(e)) and frequency
settling time is 6 s (Fig. 7.3(e)). By using FGPI controller the frequency operating range
reduces to 50.04 - 49.86 Hz (Fig. 7.3(e)), the UI price operating range reduces 0 - 5000
Rs/Mwh (Fig. 7.3(g)), the no of oscillation in the frequency are reduces to 10 (Fig. 7.3(e))
and frequency settling time reduces to 5 s (Fig. 7.3(e)). Similarly, in Area2 with PI
controller the frequency operating range 50.007 - 49.96 Hz (Fig. 7.3(f)), the UI price
operating range 0 - 2600 Rs/Mwh (Fig. 7.3(h)), no of oscillations are 7 (Fig. 7.3(f)) and
frequency settling time is 11 s (Fig. 7.3(f)). By using FGPI controller the frequency
operating range reduces to 50.001 - 49.98 Hz (Fig. 7.3(f)), the UI price reduces to 0 -
2200 Rs/Mwh (Fig. 7.3(h)), the frequency settling time reduces to 10 (Fig. 7.3(f)) and

Price Based Automatic Generation Control Using Fuzzy-Based Grid Connected EVs
120
frequency settling time reduces to 6 s (Fig. 7.3(f)). By comparing the results of with WT
and with EV from the simulation and Table 7.5, better results achieved with EV for
reduction in an operating range of frequency, operating range of UI charges, frequency
settlement time and frequency oscillation.
Bilateral Market with Contract Violation
In case of PI controller for the power system operating under bilateral market with
contract violation, the Area1 frequency operating range is 50.4 - 49.58 Hz (Fig. 7.4(e)),
the UI price operating range is 0 – 8000 Rs/Mwh (Fig. 7.4(g)), no of oscillations are 8
(Fig. 7.4(e)) and frequency settling time is 14 s (Fig. 7.4(e)). By using FGPI controller
frequency operating range reduces to 50.02 - 49.58 Hz (Fig. 7.4(e)), the UI price
operating range reduces 0 - 7800 Rs/Mwh (Fig. 7.4(g)), the no of oscillation in the
frequency are reduces to 8 (Fig. 7.4(e)) and frequency settling time reduces to 5 s (Fig.
7.4(e)). Similarly, in Area2 with PI controller the frequency operating range 50.12 - 49.77
Hz (Fig. 7.4(f)), the UI price operating range 0 - 6500 Rs/Mwh (Fig. 7.4(h)), no of
oscillations are 7 (Fig. 7.4(f)) and frequency settling time is 15 s (Fig. 7.4(f)). By using
FGPI controller the frequency operating range reduces to 50.07 - 49.85 Hz (Fig. 7.4(f)),
the UI price reduces to 0 - 4900 Rs/Mwh (Fig. 7.4(h)), the no of oscillations are 4 (Fig.
7.4(f)) and frequency settling time reduces to 10 s (Fig. 7.4(f)). By comparing the results
of with WT and with EV from the simulation and Table 7.5, better results achieved with
EV for reduction in an operating range of frequency, operating range of UI charges,
frequency settlement time and frequency oscillation.
7.5 Conclusion
The bidirectional contract exists in restructured power system among the DISCOs and
GENCOs of different control areas. In the present IPS, the nature of RES is intermittent
in nature. It produces power fluctuations that add to the deviations caused by the load.
The deviations in the load result in frequency becoming unstable. From the study of
different kinds of literature, the power system needs storage for the stability of frequency.
The design of bidirectional charging control for EV to stabilize the frequency fluctuation
is proposed. Also, grid-connected RES is considered. By sending the LFC signal to all
EVs, the operator is able to manage the charging operation by taking care of the battery

CHAPTER 7
121
SOC level. EV can normalize the deviations in the frequency, generator power, tie-line
flow and UI price. An EV has tremendous advantage that it can work as a load and source.
For the operation of bidirectional charger, PI controllers are used. The PI controllers can
track the system changes. But against various working conditions of the grid, PI
controllers are not able to give optimal performance. Further efforts have been put to tune
PI parameters using fuzzy logic and comparative results have been obtained with PI and
with the fuzzy PI controller. From the results it is concluded that FGPI controller provided
better performance as compared to the PI controller.

122
CHAPTER 8
Summary, Conclusion and Future Scope
This chapter summarizes the work reported in this report, the major contribution and
some important conclusions. The scope for future work is also presented at the end of the
chapter.
8.1 The Original Contribution of the Thesis
The main contribution of the thesis is as follows,
1. Developed a mathematical model of two area restructured IPS by considering
thermal-thermal (non-reheat) and grid-connected wind turbine unit. It is simulated
under the different contracts between generating companies and distribution
companies, such as POOLCO based contract and Bilateral contract. The effect of 10
% load variation has also been studied.
2. Developed frequency to UI price block which will convert the frequency deviation
into the price. From the UI price calculated and from the marginal cost of generation,
GCE is calculated. Based on GCE, price based AGC) is performed.
3. Developed a mathematical model of grid-connected Electrical Vehicles (EVs) with
bidirectional charger. The bidirectional charger is applied to reduce the deviations in
frequency, amount of generator power and UI price. Moreover, the concept of LFC
signal is proposed to disperse all EVs by diversified transmission link through
aggregators followed by Area Requirement (AR).
4. The proposed method of aggregated EVs to regulate frequency and power deviation
is tested under Poolco based contract and Bilateral contract for peak hours and off-
peak hours. This work has shown that using this technique frequency and power
deviations are minimized.

CHAPTER 8
123
8.2 Conclusion
Based on the research work carried out it is observed that, sudden load variations and
variation in renewable power generation produce power imbalances in demand and
supply. This results in frequency deviations. This research work has resulted in a
unique solution that has minimized the deviation in the frequency as well as UI price
by load variation and renewable power generation. The dynamic storage (EV)
mechanism suggested in this research has given better solution to normalize the
frequency fluctuations in restructured IPS with the help of bidirectional charge
controller. For this analysis, a fleet of EVs has been considered under POOLCO based
contract and Bilateral contract during peak hours and off peak hours.
In the power system without RESs (Chapter 5), the improvement in the frequency
and UI price deviations due to a fleet of EVs are presented in Fig. 8.1.
FIGURE 8.1 Improved Results in Case of Without RESs.
In the power system with presence of PV system (Chapter 6), the improvement in the
frequency and UI price deviations due to a fleet of EVs are presented in Fig. 8.2
46.51
23.08
77.78
13.46
51.16
27.78
41.86
8.16
22.06
0
76.47
24.62
0
10
20
30
40
50
60
70
80
90
Frequency UI Charges Frequency UI Charges
Area 1 Area 2
Imp
rove
me
nt
in %
Pooclo Based Market
Bilateral Market
Bilateral Market withContract Violation

Summary, Conclusion and Future Scope
124
FIGURE 8.2 Improved Results in Case of With PV system.
In the power system with presence of WT (Chapter 6), the improvement in the
frequency and UI price deviations due to a fleet of EVs are presented in Fig. 8.3
FIGURE 8.3 Improved Results in Case of With WT.
In the power system without RESs (Chapter 7), the improvement in the frequency
and UI price deviations due to a fleet of EVs with FGPI controller are presented in
Fig. 8.4.
50
21.25
71.43
52.83
62.9
25 23.07 22.41
0
10
20
30
40
50
60
70
80
Frequency UI Charges Frequency UI Charges
Area 1 Area 2
Imp
rove
me
nt
in %
Pooclo Based Market
Bilateral Market
43.48
24.62
76.47
38.89
52.5
31.51
40.91
22.22
0
10
20
30
40
50
60
70
80
90
Frequency UI Charges Frequency UI Charges
Area 1 Area 2
Imp
rove
me
nt
in %
Pooclo Based Market
Bilateral Market

CHAPTER 8
125
FIGURE 8.4 Improved Results using FGPI Controller
Thus it has been found that the technique developed here lowers down the frequency
and power deviations as well as fluctuations in UI price.
8.3 Future Scope
In this thesis different method at generation, transmission and distribution area are
represented. These methods regulate the frequency to operate near 50 Hz and try to
minimize deviations and generation cost due to sudden load variation as well as power
of RESs. Some of the scopes for further investigations are as follows.
1. The research work has considered of the EV bidirectional charger development
for V2G and G2V operation in India. By developing the Battery Management
System (BMS), the bidirectional power transfer is possible after following the
battery SOC condition. The BMS also help to coordinate the number of EVs.
2. Because of high tariff rates in peak hours and low tariff rates during off-peak
hours, one can perform the financial analysis on charging and discharging of EV
with infrastructure development.
51.06
23.08
55.32
15.38
4.350
29.63
5.66
60.98
2.5
37.14
24.62
0
10
20
30
40
50
60
70
Frequency UI Charges Frequency UI Charges
Area 1 Area 2
Imp
rove
me
nt
in %
Pooclo Based Market
Bilateral Market
Bilateral Market withContract Violation

126
List of References
[1] A Dutta, S Debbarma, “Frequency regulation in deregulated market using vehicle-
to-grid services in residential distribution network”, IEEE Systems Journal, vol.12,
no. 3, pp. 2812-2820, 2017.
[2] A. A. El-Emary, & M. A. El-Shibina, “Application Of Static Var Compensation
For Load Frequency Control”, Electric Machines & Power Systems, vol.25, no.9,
pp.1009-1022, Doi: 10.1080/07313569708955793, May 2007.
[3] A. Demiroren, “Automatic Generation Control Using Ann Technique for Multi-
Area Power System with SMES Units”, Electric Power Components And Systems,
vol.32, pp.193-213, Doi: 10.1080/15325000490195989, Jun 2010.
[4] A. Feliachi, “Optimal Decentralized Load Frequency Control”, IEEE
Transactions On Power Systems, vol. 2, no. 2, May 1987.
[5] A. Khodabakhshian , R. Hooshmand, “A New PID Controller Design For
Automatic Generation Control Of Hydro Power Systems”, Electrical Power And
Energy Systems vol.32, pp.375–382, 2010.
[6] A. Kumar, O.P. Malik “Discrete Variable Structure Controller For Load Frequency
Control Of Multi Area Interconnected Power Systems”, IEEE Proceedings, vol.
134, no. 2, March, 1986.
[7] A. P. Bid,. A.T. Sapclt Jr,. CS Bzvcm, “An Enhanced Neural Network Load
Frequency Control Technique”, International Conference on Control - Control '94,
Doi:10.1049/cp:19940167,Mar 1994.
[8] A. Roy, S. A. Khaparde, P. Pentayya and S. Pushpa,” Operating Strategies for
Generation Deficient Power System,” Proceedings Of IEEE PES General
Meeting, San Francisco, USA, vol. 3, pp-2738-2745, June 2005.
[9] A. Sharifi, K. Sabahi, M. Aliyari Shoorehdeli, M.A. Nekoui, M. Teshnehlab,
“Load Frequency Control In Interconnected Power System Using Multi-Objective
PID Controller”, IEEE Conference On Soft Computing In Industrial Applications
(Smcia/08), Muroran, Japan,Doi: 10.1109/SMCIA.2008.5045963, Jun 2008.
[10] A.Demiroren, H.L.Zeynelgil, “GA application to optimization of AGC in three-
area power system after deregulation”, Electrical Power and Energy System, Vol.
29, no. 3, pp.230-240, 2007.

List of References
127
[11] A.M. Salamah, S.J. Finney and B.W. Williams, “Autonomous Controller For
Improved Dynamic Performance Of AC Grid, Parallel-Connected, Single-Phase
Inverters”, IET Gener. Transm. Distrib., vol.2, no.2 , pp. 209 - 218, 2008.
[12] A.P.Gupta and J.Sathaye,” Electrifying India”, IEEE Power and Energy Magazine,
vol.7, no.5, pp-53-61, Sept/Oct 2009.
[13] A.T. Al-Awami and E. Sortomme, “ Coordinating vehicle to grid services with
energy trading”, IEEE Transaction of Smart Grid, vol. 3, no. 1, pp. 453-462, March
2012.
[14] Adel Abdennour, “Adaptive Optimal Gain Scheduling For The Load Frequency
Control Problem”, Electric Power Components And Systems, vol.30:1, pp.45-56,
DOI: 10.1080/153250002753338391, Nov.2010.
[15] Ahmed M. Kassem, “Neural Predictive Controller Of A Two-Area Load
Frequency Control For Interconnected Power System”, Ain Shams Engineering
Journal, vol.1, pp.49-58, Doi:10.1016/J.Asej.2010.09.006, 2010.
[16] Akie Uehara, Tomonobu Senjyu, “A Frequency Control Method By Wind Farm
& Battery Using Load Estimation In Isolated Power System”, International Journal
Of Emerging, Electric Power Systems, vol.11, no.2 Article 2, 2010.
[17] Ali Feliachi, “On The Control Of Re-Structured Electric Power Systems”,
International Journal Of Control, Automation, And Systems, vol. 3, No. 2 (Special
Edition), pp. 363-375, June 2005.
[18] Ali Keyhani, Abir Chatterjee, “Automatic Generation Control Structure For Smart
Power Grids”, IEEE Transactions On Smart Grid, vol.3, no.3, Sep 2012.
[19] Amin Safari, Farshad Babaei &Meisam Farrokhifar, “A load frequency control
using a PSO-based ANN for micro-grids in the presence of electric vehicles”,
International Journal of Ambient Energy, Doi: 10.1080/01430750.2018.1563811,
Jan 2019.
[20] Aniruddha Paradkar , Asad Davari , Ali Feliachi , Tamal Biswas , “Integration Of
A Fuel Cell Into The Power System Using An Optimal Controller Based On
Disturbance Accommodation Control Theory”, Journal Of Power Sources, vol.
128, pp.218–230, 2004.
[21] Anita Singh, Manoj Jha, M.F. Qureshi, “Design Of Genetically Tuned Interval
Type-2 Fuzzy PID Controller For Load Frequency Control (LFC) In The

List of References
128
Unregulated Power System”, IJISET - International Journal Of Innovative
Science, Engineering & Technology, vol.1 no.5, Jul 2014.
[22] Anjart Bose Ilyas Atiyyah, “Regulation Error In Load Frequency Control”, IEEE
Transactions On Power Apparatus And Systems, vol.PAS-99, no.2, pp. 650 – 657,
Mar 1980.
[23] Aqeel S. Jaber , A.Z. Ahmad , Ahmed N Abdalla, “An Investigation Of Scaled-
FLC Using PSO For Multi-Area Power System Load Frequency Control”, Energy
And Power Engineering, vol.5, pp.458-462 Doi:10.4236/Epe.2013.54B088, July
2013.
[24] Arman Oshnoei, Rahmat Khezri, S. M. Muyeen, Soroush Oshnoei &Frede
Blaabjerg, “Automatic Generation Control Incorporating Electric Vehicles, Doi:
10.1080/15325008.2019.1579270, Jun 2019.
[25] Ashraf Mohamed Hemeida, “A Fuzzy Logic Controlled Superconducting
Magnetic Energy Storage, SMES Frequency Stabilizer”, Electric Power Systems
Research vol.80, pp.651–656, 2010.
[26] Aswin N. Venkat, Ian A. Hiskens, “Distributed MPC Strategies With Application
To Power System Automatic Generation Control”, IEEE Transactions On Control
Systems Technology, vol.16 , no. 6 Doi: 10.1109/Tcst.2008.919414, Dec 2008.
[27] Aysen Demiroren, Neslihan S. Sengor and H. Lale Zeynelgil, “Automatic
Generation Control By Using ANN Technique”, Electric Power Components And
Systems, vol.29, no.10, pp. 883-896, Nov 2010.
[28] B. Delfino, F. Fornari And S. Massucco, “Load-Frequency Control And
Inadvertent Interchange Evaluation In Restructured Power Systems”, IEEE Proc.
Gen. Trans. Dist., vol. 149, no. 5, Sept 2002.
[29] B.Bhushan, “ ABC of ABT”: A Primer on Availability Based Tariff”, June 2005.
[30] Balarko Chaudhuri, Bikash C. Pal, Argyrios C. Zolotas, Imad M. Jaimoukha, And
Tim C. Green, “Mixed-Sensitivity Approach To Hinf Control Of Power System
Oscillations Employing Multiple Facts Devices”, IEEE Transactions On Power
Systems, vol. 18, no. 3, Aug 2003.
[31] Banaja Mohanty, Sidhartha Panda, P.K. Hota, “Controller Parameters Tuning Of
Differential Evolution Algorithm And Its Application To Load Frequency Control
Of Multi-Source Power System”, Electrical Power And Energy Systems vol.54,
pp.77–85, 0142-0615, 2014.

List of References
129
[32] Ben Oni, Huber Graham, Lewis Walker, “Investigation Of Nonlinear Tie Line Bias
Control Of Interconnected Power Systems”, IEEE Transactions On Power
Apparatus And Systems, vol. PAS-100, no. 5, May 1981.
[33] Bjorn H. Bakken And Ove S. Grande, “Automatic Generation Control In A
Deregulated Power System”, IEEE Transactions On Power Systems, vol. 13, no.
4, November 1998.
[34] Brito AV, Molina MG. Chapter 4: Dynamic modelling and control design of
advanced energy storage for power system applications, 2010.
[35] C. Concordia and L.K. Kirchmayer, “Tie-Line Power and Frequency control of
Electric Power Systems”, Transactions of the AIEE Part III, Power Apparatus and
Systems, vol.72, no.2, pp.562-572, June 1953.
[36] C. F. Juang And C.-F. Lu, “Load-Frequency Control By Hybrid Evolutionary
Fuzzy PI Controller”, IEEE Proc. Gener. Transm. Distrib., vol. 153, no. 2, March
2006.
[37] C. S. Chang A ,Weihul FU A & Fushuan WEN, “Load Frequency Control Using
Genetic Algorithm Based Fuzzy Gain Scheduling Of PI Controllers”, Electric
Machines & Power Systems, vol.26:1, pp.39-52, DOI:
10.1080/07313569808955806, May 2007.
[38] C. S. Indulkar & Baldev Raj, “Application Of Fuzzy Controller To Automatic
Generation Control, Electric Machines & Power Systems”, vol.23, no.2, pp.209-
220, DOI: 10.1080/07313569508955618, April,2007.
[39] C.D.White and K.M.Zhang,“ Using vehicle-to-grid technology for frequency
regulation and peak-load reduction,” J.Power Sources, vol.196, no.8, pp.3972-
3980, 2011.
[40] C.E Fosha and O.I Elgerd, “Optimum megawatt-frequency control of multi area
electric energy System,” IEEE Transactions On Power Apparatus and Systems,
vol.PAS-89, pp.556-563, April 1970.
[41] C.E Fosha and O.I Elgerd,” The megawatt- frequency control of problem: A New
Approach via Optimal Control Theory,” IEEE Transactionss Power Appartus&
Systems, vol.PAS-89, no.4, pp.563-577, Apr 1970.
[42] C.F.Juang And C.-F. Lu, “Load-Frequency Control By Hybrid Evolutionary Fuzzy
PI Controller”, IEE Proc.-Gener. Transm. Distrib., vol.153, no. 2, Doi:10.1049/Ip-
Gtd:20050176, March 2006.

List of References
130
[43] C.S. Chang , Weihui Fu, “Area Load Frequency Control Using Fuzzy Gain
Scheduling Of PI Controllers”, Electric Power Systems Research, pp.145-152,
S.A. PII SO378-7796, 1997.
[44] C.Wu, H.M.Rad, J.Huang and J.Jatskevich, “PEV-based combined frequency and
voltage regulation for smart grid,” in Proc. Rec.IEEE Power Energy Syst.
Innovative Smart Grid Tech. Conf., Jan 2012.
[45] Carton J.G and Olabi A.G,” A Wind/Hydrogen Hybrid Systems: Opportunity for
Ireland’s Wind Resource to Provide Consistent Sustainable Energy Supply”,
Energy, vol.35. no.12, 2010.
[46] Catalina Spataru, Yen Chunga Kok, Mark Barrett, “Physical Energy Storage
Employed Worldwide”, Energy Procedia vol.62, pp.452-461, 2014.
[47] Central Electricity Authority, Load Generation Balance Report 2010-11, CEA,
New- Delhi, 2010. See also: http://cea.nic.in/reports/yearly/lgbr_report.pdf.
[48] Central Electricity Regulatory Commision, india Report, 2016.
[49] Chanana, S., Kumar, A, “A price based automatic generation control using
unscheduled interchange price signals in indian electricity system”, Int. J. Eng. Sci.
Technol. vol.2, no.2, pp.23-30, 2010.
[50] Changling Luo, Hamed Golestani Far, “Estimation Of Wind Penetration As
Limited By Frequency Deviation”, IEEE Transactions On Energy Conversion,
vol.22, no.3, Sep 2007.
[51] Charlies S E. Fosha, Olle I. Elgerd, “The Megawatt-Frequency Control Problem:
A New Approach Via Optimal Control Theory”, IEEE Transactions On Power
Apparatus And Systems, vol.PAS-89, no.4, pp. 563-577, April, 1970.
[52] Chen H, Cong TN, Yang W, Tan C, Li Y and Ding Y, “Progress in electrical
energy storage system: a critical review”. Prog Nat Sci. vol.19, pp.291-312, 2009.
[53] Chia-Feng Hang And Chun-Feng Lu, “Power System Load Frequency Control
With Fuzzy Gain Scheduling Designed By New Genetic Algorithms “,Doi:
10.1109/FUZZ.2002.1004961, May 2002.
[54] Chia‐Feng Juang & Chun‐Feng Lu, “Power System Load Frequency Control By
Genetic Fuzzy Gain Scheduling Controller”, Journal Of The Chinese Institute Of
Engineers, vol.28, NO.6, pp.1013-1018, DOI: 10.1080/02533839.2005.9671077,
Mar 2011.

List of References
131
[55] Chnstopher A, L. Womiak, P. “Hydro generator System Identification Using A
Simple Genetic Algorithm”, IEEE Transactions On Energy Conversion, vol. 12,
no. 1, 0885-8969/97, Mar 1997.
[56] Chuan-Ke Zhang, L. Jiang, Q. H.Wu, “Delay-Dependent Robust Load Frequency
Control For Time Delay Power Systems”, IEEE Transactions on Power
Systems, vol.28, no.3 , pp.2192 - 2201 Aug.2013.
[57] Chun-Feng Lu Chun-Chang Liu, Chi-Jui Wu, “Effect Of Battery Energy Storage
System On Load Frequency Control Considering Governor Deadband And
Generation Rate Constraint”, IEEE Transactions On Energy Conversion, vol.10,
no. 3, Sep 1995.
[58] Corey D. White, K. Max Zhang, “Using Vehicle-To-Grid Technology For
Frequency Regulation And Peak-Load Reduction”, Journal Of Power Sources,
vol.196, no.8, pp.3972-3980, Apr 2011.
[59] D. J. Lee and L. Wang, "Small-signal stability analysis of an autonomous hybrid
renewable energy power generation/energy storage system part I: Time-domain
simulations," IEEE Trans. Energy Conversion., vol. 23, no. 1, pp. 311-320, 2008.
[60] D. Kottick M. Blau D. Edelstein, “Battery Energy Storage For Frequency
Regulation In An Island Power System”, IEEE Transactions On Energy
Conversion, vol.8, no.3, Sep 1993.
[61] D. Lew, G. Brinkman, N. Kumar, P. Besuner, D. Agan and S. Lefton," Impacts of
wind and solar on emissions and wear and tear of fossil-fueled generators," IEEE
PESGM, 978-1-4673-2729-9, pp. 1-8, 2012.
[62] D.H. Curtice, T.W. Reddoch, “An Assessment Of Load Frequency Control
Impacts Caused By Small Wind Turbines”, IEEE Transactions On Power
Apparatus And Systems, vol. Pas-102, no.1, Jan 1983.
[63] D.K. Chaturvedi,, P.S. Satsangi, P.K. Kalra,”Load Frequency Control: A
Generalized Neural Network Approach”, Electrical Power And Energy Systems,
vol.21, pp.405–415, PII: S0142-0615(99)00010-1, 1999.
[64] Daniele Menniti, Anna Pinnarelli, Nadia Scordino, Nicola Sorrentino, “Using A
Facts Device Controlled By A Decentralised Control Law To Damp The Transient
Frequency Deviation In A Deregulated Electric Power System”, Electric Power
Systems Research vol.72, pp.289–298, 2004.

List of References
132
[65] Deepthi Karun, Sindhu T.K, “Fuzzy Logic Based Load Frequency Control of Grid
Connected Distributed Generators”, International Conference on Technological
Advancements in Power and Energy (TAP Energy), Doi:
10.1109/TAPENERGY.2015.7229658, Jun 2015.
[66] Devika Jay, K. S. Swarup, “Frequency Restoration Using Dynamic Demand
Control Under Smart Grid Environment”, ISGT2011-India, Doi: 10.1109/ISET-
India.2011.6145408, Dec 2011.
[67] Diambomba, HyacintheTungadio, YanxiaSun,” Load frequency controllers
considering renewable energy integration in power system”, Energy Reports,
vol.5, pp.436-453, Nov 2019.
[68] Diaz-Gonzalez F. et al, “A Review of Energy Storage Technologies for Wind
Power Applications, Renewable and Sustainable Energy Reviews. vol. 16, 2012.
[69] Dong L, Zhang Y, Gao Z, “A Robust Decentralized Load Frequency Controller
For Interconnected Power Systems”, ISA Transaction, vol.51, no.3, pp.410-419,
May 2012.
[70] Dong-Jing Lee and Li Wang, “Small-Signal Stability Analysis Of An Autonomous
Hybrid Renewable Energy Power Generation/Energy Storage System Part I: Time-
Domain Simulations”, IEE Transactions On Energy Conversion, vol. 23, no. 1,
March 2008.
[71] Dulpichet Rerkpreedapong, “Robust Load Frequency Control Using Genetic
Algorithms And Linear Matrix Inequalities”, IEEE Transactions On Power
Systems, vol.18, no 2, May 2003.
[72] Duncan S. Callaway and Ian A. Hiskens, "Achieving Controllability of Electric
Loads", Proceedings of the IEEE, vol. 99, no.1, January 2011.
[73] E Rakshani, J Sahed, “Load Frequency Control Of Multi Area Restructured Power
System”, IEEE POWERCON 2008 & 2008 IEEE Power India Conference, DOI:
10.1109/ICPST.2008.4745224,Oct 2008.
[74] E.S. Ali, S.M. Abd-Elazim, “Bacteria Foraging Optimization Algorithm Based
Load Frequency Controller For Interconnected Power System”, Electrical Power
And Energy Systems, vol.33, pp.633–638, Doi:10.1016/J.Ijepes.2010.12.022,
2011.
List of References
133
[75] Ela, E; Kirby, B; Navid, N; Smith, J.C. “Effective ancillary services market design
on high wing power penetration system” Power and Energy Society General
Meeting, IEEE, pp.1-8, 2012.
[76] Electrical energy storage: a white paper. Technical report. Prepared by electrical
energy storage project team, International Electrotechnical Commission (IEC),
Published, http://www.iec.ch, December 2011.
[77] Elyas Rakshamin, J Sadeh, “Simulation Of Two Area AGC System In A
Competitive Environment Using Reduce Order Observer Method”, 5th
International Conference on the European Electricity Market,
10.1109/EEM.2008.4579082, Jul 2008.
[78] Emilia Nobile, Anjan Bose, Kevin Tomsovic, “Bilateral Market For Load
Following Ancillary Services”, 2000 Power Engineering Society Summer
Meeting, Doi:10.1109/PESS.2000.867437, Jul 2000.
[79] EPRI, “Electricity Energy Storage Technology Options: A White Paper Primer on
Applications, Costs and Benefits”, Electric Power Research Institute, 2009.
[80] Ertugrul CAM İlhan Kocaarslan, Turkey, “Load-Frequency Control In Two Area
Power System”, Teknoloji, vol.7, no.2, pp.197-203, 2004.
[81] Ertugrul Cam, Ilhan Kocaarslan, “Load Frequency Control In Two Area Power
Systems Using Fuzzy Logic Controller, Energy Conversion And Management”,
vol.46, pp.233–243, ELSEVIER, 2005.
[82] F. Daneshfar H. Bevrani, “Load Frequency Control: A Ga-Based Multi-Agent
Reinforcement Learning”, ISSN 1751-8687, IET Gen. Trans. Dist., vol.4, pp. 13-
26, Doi: 10.1049/IET-GTD.2009.0168, 2013. 2-156.
[83] F. Katiraei, M. R. Iravani, “Power Management Strategies For A Microgrid With
Multiple Distributed Generation Units”, IEEE Transactions On Power Systems,
vol. 21, no. 4, Nov 2006.
[84] F. Michael Hughes, Olimpo Anaya Lara, “Control Of DFIG Based Wind
Generation For Power Network Support”, IEEE Transactions On Power Systems,
vol.20, no.4, Nov 2005.
[85] Faruk A. Bhuiyan and Amirnaser Yazdani.” Energy storage technologies for grid-
connected and off-grid power system applications,” IEEE EPEC, 978-14673-
2080-1, pp. 303-310, 2013.

List of References
134
[86] Fatemeh Daneshfar , Hassan Bevrani, “Multi Objective Design Of Load Frequency
Control Using Genetic Algorithms”, Electrical Power And Energy Systems vol.42,
pp.257–263, 2012.
[87] Fatemeh Daneshfar, “Intelligent Load-Frequency Control In A Deregulated
Environment: Continuous-Valued Input, Extended Classifier System Approach”,
ISSN 1751-8687, IET Gen. Trans. Dist., vol. 7, pp. 551–559, Doi: 10.1049/Iet-
Gtd.2012.0478, 2013.
[88] Fransoise Beaufays, Youssef Abdel Magid And Bernrd Widrow, “Application Of
Neural Networks To Load-Frequency Control In Power Systems”, Neural
Networks, vol.7, ISS.1, pp.183-194, 1994.
[89] G. Fujita, Shirai, “Automatic Generation Control For Dc-Link Power System”,
IEEE/PES Transmission and Distribution Conference and Exhibition,
Doi:10.1109/TDC.2002.1176835, Oct.2002.
[90] G. Mallesham, “Automatic Generation Control Of Microgrid Using Artificial
Intelligence Techniques”, in 2012 IEEE Power and Energy Society General
Meeting,Doi: 10.1109/PESGM.2012.6345404, Jul 2012.
[91] G. Mallesham, S. Mishra, “Ziegler-Nichols Based Controller Parameters Tuning
For Load Frequency Control In A Microgrid”, International Conference on
Energy, Automation and Signal Doi:10.1109/ICEAS.2011.6147128, Dec 2011.
[92] G. R. Hareekaanth, S. Balamurugan, “Analysis and implementation of Load
frequency controller for deregulated power system”, 2016 Biennial International
Conference on Power and Energy System, 10.1109/PESTSE.2016.7516507, Jul
2016.
[93] Gahleitner G, “Hydrogen from Renewable Electricity: An International Review of
Power-to-Gas Pilot Plants for Stationary Applications”, International Journal of
Hydrogen Energy 38, 2013.
[94] Gargi K., Niladri C., Kamal K M. “Unscheduled Interchange (UI) Price Based
Secondary Frequency Control of an Interconnected Hybrid Power System”, IEEE
INDICON, 978-1-4799-5364-6, Dec 2014.
[95] Gil A et al, “State of the Art on High-Temperature Thermal Energy Storage for
Power Generation. Part 1- Concepts, Materials and Modellization”. Renewable
and Sustainable Energy Reviews vol.14, no.1, 2010.

List of References
135
[96] Gillian Lalor, Alan Mullane, “Frequency Control And Wind Turbine
Technologies”, IEEE Transactions On Power Systems, vol.20, no.4, Nov 2005.
[97] Giuseppe Dell Olio, Marino Sforna, Carlo Bruno, And Massimo Pozzi, “A
Pluralistic LFC Scheme For Online Resolution Of Power Congestions Between
Market Zones”, IEEE Transactions On Power Systems, vol.20, no.4, 0885-
8950/2005, Nov 2005.
[98] Goro Shim, “Load Frequency Control Using Lyapunov's Second Method: Bang-
Bang Control Of Speed Changer Position”, Proceedings Of The IEEE, vol.67,
no.10, Oct 1979.
[99] Goro Shirai, “Load Frequency Sampled-Data Control Via Lyapunov’s Second
Method”, vol.69, ISS.1, pp. 129 – 130, Jan. 1981.
[100] Goro Shirai,“Load Frequency Control Using A Governor And Voltage Controls
Via A New Approach”, IEEE Proceedings, vol. 66, no. 10, October, 1978.
[101] Goshaidas Ray A, A.N. Prasad B, G.D. Prasad, “A New Approach to the Design
Of Robust Load-Frequency Controller, For Large Scale Power Systems”, Electric
Power Systems Research, vol.51, pp.13-22, 1999.
[102] H. Bevrani, A. Ghosh, G. Ledwich, “Renewable Energy Sources And Frequency
Regulation: Survey And New Perspectives”, ISSN 1752-1416, IET Renew. Power
Gen., vol. 4, ISS.5, pp.438-457, Doi: 10.1049/Iet-Rpg.2009.0049, 2010.
[103] H. G. Kwatny K. C. Kalnitsky A. Bhatt, “An Optimal Tracking Approach To Load
Frequency Control”, IEEE Transactions On Power Apparatus And Systems, vol.
PAS-94, no. 5, Sep 1975.
[104] H. J. Kunisch, K. G. Kramer And H. Dominik, "Battery Energy Storage Another
Option For Load-Frequency-Control And Instantaneous Reserve," Ieee
Transactions On Energy Conversion, vol.Ec-1, no.3, pp.41- 46, Jan 2009.
[105] H. Liu, Z. Hu, Y. Song, J. Wang, and X. Xie, “Vehicle-to-grid control for
supplementary frequency regulation considering charging demands,” IEEE Trans.
Power Syst., vol. 30, no. 6, pp. 3110–3119, Nov 2015.
[106] H. Shayeghi, H.A. Shayanfar, A. Jalili, “LFC Design Of A Deregulated Power
System With TCPS using PSO”, International Journal Of Electrical And
Electronics Engineering vol.3, no.10, pp. 632-640, 2009.

List of References
136
[107] H. Shayeghi, H.A. Shayanfar, O.P.Malik, “Robust Decentralized Neural Networks
Based LFC in a Deregulated Power System”, Electric Power System Research,
vol. 77, pp.241-251, 2007.
[108] H.-J. Kunisch, K.G. Kramer, H. Dominik, “Battery Energy Storage Another
Option For Load-Frequency-Control And Instantaneous Reserve”, IEEE
Transactions On Energy Conversion, vol.EC-1, no.3, Sep 1986.
[109] Hadi Banakar, Changling Luo, Boon Teck Ooi, “Impacts Of Wind Power Minute-
To-Minute Variations On Power System Operation”, IEEE Transactions On Power
Systems, vol.23, no.1, pp.0885-8950, Feb 2008.
[110] Haisheng Chen and Thang Ngoc Cong et al, “Progress in Electrical Energy Storage
System: A Critical Review Progress in Natural Science 19, 2009.
[111] Hao Huang, Fangxing Li, “Sensitivity Analysis Of Load-Damping Characteristic
In Power System Frequency Regulation”, IEEE Transactions On Power Systems,
vol. 28, no. 2, 0885-8950, May 2013.
[112] Hasan, N. Ibraheem & Samiuddin Ahmad.: ABT based load frequency control of
interconnected power system. Electr. Power Compon. Syst. Vol.44, no.8, pp.853–
863, 2016.
[113] Hassan Bevrani, “A New Intelligent Agent-Based AGC Design With Real-Time
Application”, IEEE Transactions on Systems, Man, and Cybernetics, vol.42, no.6,
pp.994-1002, Nov. 2012.
[114] Hassan Bevrani, “An Intelligent Droop Control For Simultaneous Voltage And
Frequency Regulation In Islanded Microgrids”, IEEE Transactions on Smart
Grid, vol.4, no.3, pp. 1505-1513, Sept. 2013.
[115] Hassan Bevrani, “Fuzzy Logic-Based Load-Frequency Control Concerning High
Penetration Of Wind Turbines”, IEEE Systems Journal, vol.6, no.1, Mar 2012.
[116] Hassan Bevrani, “Robust Load Frequency Controller In A Deregulated
Environment: A U-Synthesis Approach”, IEEE International Conference on
Control Applications, Doi: 10.1109/CCA.1999.806723, Aug 1999.
[117] Hassan Bevrani, Takashi Hiyama, “On Load–Frequency Regulation With Time
Delays:Design And Real-Time Implementation”, IEEE Transactions On Energy
Conversion, vol.24, vo.1, Mar 2009.
List of References
137
[118] Hassan Bevrani, Takashi Hiyama, Yasunori Mitani, “Automatic Generation
Control: A Decentralized Robust Approach”, Intelligent Automation And Soft
Computing”, vol. 13, no. 3, pp. 273-287, 2007.
[119] Hector Chavez, Ross Baldick, “Regulation Adequacy Analysis under High Wind
Penetration Scenarios In Ercot Nodal”, IEEE Transactions On Sustainable Energy,
vol. 3, no.4, pp.1949-3029, Oct 2012.
[120] Hellendoorn, H. and C. Thomas, “Defuzzification in fuzzy Controller”, Intelligent
and Fuzzy Systems, vol.1, pp. 109-123, 1993.
[121] Hieu Trinh, Tyrone Fernando, “Quasi-Decentralized Functional Observers For
The LFC Of Interconnected Power Systems”, IEEE Transactions On Power
Systems, vol. 28, no. 3, 0885-8950/ 2013, August 2013.
[122] Hiroshi, Yoichi, “Influence Of Photovoltaic Power Generation On Required
Capacity For Load Frequency Control”. IEEE Transactions On Energy
Conversion, vol. 11, no. 1, Mar 1996.
[123] Hossein Shayeghi - Heidar Ali Shayanfar, “Design Of Decentralized Robust Lfc
In A Competitive Electricity Environment”, Journal Of Electrical Engineering,
vol. 56, no. 9-10, pp.225–236, 2005.
[124] Huang Chao-Hui Zhang Xiao-Gang Yao Xin-Li, “A Method For Micro-Gird
Automatic Generation Control”, International Conference on Electronics,
Communications and Control (ICECC), Doi: 10.1109/ICECC.2011.6067563, Sep
2011.
[125] Hui Liu, Zechun Hu, Yonghua Song, Jianhui Wang and Xu Cie,” Vehicle-to-grid
control for supplementary frequency regulation considering charging demands,”
IEEE transactions on power system, vol. 30 no. 6, pp. 3110-3119, 2015.
[126] I Braheem, Kumar P, Hassan N, Nizamuddin, “Sub-Optimal Automatic
Generation Control Of Interconnected Power System Using Output Vector
Feedback Control Strategy”, Electric Power Componenets and Systems, vol.40,
no.9, pp. 977-994, Jun 2012.
[127] I. S ̧ Erban*, C. Marinescu, “Aggregate Load-Frequency Control Of A Wind-
Hydro Autonomous Micro grid”, Renewable Energy vo.36, pp.3345-3354, 2011.
[128] I.A. Chidambaram And, B. Paramasivam, “Genetic Algorithm Based
Decentralized Controllerfor Load- Frequency Control Of Interconnected Power
List of References
138
Systems With RFB Considering TCPS In The Tie-Line”, International Journal Of
Electronic Engineering Research, vol.1, no.4, pp.299–312, 2009.
[129] I.A. Chidambaram, B. Paramasivam, “Control Performance Standards Based
Load-Frequency Controller Considering Redox Flow Batteries Coordinate With
Interline Power Flow Controller”, Journal Of Power Sources, vol.219,pp.292-304,
2012.
[130] Ice Energy, 2013, Ice Bear Energy Storage System. Available at: http://www.ice-
energy.com/ice-bear-energy- storage system, Accessed 03.09.13.
[131] Ignacio Egido, Fidel Fernández-Bernal, And Luis Rouco, “The Spanish AGC
System: Description And Analysis, IEEE Transactions On Power Systems”, vol.
24, no.1, 0885-8950, Feb 2009.
[132] Indian power system becomes largest operating synchronous grid in the world. The
Times of India. Retrieved 2 December 2016.
[133] Isha Garg,“Multi-Area Load Frequency Control Implementation In Deregulated
Power System”, International Journal Of Soft Computing And Engineering
(IJSCE) , , vol.2, no.2, pp.183-187, May 2012.
[134] Issarachai Ngamroo, Yasunori Mitani And Kiichiro Tsu Ji, “Application Of SMES
Coordinated With Solid-State Phase Shifter To Load Frequency Control”, IEEE
Transactions On Applied Superconductivity, vol.9, no.2, June 1999.
[135] J. Axsen and K.S.Kurani, “Anticipating plug-in hybrid vehicle energy impacts in
California: Construction consumer-informed recharge profiles”, Transp. Res. Part
D: Trans. Environ., vol.15, no.4, pp.221-219, 2010.
[136] J. Axsen, K. S. Kurani R. Mc Carthy and C.Yang,“ PHEV GHG impacts in
California: Integrating consumer-informed recharge profiles with an electricity-
dispatch model, Energy Policy, vol.39, no.3, pp.1617-1629, 2011.
[137] J. Larmine and J. Lowry, “ Electric Vehicle Technology Explained”, New York,
Wiley, 2003.
[138] J. Lee and L. Wang, "Small-signal stability analysis of an autonomous hybrid
renewable energy power generation/energy storage system part I: Time-domain
simulations," IEEE Trans. Energy Convers., vol. 23, no. 1, pp. 311-320, 2008.
[139] J.Tomic and W. Kempton,“ Using fleets of electric-drive vehicles for grid
support,” J.Power Sources, vol.168, no.2, pp.459-468, June 2007.
List of References
139
[140] Janaka Ekanayake And Nick Jenkins, “Comparison Of The Response Of Doubly
Fed And Fixed-Speed Induction Generator Wind Turbines To Changes In Network
Frequency”, IEEE Transactions On Energy Conversion, vol. 19, no. 4, Dec 2004.
[141] Janardan Nanda, S. Mishra, Lalit Chandra Saikia, “Application Of Bacterial
Foraging-Based Optimization Technique In Multiarea Automatic Generation
Control”, IEEE Transactions On Power Systems, vol. 24, no.2, 0885-8950, May
2009.
[142] Jawad Talaq And Fadel Al-Basri, “Adaptive Fuzzy Gain Scheduling For Load
Frequency Control, IEEE Transactions On Power Systems”, vol.14, no.1, February
1999.
[143] Jayant Kumar, Kah-Hoe Ng, “AGC Simulator For Price-Based Operation”, IEEE
Transactions On Power Systems, vol. 12, no. 2, May 1997.
[144] Jiangen L, Yao W, Wu Q H, Wen JY, Cheng S J, “Delay-Dependent Stability For
Load Frequency Control With Constant And Time-Varying Delays”, IEEE
Transactions On power systems; vol.27, no.2, 2012.
[145] Jonglak Pahasa And Issarachai Ngamroo, “PHEVs Bidirectional
Charging/Discharging And Soc Control For Microgrid Frequency Stabilization
Using Multiple MPC”, IEEE Transactions On Smart Grid, vol.6, no.2, pp.526-533,
Mar 2015.
[146] Jos´E Luis Mart´Inez Ramos, Alejandro Marano Marcolini, “Load & Frequency
Control In Competitive Power Systems”, IEEE MELECON 2006, Benalmadena
(Malaga), Spain, Doi: 10.1109/MELCON.2006.1653252, May 16-19 2006.
[147] Jun Yang , Zhili Zeng , Yufei Tang , Jun Yan , Haibo He And Yunliang Wu,
“Load Frequency Control In Isolated Micro-Grids With Electrical Vehicles Based
On Multivariable Generalized Predictive Theory”, Energies,
Doi:10.3390/En8032145, vol.8, pp. 2145-2164, 2015.
[148] K. Mets, T. Verschueren, W. Haerick, C. Develder and F.De Turck,“ Optimizing
smart energy control strategies for plug-in hybrid electric vehicle charging”, Proc.
IEEE Int. Process Network Oper. Manage. Symp. workshop, pp. 293-299, 2010.
[149] K. Nakayama, G. Fujita, “Load Frequency Control For Utility Interaction Of
Wide-Area Power System Interconnection”, Transmission & Distribution
Conference & Exposition: Asia and Pacific, Doi: 10.1109/TD-
ASIA.2009.5356942, Oct 2009.
List of References
140
[150] K. Venkateswarlu, “Design Of Decentralized Load -Frequency Regulators”, Proc.
IEEE, vol.124, no. 9, Sept. 1977.
[151] K. Vrdoljak, N. Peri’c, I. Petrovi’c, “Sliding Mode Based Load-Frequency Control
In Power Systems”, Electric Power Systems Research vol.80, pp.514-527, 2010.
[152] K.C. Divya, Jacob stergaard, “Battery Energy Storage Technology For Power
Systems - An Overview”, Electric Power Systems Research vol.79. pp.511-520,
2009.
[153] K.Clement-Nyns, E. Haesen and J. Driesen, “The impact of vehicle-to-grid on the
distribution grid”, Elect. Power Syst. Res. vol.8, no.1, pp.185-192, 2011.
[154] K.S.S.Anjana, Dr.M.Sridhar, “Analysis And Design Of Controller For Two Area
Deregulated AGC System”, International Journal Of Electronics Communication
And Computer Engineering, vol.3, ISS.1, pp 126-132.
[155] K.Y. Lim, Rob U, “Decentralized Load-Frequency Control Of Multi-Area Power
Systems”, IEEE Proc, vol. 143, no. 5. Sept, 1996.
[156] Kab Seok Ko, Dan Keun Sung, “The Effect of EV Aggregators With Time-
Varying Delays on the Stability of a Load Frequency Control System”, IEEE
Transactions on Power Systems, vol. 33, ISS.1, pp.669 - 680, Jan 2018.
[157] Kalyan Chatterjee, “Effect Of Battery Energy Storage System On Load Frequency
Control Under Deregulation”, International Journal Of Emerging Electric Power
Systems: vol.12, no.3, Article 2. DOI: 10.2202/1553-779X.2700, 2013.
[158] Kamel Sabahia, Easa Narimania and Ahmad Faramarzib, “Dynamic Neural
Network For AGC In Restructure Power System”, IEEE International Conference
on Power and Energy , Doi: 10.1109/PECON.2010.5697651, Dec 2010.
[159] Kevin Marchese, S.A. Pourmousavi, “The Application Of Demand Response For
Frequency Regulation In An Islanded Microgrid With High Penetration Of
Renewable Generation”, North American Power Symposium (NAPS), Doi:
10.1109/NAPS.2013.6666857, Sep 2013.
[160] Kiran Kumar Challa, P.S.Nagendra Rao, “Analysis And Design Of Controller For
Two Area Thermal-Hydro-Gas AGC System”, Joint International Conference on
Power Electronics, Drives and Energy Systems & 2010 Power India, Doi:
10.1109/PEDES.2010.5712502, Dec 2010.

List of References
141
[161] Kourosh Sedghisigarchi,, Ali Feliachi, “Impact Of Fuel Cells On Load-Frequency
Control In Power Distribution Systems”, IEEE Transactions On Energy
Conversion, vol.21, no.1, Mar 2006.
[162] Kumar J., Ng, K., Sheble, G, “AGC simulator for price-based operation part I: a
model. IEEE Trans. Power Syst. vol.12, no.2, pp. 527-532, 1997.
[163] L. Jiang, W. Yao, Q. H. Wu, “Delay-Dependent Stability For Load Frequency
Control With Constant And Time-Varying Delays”, IEEE Transactions On Power
Systems, vol.27, no.2, May 2012.
[164] L. R. Chang-Chien, “Online Estimation Of System Parameters For Artificial
Intelligence Applications To Load Frequency Control”, IET Gene. Trans. Distr.,
vol.5, no.8, pp.895–902, Doi: 10.1049/Iet-Gtd.2010.0654, 2011.
[165] Laurent Lenoir, Innocent Kamwa, “Overload Alleviation With Preventive-
Corrective Static Security Using Fuzzy Logic”, IEEE Transactions On Power
Systems, vol.24, no.1, February 2009.
[166] Laurentiu Dan Marinovici, Jianming Lian, Karanjit Kalsi, “Distributed
Hierarchical Control Architecture for Transient Dynamics Improvement In Power
Systems”, IEEE Transactions on Power Systems, vol.28, no.3 , pp.3065 - 3074
Aug. 2013.
[167] Leadbetter. J and Swan. L. K, “Selection of Battery Technology to Support Grid-
Integrated Renewable Electricity”, Journal of Power Sources 216, 2012.
[168] Le-Ren Chang-Chien, “Modeling Of Wind Farm Participation In AGC”, IEEE
Transactions On Power Systems, vol.29, no.3, May 2014.
[169] Le-Ren Chang-Chien, Luu Ngoc “An Incorporating Demand Response With
Spinning Reserve To Realize An Adaptive Frequency Restoration Plan For System
Contingencies”, IEEE Transactions On Smart Grid, vol.3, no.3, pp.1145-1153, Sep
2012.
[170] Le-Ren Chang-Chien, Wei-Ting Lin, “Enhancing Frequency Response Control By
DFIGs In The High Wind Penetrated Power Systems”, IEEE Transactions On
Power Systems, vol. 26, no.2, May 2011.
[171] Li Pingkang, Zhu Hengjun, Li Yuyun, “Genetic Algorithm Optimization For
AGC Of Multi-Area Power Systems”, Proceedings Of ECC TENCON'O2,
Doi:10.1109/TENCON.2002.1182689, Oct 2002.

List of References
142
[172] Liang Liang, Jin Zhong, ”Frequency Regulation For A Power System With Wind
Power And Battery Energy Storage”, IEEE International Conference on Power
System Technology (POWERCON), Doi: 10.1109/PowerCon.2012.6401357,
2012.
[173] Lingling Fan, Zhixin Miao, Dale Osborn, “Wind Farms With HVDC Delivery In
Load Frequency Control”, IEEE Transactions On Power Systems, vol.24, no.4,
0885-8950, November 2009.
[174] Luis M. Castro, Claudio R. Fuerte-Esquivel, “Solution Of Power Flow With
Automatic Load-Frequency Control Devices Including Wind Farms”, IEEE
Transactions On Power Systems, vol.27, no.4, Nov 2012.
[175] M. Aldeen, “Decentralised Proportional-Plus-Integral Design Method For
Interconnected Power Systems, IEEE Proceedings-C, vol.138, no.4, July 1991.
[176] M. Ehsani.Y.Gao, S.E. Gay and A. Emadi, Modern Electric, Hybrid Electric and
Fuel Cell Vehicles”, Boca Raton, FL: CRC Press, 2005.
[177] M. Farahani S. Ganjefar M. Alizadeh, “PID Controller Adjustment Using Chaotic
Optimization Algorithm For Multi-Area Load Frequency Control”, IET Control
Theory, vol.6, no.13, pp.1984–1992, Doi: 10.1049/Iet-Cta.2011.0405, Apr 2012.
[178] M. Jinter-Meyer, K.P.Scheider and R.G.Pratt,“ Impacts assessment of Plug-in-
hybrid vehicles on electric utilities and regional US power grids Part 1:Technical
analysis Pacific Northwest National Laboratory, Pacific Northwest
Natl.Lab.,Richland, WA, Tech. Rep. PNNL-SA-61669, 2007.
[179] M. Khalid, A.V. Savkin, “An Optimal Operation Of Wind Energy Storage System
For Frequency Control Based On Model Predictive Control”, Renewable Energy ,
vol.48, pp.127-132, Dec. 2012.
[180] M. Rahmani N. Sadati, “Hierarchical Optimal Robust Load-Frequency Control For
Power Systems”, IET Gener. Transm. Distrib., vol. 6, ISS. 4, Pp. 303–312, Doi:
10.1049/Iet-Gtd.2011.0544, 2012.
[181] M. Takagi, H. Yamamoto, K. Yamaji, K. Okano, R. Hiwatari and T. Ikeya, “Load
frequency control method by charge control for plug-in hybrid electric vehicles
with LFC signal,” IEEE Transactions on Power and Energy, vo1.129, no.11,
pp.J342- 1348,2009.
List of References
143
[182] M.A. Bolton Zammit, D.J. Hill and R.J. Kaye, “Designing ancillary services
markets for power system security,” IEEE Trans. on Power Systems, vol. 15, no.2,
pp.675-680, May 2000.
[183] M.D.Galus, M.Zima and G.Andersson, “On integrating of the plug-in hybrid
vehicle into existing power system structures”, Energy Policy, vol.28, no.11,
pp.6736-6745, November 2010.
[184] M.L. Kothari, J. Nanda, D.P Kothari D. Das, “Discrete-Mode Automatic
Generation Control Of A Two-Area Reheat Thermal System With New Area
Control Error”, IEEE Transactions On Power Systems, vol.4, no.2, May 1989.
[185] M.R.I. Sheikh, S.M. Muyeen, Rion Takahashi, Toshiaki Murata And Junji
Tamura, “Improvement Of Load Frequency Control With Fuzzy Gain Scheduled
Superconducting Magnetic Energy Storage Unit”, 18th International Conference
on Electrical Machines, Doi:10.1109/ICELMACH.2008.4799958, Sept 2008.
[186] Mairaj Ud Din Mufti, Shameem Ahmad Lone, Shiekh Javed Iqbal, Muzzafar
Ahmad, Mudasir Ismail, “Super-Capacitor Based Energy Storage System For
Improved Load Frequency Control”, Electric Power Systems Research vol.79,
pp.226-233, 2009.
[187] Manoj Datta, Tomonobu Senjyu, “Fuzzy Control Of Distributed Pv
Inverters/Energy Storage Systems/Electric Vehicles For Frequency Regulation In
A Large Power System", IEEE Transactions On Smart Grid, vol.4, no.1, pp. 1253-
1262, March 2013.
[188] Mansour Jalali, Kankar Bhattacharya, “Frequency Regulation And Agc In Isolated
Systems With DFIG-Based Wind Turbines”, IEEE Power & Energy Society
General Meeting, Doi: 10.1109/PESMG.2013.6672801, Jul 2013.
[189] Marc Petit And Yannick Perez, “Vehicle-To-Grid In France: What Revenues For
Participation In Frequency Control” 2013 10th International Conference on the
European Energy Market (EEM), Doi: 10.1109/EEM.2013.6607307, May 2013.
[190] Martin De Montigny, “Multiagent Stochastic Simulation Of Minute-To-Minute
Grid Operations And Control To Integrate Wind Generation Under AC Power
Flow Constraints”, IEEE Transactions on Sustainable Energy, vol.4, no.3, pp.619-
629, July 2013.

List of References
144
[191] Maryam Hassani Variani, Kevin Tomsovic, “Distributed Automatic Generation
Control Using Flatness-Based Approach For High Penetration Of Wind
Generation”, IEEE Transactions On Power Systems, vol.28, no. 3, Aug 2013.
[192] Mats Wang-Hansen, Robert Josefsson, And Haris Mehmedovic, “Frequency
Controlling Wind Power Modeling Of Control Strategies”, IEEE Transactions On
Sustainable Energy, vol.4, no.4, Oct 2013.
[193] Matthias D. Galus, Stephan Koch, “Provision Of Load Frequency Control By
PHEVS, Controllable Loads, And A Cogeneration Unit”, IEEE Transactions On
Industrial Electronics, vol. 58, no. 10, pp. 4568 – 4582, Oct 2011.
[194] Milan Calovik, “Linear Regulator Design For A Load And Frequency Control”,
IEEE Power Engineering Society, vol. PAS-91, no.6, pp.2271- 2285, Nov 1972.
[195] Mohamed M.IsmailAhmed F.Bendary, Load Frequency Control for Multi-Area
Smart Grid based on Advanced Control Techniques, Alexandria Engineering
Journal, vol.57, no.4, pp.4021-4032 Dec 2018.
[196] Mr. Najmuddin Moulaali Jamadar1, Mr. A. Ram Reddy2, “Load Frequency
Control For Two Area Deregulated Power System Using ANN Control”, IRJET,
vol.02, no.03, pp.2288-2292, Jun 2015.
[197] N. Conhs, “Consideration s in the Regulation of Interconnected Area,” IEEE
Transactions onPower Apparatus and Systems, vol.PAS-86, no.12, pp.1527-1538,
December 1967.
[198] N. G.Malek, “Trajectory-Sensitivity Design Of Load-Frequency Control
Systems”, Proc. IEEE, vol.120, no. 10, Oct. 1973.
[199] N.N. Bengiami, W.C. Chan, “3 Level Load-Frequency Control Of Power Systems
Interconnected By Asynchronous Tie Lines”, Proceedings of the Institution of
Electrical Engineers, vol.126, no. 11, pp.1198-1200, Nov 1979.
[200] N.N. Bengiamin,”Multilevel Load-Frequency Control Of Interconnected Power
Systems”, Proc. IEE, vol. 125, no. 6, pp.521-5026, June 1978.
[201] O. Anaya-Lara, F.M. Hughes, N. Jenkins And G. Strbac, “Contribution Of Dfig-
Based Wind Farms To Power System Short-Term Frequency Regulation”, IEE
Proc. Gen. Trans. Distr., vol. 153, no. 2, Mar 2006.
[202] O. P. Rahi, “Ancillary Services In Restructured Environment Of Power System”,
International Journal Of Innovative Technology And Research, vol.1, no.3, pp.218
– 225, April - May 2013.

List of References
145
[203] O.I.Elgerd and C.E.Fosha, Jr..“ Optimization megawatt-freequency control of
multiarea electric energy systems”, IEEE Transaction on Power Appartus and
Systems, vol.PAS-89, no.4, pp.556-563, April 1970.
[204] O.P. Malik, Ashok Kumar, G S Hope, “A Load Frequency Control Algorithm
Based On A Generalized Approach”, IEEE Transactions On Power Systems, vol.
3, no. 2, May 1988.
[205] Olle I. Elgerd, “Optimum Megawatt-Frequency Control Of Multi Area Electric
Energy Systems”, IEEE Transactions On Power Apparatus And Systems,
vol.PAS-89, no.4, pp.556 - 563, April 1970.
[206] One Nation-One Grid". Power Grid Corporation of India. Retrieved 2
December 2016.
[207] P Biswas, P Bera, “GA Application To Optimization Of AGC, In Two Area Power
System Using BES”, International Conference on Communications, Devices and
Intelligent Systems (CODIS), 10.1109/CODIS.2012.6422208, Dec 2012.
[208] P. Ajay-D- Vimal Raj, “Automatic Generation Control Of A Hydro-Thermal And
Thermal Thermal Systems In A Deregulated Environment”, On-Line:
Journal.Esrgroups.Org/Jes, JES 2009.
[209] P. H. Ashmole, “Power-System Model For Large Frequency Disturbances”, Proc.
IEEE, vol. 121, no. 7, July 1974.
[210] P.K. Ray, S.R.Mohanty , Nand Kishor , A. Mohanty, “Small-Signal Analysis Of
Hybrid Distributed Generation System With HVDC Link And Energy Storage
Elements”, Second International Conference on Emerging Trends in Engineering
& Technology, Doi:10.1109/ICETET.2009.203, Dec 2009.
[211] Panayiotis Moutis, Stavros A. Papathanassiou, Nikos D, Hatziargyriou,
“Improved Load-Frequency Control Contribution Of Variable Speed Variable
Pitch Wind Generators”, Renewable Energy vol.48, pp.514-523, 2012.
[212] Papalexopoulos, D.A., Andrianesis and P.E, “Performance-based pricing of
frequency regulation in electricity markets”, IEEE Trans. Power Syst. vol. 29,
no.1, pp.441–449, 2014.
[213] Parformak P.W, “Energy Storage for Power Grids and Electric Transportation: A
Technology Assessment”, Congressional Research Service, 2012.

List of References
146
[214] Pingping Xie, Bin Qian, Dongyuan Shi, Jinfu Chen and Lin Zhu, “Supplementary
automatic generation control using electric vehicle battery swapping stations,”
IEEE PESGM, pp. 1-5, July 2013.
[215] Pingping Xie, Bin Qian, Dongyuan Shi, Jinfu Chen and Lin Zhu,” Supplementary
automatic generation control using electric vehicle battery swapping stations,”
IEEE PESGM, 978-1-4799-1303-9, pp. 1-5, July,2013.
[216] Pingping Xie, Bin Qian, Dongyuan Shi, Jinfu Chen, and Lin Zhu," Supplementary
automatic generation control using electric vehicle battery swapping stations,"
IEEE PESGM, 978-1-4799-1303-9, pp. 1-5, July 2013.
[217] Prabhat Kumar, Safia A Kazmi, Nazish Yasmeen, “Comparative Study Of
Automatic Generation Control In Traditional And Deregulated Power
Environment”,World Journal Of Modelling And Simulation, England, UK,
vol.6,no. 3, pp. 189-197, 2010.
[218] Praghnesh Bhatt , S.P. Ghoshal B, Ranjit Roy , “Load Frequency Stabilization By
Coordinated Control Of Thyristor Controlled Phase Shifters And Supper
Conducting Magnetic Energy Storage For Three Types Of Interconnected Two-
Area Power Systems”, Electrical Power And Energy Systems vol.32, pp.1111–
1124, 2010.
[219] Praghnesh Bhatt, Ranjit Roy , S.P. Ghoshal, “Optimized Multi Area AGC
Simulation In Restructured Power Systems”, Electrical Power And Energy
Systems vol.32, pp.311–322, 2010.
[220] Praghnesh Bhatt, Ranjit Roy, “Comparative Performance Evaluation Of SMES–
SMES, TCPS–SMES And SSSC - SMES Controllers In Automatic Generation
Control For A Two-Area Hydro–Hydro System”, Electrical Power and Energy
Systems, vol.33, pp.1585-1597, 2011.
[221] Prakash K. Ray , Soumya R. Mohanty, Nand Kishor, “Small–Signal Analysis Of
Autonomous Hybrid Distributed Generation Systems In Presence Of Ultra
capacitor And Tie–Line Operation”, Journal Of Electrical Engineering, vol.61,
no.4, pp.205–214, Doi: 10.2478/V10187-010-0029-0, 2010.
[222] Prof. J. Nanda, “Automatic Generation Control Of An Interconnected Power
System”, Proc. IEEE, vol. 125, no. 5, May1978.
[223] Prof. V.R. Moorthi, “Damping Effects Of Excitation Control In Load-Frequency
Control System”, Proceedings IEEE, vol.121, no. 11, Nov 1974.

List of References
147
[224] R D Christie and A Bose, “Load frequency control issues in power system
operation after deregulation,” IEEE transaction on power system”, 0-7803-2663-
6/95, 1995.
[225] R. A. Schlueter, G. L. Park, “Modification Of Power System Operation For
Significant Wind Generation Penetration”, IEEE Transactions On Power
Apparatus And Systems, vol.Pas-102, no.1, Jan 1983.
[226] R. Doherty, A. ], G. Nolan, D. Burke, A. Bryson, and M. O’Malley, “An
assessment of the impact of wind generation on system frequency control,” IEEE
Trans. Power Syst., vol. 25, no. 1, pp. 452-460, Feb. 2010.
[227] R. Dorais wami, “A Nonlinear Load Frequency Control Design, IEEE
Transactions On Power Apparatus And Systems”, vol. PAS-97, no. 4 Jul 1978.
[228] R. G. de Almeida and J. A. P. Lopes,“ Participation of doubly fed induction wind
generators in system frequency regulation,” IEE Trans. Power Syst., vol. 22, no.
3, pp. 944-950, Aug. 2007.
[229] R. Hooshmand , M. Ataei And A. Zargari, “A New Fuzzy Sliding Mode
Controller For Load Frequency Control Of Large Hydropower Plant Using Particle
Swarm Optimization Algorithm And Kalman Estimator”, Euro. Trans. Electr.
Power, vol.22, no.6, pp.812-830, Jul 2011.
[230] R.G.Yadav, A.Roy, S.A. Khaparde and P.Pentayya,” India’s fast-growing power
sector”, IEEE Power and Energy Magazine, vol.3, no.4, pp-39-48, Jul/Aug 2005.
[231] Rabindra Kumar Sahu, Sidhartha Panda, Umesh Kumar Rout, “De Optimized
Parallel 2-Dof Pid Controller For Load Frequency Control Of Power System With
Governor Dead-Band Nonlinearity”, Electrical Power And Energy Systems
vol.49, pp.19–33, 2013.
[232] Rajeev Dey, Ghoshs, Ray, Rakshita, “H∞ Load Frequency Control Of
Interconnected Power Systems With Communication Delays”, Electrical Power
And Energy Systems, vol.42, no.1, pp.672-684, Nov 2012.
[233] Rajesh Joseph Abraham A,B, D. Das A, Amit Patra A, “Load Following In A
Bilateral Market With Local Controllers”, Electrical Power And Energy Systems,
vol.33, pp.1648–1657, 2011.
[234] Roger C. Dugan, Jason A. Taylor, and Davis Montenegro," Energy Storage
Modeling for distribution planning," IEEE REPC, 978-1-4673-7617-4, pp.12-20,
2016.

List of References
148
[235] Ronan Doherty, Alan Mullane, “An Assessment Of The Impact Of Wind
Generation On System Frequency Control”, IEEE Transactions On Power
Systems, vol.25, no.1, Feb 2010.
[236] S S.C. Tripathy, K.P. Juengst, “Sampled Data Automatic Generation Control With
Superconducting Magnetic Energy Storage In Power Systems”, IEEE Transactions
On Energy Conversion, vol. 12, no. 2, pp. 187-192, Jun 1997.
[237] S. A. Khaparde, “Power sector reforms and restructuring in India”, IEEE Power
Engineering Society General Meeting, vol. 2, pp.2328 - 2335, June 2004.
[238] S. Ali Pourmousavi, M. Hashem Nehrir, “Real-Time Central Demand Response
For Primary Frequency Regulation In Micro Grids”, IEEE Transactions on Smart
Grid, vol.3, no.4, pp. 1988 - 1996 Dec. 2012.
[239] S. Banerjee, J. K. Chatterjee, S. C. Tripathy, “Application Of Magnetic Energy
Unit Storage As Load Frequency Stabilized”, IEEE Transactions On Energy
Conversion, vol. 5, no.1, 0885-8, March 1990.
[240] S. Banerjee, J. K. Chatterjee, S. C. Tripathy, “Application Of Magnetic Energy
Storage Unit As Load-Frequency Stabilizer”, IEEE Transactions On Energy
Conversion, vol. 5, no.1, March 1990.
[241] S. Biswas, P Bera, “GA Application To Optimization Of Agc In Two Area Power
System Using Battery Energy Storage”, International Conference on
Communications, Devices and Intelligent Systems (CODIS), Doi:
10.1109/CODIS.2012.6422208, Dec 2012.
[242] S. Doolla , T. S. Bhatti & R. C. Bansal, “Load Frequency Control Of An Isolated
Small Hydro Power Plant Using Multi-Pipe Scheme”, Electric Power Components
And Systems, vol.39, ISS.1, pp.46-63, DOI: 10.1080/15325008.2010.513362,
2010.
[243] S. K. Sinha, R. N. Patel, “Application Of GA And PSO Tuned Fuzzy Controller
For AGC Of Three Area Thermal- Thermal-Hydro Power System”, International
Journal Of Computer Theory And Engineering, vol.2, no.2, 1793-820, April, 2010.
[244] S. Mekhilef, R. Saidur and A. Safari, “Comparative study of different fuel cell
technologies”, Renewable and Sustainable Energy Reviews, vol. 16, no.1, pp.
981-989, 2012.
List of References
149
[245] S.C. Tripathy, “Effect Of Superconducting Magnetic Energy Storage On
Automatic Generation Control Considering Governor Dead band And Boiler
Dynamics”, Transactions On Power Systems, vol.7, No.3, Aug 1992.
[246] S.C. Tripathy, G.S. Hope, “Optimization Of Load - Frequency Control Parameters
For Power Systems With Reheat Steam Turbines And Governor Dead Band
Nonlinearity”, IEEPROC, vol. 129, Pt. C, no. 1, January 1982.
[247] S.C. Tripathy, K.P. Juengst, “Sampled Data Automatic Generation Control With
Superconducting Magnetic Energy Storage In Power Systems”, IEEE Transactions
On Energy Conversion, vol. 12, no. 2, June 1997.
[248] S.C. Tripathy, R. Balasubramanian P.S. Chandramohanan Nair, “Adaptive
Automatic Generation Control With Super Conducting Magnetic Energy Storage
In Power System”, IEEE Transactions On Energy Conversion, vol.7, no.3,
September 1992.
[249] S.Farook1, P. Sangameswara Raju2, “AGC Controllers To Optimize LFC
Regulation In Deregulated Power System”, IJAET, vol.1, no.5, pp.278-289, Nov,
2011.
[250] S.G. Wirasingha and A. Emadi, “ Pihef: Plug-in hybrid electric factor”, IEEE
Trans. Veh. Technol, vol.60, no.3, pp.1279-1284, March 2011.
[251] S.H. Hosseini, A.H. Etemadi, Adaptive “Neuro-Fuzzy Inference System Based
Automatic Generation Control”, Electric Power Systems Research vol.78,
pp.1230–1239, Doi:10.1016/J.Epsr.2007.10.007, 2008.
[252] S.K. Aditya, D. Das, “Battery Energy Storage For Load Frequency Control Of An
Interconnected Power System”, Electric Power Systems Research, ELSVIER, 58,
pp. 179-185, Pii: S0378-7796(01)00129-8, 2001.
[253] S.P. Ghoshal , S.K. Goswami , “Application Of GA Based Optimal Integral Gains
In Fuzzy Based Active Power-Frequency Control Of Non-Reheat And Reheat
Thermal Generating Systems”, Electric Power Systems Research vo.67, pp.79-88,
Doi:10.1016/S0378-7796(03)00087-7, 2003.
[254] S.Selvakumaran, S.Parthasarathy, R.Karthigaivel, V.Rajasekaran, “Optimal
Decentralized Load Frequency Control In A Parallel AC-DC Interconnected
Power System Through HVDC Link Using PSO Algorithm”, Energy Proceeding
vol.14, pp.1849-1854, 2012.

List of References
150
[255] Sahaj Saxena, Yogesh V. Hote, “Load Frequency Control In Power Systems Via
Internal Model Control Scheme And Model-Order Reduction”, IEEE Transactions
on Power Systems, vol.28, no.3 , pp.1759-2757, Aug. 2013.
[256] Sandeep Bhongade, “Artificial Neural Network Based Automatic Generation
Control Scheme For Deregulated Electricity Market”, Conference Proceedings
IPEC, Doi: 10.1109/IPECON.2010.5696997, Oct 2010.
[257] Sanjoy Debbarma, Lalit Chandra Saikia, Nidul Sinha, “AGC Of A Multi-Area
Thermal System Under Deregulated Environment Using A Non-Integer
Controller”, Electric Power Systems Research, vol.95, pp.175– 183, 0378-7796,
2013.
[258] Sanjoy Debbarma, Arunima Dutta,” Utilizing Electric Vehicles for LFC in
Restructured Power Systems Using Fractional Order Controller”, IEEE
Transactions on Smart Grid, vol.8, no.6, pp. 2554 - 2564 ,Nov 2017.
[259] Saravuth Pothiya, Issarachai Ngamroo, Suwan Runggeratigul, And Prinya
Tantaswadi, “Design Of Optimal Fuzzy Logic Based PI Controller Using Multiple
Tabu Search Algorithm For Load Frequency Control”, International Journal Of
Control, Automation, And Systems, vol. 4, no. 2, pp. 155-164, Apr 2006.
[260] Shoorangiz Shams, Shamsabad Farahani, Reza Hemati And Mehdi Nikzad,
“Robust Decentralized Load Frequency Control In Multiarea Electric Power
System Using Quantitative Feedback Theory”,Scientific Research And Essays,
Academic Journals, vol.5, no.20, pp.3082-3094, Oct 2010.
[261] Shridhar. ND, Chidambaram I.A, “Computation of ancillary services requirement
assessment indices for load frequency control in a restructured power system using
SMES unit”, WSEAS Transaction on Power System, vol: 9, E-ISSN: 2224-350X.
2014.
[262] Shuang Gao, Chau, Fellow, “Integrated Energy Management Of Plug-In Electric
Vehicles In Power Grid With Renewables”, IEEE Transactions On Vehicular
Technology, vol. 63, no.7, pp.3019-3017, Sep 2014.
[263] Siddharth Sridhar, Manimaran Govindarasu, “Model-Based Attack Detection And
Mitigation For Automatic Generation Control, IEEE Transactions On Smart Grid”,
vol. 5, no. 2, 1949-3053, March 2014.

List of References
151
[264] Singh Parmar K P, Majhi S, Kothari D P, “Load Frequency Control Of A Realistic
Power System With Multi-Source Power Generation”, International Journal Of
Electrical Power And Energy Systems, vol.42, no.1, pp.426-433, Nov 2012.
[265] Sitthider Vachirasricirikul and Issarachai Ngamroo, “Robust LFC in a smart grid
with wind power penetration by coordinated V2G control and frequency
controller," IEEE transaction on smart grid, vol-5, no.1, pp. 371- 380, Jan 2014.
[266] Srinivasarathnam C, Chandrasekhar Yammani, Sydulu Maheswarapu, “Load
Frequency Control of Multi-microgrid System considering Renewable Energy
Sources Using Grey Wolf Optimization”, Journal of Smart Science, vol.7, no.3,
pp.198-217, Jul 2019.
[267] Sterpu. S. Besanger, Y. Hadjsaid N.,” Ancillary services performance control in
deregulated power system”, Power Engineering Society General Meeting, IEEE,
vol. 3, pp.3048-3054, 2005
[268] Sudha K R, Santhi R V,” Load Frequency Control Of An Interconnected Reheat
Thermal System Using Type-2 Fuzzy System Including SMES Units”, Electrical
Power And Energy Systems, vol.43, no.1, pp.1383-1392, Dec 2012.
[269] Sudha K R, Rajuyb, Sekharac, “Fuzzy C-Means Clustering For Robust
Decentralized Load Frequency Control Of Interconnected Power System With
Generation Rate Constraint”, Electrical Power And Energy Systems, vol.37,
no.1, pp.58-66, May 2012.
[270] Suryanarayana Doolla, “Load Frequency Control Of An Isolated Small-Hydro
Power Plant With Reduced Dump Load”, IEEE Transactions On Power Systems,
vol.21, no.4, Nov 2006.
[271] T. Chaiyatham, I. Ngamroo, “Design Of Optimal Fuzzy Logic-Pid Controller
Using Bee Colony Optimization For Frequency Control In An Isolated Wind-
Diesel System”,Transmission & Distribution Conference & Exposition: Asia and
Pacific, Doi:10.1109/TD-ASIA.2009.5356804, Dec 2009.
[272] T. Goya, E Omine ,Y Kinjyo T, Senjyu, A. Yona, N. Urasaki, T. Funabashi,
“Frequency Control In Isolated Island By Using Parallel Operated Battery Systems
Applying Hinf Control Theory Based On Droop Characteristics”, IET Renew.
Power Gen., vol. 5, no.2, pp.160–166, Doi: 10.1049/ IET-RPG, 2011.
[273] T. Hiyama, D. Eng,”Design Of Decentralized Load-Frequency Regulators For
Interconnected Power Systems”, IEE Proceedings, vol.129, January 1982.
List of References
152
[274] T. Hiyama,”Optimization Of Discrete-Type Load-Frequency Regulators
Considering Generation-Rate Constraints”, IEEE Proc., vol.129, no.6, pp. 285-
289, November 1982.
[275] T. Yu, Y.M. Wang, W.J. Ye, B. Zhou3 K.W. Cha, “Stochastic Optimal Generation
Command Dispatch Based On Improved Hierarchical Reinforcement Learning
Approach”, ISSN 1751-8687, IET Gen. Trans. Dist., vol.5, no.8, pp.789-797, Doi:
10.1049/Iet-Gtd.2010.0600, 2011.
[276] T.Anil Kumar , V.Sai Krishna, “Improvement Of Dynamic Performance Of Three
Area Thermal System Under Deregulated Environment Using AC Tie line Parallel
With HVDC Link”, International Conference on Power and Energy Systems,
Doi:10.1109/ICPES.2011.6156607, Dec 2011.
[277] T.C.Yang, H.Cimen, Q. M. Zhu, “Decentralized Load-Frequency Controller
Design Based On Structured Singular Values”, IEE Proc.-Gener. Trunsm. Disfril,
vol.145, no.1, Jan I998.
[278] T.P. Imthias Ahamed, P.S. Nagendra Rao , P.S. Sastry, “A Reinforcement
Learning Approach To Automatic Generation Control”, Electric Power Systems
Research, ELSEVIER, vol.63, pp.9-6, PII: S 0378 - 7796 (02) 00088 – 3, 2002.
[279] T.R. Foord, Wh.Sch, “Step Response Of A Governed Hydro Generator”, Proc.
IEE, vol.125, no.11, Nov. 1978.
[280] Taisuke Masuta, Akihiko Yokoyama, “Supplementary Load Frequency Control
By Use Of A Number Of Both Electric Vehicles And Heat Pump Water Heaters”,
IEEE Transactions On Smart Grid, vol. 3, no.3, pp. Sep 2012.
[281] Tan Ma, Osama Mohammed, “Economic Analysis of Real-Time Large Scale
PEVs Network Power Flow Control Algorithm with the Consideration of V2G
Services”, IEEE Industry Applications Society Annual Meeting, Doi:
10.1109/IAS.2013.6682513, Oct 2013.
[282] Tao Yu, Bin Zhou, Ka Wing Chan, “Stochastic Optimal Relaxed Automatic
Generation Control In Non-Markov Environment Based On Multi-Step Q-
Learning”, IEEE Transactions On Power Systems, vol.26, no.3, 0885-8950/ 2011,
Aug 2011.
[283] Tetsuo Sasaki, Toshihisa Kadoya, “Study On Load Frequency Control Using
Redox Flow Batteries, Study On Load Frequency Control Using Redox Flow
List of References
153
Batteries”, IEEE Power Engineering Society General Meeting, 2004, Doi:
10.1109/TPWRS.2003.818724, Jun 2004.
[284] Thanh Ngoc Pham, Hieu Trinh and Le Van Hien, “Load frequency control of
power system with electric vehicle and diverse transmission links using distributed
functional observers”, IEEE transactions on smart grid, vol.7, no.1, pp. 238-252,
Jan. 2016.
[285] The Gazette of India, Extraordinary; The Electricity Act 2003: Part II Section 3
Sub-section (ii), Ministry of Power, GoI, June 2003.
[286] Tripathy. S.C, Kalantor.M. and Balasubramanian.R.” Stability simulation and
parameter optimization of a hybrid wind-diesel power generation system, Int. J.
Energy Res. 199.
[287] Tyagi, B., Srivastava, S.C, “A mathematical framework for frequency-linked
availability-based tariff mechanism in India “. In Proceedings of 13th National
Power Systems Conference, IIT Chennai, India, pp. 516-520, 2004.
[288] Umesh Kumar Rout, Rabindra Kumar Sahu, Sidhartha Panda, “Design And
Analysis Of Differential Evolution Algorithm Based Automatic Generation
Control For Interconnected Power System”, Ain Shams Engineering Journal,
vol.4, no.3, pp.409-421, Sep 2013.
[289] Vaibhav Donde, “Simulation And Optimization In An AGC System After
Deregulation”, IEEE Transactions On Power Systems, vol.16, no.3, August 2001.
[290] Vazquez S,” Energy Storage Systems for Transport and Grid Applications”, IEEE
Transactions on Industrial Electronics, vol. 5, 2010.
[291] Verma, Y.P., Kumar A, “Participation of doubly fed induction generator based
wind turbine in frequency regulation with frequency linked pricing”. Electric
Power Components and System, vol.40, no.14, 1586-1604, 2012.
[292] Vijay P. Singh B, Soumya R. Mohanty A, Nand Kishor A, Prakash K. Ray C,
“Robust H-Infinity Load Frequency Control In Hybrid Distributed Generation
System”, Electrical Power And Energy Systems vol.46, pp. 294–305, 2013.
[293] W.Kempton and J.Tomic, “Vehicle-to-grid power implementation: From
stabilizing the grid to supporting large-scale renewable energy," Journal of Power
Sources, vol.144, no.1, pp-268-279, 2005.
[294] Wen Tan, Zhan Xu, “Robust Analysis And Design Of Load Frequency Controller
For Power Systems”, Electric Power Systems Research vol.79, pp.846–853, 2009.
List of References
154
[295] Wen Tan,“Unified Tuning Of PID Load Frequency Controller For Power Systems
Via IMC”, IEEE Transactions On Power Systems, vol.25, no.1, February 2010,
0885-8950, 2009.
[296] Wencong Su, Habiballah Rahimi-Eichi, “A Survey On The Electrification Of
Transportation In A Smart Grid Environment”, IEEE Transactions On Industrial
Informatics, vol. 8, no. 1, Feb 2012.
[297] www.bp.com.
[298] www.cea.nic.in.
[299] www.coalindia.in.
[300] www.ntpc.co.in.
[301] www.planningcommision.gov.in.
[302] www.powerexindia.com.
[303] www.powergridindia.com.
[304] Xiaofeng Yu And Kevin Tomsovic, “Application Of Linear Matrix Inequalities
For Load Frequency Control With Communication Delays”, IEEE Transactions
On Power Systems, vol.19, no. 3, Aug 2004.
[305] Xin Pan, H. Xu, J. Song and C.Lu, “Capacity Optimization of Battery Energy
Storage Systems for Frequency Regulation”, IEEE International Conference on
CASE, 978-1- 4673-8283-3, 2015.
[306] Xing Luo, Jihong Wnag, Mark Dooner, Jonathan Clarke, “Overview Of Current
Development In Electrical Energy Storage Technologies And The Application In
Power System Operation”, Applied Energy vol.13, pp. 511-536, 2014.
[307] Xinran Li, Shaojie Tan, Jiyuan Huang, “Optimal Sizing For Flywheel Energy
Storage System-Conventional Generator Coordination In Load Frequency
Control”, POWERCON, Chengdu, pp. 20-22, Oct 2014.
[308] Xiuxia Du, And Pingkang Li, “Fuzzy Logic Control Optimal Realization Using
GA For Multi-Area AGC Systems”, International Journal Of Information
Technology vol.12, no.7, 2006.
[309] Y Y Hsu, “Optimal Variable Structure Controller For The Load Frequency Control
Of Interconnected Hydrothermal Power Systems”, Butterworth & Co Publishers
Ltd, vol 6, no.4, October 1984.

List of References
155
[310] Y.Ota, H. Taniguchi, K. M Liyanage, J. Baba, and A.Yokoyama, "Autonomous
distributed V2G (vehicle to grid) satisfying scheduled charging”, IEEE Trans.
Smart Grid, vol.3, no.1, pp. 559-564, Mar 2012.
[311] Yajvender Pal Verma & Ashwani Kumar, Participation Of Doubly Fed Induction
Generator Based Wind Turbine In Frequency Regulation With Frequency Linked
Pricing, Electric Power Components And Systems, vol.40, no.14, pp.1586-1604,
2014.
[312] Yang Mi, Yang Fu, Chengshan Wang, “Decentralized Sliding Mode Load
Frequency Control For Multi-Area Power Systems”, IEEE Transactions on Power
Systems ,vol. 28, no.4, pp. 4301-4309, Nov. 2013.
[313] Young-Hyun Moon, Heon-Su Ryu, “A New Paradigm Of Automatic Generation
Control Under The Deregulated Environments”, IEEE Power Engineering Society
Winter Meeting. Conference Proceedings, Doi: 10.1109/PESW.2000.849919, Jan
2000.
[314] Z. Du1 Y. Zhang, Z. Chen1 P. Li, Y. Ni3 L. Shi, “Integrated Emergency
Frequency Control Method For Interconnected AC/DC Power Systems Using
Centre Of Inertia Signals”, IET Gen. Trans. Dist., vol. 6, no.6, pp.584–592, Doi:
10.1049/Iet-Gtd.2011.0445, Jun 2012.
[315] Zadeh, L.. Fuzzy sets. Information and Control, vol.8, no.3, pp.338-353, 1965.

156
List of Publications
A. Publications based on research work done so far are as follows :
1. YR Prajapati and V N Kamat, “Secondary frequency regulation / Automatic
Generation Control under Deregulated Power System along with renewable
energy sources using Electric Vehicle/ Distributed Energy Storage Systems”,
IEEE International Conference on Electrical, Electronics, and Optimization
Techniques (ICEEOT),2016.
2. Y R Prajapati, V N Kamat and J J Patel “Impact of Grid Connected Solar Power
on Load Frequency Control In Restructured Power System”, i-PACT IEEE intern.
Conf.2017 at VIT, Vellore University, Tamilnadu, 2017.
3. YR Prajapati, V N Kamat and J J Patel “Price Based Automatic Generation
Control (AGC) in a restructured power system by considering peak hours and off-
peak”, Wulfenia Journal, Klagenfurt, Austria, ISSN- 1561 882X, vol. 25, No.3,
March 2018.
4. YR Prajapati, V N Kamat and J J Patel “Impact of grid-connected wind power on
frequency regulation in restructured power system”, International Conference
APGRES 2019, Banswara, RTU, Available on ELSEVIER-SSRN, 2019.
5. Yogesh R Prajapati, Vithal N Kamat and Jatinkumar J Patel, “Automatic
Generation Control in a Smart Grid using Electrical vehicle as a Battery Energy
Storage System”, IJRTE, vol.8 ISS.4 pp. 2390-2395, November 2019.
6. Yogesh R Prajapati, Vithal N Kamat, Jatinkumar J Patel and Rahul Kher,” A
Comprehensive Survey on Use of Soft Computing and Optimization Techniques
for Load Frequency Control”, JEEE, vol.8(2), pp.64-70, 2020.
7. Yogesh R Prajapati, Vithal N Kamat and Jatinkumar J Patel, “ Load Frequency
Control Under Restructured Power System Using Electrical Vehicle as
Distributed Energy Source”, IE(I) Series B, vol.101, pp.379–387, 2020.
8. Yogesh R Prajapati, Jatinkumar J Patel and Vithal N Kamat, “Automatic
Generation Control (AGC) operation in a restructured power system under

List of Publications
157
Availability Based Tariff (ABT) mechanism by considering peak hours and off-
peak hours”, IJST, vol.13(33), pp.3400-3408, 2020.

List of Appendices
158
Appendix-A
Challenges in the Indian Power Sector
Fig. A.1 shows the total generation capacity within India from the central, state and private
sectors. The power generating ability of the private sector is more as compared to the state
and central sector. The sharing of power between state and central sector are near to each
other.
FIGURE A.1 Total Generation within India (as on 31st August 2019)
Fig. A.2 presents the sharing of power generation from different fossil fuels. Major power
generation from coal consumption is more as compared to other sources which are around
54.3%. Because of limited water reservoir and storage, the hydro generation is limited.
Nowadays the government is encouraged to enhance the use of RES due to limited stock of
fossil fuels and environmental issues such as global warming and climate changes. The
0
20,000
40,000
60,000
80,000
1,00,000
1,20,000
1,40,000
1,60,000
1,80,000
Central Sector State Sector Private Sector
MW
Total Generation 3,60,456 MW
28.5%
46.5%
25%

List of Appendices
159
following Fig.A.3 represents the increase in the consumption of coal in India from 281 MT
in 2005 to 608 mT in 2018.
FIGURE A.2 Power Generation from Different Sources (as on 31st August 2019)
FIGURE A.3 Coal Consumption in India (as on 31st August 2019)
0
50000
100000
150000
200000
250000
Coal Lignite Gas Diesel Hydro Nuclear RES
Po
we
r G
en
era
tio
n (
MW
)54.3%
1.7%6.9%
0.2%
12.6%
1.9%
22.0%
0
100
200
300
400
500
600
700
Co
al C
on
sum
pti
on
(M
T)
Year

List of Appendices
160
There is a drastic increase in demand as shown in Fig. A.4. So, the per capita energy
consumption increased from 631.4 kWh in 2005 to 1149 kWh in 2018.
FIGURE A.4 Per Capita Energy Consumption, Kwh (as on 31st August 2019)
0
200
400
600
800
1000
1200
1400P
er
Cap
ita
Ene
rgy
Co
nsu
mp
tio
n (
kWh
)
Year
0
20000
40000
60000
80000
100000
120000
140000
160000
180000
200000
Pe
ak D
em
and
(M
W)
Year
Peak Demand
Peak Met

List of Appendices
161
FIGURE A.5 Peak Demand in India, MW (as on 31st August 2019)
FIGURE A.6 Peak Demand Deficits in India, (as on 31st August 2019)
Similarly, Energy requirement and availability are increased from 2009 to 2019 which is
shown in Fig.A.7. Also, because of development in the area of power generation, the deficits
reduce, as shown in Fig.A.8.
-14
-12
-10
-8
-6
-4
-2
0P
eak
De
man
d D
efi
cts
%
Year
Deficts
Deficts
0
200000
400000
600000
800000
1000000
1200000
1400000
Ene
rgy
(MU
)
Year
Requirement
Availability

List of Appendices
162
FIGURE A.7 Energy requirement and Availability in India (MU)
FIGURE A.8 Energy Deficits in India (%)
FIGURE A.9 Transmission and Distribution Losses
The graphical view of transmission and distribution losses is presented in Fig.A.9. It can be
observed that the losses are reduced every year.
-12
-10
-8
-6
-4
-2
0
Ene
rgy
(MU
%)
Year
Deficts
23.0422.84 22.77
21.81
21.42
20.5
21
21.5
22
22.5
23
23.5
2012-13 2013-14 2014-15 2015-16 2016-17
T &
D L
oss
es
(%)
Year
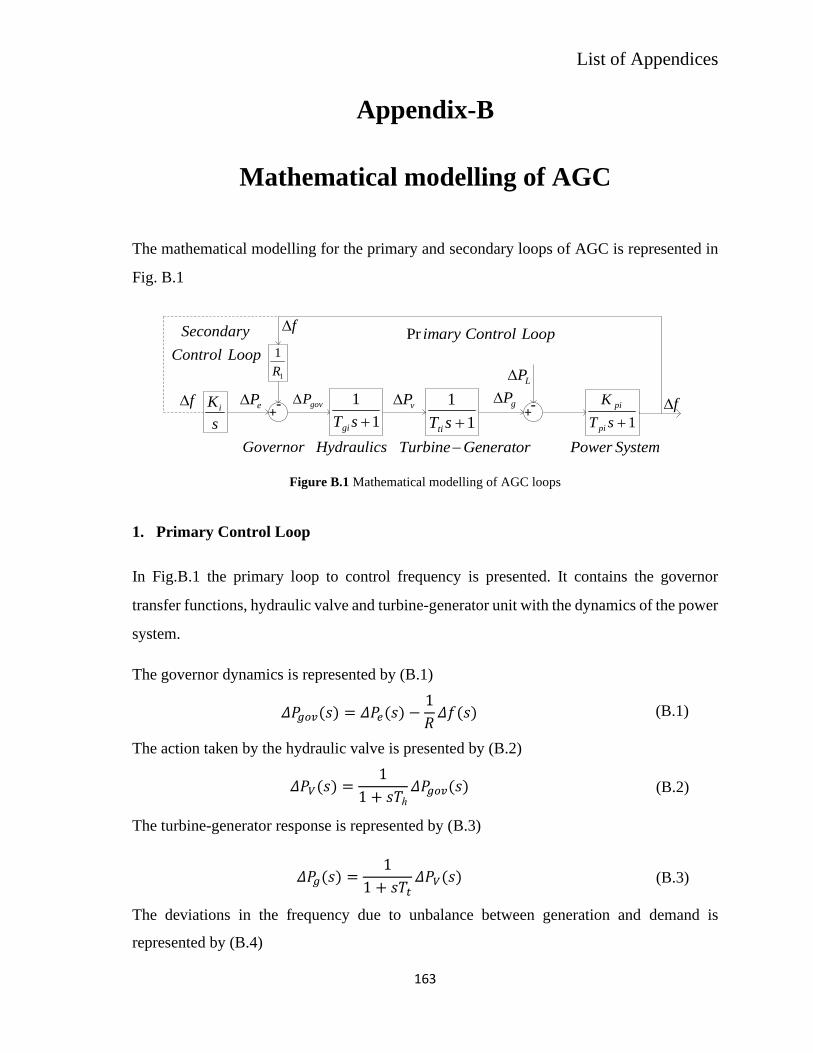
List of Appendices
163
Appendix-B
Mathematical modelling of AGC
The mathematical modelling for the primary and secondary loops of AGC is represented in
Fig. B.1
1
1
+sTgi 1
1
+sTti
-+
1
1
R
1+sT
K
pi
pi f
s
K i govP gP
LP
eP vP +-f
f
Governor Hydraulics GeneratorTurbine− SystemPower
LoopControlimaryPr
LoopControl
Secondary
Figure B.1 Mathematical modelling of AGC loops
1. Primary Control Loop
In Fig.B.1 the primary loop to control frequency is presented. It contains the governor
transfer functions, hydraulic valve and turbine-generator unit with the dynamics of the power
system.
The governor dynamics is represented by (B.1)
𝛥𝑃𝑔𝑜𝑣(𝑠) = 𝛥𝑃𝑒(𝑠) −1
𝑅𝛥𝑓(𝑠) (B.1)
The action taken by the hydraulic valve is presented by (B.2)
𝛥𝑃𝑉(𝑠) =1
1 + 𝑠𝑇ℎ𝛥𝑃𝑔𝑜𝑣(𝑠)
(B.2)
The turbine-generator response is represented by (B.3)
𝛥𝑃𝑔(𝑠) =1
1 + 𝑠𝑇𝑡𝛥𝑃𝑉(𝑠)
(B.3)
The deviations in the frequency due to unbalance between generation and demand is
represented by (B.4)

List of Appendices
164
𝛥𝑓(𝑠) =𝐾𝑝
1 + 𝑠𝑇𝑝[𝛥𝑃𝑔(𝑠) − 𝛥𝑃𝐿(𝑠)]
(B.4)
Where 𝐾𝑝 =1
𝐷 and𝑇𝑝 =
2𝐻
𝑓0𝐷.
The primary loop response for frequency control by considering the transfer function is as
follows (B.5). It represents the change in the power system frequency against small load
perturbation.
𝛥𝑓(𝑠) =𝐺𝑝
1 + (1𝑅)𝐺𝑝𝐺ℎ𝐺𝑡
𝛥𝑃𝐿(𝑠)
(B.5)
Where, 𝐺𝑝(𝑠) =𝐾𝑝
1+𝑠𝑇𝑝 , 𝐺𝑡(𝑠) =
𝐾𝑡
1+𝑠𝑇𝑡, 𝐺ℎ(𝑠) =
1
1+𝑠𝑇ℎ
For a step load change (S), the change in demand is represented by 𝛥𝑃𝐿(𝑠) =𝑆
𝑠
The steady-state value of frequency is represented by (B.6).
𝛥𝑓𝑠𝑠 = 𝑙𝑖𝑚𝑠→0
[𝑠𝛥𝑓(𝑠)] = −𝐾𝑝
1 +𝐾𝑝𝑅
𝑆 = −𝑆
𝐷 +1𝑅
𝐻𝑧
(B.6)
2. Secondary Control Loop
The action of the secondary loop for frequency control is governed by (B.7), which is closely
linked with the Unscheduled Interchange (UI) price of Availability Based Tariff (ABT)
mechanism.
𝛥𝑃𝑒 = −𝐾𝑖∫𝛥𝑓 𝑑𝑡
(B.7)
By taking the Laplace transform of (B.8)
𝛥𝑃𝑒 = −𝐾𝑖𝑠𝛥𝑓(𝑠)
(B.8)

List of Appendices
165
Appendix-C
System Data
TABLE C.1 Two area System Parameters
Parameter Unit Value
Base MVA MVA 2000
Pr1, Pr2 MW 2000
PL1, PL2 MW 200
H1,H2 S 5
D1,D2 pu/Hz 0.008
Tg1,Tg2,Tg3,Tg4 S 0.08
Tt1,Tt2, Tt3,Tt4 S 0.3
b1,b2, b3,b4 pu/Hz 0.425
R1,R2, R3,R4 pu/Hz 2.4
T12 pu /Hz 0.55
Pd1 pu 0.01
Kev Kw/Hz 12
Tev S 2
Tp S 24
Kp 120
F Hz 50
TABLE C.2 Battery Model Parameters
Parameter Area 1 Area 2
Nominal Voltage Vrms, V 400 400
Nominal Capacity, Ah 50 50
Energy Capacity, Kwh 16 16
The efficiency of charge and discharge 1 1
Internal Resistance, Ohm 0.352 0.352
TABLE C.3 EV Control Parameters
Parameter Area 1 Area 2
Max. EV Power Pm (kW) 5 5
Kmax, (Kw/Hz) 200 200
SOCmin, SOCmax 30,90 30,90
Delay Time (s) TEV 1 1
No. of EVs 60000 45000

List of Appendices
166
Appendix-D
Advantages of Energy Storage and it’s
Classification
In India, energy storage capacity increased to 23 GWh in 2018. Also, the battery energy
storage demand increased up to 56%. As per the survey carried out in India, the potential
found near to 290 GWh capacity of energy storage at grid-side applications. Electrical
vehicles had consumed batteries of 5 GWh in 2018. By 2025 it may increase up to 36 GWh.
Electrical Vehicle industries have forecasted the demand of the batteries by 110 GWh by
2019-2015.
A. Advantages of Electrical Vehicles (EVs) as Storage
Plug-in Hybrid Electrical Vehicle or Electrical Vehicle is adopted worldwide due to issues
such as environmental and climate changes, fossil fuel reserves, energy security and energy
cost [137][176]. The biggest consumer of oil products is the transportation sector. Green
House Gas (GHG) emission increases due to its consumption. An Electrical Vehicle (EV) or
Hybrid Electrical Vehicle can work as either as loads or as a large distributed power source.
In this way, it can reduce the overall cost and emission of GHG.
Environmental Advantages
The V2G concept is studied in 12 regions of the U.S [178]. It analyses the 27 % reduction in
GHG and 31 % in nitrogen oxide emission reduction. In California using PEV, current
emissions reduced by one third and in future it will reduce by one quarter energy scenario as
compared to Internal Combustion (IC) engine based vehicles [136].

List of Appendices
167
EV Service as an Ancillary Service
In restructured power system ASs are launched for the reliable and safe operation of the
network, to balance generation and load. Bidirectional service of V2G and G2V operation
can provide the ASs such as frequency stability, voltage stability, load balancing and peak
power-saving [39]. With the help of aggregators, it is possible to communicate between the
grid and vehicles.
Voltage and Frequency Regulation
For reactive power, voltage is to be regulated between supply and demand. A voltage
controller can be inbuilt in the battery charger. An inductive and capacitive reactive power
can manage by setting the phase angle [44]. An EV charging can stop during low voltage
condition of the grid and charging can start during high voltage condition of the grid [153].
For frequency regulation among the grid, three loops of AGC are defined such as primary,
secondary and tertiary frequency control [183]. For the primary control loop, grid frequency
is regulated by charging the battery during the high-frequency period and discharging the
battery during the low-frequency period [139]. For secondary and tertiary frequency control
action using EV is possible by distributing the Area Control Error (ACE) signal via
aggregators. EV owner will be in benefit when the vehicle can charge at lower tariff rates
and discharge at higher tariff rates. During the high-frequency period vehicle need to charge,
so the lower tariff rate should activate and for the lower frequency period vehicle need to
discharge, so the higher tariff rate should be activated.
Load Leveling and Peak Power
An EV can balance the energy during the V2G operation by discharging EVs batteries in
peak hours and during the G2V operation, EVs can charge their batteries in off-peak hours.
In [148] smart charging control strategy is described at the local level and globally. The peak
load can be reduced by coordinating the EV battery charger with grid for
charging/discharging activity. It needs development of the bidirectional charge/discharge
controller.

List of Appendices
168
Renewable Energy Supporting and Balancing
The nature of RESs such as solar and wind is intermittent [153]. Among all these RESs wind
power is highly complex. The PHEVs helps to power generated by RESs. The wind speed is
unpredictable, which makes it highly intermittent [13]. If the injection of power is by RESs
is high, the thermal plants or other plants must decrease the power generation. In this
situation, the vehicle battery by charging or discharging can help to match the demand and
supply. So there is no need to change the generated output power of thermal or any other
power plants. The stored energy in the battery can use for driving the vehicle.
Technical issues arise when RES and EVs are connected with grid:
The existing distribution grid is not designed for bidirectional flow. Requirement of Electric
grid infrastructure, communication and control for reliable two-way communication between
aggregators and large EVs, Battery high initial cost, battery degradation, Overloading of
transformer, underground cables and feeders which produce Voltage drop problem,
Harmonics issue.
B. Classification of Energy Storage
The various types of EES are suggested by peoples worldwide are respired in Fig. D.1. The
storage technologies are classified into their functions, time of response and duration of
storage [52] [76] [34].
FIGURE D.1 Types of Electrical Energy Storage Technologies
Types of Storage
Technologies
Mechanical Energy Storage
Pumped Hydro
Storage
Compressed Air Energy
StorageFlywheels
Electrical Energy Storage
CapacitorsSuper
Capacitors
Superconducting Magnetic
Energy Storage
Themal Energy Storage
Low Temperature
Thermal Storage
Aquifers low-temperature
ThermalEnergy Storage
Cryogenic ThermalEnergy Storage
High Temperature
Thermal Storage
Sensible Heat Storage
Latent Heat Storage
Electrochemical Energy
Storage

List of Appendices
169
A. MES
It stores the kinetic energy such as Pumped Hydro Storage (PHS), Compressed Air Energy
Storage (CAES) or Flywheels. The followings are the types of MES.
1. In PHS water is pumped from the bottom to higher location reservoir. The water is
collected during off-peak hours (low demand period) due to the lower rate of
electricity tariff. During the peak-hours (high demand period), the collected water
will release from the high location reservoir to run the hydro turbine to generate
electricity. Worldwide, approximately 127 GW hydro storage plants are there in
operation, which has average efficiency is between 70-80 % [79]. But, in India, due
to the land issue, big storage is difficult to install.
2. In CAES, an air compressor is used to generate pressurized air. During off-peak hours
or low demand period, the generated air is stored in an airtight underground tank with
a pressure ranging between 4 to 8 MPa [110]. The pressurized air used to rotate the
high-pressure turbine by heating or expansion mode during the peak hours or high
demand period. The CAES gives quick response in the generation and compression
mode against significant load variation. The disadvantage of CUS is that if air stored
for a long period, it is converted into water. Also, compressed air is very costly. So,
in the Indian power system, operation of CAES will be costly.
3. The flywheel is an electrochemical system in which rotating cylinder coupled with
magnetic bearings. The mechanical energy of the rotating cylinder converted in
electrical energy through the electrical machine [68].
B. EES
EES classified into electrostatic and magnetic energy storage. The conventional capacitors
and super capacitors stored electrostatic energy and SMES device stored magnetic energy.
The followings are the types of EES.
1. The capacitor stored energy between two electrodes separated by a dielectric
medium. Capacitors can be charged quickly and also, charge or discharge for

List of Appendices
170
several cycles more than the battery [110]. It can be used in short term storage
application due to fast response against sudden load variation. It has the limitation
of capacity and energy density.
2. The super capacitor has a good energy density compared to other devices due to
electrodes made from porous carbon material. These devices can respond quickly
against load changes in a fraction of seconds. The disadvantage is that it can store
energy for a short time and stored energy lost due to self-discharging property
[290].
3. There are two types of super magnetic coils due to operating temperature used in
SMES such as High and Low-temperature coils.
C. TES
Energy is stored using thermal insulation. It is the form of heat either at high or low
temperature.
1. Low-Temperature Thermal Energy Storage (LTTES):
It is sub-classified into two types, such as Aquifers ALTES and Cryogenic TES. In
ALTES, in off-peak chilled water is stored using thermal storage, which is cooled
down by coolant. The chilled water is used during peak hours, which is used to cool
down the air. The hot water returned by the heat exchanger. This type of application
often found in commercial buildings for space cooling, which helps to reduce the
energy cost of an air conditioner [110]. In the United States, Ice Bear Energy is a
famous option to save electricity cost during peak hours [130].
2. High-Temperature Thermal Energy Storage (HTTES):
HTTES is also classified into two types, such as the sensible and latent heat storage
systems. If the temperature of specific material rises or drops, it will absorbs or
releases the heat. Some materials like concrete and ceramics are the solid type of
storage, while molten salt is a liquid type of storage [95].

List of Appendices
171
D. Electro-Chemical Energy Storage
The following are the different techniques of Electro-Chemical Energy Storage.
1. Lead Acid Battery (PbA): This rechargeable battery is much matured, and cost per
unit is cheap [167]. The basic components of the PbA battery are Anode and Cathode
made from Lead Oxide. The aqueous sulfuric acid is used as an electrolyte. It has low
specific energy nearby 25 Wh/kg [110]. Because of the short life cycle and lower
energy density, its application is less suitable in some application. The lead-acid flow
battery with soluble lead, which dissolves in an aqueous methane-sulfuric acid
electrolyte, has the potential to solve [213].
2. Sodium-based high-temperature battery: It is classified as sodium sulphur (NaS),
sodium nickel chloride (NaNiCl2) and ZEBRA batteries. In NaS battery, liquid
sodium (Na) and sulfur (S) material are used for anode and cathode, respectively. It
can work in the temperature range between 300 to 350 0C [7]. Opposite to NaS
battery, ZEBRA battery is used solid metal chloride as a cathode, while anode and
electrolyte are same. ZEBRA battery has less corrosion on the cathode surface as
compared to NaS battery, and also, explosion issue due to metallic sodium can avoid.
Only, the disadvantage is that the power and energy density is low. Li-ion battery is
more popular due to the high range of specific energy from 75 to 125 Wh/kg [7]. But
in the case of overcharge, there is s rise in the temperature, which causes leakage of
chemical from the battery and sometimes explosion. Technically, batteries are very
well developed, but still there is a research scope in the reduction of cost. Other
batteries line Radox Flow Batteries (RFB), where the power and energy components
can independently determine due to its external storage. There are two types of RFB
available such as Vanadium Redox Battery (VRB) as well as Zinc-Bromine Battery
(ZnBr). There are low power and energy density in the RFB, which is a research area.
3. Hydrogen-based Energy Storage: The electricity is converted into hydrogen
through electrolyzers and hydrogen is stored in a metal tank. Electrolyzer technology
is further classified as Alkaline, PEM and SOEC [93]. The stored energy is converted
into electricity by RFC. The various types of fuel cells are there such as PEMFC,

List of Appendices
172
AFC, MCFC, PAFC, DMFC and SOFC. Its life is the long and cheap cost of
manufacturing [244]. The hydrogen is only the by-product [45].

List of Appendices
173
Appendix-E
Fuzzy Logic
The “Fuzzy Logic” was commenced by Lotfi Zadeh in 1965. He had introduced the theory
of fuzzy set. The fuzzy logic theory depends on the experience from which people can take
decisions. The vagueness and inaccurate information are represented by a mathematical
model known as a fuzzy set. In FG, the truth value exists between absolutely true and
absolutely false. The truth values of variables lie in 0 and 1, while in Boolean logic, the truth
value of variables will be number values either 0 or 1.
The mapping process is there between input and output in FG. The primary concept of using
fuzzy logic is making the if-then sentences called the rules. The rules are parallel and its
order is insignificant. The rules define the variables and adjectives. The rules made are set in
a natural way.
If the light is red if my speed is
high
and if the light is close then I brake hard.
If the light is red if my speed is low and if the light is far then I maintain my
speed.
If the light is
orange
if my speed is
average
and if the light is far then I brake gently.
If the light is green if my speed is low and if the light is close then I accelerate.
Also, these models can identify, present, manipulate, interpret vague data and information
and utilize it. From this example, it can be realized that the input variables are appreciated
by the brain. The FG is all about the virtual significance of accuracy.
Some findings from the fuzzy logic are given below.
• It is simple to understand its mathematical models.
• Easy to design any system because of flexibility.
• Most things are imprecise. The data which are not clear are tolerable by fuzzy logic.
• Non-linear complex functions can model by fuzzy logic.

List of Appendices
174
• It can model from the experience of the people.
• The use of fuzzy logic is easy because it is made by the qualitative explanation used
in every day.
Fuzzy logic starts from a fuzzy set. It defined the boundaries and known as a set without a
crisp. It consists of elements having a degree of membership. It is a classical set theory based
on FG set theory [315]. The different shapes of the membership function are such as sigmoid,
hyperbolic, tangent, exponential, Gaussian are used.
Fuzzy Logic System (FLS) is a system that is used to map the non-linear input data to scalar
output data. The Fuzzy Logic System represented in Fig E.1. It consists of the main four
components as follows.
1. Fuzzyfier
2. Rules
3. Inference Engine
4. Defuzifier
Fuzzifier
Inference
Defuzzifier
Rules
Fuzzy Input Fuzzy Output
FIGURE E.1 Fuzzy Logic System
Execution of the FG is as follows.
1. Fuzzification: The input as a crisp set is gathered and converted into a fuzzy set. Here,
the membership values of fuzzy variables are generated using linguistic variables,
membership functions and fuzzy linguistic.
2. Inference: A set of rule plays an important role in the fuzzy inference system.

List of Appendices
175
3. Defuzzification: Here, the fuzzy output of a fuzzy inference system converts into the
original form of crisp out using the membership functions.
A. Fuzzification
It is the method of assigning the arithmetical input of a system to fuzzy sets with some degree
of membership within the interval [0, 1].
If it is 0 then the value does not belong to the given fuzzy set and if it is 1 then the value
completely belongs within the fuzzy set. Any value from 0 to 1 indicates the degree of
improbability.
B. Fuzzy Inference System
It is a procedure to map the known input by FG into output. From the mapping process, one
can take the decision or provide examples. Inference systems of FG are successfully applied
in different areas such as power system, automatic control system, computer engineering, for
data categorization, result investigation, and expert systems. It is also known as fuzzy rule-
based controllers.
The procedure of fuzzy inference contains the Membership Functions (MF), Rules and
Logical Operators.
C. Membership function
It is one type of curve which defines the membership value from 0 to 1 by mapping the input
at each point. This input space is known by “Universe of Discourse”. There is only one clause
is that the MF must be laying in 0 to 1. The various types of MFs are presented in Fig E.2.
1. Triangular.

List of Appendices
176
2. Trapezoidal.
3. Singleton.
4. Gaussian.
5. Piecewise linear.
FIGURE E.2 Types of Membership Functions
D. Linguistic variables
In mathematics, numerical values are considered, where as in fuzzy logic, non-numerical
values are considered. These values are presented by linguistic variables such as young, old
etc. The variables are in the form of rules and facts. Using linguistic variables during
fuzzification operations mapping of arithmetic input into fuzzy MFs is possible. During the
de-fuzzifying operations, it maps the fuzzy output into a "crisp" value. It is helpful in taking
the decision.

List of Appendices
177
E. Fuzzy logic operators
Fuzzy logic operators work like Boolean logic operator. The FG reasoning is a superset of
Boolean logic. The replacement for basic operators AND, OR and NOT are shown below.
The FG operators are called the Zadeh operators.
Boolean
Operators
Fuzzy operators
AND(x,y) MIN(x,y)
OR(x,y) MAX(x,y)
NOT(x) 1 – x
Fuzzy operators give the same result like Boolean expression such as for TRUE it is 1, and
for FALSE it is 0.
F. Fuzzy Rules
In fuzzy logic systems, linguistic variables use fuzzy rules.
IF-THEN rules:
Fuzzy sets are the subjects and fuzzy operators are the verbs of FG theory. For making the
conditional statement of FG, "if-then" rules are used. Formation of a simple fuzzy if-then
rule is given below.
Example: if a is A then b is B.
Here A and B are linguistic values given by fuzzy sets on the ranges (universes of discourse)
a and b, respectively. The if-part of the rule "a is A" is called the premise and the then-part
of the rule "b is B" is called the conclusion. Some examples are given below.
If the temperature is very cold then the fan speed is stopped.
If the temperature is cold, then the fan speed is slow.
If the temperature is warm, then the fan speed is moderate.
If the temperature is hot, then the fan speed is high.
List of Appendices
178
G. Defuzzification
The conversion from a fuzzy set to crisp output is called Defuzzification. In the
Defuzzification the performance will vary according to the output value of the membership
function. The process of Defuzzification is not a part of 'mathematical fuzzy logic'. Several
Defuzzification methods are presented in [120], namely centroid method, the centre of sums
and mean of maxima. The various fuzzy applications in power system are listed below.
1. Contingency analysis
2. Diagnosis/monitoring
3. Distribution planning
4. Load frequency control
5. Generator maintenance scheduling
6. Generation dispatch
7. Load flow computations
8. Load forecasting
9. Load management
10. Reactive power/voltage control
11. Security assessment
12. Stabilization control (PSS)
13. Unit commitment