preventive action plan - ec.europa.eu
TRANSCRIPT

PREVENTIVE ACTION PLAN
CONCERNING THE SECURITY OF GAS SUPPLY IN GREECE 2021
PREVENTIVE ACTION PLAN
In accordance with the provisions of Articles 8 and 9 of Regulation (EU) 2017/1938 concerning measures to safeguard
the security of gas supply and repealing Regulation (EU) No 994/2010
ATHENS
February 2021

Page 2 of 108

PREVENTIVE ACTION PLAN
CONCERNING THE SECURITY OF GAS SUPPLY IN GREECE 2021
Page 3 of 108
REGULATORY AUTHORITY FOR ENERGY
PREVENTIVE ACTION PLAN
TABLE OF CONTENTS
Introduction ................................................................................................. 5
1 Key information on the Regional and National Natural Gas System ..... 6
1.1 Regional Natural Gas System ................................................................. 6 1.2 National system and gas market .......................................................... 37
2 Summary presentation of Risk Assessment ........................................ 49
2.1 Common Risk Assessments ................................................................. 49 2.2 National Risk Assessment .................................................................... 52
3 Conformity to the infrastructure standard .......................................... 62
3.1 Calculation of the N-1 formula at a national level .................................. 63 3.2 Calculation of the N-1 formula at a regional level .................................. 66 3.3 Bidirectional flow capacity ................................................................... 67
4 Conformity to the supply standard ..................................................... 68
4.1 Definition of ‘protected customers’ ....................................................... 68 4.2 Supply standard ................................................................................. 69
5 Preventive measures........................................................................... 76
5.1 Description of actions ......................................................................... 78 5.2 Evaluation of actions ........................................................................... 83
6 Other measures and obligations ......................................................... 91
6.1 Development of specifications and guidelines for the establishment of Business Continuity Systems .......................................................................... 91 6.2 Obligation of operators and electricity generation licence holders to maintain Business Continuity Systems .......................................................................... 91 6.3 Risk Management System planning to ensure the security of supply ....... 92 6.4 Obligations to transmission system operators in respect of substantiated demand assessment ...................................................................................... 92 6.5 Obligations of natural gas suppliers ...................................................... 93 6.6 Obligations of holders of gas-fired electricity generation authorisations ... 94 6.7 Exemption of the diesel used as alternative fuel from excise duty ........... 95
7 Infrastructure projects ....................................................................... 96
8 Obligations of services of general interest relating to security of supply ...................................................................................................... 104
9 Consultations with interested parties ............................................... 105
10 Regional dimension ....................................................................... 106
10.1 Calculation of the N-1 formula at risk group level ................................ 106 10.2 Mechanisms developed for cooperation .............................................. 106

PREVENTIVE ACTION PLAN
CONCERNING THE SECURITY OF GAS SUPPLY IN GREECE 2021
Page 4 of 108
10.3 Solidarity measures .......................................................................... 106
11 Summary – conclusions ................................................................. 107

PREVENTIVE ACTION PLAN
CONCERNING THE SECURITY OF GAS SUPPLY IN GREECE 2021
Page 5 of 108
Introduction
Purpose and methodology
This Preventive Action Plan (hereinafter ‘Plan’) was drawn up by RAE, as the competent Authority, in accordance with the provisions of Articles 8 and 9 of Regulation (EU) 2017/1938 concerning measures to safeguard the security of gas supply and repealing Regulation (EU) No 994/2010 (hereinafter ‘Regulation’).
In drawing up the Plan, RAE worked together with the Hellenic Gas Transmission System Operator SA (DESFA SA), the Independent Power Transmission Operator (ADMIE), and the Ministry of the Environment and Energy (YPEN).
The Plan aims to put forward appropriate measures (actions) with a view to reducing or eliminating the risks that may affect the security of gas supply in Greece.
The Risk Assessment for the period 2020-2022 was completed in May 2020 and served as the basis for drawing up the Plan. The Assessment thoroughly examined the risks that could affect the security of supply and analysed, through simulation, 59 different scenarios of potential disruptions of gas supply and/or demand. The simulation calculated the resulting shortcomings in natural gas mass balance, assessed the impact on electricity generation and on industrial and protected consumers, and estimated the risk involved in each scenario.
This Plan summarises the current measures taken for the security of supply in Greece and addresses new preventive actions relating to:
increasing the use of existing gas infrastructure;
enhancing LNG availability in times of increased risk; and
increasing the degree of readiness of the Operators and other stakeholders to address gas supply risks/disruptions.
The methodology used to determine and assess the actions was based on: (a) the provisions of Regulation (EU) 2017/1938, and (b) the JRC report on good practices and the development of Preventive Action Plans and Emergency Plans1. The key steps taken are as follows:
1. determination of the crisis scenarios to be addressed on the basis of the Risk Assessment, and prioritisation;
2. initial determination of actions deemed to be feasible and capable of supporting the aims of the plan;
3. re-ranking of the scenarios and assessing the effectiveness of the actions in terms of risk mitigation and conformity to the infrastructure and supply standards;
4. estimate of the costs of the actions and of their likely impact on the environment, on the functioning of the market and on the security of supply of another Member State (MS);
5. development and implementation of multi-criterion decision analysis for the assessment of the actions;
1 JRC, Preventive Action Plan and Emergency Plan Good Practices, 2012

PREVENTIVE ACTION PLAN
CONCERNING THE SECURITY OF GAS SUPPLY IN GREECE 2021
Page 6 of 108
6. step-by-step simulation of the implementation of the actions (risk reduction loop) and residual risk assessment.
In addition to the above, the Plan looked into the capability of conforming to the infrastructure standard (N-1 standard), as well as a set of ancillary measures and obligations to strengthen prevention and safe system operation.
Finally, it presents infrastructure projects that are significant for the security of supply in Greece, which are included in list 4 of projects of common interest (PCI List), as well as projects that are in progress which are included in the ten-year development plan of the HNGS.
Structure
The Preventive Action Plan is presented in this document in accordance with the template provided in Annex VI to Regulation (EU) 2017/1938 and includes the following chapters:
Chapter 1: Summarises the key data of the Regional and the National Natural Gas System and the data on the Greek market in natural gas, in terms of the consumption and supply of natural gas.
Chapter 2: Summarises the main conclusions of the Common Risk Assessments as well as the National Risk Assessment (2020) and the guidelines it sets for this Plan.
Chapter 3: Presents the N-1 standard calculation at a national and regional level, along with the values and assumptions used.
Chapter 4: Substantiates the conformity to the supply standard, the measures in place and the additional criteria considered with a view to ensuring the security of supply.
Chapter 5: Describes and assesses the strategies and actions planned with a view to strengthening consumer protection in the event of significant disruptions of gas demand and/or supply.
Chapter 6: Presents ancillary preventive measures and obligations planned with a view to strengthening the secure functioning of the system.
Chapter 7: Describes infrastructure projects for new sources of gas supply and storage.
Chapters 8 and 9: Addresses issues related to the Public Service Obligations (‘PSO’), but also to the process and results of the consultation with stakeholders about the Plan.
Chapter 10: Looks into the possible impact of the Plan on neighbouring Member States (regional aspect).
Chapter 11: Summarises the main conclusions of the Plan.
1 Key information on the Regional and National Natural Gas System
1.1 Regional Natural Gas System
This Chapter provides a brief description of the Regional Natural Gas System for each Risk Group in which Greece participates, according to the model Preventive Action Plan included in Annex VI to the Regulation. The figures presented were collected from

PREVENTIVE ACTION PLAN
CONCERNING THE SECURITY OF GAS SUPPLY IN GREECE 2021
Page 7 of 108
the competent authorities in each Member State and have not been processed any further. The data on the trans-Balkan risk group were collected in 2018 (early 2019) and are presented in the relevant Common Risk Assessment notified to the European Commission in February 2020. Please note that no recent data or significant changes that took place in the area in December 2019 and early 2020 are included herein, as they are to be included in the updated Common Risk Assessment for the trans-Balkan risk group, which is to be prepared in 2021.
1.1.1 Trans-Balkan risk group
The SE part of Europe (Romania, Bulgaria and Greece) is considered to be one of the most vulnerable regions in terms of security of gas supply. The Trans-Balkan risk group is heavily dependent on the largest natural gas supplier, Russia. Natural gas imports from Russia enter the region via the cross-border entry point at Mediesu (EP1), which lies between Ukraine and Romania, and via the Isaccea interconnection (EP2) at the Romania-Moldova border (Figure 1).
Figure 1: Entry points (EPs) and exit points (EXPs) in the trans-Balkan area for 2019
The quantity of Russian gas imported from Romania at EP1 is very limited compared to that imported at EP2. However, only a small percentage of Russian gas imported at EP2 is finally delivered to Romanian consumers, as most of is transmitted to Negru-Voda at the border with Bulgaria. The Bulgarian transmission system includes the gas transmission network used to supply gas to local consumers and the gas transit network that crosses the country at the exit points at the borders with: Turkey (EXP1), Greece (Sidirokastron) and North Macedonia (EXP2) (Figure 1).
Romania is the country least dependent on Russian gas in the area, which is due, on one hand, to its local production that represents around 90 % of its total consumption of gas and, on the other, to the fact that a small quantity of gas is imported from Hungary (via EXP3), Figure 1). On the other hand, Bulgaria’s only source of gas is Russia, except for a small quantity that is produced locally. Greece’s level of differentiation is higher than that of the other countries in the trans-Balkan

PREVENTIVE ACTION PLAN
CONCERNING THE SECURITY OF GAS SUPPLY IN GREECE 2021
Page 8 of 108
risk group, as it also has access to other sources of gas thanks to the Revithoussa LNG Terminal and the Kipi entry point (EXP4), Figure 1), linking Turkey to Greece.
Following is a detailed description of the natural gas system in each MS in the trans-Balkan risk group, i.e. Romania and Bulgaria. A detailed description of the natural gas system of Greece, which is also a member of that group, is included in a subsequent chapter.
1.1.1.1 Romanian Natural Gas System
The first pipeline in the Romanian national transmission system became operational in 1914. The national transmission system (NTS) developed gradually around areas which had large natural gas deposits in the Transylvanian Basin, Oltenia and, later, in Eastern Muntenia (in the south of Romania). The NTS reaches large customers in the Ploiesti - Bucharest area, Moldavia, Oltenia as well as the country’s central (Transylvania) and northern areas.
The main components of the NTS recorded on 31.12.2018 are set out below:
main transmission pipelines along with supply connections covering a total length of 13 381 km, of which 553 km consist of pipelines carrying gas to other countries (international transmission pipelines);
1 130 metering stations to measure gas (1 237 to measure direction);
58 stations using valves to check pressure (valve stations);
metering stations to measure imported gas;
metering stations on the international transmission pipeline system;
3 gas compressor stations, with a total installed capacity of approximately 28.94 MW;
1 039 cathodic protection stations;
902 odour containment stations.
Transmission network and interconnection points
Romania’s transmission system is more than 13 381 km long (Figure 2). The national network has cross-border interconnection points with Moldova (Ungheni), Ukraine (Orlovka/Isaccea and Mediesul Aurit/Tekovo), Bulgaria (Negru Voda/Kardam and Giurgiu/Ruse) and Hungary (Csanapadlota/Nadlac).

PREVENTIVE ACTION PLAN
CONCERNING THE SECURITY OF GAS SUPPLY IN GREECE 2021
Page 9 of 108
Figure 2: Romania’s transmission system
Compressor stations
Compression capacity is provided by a total of 3 compressor stations, set up on the main gas transmission routes, having an installed capacity of approximately 28.94 MW and a maximum compression capacity of 650 000 Nmc/hour or 15 600 000 Nmc/day. All phases of repair/modernisation works were carried out at those compressor stations in the period 2010-2016.
LNG facilities: N/A.
Domestic production and underground storage
Romania’s gas production has stabilised in recent years by extending the lifecycle of investments in existing deposits and developing new investment plans. Romania’s total production exceeded 10 GSm3 in 2017, representing approximately 90 % of Romania’s total gas consumption.
The exploitation of oil resources in the Black Sea is estimated to make a significant contribution towards ensuring the security of energy supply in Romania. Given Romania’s capacity, onshore and offshore gas production is estimated to be able to cover the constantly rising demand for gas from domestic industry.
The primary role of the underground gas storage facility is to ensure the security of gas supply in Romania, by making it possible to balance: domestic consumption - domestic production - natural gas imports from other countries, covering primarily, consumption peaks caused by temperature changes, and also to ensure balance on the national transmission system network, as required by the system operator.
Romania’s total storage capacity at present is 4.5 billion m3/cycle, of which the working gas storage capacity is 3.1 billion m3/cycle and is allocated across 7 operational stores, 6 of which belong to Romgaz, with a working gas storage capacity of 2.8 billion m3, and the other one, with a working gas storage capacity of 0.3 billion m3, is managed by Engie.
More information
(a) Main gas consumption figures

PREVENTIVE ACTION PLAN
CONCERNING THE SECURITY OF GAS SUPPLY IN GREECE 2021
Page 10 of 108
Table 1: Annual final gas consumption and maximum daily gas demand in Romania
2016 2017 2018
Annual final consumption (billion m3) 11.7 12.0 12.2
Maximum demand (million m3/day) 72 72 72

PREVENTIVE ACTION PLAN
CONCERNING THE SECURITY OF GAS SUPPLY IN GREECE 2021
Page 11 of 108
Table 2: Annual gas consumption and maximum daily gas demand per category of gas consumers
2016 2017
Actual data Actual data
Protected customers Non-protected customers
Protected customers Non-protected customers
Solidarity-protected customers
Other Solidarity-protected customers Other
Gas consumption (billion m3) 11.7 12.0
Household sector 3.01 - - 3.77 - -
Commercial sector - - 0.77 - - 0.80
District heating - - 1.12 - - 0.91
Industrial sector (electricity and heat) - - 2.08 - - 2.22
Chemical industry - - 1.16 - - 0.95
Other industrial customers - - 0.50 - - 0.45
Other secondary customers - - 1.62 - - 1.42
Suppliers (third parties) - - 0.49 - - 0.50
Miscellaneous (Technological consumption related to the gas sector activities)
- - 0.95 - - 0.98
Miscellaneous (Energy consumption related to the gas sector activities)
- - 0.004 - - 0.004
Maximum demand (million m3/day) 72 72
Household sector* 18.53 - - 16.69 - -
Commercial sector* - - 4.74 - - 4.64
District heating* - - 6.86 - - 7.03
Industrial sector (electricity and heat)* - - 12.77 - - 12.54
Chemical industry* - - 7.15 - - 8.57
Other industrial customers* - - 3.10 - - 3.65
Other secondary customers* - - 9.96 - - 9.93

PREVENTIVE ACTION PLAN
CONCERNING THE SECURITY OF GAS SUPPLY IN GREECE 2021
Page 12 of 108
Suppliers (third parties)* - - 3.02 - - 2.96
Miscellaneous (Technological consumption related to the gas sector activities)*
- - 5.85 - - 6.09
Miscellaneous (Energy consumption related to the gas sector activities)*
- - 0.02 - - 0.02
2018*
Estimate
Protected customers Non-protected customers
Solidarity-protected customers Other
Gas consumption (billion m3) 12.2
Household sector 3.21 -
Commercial sector - essential social services 0.86 -
District heating 1.14 -
Industrial sector (electricity and heat) - - 2.17
Chemical industry - - 1.14
Other industrial customers - - 0.62
Other secondary customers - 1.62 -
Suppliers (third parties) - 0.48
Miscellaneous (Technological consumption related to the gas sector activities)
- 0.98
Miscellaneous (Energy consumption related to the gas sector activities)
- 0.004
Maximum demand (million m3/day) 72
Household sector* 16.69 - -
Commercial sector - essential social services* 4.64 - -
District heating* 7.03 - -
Industrial sector (electricity and heat)* - - 12.54
Chemical industry* - - 8.57

PREVENTIVE ACTION PLAN
CONCERNING THE SECURITY OF GAS SUPPLY IN GREECE 2021
Page 13 of 108
Other industrial customers* - - 3.65
Other secondary customers* - 9.93 -
Suppliers (third parties)* - - 2.96
Miscellaneous (Technological consumption related to the gas sector activities)*
- - 6.09
Miscellaneous (Energy consumption related to the gas sector activities)*
- - 0.022
*Estimated figures based on data from the Romanian Regulatory Energy Agency and the Romanian Commission for Strategy and Prognosis

PREVENTIVE ACTION PLAN
CONCERNING THE SECURITY OF GAS SUPPLY IN GREECE 2021
Page 14 of 108
(b) Description of the functioning of the gas system
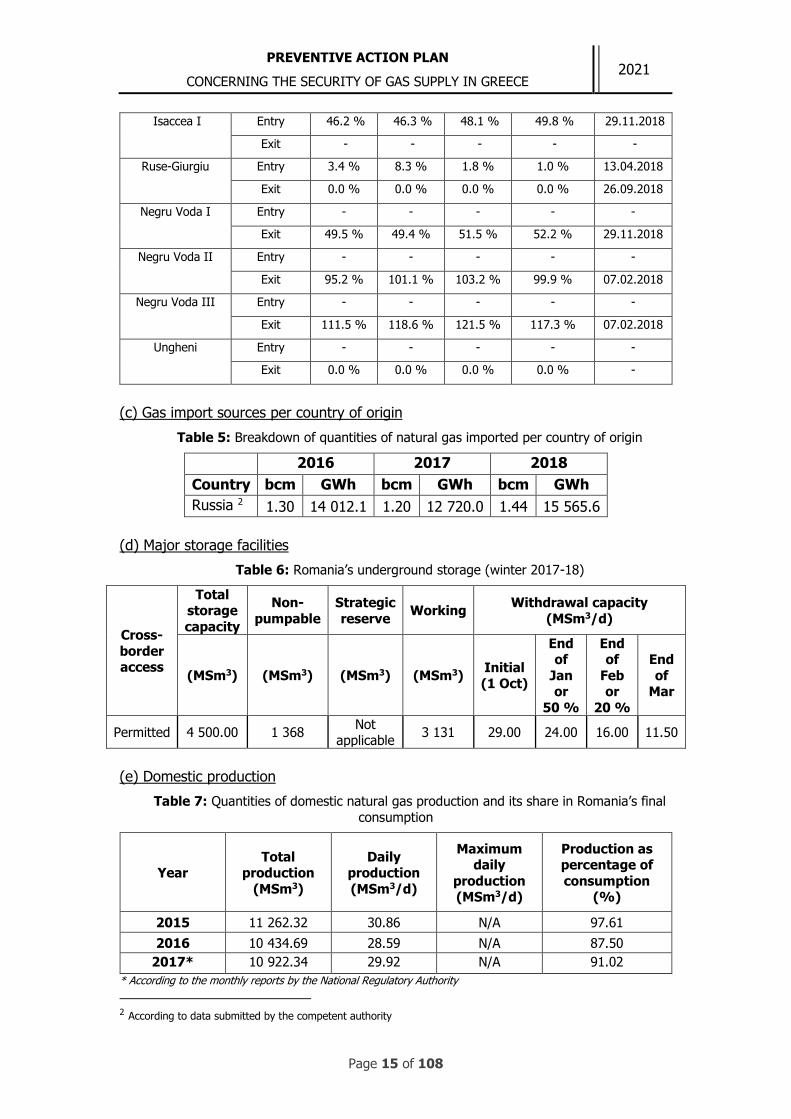
Table 3: Interconnection points with the Romanian natural gas system: Entry/exit
capacity
Interconnection points
Capacity (Sm3/d) - 15°C/15°C
Entry Exit Period
Firm Interruptible Firm Interruptible
Csanapadlota 4 800 000.00 0 240 000.00 up to Sep 2019 From Nov 2019: 2 055 000
4 800 000.00
Mediesul Aurit - Isaccea
34 582 656.00 0 - -
Isaccea II 26 926 027.00 0 - -
Isaccea III 23 425 656.00 0 - -
Isaccea I 18 759 814.00 0 - -
Ruse-Giurgiu Apr 2019 - Feb 2020: 2 520 000.00
0 Oct 2018 - Dec 2019: 148 800.00 Jan 2020 - Mar 2020: 2 055 000.00
0
Negru Voda I -
From Jan 2020:
4 326 720
17 437 617.00 0
Negru Voda II - 26 926 027.00 0
Negru Voda III - 23 425 656.00 0
Ungheni - 120 000.00 0
Table 4: Utilisation rate of interconnection points
Interconnection points
Direction
Utilisation rate (%) / 2016-2017
Average Oct
2017 - 05 Mar 2018
Average Jan
2018
Average Feb
2018
Average Mar to
05.03.2018
Peak day 2018
Csanapadlota Entry 5.5 % 13.7 % 11.1 % 24.3 % 01.03.2018
Exit 0.0 % 0.0 % 0.0 % 0.0 % 29.07.2018
Mediesul Aurit - Isaccea
Entry 18.6 % 21.2 % 20.7 % 47.6 % 04.03.2018
Exit - - - - -
Isaccea II Entry 95.5 % 101.6 % 103.5 % 100.5 % 07.02.2018
Exit - - - - -
Isaccea III Entry 111.5 % 118.9 % 121.4 % 117.6 % 07.02.2018
Exit - - - - -
PREVENTIVE ACTION PLAN
CONCERNING THE SECURITY OF GAS SUPPLY IN GREECE 2021
Page 15 of 108
Isaccea I Entry 46.2 % 46.3 % 48.1 % 49.8 % 29.11.2018
Exit - - - - -
Ruse-Giurgiu Entry 3.4 % 8.3 % 1.8 % 1.0 % 13.04.2018
Exit 0.0 % 0.0 % 0.0 % 0.0 % 26.09.2018
Negru Voda I Entry - - - - -
Exit 49.5 % 49.4 % 51.5 % 52.2 % 29.11.2018
Negru Voda II Entry - - - - -
Exit 95.2 % 101.1 % 103.2 % 99.9 % 07.02.2018
Negru Voda III Entry - - - - -
Exit 111.5 % 118.6 % 121.5 % 117.3 % 07.02.2018
Ungheni Entry - - - - -
Exit 0.0 % 0.0 % 0.0 % 0.0 % -
(c) Gas import sources per country of origin
Table 5: Breakdown of quantities of natural gas imported per country of origin
2016 2017 2018
Country bcm GWh bcm GWh bcm GWh
Russia 2 1.30 14 012.1 1.20 12 720.0 1.44 15 565.6
(d) Major storage facilities
Table 6: Romania’s underground storage (winter 2017-18)
Cross-
border access
Total storage
capacity
Non-
pumpable
Strategic
reserve Working
Withdrawal capacity
(MSm3/d)
(MSm3) (MSm3) (MSm3) (MSm3) Initial (1 Oct)
End of
Jan or
50 %
End of
Feb or
20 %
End
of Mar
Permitted 4 500.00 1 368 Not
applicable 3 131 29.00 24.00 16.00 11.50
(e) Domestic production
Table 7: Quantities of domestic natural gas production and its share in Romania’s final
consumption
Year Total
production
(ΜSm3)
Daily production
(MSm3/d)
Maximum daily
production (MSm3/d)
Production as percentage of
consumption (%)
2015 11 262.32 30.86 N/A 97.61
2016 10 434.69 28.59 N/A 87.50
2017* 10 922.34 29.92 N/A 91.02
* According to the monthly reports by the National Regulatory Authority
2 According to data submitted by the competent authority

PREVENTIVE ACTION PLAN
CONCERNING THE SECURITY OF GAS SUPPLY IN GREECE 2021
Page 16 of 108
(f) Role of gas in electricity generation
Table 8: Share of natural gas in electricity generation in Romania
Year
Share of gas in electricity
generation in Romania (MWe)
Installed capacity of gas-
fired plants (MWe)
Percentage of gas-fired plants out of
total installed capacity (%)
Cogeneration (installed MWe)
Percentage of cogeneration plants out of total installed capacity (%)
Installed capacity of
alternative fuel plants (MWe)
Percentage of alternative fuel
plants out of total NG
capacity (%)
2016 24 714.44 5 791.82 23.43 2 782.07 11.26 1 785.00 30.82
2017 24 736.26 5 788.94 23.40 2 777.13 11.23 1 785.01 30.83
Year Total available capacity (MWe)
Available capacity of gas-
fired plants (MWe)
Percentage of available capacity of gas-fired plants out
of total capacity (%)
Cogeneration (available capacity)
(MWe)
Percentage of available
capacity of cogeneration plants out of total capacity
(%)
Available capacity of
alternative fuel plants (MWe)
Percentage of alternative fuel
plants out of total available NG capacity
(%)
2016 20 927.93 3 737.56 17.86 1 977.83 9.45 1 261.00 33.74
2017 20 890.73 3 702.61 17.72 1 978.89 9.47 1 211.00 32.71

PREVENTIVE ACTION PLAN
CONCERNING THE SECURITY OF GAS SUPPLY IN GREECE 2021
Page 17 of 108
1.1.1.2 Bulgarian Natural Gas System3
In 2017, natural gas consumption in Bulgaria was approximately 33 000 GWh, slightly increased compared to the corresponding consumption in 2016 (approximately 32 000 GWh). The main gas users are companies operating in the energy and chemical industry sectors and the gas distribution network operators as end suppliers.
Bulgaria’s dependence on gas imports was very high in 2017, accounting for more than 95 % of the demand. Domestic/local production has dropped considerably in recent years. Natural gas enters Bulgaria through the territories of the following countries: Russia, Moldova, Ukraine and Romania.
The natural gas transmission system infrastructure in the territory of Bulgaria is owned by Bulgartransgaz EAD and consists of a gas transmission network for transmitting gas to Turkey, Greece and North Macedonia, as well as an underground storage facility in the Chiren area (Chiren UGS), which is directly connected to the national gas transmission system.
Bulgaria’s transmission system (Figure 3) consists of pipelines with a total length of 2 788 km. The transmission network includes connection points with Romania (at Negru Voda / Kardam and Ruse / Giurgiu), Greece (at Кulata / Sidirokastron), North Macedonia (at Gueshevo / Jidilovo) and Turkey (at Strandja / Malkoclar). There are also other entry points to the transmission system from local domestic production (GMS Dolni Dabnik) and offshore production (GMS Galata) points, as well as an interconnection point with the underground storage facility at Chiren.
Figure 3: Bulgaria’s transmission system
The primary purpose of the national transmission system is to transmit gas to users in Bulgaria. The system is constructed of pipelines with a total length of 1 835 km, high pressure branch lines, 3 compressor stations, gas regulating stations, gas metering stations, an electromechanical protection system, cleaning facilities, a communication system, an IT system and various other auxiliary facilities. The transmission system has a technical capacity of 7.4 billion m3/year and a maximum permissible pressure of 54 bar.
3 The information referred to in this chapter has been submitted by the Bulgarian Competent Authority as part
of the preparation of the Common Risk Assessment. The new entry point has not been included in Bulgaria and the trans-Balkan region (Bulgaria-Turkey connection via the Turk Stream pipeline), and it will be included in the ongoing update of the trans-Balkan risk assessment.

PREVENTIVE ACTION PLAN
CONCERNING THE SECURITY OF GAS SUPPLY IN GREECE 2021
Page 18 of 108
The transmission system for natural gas in transit aims primarily to make possible the transit of gas (the system in question is also used to transmit gas to users connected with Bulgaria). It consists of a 953 km-long network of pipelines and 6 compressor stations, an electromechanical protection system, cleaning facilities, a communication system, an IT system and various other auxiliary facilities. Its main role is to transmit quantities of gas from an entry point at the Bulgaria-Romania border to an exit point towards the following countries: Turkey, Greece, and North Macedonia. The gas transit system has a technical capacity of approximately 17.8 billion m3/year in all 3 directions (towards each country) and a maximum permissible pressure of 54 bar.
Bulgartransgaz EAD has built and operates two (2) metering stations with the option of reversing the flow of gas in order to allow comparative measurements between the quantities of gas in the transmission system network for gas in transit and the quantities in the national transmission system: the GMS Ihtiman and GMS Lozenets stations, via which the transmission system operator can transfer quantities of gas to users on both networks.
Compressor stations
There are a total of ten (10) compressor stations set up in Bulgaria. More specifically:
The national transmission system has 3 compressor stations, i.e. Kardam-1, Valchi Dol CS and Polski Senovec CS, with a total installed capacity of approximately 49 MW.
The transmission system network for gas in transit has 6 compressor stations, i.e. Kardam-2, Provadia, Lozenets, Strandzha, Ihtiman and Petrich, with a total installed capacity of 270 MW.
The underground gas storage facility at Chiren (Chiren UGS) also has a compressor station with a total installed capacity of approximately 9 MW.
LNG facilities: N/A.
Domestic production and underground storage
Domestic production covers less than 5 % of the annual consumption, while the rest is covered by natural gas imports. The underground storage facility at Chiren, (Chiren UGS) was built near the village of Chiren in a landscaped cavity in which compressed gas deposits have been depleted. The facility is fitted with specialised underground and surface equipment needed to ensure the feed-in, withdrawal and quality of the gas stored. The Chiren UGS facility has 24 drills in operation and a compressor station. It has a technical capacity of 550 million m3 (1 300 MSm3 of total gas capacity minus the 750 MSm3 of gas which represents the so-called gas safety cushion).
The feed-in and production technical capacities for the Chiren UGS facility are given below:
Table 9: Feed-in and production technical capacities for the Chiren UGS facility
Technical capacity Feed-in Production
Daily maximum 3 105 million m3/day 3 341 million m3/day
Daily minimum 0.4645 million m3/day 0.4645 million m3/day
(At standard temperature conditions T=15°C and pressure P=0.101325 MPa)

PREVENTIVE ACTION PLAN
CONCERNING THE SECURITY OF GAS SUPPLY IN GREECE 2021
Page 19 of 108
More information
(a) Main gas consumption figures
Table 10: Annual final gas consumption and maximum daily gas demand in Bulgaria
2016 2017 2018
Annual final consumption (billion m3) 3.0 3.1 3.0
Maximum demand (million m3/day) 14.1 16.1 15.1

PREVENTIVE ACTION PLAN
CONCERNING THE SECURITY OF GAS SUPPLY IN GREECE 2021
Page 20 of 108
Table 11: Annual gas consumption and maximum daily gas demand per category of gas consumers
2016 2017
Actual data Actual data
Protected customers Non-protected customers
Protected customers Non-protected customers
Solidarity-protected customers
Other
Solidarity-protected customers
Other
Gas consumption (billion m3) 3.0 3.1
Industry 0.13 1.37 0.10 1.41
Electricity generation 0.04 0.46 0.04 0.47
District heating 0.06 0.68 0.06 0.72
Household sector 0.07 0.00 0.08 0.00
Other 0.02 0.20 0.02 0.21
Maximum demand (million m3/day)
14 / 20.01.2016 16.1 / 10.01.2017
Industry 0.74 5.74 0.59 6.75
Electricity generation 0.75 1.94 0.76 2.24
District heating 0.16 2.84 0.17 3.42
Household sector 0.59 0.00 0.69 0.00
Other 0.46 0.83 0.48 0.99

PREVENTIVE ACTION PLAN
CONCERNING THE SECURITY OF GAS SUPPLY IN GREECE 2021
Page 21 of 108
2018
Estimate
Protected customers Non-protected customers
Solidarity-protected customers Other
Gas consumption (billion m3) 3.0
Industry 0.15 1.37
Electricity generation 0.04 0.45
District heating 0.06 0.64
Household sector 0.09 0.00
Other 0.02 0.21
Maximum demand (million m3/day) 15.1
Industry 0.83 6.21
Electricity generation 0.73 2.05
District heating 0.15 2.91
Household sector 0.75 0.00
Other 0.50 0.97

PREVENTIVE ACTION PLAN
CONCERNING THE SECURITY OF GAS SUPPLY IN GREECE 2021
Page 22 of 108
(b) Description of the functioning of the gas system
Table 12: Interconnection points with the Bulgarian natural gas system: Entry/exit
capacity
Interconnection points
Capacity (MSm3/d)
Entry Exit Period
Firm Interruptible Firm Interruptible
Negru
Voda 1(RO)/Kardam (BG)
19.92 7.29
Negru Voda 2, 3
(RO)/Kardam (BG) 57.25
Kulata
(BG)/Sidirokastron (GR)
4.2 0.59 10 882 0.147
Ruse (BG)/Giurgiu
(RO) 0.15 0.732
Kyustendil
(BG)/Zidilovo (MK) 2.53
Strandzha (BG)/Malkoclar (TR) 44.35
Table 13: Utilisation rate of interconnection points
Interconnection
points Direction
Utilisation rate (%) / 2017-2018
Average
Oct 2017 -
05 Mar 2018
Average
Jan 2018
Average
Feb 2018
Average
Mar to 05.03.2018
Peak
day 2018
Negru
Voda 1(RO)/Kardam (BG)
Entry 40 43 45 46 75
Exit 0 0 0 0 0
Negru Voda 2, 3
(RO)/Kardam (BG)
Entry 93 97 92 87 98
Exit - - - - -
Kulata
(BG)/Sidirokastron (GR)
Entry 6 10 2 9 4
Exit 93 90 99 91 99
Ruse (BG)/Giurgiu
(RO)
Entry 0 0 0 0 0
Exit 9 22 5 2 29
Kyustendil (BG)/Zidilovo (MK)
Entry 34 48 57 33 62
Strandzha
(BG)/Malkoclar (TR)
Exit 0 0 0 0 0
Entry 94 97 98 86 100
(c) Gas import sources per country of origin
Table 14: Breakdown of quantities of natural gas imported per country of origin

PREVENTIVE ACTION PLAN
CONCERNING THE SECURITY OF GAS SUPPLY IN GREECE 2021
Page 23 of 108
2016 2017 2018
Country bcm GWh bcm GWh bcm GWh
Russia 2.9 30 758 3.0 32 793 3.0 31 630
(d) Major storage facilities
Table 15: Bulgaria’s underground storage (winter 2017-18)
Underground storage (winter
2017-18)
Cross-border access
Total storage capacity
Non-pumpable
Strategic reserve
Working Withdrawal capacity
(MSm3/d)
(MSm3) (MSm3) (MSm3) (MSm3) Initial (1 Oct)
End of
Jan or
50 %
End of
Feb or
20 %
End of
Mar
UGS CHIREN Permitted 1 300 750 248 550 0 3.2 2.85 2.1
(e) Domestic production
Table 16: Quantities of domestic natural gas production and its share in Bulgaria’s final
consumption
Year
Total
production
(GSm3)
Daily
production
(MSm3/d)
Maximum
daily production*
(MSm3/d)
Production as
percentage of consumption
(%)
2015 0.078 0.21 0.34 3
2016 0.072 0.2 0.416 2.5
2017 0.055 0.5 0.373 2
(f) Role of gas in electricity generation
Bulgaria’s total power generation capacity is 12 500 MWe. For the time being, gas production capacity is 630 MWe (5 % of the total capacity). In addition, a major part of the coal-fired power stations use gas for ignition.
At present, total cogeneration capacity in Bulgaria is 505 MWe (4 % of total capacity), of which 470 MWe is for district heating stations using gas as main fuel.

PREVENTIVE ACTION PLAN
CONCERNING THE SECURITY OF GAS SUPPLY IN GREECE 2021
Page 24 of 108
1.1.2 Algerian risk group
The Algerian risk group consists of the following countries: Austria, Croatia, France, Greece, Italy, Malta, Portugal, Spain and Slovenia.
The above countries are shown in Figure 4.
Figure 4: The countries comprising the Algerian risk group
Following is a short description of the natural gas system for each Member State in the Algerian Risk Group. A detailed description of the natural gas system of Greece, which is also a member of that group, is included in a subsequent chapter.
1.1.2.1 Natural gas systems in the risk group
The table below shows the names of the interconnection points per country involved.
Interconnection points
Table 17: Interconnection points per Member State in the Algerian risk group
Memb
er
State
Interconnection points
1 2 3 4 5 6 7
Austria Oberkap
pel
(Austria
<-
>Germa
ny)
Überackern
(Austria<-
>Germany)
Arnoldst
ein
(Austria
<-
>Italy)
Baumgar
ten
(Austria
<-
>Slovaki
a)
Mosonmagyár
ovár (Austria-
>Hungary)
Murfeld/Ce
ršak
(Austria-
>Slovenia)

PREVENTIVE ACTION PLAN
CONCERNING THE SECURITY OF GAS SUPPLY IN GREECE 2021
Page 25 of 108
Croatia Rogatec (with
Slovenia)
Drávaszerda
hely (with
Hungary)
France VIP Pirineos (Larrau
and Biriatou)
Oltingue Jura Alveringe
m
Taisnieres Dunkerque Obergailb
ach
Greece Kipi (TR) / Kipi (GR)
Sidirokastro
n
Hunga
ry
Beregdaróc
Italy Mazara del vallo
Gela Tarvisio
Gorizia
Gries Pass
Malta
Portug
al
Campo Maior
Valenca do
Minho
Spain Tarifa Almeria Larrau Irun Badajoz Tuy
Sloveni
a
Sempeter
Rogatec Cersak
Length of network pipelines in each country for the transmission and distribution networks
Table 18: Length of the network of natural gas pipelines (transmission and distribution)
per Member State in the Algerian risk group
Member State in the Algerian risk group*
Network of pipelines (km)
Transmission network (km)
Distribution network (km)
Austria 42 829 3 092
39 737
Croatia 2 694 952 1 742
France 37 253 8 760 28 493
Greece - 1 465.13 -
Italy 34 006 Ν/Α Ν/Α
Malta Ν/Α Ν/Α Ν/Α
Portugal 1 375 Ν/Α Ν/Α
Spain 81 000 Ν/Α Ν/Α
Slovenia 1 121 Ν/Α Ν/Α
*Data for Greece are presented in the following chapters.
LNG gasification facilities
Table 19: LNG gasification facilities per Member State in the Algerian risk group
Member State in the
risk group
Location of LNG facility LNG facility capacity
(2016)
Austria Ν/Α Ν/Α

PREVENTIVE ACTION PLAN
CONCERNING THE SECURITY OF GAS SUPPLY IN GREECE 2021
Page 26 of 108
Croatia Ν/Α
France Dunkerque, Montoir-de-Bretagne, Fos-Cavaou and For-
Tonkin
1 370 000 m3
Italy Adriatic (Cavarzere) offshore,
Panigaglia, Livorno offshore
427 160 m3
Malta Ν/Α Ν/Α
Portugal Sines 390 000 m3
Spain Barcelona, Cartagena, Huelva,
BBG, Sagunto and Reganosa
3 308 680 m3
Slovenia Ν/Α
Greece Revithoussa 130 000 m3
1.1.2.2 More information
(a) Main gas consumption figures
The total annual consumption (for 2016) for all countries in the Algerian risk group is
approximately 1 778 493 GWh, while total maximum daily demand is approximately
10 577 GWh/day.
Table 20: Quantities of gas consumed per Member State in the Algerian risk group in
2016
Gas consumption (GWh)
(data for 2016)
Total annual
consumptio
n
Summer
consumptio
n
Winter
consumption
Maximum
daily
consumptio
n
Minimum
daily
consumptio
n
Austria 87 914 27 380 66 561 600 90
Croatia 27 141 8 698 20 232 175 23
France 491 332 144 711 355 869 3 153 416
Greece 44 419 19 215 29 568 276 40
Italy 742 453 257 161 506 836 4 481 836
Malta 118 - 118 - -
Portugal 54 513 27 120 32 520 247 72
Spain 321 443 137 419 191 486 1 589 567
Slovenia 9 278 3 304 6 305 56 13
TOTAL 1 778 493 625 008 1 209 495 10 577 2 057
(b) Gas import sources per country of origin
The area relating to the Algerian risk group includes 4 interconnection points (submerged pipelines) via which gas is imported from Algeria, i.e. two in Spain (Tarifa and Almeria) and two in Italy (Mazara del Vallo and Gela) with a total capacity of 1 961 GWh/d.

PREVENTIVE ACTION PLAN
CONCERNING THE SECURITY OF GAS SUPPLY IN GREECE 2021
Page 27 of 108
The area also has 16 gasification units. The volume of LNG received by those gasification units from Algeria was 110 TWh in 2016 and 90 TWh4 in 2017.
Overall, gas imports from Algeria for the risk group concerned are estimated at 27 % of total imports of the Member States comprising it for 2016 and 23 % for 2017.
The table below details the quantities of Algerian LNG per country of import (estimate from ENTSO-G-Union Wide Simulation).
Table 21: Share of Algerian LNG in the total LNG supplied to each Member State in the
Algerian risk group
Member State in the risk group Share of Algerian LNG as a
percentage (%) of total LNG
supplied
Austria 0
Croatia 0
France 67 %
Italy 3 %
Malta 0
Portugal 12 %
Spain 21 %
Slovenia 0
Greece 100 %
(c) Major storage facilities
Table 22: Storage facilities per Member State in the Algerian risk group
Member State in
the
Algerian risk group
Number of storage
facilities Total capacity (working
gas) (TWh)
Feed-in
capacity
(GWh/d)
Withdrawal
capacity
(GWh/d)
Austria 11 90 552 Ν/Α 1 038
Croatia 1 5 065 45.43 60.57
France 15 134 465 1 220 2 389
Italy 12 194 526 Ν/Α 2 868
Malta 0 Ν/Α Ν/Α Ν/Α
Portugal 1 3 839 24 129
Spain 4 32 059 127 239
Slovenia 0 Ν/Α Ν/Α Ν/Α
Greece 0 Ν/Α Ν/Α Ν/Α
(d) Domestic production
4 Use of additional data from BP Statistical Review and ENTSO-G.

PREVENTIVE ACTION PLAN
CONCERNING THE SECURITY OF GAS SUPPLY IN GREECE 2021
Page 28 of 108
The table below presents the production capacity in each Member State in the risk group. The total production capacity is approximately 262 GWh/year.
Table 23: Gas production capacity per Member State in the Algerian risk group and
share in annual consumption for 2016
Gas production in 2016 (GWh)
Maximum
production
Total
consumption
2016
Production as a
percentage (%) of total
annual consumption
Austria 41 87 914 0.05 %
Croatia 37 27 141 0.14 %
France - 491 332 -
Greece - 44 419 -
Italy 179 742 453 0.02 %
Malta - - -
Portugal - 54 513 -
Spain 5 321 443 0.00 %
Slovenia - 9 278 -
TOTAL 262 1 778 493 0.01 %
(e) Role of gas in electricity generation
Table 24: Installed capacity of gas-fired power plants per Member State in the Algerian
risk group
Installed capacity of gas-fired power plants (ΜWe)
Austria 4 820
Croatia 731
France 11 679
Greece 5 202
Italy 39 510
Malta 358
Portugal 3 829
Spain 32 323
Slovenia 84
TOTAL 98 536

PREVENTIVE ACTION PLAN
CONCERNING THE SECURITY OF GAS SUPPLY IN GREECE 2021
Page 29 of 108
1.1.3 Ukrainian risk group
The Ukrainian risk group consists of the following countries: Austria, Bulgaria, Croatia, Czechia, Germany, Greece, Hungary, Italy, Luxembourg, Poland, Romania, Slovenia and Slovakia.
The above countries are shown in Figure 5.
Figure 5: The countries comprising the Ukrainian risk group
Following is a description of the natural gas system for each Member State in the Ukrainian risk group. A detailed description of the natural gas system of Greece, which is also a member of that group, is included in a subsequent chapter.
1.1.3.1 Natural gas systems in the risk group
Austria
Austria’s transmission system consists of pipelines with a total length of 1 690 km. It has six interconnection points with other countries, i.e. two with Germany (Oberkappel and Überackern/Burghausen), one with Slovakia (Baumgarten), one with Hungary (Mosonmagyarovar), one with Slovenia (Murfeld/Ceršak) and one with Italy (Arnoldstein/Tarvisio). The most important entry point in terms of technical capacity is Baumgarten (which has a technical capacity of 217.42 million m3/day5) via which natural gas from Russia enters the country (roughly 80 % of all imports). Austria’s domestic production fell in the last year to around 1 GSm3 compared to the previous year.
Gas storage facilities have a total capacity (volume of working capacity/tank working volume) of 8.53 GSm3. These storage facilities, which are directly connected to the Austrian gas system, have a capacity of 5.75 GSm3.
510.6167 kWh/Sm³, 15° C, 1 bar.

PREVENTIVE ACTION PLAN
CONCERNING THE SECURITY OF GAS SUPPLY IN GREECE 2021
Page 30 of 108
Austria’s total annual final consumption was 5.3 GSm3 in 2015, most of which relates to the industrial sector (3.0 GSm3).
Bulgaria
See Trans-Balkan risk group.
Croatia
Croatia’s transmission system consists of pipelines with a total length of 2 765 km. The transmission system has cross-border interconnection points with Slovenia (Rogatec) and Hungary (Dravaszerdahely), which are normally used to import natural gas. There are also seven entry points from gas production stations and one interconnection point with the Okoli underground storage facility.
The upstream pipelines in the Adriatic Sea are used to export natural gas from Croatia to Italy. The Panon gas fields are connected to upstream pipelines on the transmission network and to the Okoli underground gas storage facility.
The Okoli underground storage facility (553 million m3) is located at Okoli and belongs to ‘Underground Gas Station d.o.o’.
Croatia plans to install a LNG station on the island of Krk with a storage capacity of 265 000 m3 of LNG, with a nominal gasification capacity of 8 billion m3 of gas per year.
Total consumption in 2016 was 106 MSm3.
Czechia
Czechia’s transmission system consists of pipelines with a total length of 2 637 km. There is also another gas transmission system consisting of pipelines with a length of 1 181 km (based on actual data for 2018). The transmission system has three cross-border interconnection points with Germany (Hora Svaté Kateřiny, Brandov, Waidhaus), one with Poland (Cieszyn), one with Slovakia (Lanžhot) and one entry point from Germany (Olbernhau). The storage system is set up at eight specific locations (Tvrdonice, Dolní Dunajovice, Štramberk, Lobodice, Třanovice, Háje, Uhřice, Dambořice) and can store a total volume of 3 177 million m3.
Total consumption in 2017 was 8 527 million m3.
Germany
Germany’s transmission system has a total length of 38 000 km, broken down into two main regions, one supplying L-Gas and the other supplying H-Gas. The H-Gas transmission system is interconnected with Denmark (1 interconnection), Norway and the gas fields located in the North Sea (2 interconnections), the Netherlands (2 interconnections), Belgium (1 interconnection), Luxembourg (1 interconnection), France (1 interconnection), Switzerland (1 interconnection), Austria (4 interconnections at Überackern/Burghausen, Kiefersfelden, Oberkappel and Lindau), Czechia (5 interconnections at Brandov/Stegal, Olbernhau/Hora Svaté Kateřiny, Hora Svaté Kateřiny/Deutschneudorf, Opal/Brandov and Waidhaus), Poland (2 interconnections at Mallnow and Lasów) and Russia (1 interconnection). The L-Gas Transmission System has 4 interconnections with the Netherlands. The gas storage system consists of 37 facilities with a total storage capacity of 225.3 GSm3 (of which 2.1 GSm3 is used exclusively for L-Gas). Domestic production in 2016 exceeded 6.5 GSm3, compared to domestic consumption of approximately 84 GSm3. Finally, Germany has no LNG gasification facility.

PREVENTIVE ACTION PLAN
CONCERNING THE SECURITY OF GAS SUPPLY IN GREECE 2021
Page 31 of 108
Greece
See following chapters.
Hungary
Hungary’s transmission system consists of transmission pipelines with a total length of 5 928 km. The gas transmission system has cross-border interconnection points with Ukraine (Beregdaroc), Slovakia (Balassagyarmat), Austria (Mosonmagyarovar), Croatia (Dravaszerdahely), Romania (Csanadpalota) and one exit point to Serbia (Kiskundorozsma). The Hungarian storage system consists of five storage units with a total capacity (working volume) of 6.330 GSm3. Average total annual consumption ranges from 9 to 10 GSm3, based on readings from recent years, at transmission system operator level. Domestic production represents up to 20 % of annual consumption, but average production is estimated at 1.61 GSm3/year (based on data for the period 2014‒2016).
Italy
The Italian transmission system has a length of over 32 000 km. The network concerned has cross-border interconnection points with Austria (Tarvisio/Arnoldstein), Slovenia (Gorizia/Sempeter) and Switzerland (Griess Pass). Moreover, Italy procures natural gas via two offshore interconnections, i.e. the Transmed pipeline (with Tunisia and Algeria) and the Greenstream pipeline (with Libya). A new interconnection is under construction and will become operational in 2020. There are 3 entry points for LNG facilities (Panigaglia, Livorno and Cavarzere) and 12 exit points from storage units with a total capacity of approximately 17 GSm3. Domestic production (standing at 5.6 GSm3/year in 2016) indicates a historic downward trend in production, due to the reduction in domestic sources, which is not being adequately compensated for, however, by new production development projects.
Total gas consumption in Italy stood at 75.1 GSm3 in 2017.
Luxembourg
Luxembourg’s transmission system consists of high-pressure transmission pipelines with a total length of 281.8 km. The transmission system infrastructure belongs to and is operated by the local company Creos. Luxembourg is supplied with gas primarily through 3 entry points, i.e. 2 from Belgium and 1 from Germany. A previously existing low capacity interconnection with France was shut down in 2016. The two entry points from Belgium have a total technical capacity of 180 000 Nm3/hour. The technical capacity at the entry point from Germany is limited to 150 000 Nm3/hour, while the minimum flow must be 90 000 Nm3/hour to comply with the N-1 infrastructure standard.
The transmission system’s total technical capacity is 330 000 Nm3/hour.
The transmission system carries gas to 59 pressure reducing substations (to feed it into the distribution system and from there to household customers).
No gas transit is possible at present due to operating restrictions. Moreover, there is no other source of supply or storage facility connected to the transmission system.
The system’s highest peak (maximum demand for gas) in the last decade stood at 296 550 Nm3/hour and was recorded in 2012. However, due to the decommissioning of the combined cycle gas turbine (CCGT) production plant in July 2016 (which had a technical capacity of 375 MWe), the system’s peak demand dropped significantly to 204 780 Nm3/hour in 2016.

PREVENTIVE ACTION PLAN
CONCERNING THE SECURITY OF GAS SUPPLY IN GREECE 2021
Page 32 of 108
Due to demand from the Luxembourg market and the decommissioning of the CCGT plant, more natural gas comes from Belgium than from Germany. The percentage of gas flows from Belgium was 70.7 % in 2017.
Poland
Poland’s transmission system consisted of high-pressure transmission pipelines with a total length of 10 989 Km at the end of 2016. The Polish transmission system is so designed as to comprise two cooperating systems for high- and low-calorific gas. There is also the Yamal-Europe pipeline with a length of 684 km.
Historically, the Polish transmission system has been dependent on the supply of gas from the east. There are 6 main entry points to the transmission system located at Drozdowicze (i.e. entry point from Ukraine), Wysokoje (Belarus), Lwôwek and Wtoctawek (on the Yamal-Europe pipeline), Lasów (from Germany), Cieszyn (from Czechia). Since June 2016, the Polish transmission system has been capable of sourcing natural gas from the LNG facility at Świnoujście (with a capacity of 5 bcm/year). At present, Poland is developing investment projects along the North-South pipeline to improve energy security and bolster its own competitiveness and that of other countries in Central and Eastern Europe and in the Baltic Sea region. Poland’s top priorities are the expansion of the LNG facility at Świnoujście and the construction of a pipeline project in the Baltic Sea. The LNG facility at Świnoujście will be upgraded to increase gasification capacity and also increase the range of LNG services. Construction of the pipeline in the Baltic Sea is under way, in cooperation with Denmark, to provide direct access to the quantities of gas existing in Norway. These investments, coupled with the expansion of the domestic transmission infrastructure and the construction of cross-border interconnections with neighbouring systems, will lay the foundation for a secure, competitive gas market in Central and Eastern Europe and in the Baltic Sea region. The Polish natural gas system has 7 underground natural gas stores (with a total volume of 3.150 bcm).
Total natural gas consumption in Poland stood at 16.9 GSm3 in 2016.
Romania
See Trans-Balkan risk group.
Slovakia
The total volume of gas transmitted via the transmission system, with a total length of 2 270 km, was 60.6 bcm in 2016. Given the large quantity of natural gas carried to Europe by Eustream, said operator is one of the most important ones.
The transmission system also has 4 compressor stations at Veľké Kapušany, Jablonov nad Turňou, Veľké Zlievce and Ivanka pri Nitre. The transmission system’s total capacity exceeds 90 bcm/year. Natural gas is transmitted via the transmission system to the designated area via domestic stations to the distribution networks and then to end customers. Measures to allow reverse flows within the Slovakian transmission system were put in place on 30 November 2011. So now it is possible to transmit between the east and west regions of Slovakia the quantity of gas needed during the highest peak consumption period, which occurs in Slovakia in winter months.
Slovakia operates interconnection points with the following neighbouring countries: Austria (Baumgarten cross-border point), Czechia (Lanzhot cross-border point), Hungary (Vel'ké Zlievce cross-border point) and Ukraine (Vel'ké Kapusany and

PREVENTIVE ACTION PLAN
CONCERNING THE SECURITY OF GAS SUPPLY IN GREECE 2021
Page 33 of 108
Budince cross-border points). More specifically, interconnections were developed with Czechia in 2009 and with Austria in 2010, to get Slovakia ready in case of a crisis (based on the relevant emergency level) and in order for the physical reverse flow of natural gas to Slovakia to be secured.
Slovakia also has underground cavities in various geological formations in its territory, which are suitable for the construction of underground gas storage facilities. At present, there are two companies active on the market which operate the natural gas storage system, i.e. NAFTA (based in Bratislava) and POZAGAS (based on Malacky). Slovakia’s total storage capacity is 3.35 bcm, representing over 65 % of final annual consumption. The storage facilities are located in the SW part of the country, near the border with Austria and Czechia.
Slovenia
Slovenia’s transmission system is connected to Austria (Murfeld/Ceršak), Italy (Gorizia/Sempeter) and Croatia (Rogatec). Slovenia’s natural gas system does not have any storage systems or any gas production capacity. The gas consumption graphs for the period 2014‒2016 show a continuous rise in consumption, reaching 860 MSm3/year.
1.1.3.2 More information
(a) Main gas consumption figures
The total consumption is approximately 220 GSm3, and the maximum daily system demand in the period 2018/2019 was approximately 1 400 GSm3/day.
(b) Description of the functioning of the gas system
Table 25: Interconnection points per Member State in the Ukrainian risk group and
technical capacity (MSm3/d)
January 2019
Bulgaria -
Germany
Bocholtz 45.3
Bocholtz-Vetschau 1.3
Dornum 68.5
Ellund 2.8
Elten/Zevenaar 46.6
Emden EPT 48.9
Eynatten/Raeren/Lichtenbusch 29.2
Greifswald NEL 64.1
Greifswald Opal 101.7
Haanrade 0.5
Oude Statenzijl H Gasunie 5.6
Oude Statenzijl H OGE 6.2
Oude Statenzijl L 30.2
Vreden/Winterswijk 20.1
Total 471.0
Greece
Kipi (TR) / Kipi (GR) 4.5

PREVENTIVE ACTION PLAN
CONCERNING THE SECURITY OF GAS SUPPLY IN GREECE 2021
Page 34 of 108
Hungary
Beregdaróc 1400 71.3
Italy
Mazara del vallo 110.8
Gela 49.3
Total 160.1
Luxembourg
GDLux (BE) / Bras Petange (LU) 4.3
Poland
Tieterowka 0.7
Kondratki 104.7
Wysokoje 15.8
Drozdovichi (UA) - Drozdowicze (PL) 16.5
Total 137.7
Slovakia
Uzhgorod (UA) - Velké Kapušany (SK) 227.4
Budince 23.6
Total 250.9
Romania
Isaccea (RO) - Orlovka (UA) I 18.8
Isaccea (RO) - Orlovka (UA) II 26.9
Isaccea (RO) - Orlovka (UA) III 23.4
MediesulAurit 34.6
Total 103.7
LNG gasification facilities
Table 26: Technical capacity for LNG gasification in each Member State in the Ukrainian risk
group
January 2019 MSm³/d
Greece 20.26
Italy 51.9
Poland 14.4
(c) Gas import sources per country of origin: Mainly from Russia.
(d) Major storage facilities
The table below shows the gas storage capacity and the access regime.
Table 27: Gas storage capacity per Member State in the Ukrainian risk group
Storage capacity (GSm3)7
Data for 2018
Working gas Reserve Total storage capacity
Cross-border access
6 Upon completion of the works for upgrading the gasification facility 7 Data submitted by the competent authorities for the Ukrainian risk group

PREVENTIVE ACTION PLAN
CONCERNING THE SECURITY OF GAS SUPPLY IN GREECE 2021
Page 35 of 108
Austria 5.744 - 5.744 Yes
Bulgaria 0.141 0.509 0.650 Permitted
Croatia 0.532 - 0.532 Yes
Czechia 3.121 - 3.121 N/A
Germany 25.339 - 25.339 -
Greece - - - -
Hungary 4.670 - 4.670 -
Italy 13.065 4.620 17.685 Permitted
Luxembourg - - - -
Poland 3.150 - 3.150 -
Romania 3.075 - 3.075 No
Slovakia - - - Yes
Slovenia - - - -
TOTAL 62.332 5.129 67.461
The percentage by which total annual consumption is covered by total storage capacity in each country in the risk group is shown below.
Table 28: Total storage capacity as a percentage of annual gas consumption per
Member State in the Ukrainian risk group
Member State Total storage capacity (GSm3)
working gas
Annual total consumption
(GSm3/year)
Percentage of annual consumption
coverage
Austria 5.744 5.293 108.52 %
Bulgaria 0.55 3 18.33 %
Croatia 0.532 0.106 501.89 %
Czechia 3.177 8.527 37.26 %
Germany 25.339 84 30.17 %
Greece - 5 -
Hungary 6.33 9.5 66.63 %
Italy 17.685 75.1 23.55 %
Luxembourg - - -
Poland 3.150 16.9 18.20 %
Romania 3.075 12.1 25.87 %
Slovakia 3.35 5.15 65.05 %
Slovenia - 0.86 -
TOTAL 68.912 225.536 30.55 %
The table below shows the maximum daily gas withdrawal capacity at different
filling levels at the storage facility coupled with peak demand (Dmax) for natural gas.
Table 29: Maximum daily gas withdrawal capacity per filling level at the storage facility
coupled with gas peak demand per Member State in the Ukrainian risk group
Withdrawal capacity MSm3/d, 2019

PREVENTIVE ACTION PLAN
CONCERNING THE SECURITY OF GAS SUPPLY IN GREECE 2021
Page 36 of 108
Member State
Filling level
100 %
Filling level
30 %
Gas peak
demand
(Dmax)
Dmax
coverage rate as a
percentage (%) of daily
withdrawal
capacity (filling level
100 %)
Dmax
coverage rate as a
percentage (%) of
daily
withdrawal capacity
(filling level
30 %)
Austria 66.4 44.4 55.3 100 % 80.29 %
Bulgaria 4.2 2.9 18.2 23.08 % 15.93 %
Croatia 5.8 3.2 16.6 34.94 % 19.28 %
Czechia 59.1 41 68.2 86.66 % 60.12 %
Germany 612.4 479.3 474.8 100 % 100 %
Greece - - 20.1 - -
Hungary 78.6 68 77.4 100 % 87.86 %
Italy 263.2 171.8 443 59.41 % 38.78 %
Luxembourg - - 4.8 - -
Poland 51.5 40.7 86.7 59.40 % 46.94 %
Romania 29 - 72 40.28 % -
Slovakia 52.61 39.5 45.1 100 % 87.58 %
Slovenia - - 4.9 - -
TOTAL 1 222.81 890.80 1 387.10 88.16 % 64.22 %
(e) Domestic production
Most Member States in the risk group have some production activity, with a total production capacity of approximately 90 MSm3/day, which translates into approximately 33 GSm3/year.
Table 30: Gas production capacity in relation to gas peak daily demand per Member
State in the Ukrainian risk group
Member State
Production
capacity MSm3/day
Dmax
MSm3/day
Percentage of daily peak
coverage %
Austria 3.4 55.3 6.15
Bulgaria 0.6 18.2 3.30
Croatia 3.5 16.6 21.08
Czechia 0.5 68.2 0.73
Germany 26.2 474.8 5.52
Greece 20.1 0.00
Hungary 4.8 77.4 6.20
Italy 15.5 443 3.50
Luxembourg - 4.8 -
Poland 7.2 86.7 8.30

PREVENTIVE ACTION PLAN
CONCERNING THE SECURITY OF GAS SUPPLY IN GREECE 2021
Page 37 of 108
Romania 29.5 72 40.97
Slovakia 0.2 45.1 0.44
Slovenia - 4.9 -
TOTAL 91.4 1 387.10 6.59
1.2 National system and gas market
1.2.1 Demand for natural gas
1.2.1.1 Historical data on the development of demand
Natural gas is an important source of primary energy in Greece. The development of the annual natural gas consumption from 2007 to 2019 is presented in Graph 1 (DESFA - HNGS Development Study 2021-2030). The annual natural gas consumption in Greece showed a significant increase for the first time in 2011. From 2011 to 2014, gas consumption showed a gradual decrease due to two main reasons: (a) the prolonged economic crisis faced by the country and which has obviously affected the energy sector, and (b) the direct impact of changes in the electricity generation sector on gas consumption. There has been a gradual increase in gas consumption since 2015, with its maximum price being recorded in the early months of 2019.
Graph 1: Historic development of demand for natural gas
(source: DESFA - HNGS Development Study 2021-2030)
Natural gas demand (million Nm3)
Year
1.2.1.2 Demand per sector
Graph 2 below presents the demand per sector, as a percentage (%) of total demand in the period 2007-2019, taking into consideration operational gas (DESFA - HNGS Development Study 2021-2030). Obviously, the largest percentage of natural gas was consumed for electricity generation by thermal plants operated by PPC and private electricity producers. Said percentage stood at 65.2 % in 2019.

PREVENTIVE ACTION PLAN
CONCERNING THE SECURITY OF GAS SUPPLY IN GREECE 2020
Page 38 of 108
Graph 2: Demand per category of consumers for 2007-2019
(source: DESFA - HNGS Development Study 2021-2030)
Electricity generation
Large-scale industry
Distribution networks
1.2.1.3 Natural gas demand peak
Graph 3 below presents historical data on the daily peak demand for natural gas (million Νm3/day) for the period from 1 January 2007 to 31 May 2020. The maximum daily consumption recorded on the transmission system in the above-mentioned period was 25 652 291 Νm3
, on 8 January 2019 (DESFA - HNGS Development Study 2021-2030).

PREVENTIVE ACTION PLAN
CONCERNING THE SECURITY OF GAS SUPPLY IN GREECE 2021
Page 39 of 108
Graph 3: Peak demand in the period 2007-2020
(source: DESFA - HNGS Development Study 2021-2030)
Peak demand (million Νm3/day)
Electricity generation
Large-scale industry
Distribution networks
Peak demand
Year
1.2.1.4 Demand development forecast
The demand for gas in the coming years up until 2030, based on the estimates of the basic scenario of DESFA (HNGS Development Study 2021-2030), is expected to increase, as shown in Graph 4.
Graph 4: Demand development forecast for the period 2021-2030
(source: DESFA - HNGS Development Study 2021-2030)
Total annual demand for natural gas (million Nm3)
Year
Based on the same study, the estimated daily demand for natural gas is presented in Graph 5 below.

PREVENTIVE ACTION PLAN
CONCERNING THE SECURITY OF GAS SUPPLY IN GREECE 2021
Page 40 of 108
Graph 5: Daily peak demand forecast for the period 2021-2030
(source: DESFA - HNGS Development Study 2021-2030)
Peak demand (million Nm3/day)
Year
1.2.2 Infrastructure and operation of the Hellenic Natural Gas System
1.2.2.1 General information
The Hellenic Natural Gas System (HNGS) (DESFA - HNGS Operation Study 2019) is used to transfer gas from the Greece-Bulgaria and the Greece-Turkey borders, as well as from the Liquefied Natural Gas (LNG) terminal on the island of Revithoussa in Megara Bay to consumers connected to the HNGS network in mainland Greece.
Natural gas is delivered by transmission users at 3 entry points of the Hellenic Natural Gas Transmission System (ΗNGTS) and is received by transmission users via 43 exit points across mainland Greece, including the Sidirokastron reverse flow exit point, used to deliver gas to the interconnected Bulgarian gas transmission system.
The HNGS comprises:
the central gas transmission pipeline with a length of approximately 512 km and diameters of 36” and 30”, and its branches with a total length of 953.20 km (including: [a] the submerged pipeline of the Aliveri branch with a diameter of 20” and a length of 14.20 km, and [b] the 2 submerged pipelines, i.e. a main pipeline and a backup one, with a diameter of 24” each and a length of 620 km and 630 km, connecting the Revithoussa LNG Terminal with mainland Greece);
the border metering stations at Sidirokastron, Serres and Kipi, Evros;
the Revithoussa Liquefied Natural Gas (LNG) Terminal, connected at the entry point of Agia Triada;
the Nea Mesimvria compressor station in Thessaloniki;
the natural gas metering and regulating stations;
the load control and dispatch centres;

PREVENTIVE ACTION PLAN
CONCERNING THE SECURITY OF GAS SUPPLY IN GREECE 2021
Page 41 of 108
the operation and maintenance centres in parts of the Sidirokastron (Serres) Border Metering Station, in Northeast Greece, in North Greece, in Central Greece, in South Greece and in Peloponnese; and
the remote control and communications system.
Table 31 below outlines the technical capacity of the 3 ΗNGTS entry points.
Table 31: Existing capacity of the ΗNGTS entry points (source: DESFA)
Entry point Technical capacity (MWh/day)
Sidirokastron 117 804.036 Kipi, Evros 48 592.292 Agia Triada 204 481.800
After the interconnection with the TAP pipeline became operational within the last quarter of 2020, and in line with the ten-year technical capacity forecast for the ΗNGTS entry points, the above table is formed as follows:
Table 32: Capacity forecast for the ΗNGTS entry points (source: DESFA8)
Entry point Technical capacity (MWh/day)
Sidirokastron 117 804.036
Total of Kipi and Nea Mesimvria
(TAP) (*)
53 368.256
Total of Kipi and Nea Mesimvria
(TAP)
171 172.292
Agia Triada (**) 230 374.500
(*) The procedure and method of distribution of 53 368.256 MWh/day between the two entry points (competitive capacities) are described in RAE decision No 1399/2020 (Government Gazette, Series II, No 4622/22.10.2020)
(**) Upon completion of the increase in the power reserve in the LNG terminal of Revithoussa (Mar. 2021)
(source: DESFA)
The following matching and definitions were adopted to determine the technical capacities:
For the entry points of Sidirokastron and Kipi: 1 Nm3 at 11.23 kWh of GCV.
For the entry point of Agia Triada: 1 Nm3 at 12.03 kWh of GCV
For LNG: 1 m3 LNG = 570 Nm3 of natural gas
Nm3: At 0 oC and 1.01325 bar
1.2.2.2 Revithoussa LNG Terminal
The Revithoussa LNG Terminal is interconnected with the Hellenic Transmission System via the Agia Triada entry point at the southern end of the network and contributes substantially to the security of supply both through its storage facility (total capacity of 221 815.677 m3 of LNG) and through the capacity it provides for diversifying the sources of gas imported into the Greek market. The Terminal comprises:
8 https://www.desfa.gr/userfiles/pdflist/DRSA/Αναθεωρημένες_Τεχν_Δυναμικότητες%2007_2018%20(GR)_v2.pdf

PREVENTIVE ACTION PLAN
CONCERNING THE SECURITY OF GAS SUPPLY IN GREECE 2021
Page 42 of 108
Three (3) LNG storage tanks with a total usable capacity of 63 379.931, 63 379.931 and 95 055.815 m3 of LNG;
LNG carrier offloading facilities with a total offloading capacity of 7 250 m3 of LNG/hour; and
LNG gasification installations with a total capacity of 1 250 m3 of LNG/hour under continuous operating conditions.
1.2.2.3 Percentage of utilisation of entry points
Table 33 and Table 34 below show the annual average deliveries and daily peak as a percentage of the technical capacity for each entry point for the years 2018 and 2019, respectively.
Table 33: Percentage of utilisation of entry points for 2018
Entry point Technical
capacity [kWh/day]
Annual average
deliveries [kWh/day]
Daily peak
[kWh/day]
Annual average
deliveries as a percentage (%)
of technical capacity
Daily peak as a
percentage (%) of the point’s
capacity
SIDIROKASTRON 122 580 000 95 195 660 110 756 751 77.7 90.4
AGIA TRIADA 149 872 697 29 682 568 121 552 788 19.8 81.1
KIPI 48 592 292 19 614 624 48 298 413 40.4 99.4
Table 34: Percentage of utilisation of entry points for 2019 (source: DESFA)
Entry point Technical capacity
[kWh/day]
Annual average deliveries
[kWh/day]
Daily peak [kWh/day]
Annual average deliveries as a
percentage (%) of technical
capacity
Daily peak as a percentage (%)
of the point’s capacity
SIDIROKASTRON 122 580 000 121 629 582 172 180 000 99.2 % 140.5 %
AGIA TRIADA
1/1-27/3
149 872 697 113 559 356 149 218 849 75.8 % 99.6 %
28/3-31/129
204 481 800 125 544 002 204 481 800 61.4 % 100.0 %
KIPI 48 592 292 31 961 926 74 133 250 65.8 % 152.6 %
1.2.2.4 Information systems
Remote Control and Communications System
The Remote Control and Communications System (RCC) comprises the following subsystems:
a fibre-optic cable installed parallel to the high-pressure gas pipeline, for the transmission of all kinds of internal communications (voice and data) for DESFA;
a telecommunications system based on the Ethernet and Internet (Internet Protocol - IP) protocols with routers and/or layer 3 switches installed at each Hellenic Natural Gas Transmission System station, which ensures voice and data transmission via the fibre-optic cable and connects to backup communication lines provided by telecommunications providers;
9 The period from 9 April 2019 to 9 May 2019 is excluded

PREVENTIVE ACTION PLAN
CONCERNING THE SECURITY OF GAS SUPPLY IN GREECE 2021
Page 43 of 108
a Supervisory Control and Data Acquisition (SCADA) system, which facilitates the remote monitoring and management of all metering and/or regulating stations, line valve stations and remote communication stations of the Hellenic Transmission System by the Load Control and Dispatch Centres;
a cluster of three IP call centres installed at DESFA headquarters, at the Patima Operations and Maintenance Centre and the Nea Mesimvria Operations and Maintenance Centre to manage all DESFA’s internal and external telephone calls.
Regulated Natural Gas Services Electronic Information System
DESFA has developed and operates an Electronic Information System, as foreseen in revision 3 of the Hellenic Natural Gas System (HNGS) Management Code. DESFA uses a web application to offer the following capabilities to HNGS users:
transmission capacity booking on an uninterrupted and interruptible basis at
the HNGS entry/exit points, except for auction points;
submission of transmission capacity booking applications for dispatched or released capacity;
LNG gasification capacity booking;
information on the amount of provisional and final equity;
submission of guarantees for the purpose of establishing the financial limit for bidding in the Regional Booking Platform;
submission/re-submission of statements;
information on confirmed quantities;
information on indicative/initial/final dispatch;
generation of useful reports.
In addition, DESFA has developed and operates a Balancing Platform which is used, based on the provisions of revision 4 of the HNGS Management Code, to conduct auctions to buy and sell balancing gas in the form of short-term standardised products.
Geographical Information System
DESFA operates a Geographical Information System in order to fully record its assets in digital form. The GIS technology allows for faster and better understanding of the current status of the high-pressure gas network.
The information kept in the GIS concerns pipeline networks, facilities and stations/terminals, cathodic protection, cadastral data, geological characteristics and environmental characteristics.
1.2.3 Natural gas supply
The natural gas consumed in Greece is imported either under long-term agreements or under short-term contracts for the purchase of LNG or gas loads through pipelines.
As shown in Graph 6 below, the drop in demand after 2011 stabilised the share of natural gas coming from Russia at 60 % of the total imported quantity. The significant decline in the share of LNG in 2013 imports is attributed to the increase in prices on the market of occasional LNG loads. Since then, the steady rise in fracking

PREVENTIVE ACTION PLAN
CONCERNING THE SECURITY OF GAS SUPPLY IN GREECE 2021
Page 44 of 108
gas production in the USA has caused changes on the global LNG market and contributed to a rise in the share of LNG in the Greek market. That aside, in the winter of 2017, the further rise in LNG imports helped cope with high demand for gas and electricity across Europe because of the strong cold spell. The significant drop in LNG market prices in 2019 caused a major change to the supply mix, with the share of LNG standing approximately at 54 % of the total quantity of imported natural gas and the corresponding share of Russian gas declining to approximately 30 %.
Graph 6: Evolution of gas supply in the period 2009-2019
Russia LNG
Turkey
Graph 7 below shows the main sources of LNG imported to Greece over the last four years. The decline in LNG market prices in 2019 resulted, apart from an increase in the imports of LNG, in increased differentiation of LNG sources.

PREVENTIVE ACTION PLAN
CONCERNING THE SECURITY OF GAS SUPPLY IN GREECE 2021
Page 45 of 108
Graph 7: Sources of LNG
Origin of LNG
Algeria
Qatar
Norway
USA
Nigeria
France
Egypt
Trinidad
Netherlands
Angola

PREVENTIVE ACTION PLAN
CONCERNING THE SECURITY OF GAS SUPPLY IN GREECE 2021
Page 46 of 108
1.2.4 The role of the electricity generation sector
The electricity generation sector has been the cornerstone of the introduction of natural gas into Greece’s energy mix, providing the necessary anchor loads for the conclusion of long-term gas supply agreements and for infrastructure development. As mentioned above, the sector’s share in total gas demand stood at 65.2 % in 2019.
Graph 8 shows the evolution of the share of gas in the centrally-dispatched electricity generation in Greece from 2008 to 2019 and the corresponding total annual electricity generation (source: ADMIE: Monthly Energy Data Sheets for 2008–2019).
Graph 8: Share of gas in centrally-dispatched electricity generation in Greece in the period
2008-2019
Share of natural gas in electricity generation (%)
Annual electricity generation (TWh)
Year
Share of natural gas in electricity generation (%)
Annual electricity generation (TWh)
The drop in its share noted in 2009 and to some degree in 2010 coincides with the economy entering into recession, whereas weather conditions favoured high inflows of water into the hydroelectric power plants’ reservoirs.
Subsequently, in the three-year period from 2011 to 2013, electricity generation by gas-fired power plants stabilised at 30 % of the total power generated from centrally-dispatched capacity in the interconnected system. This is also due to the rapid increase in the amount of electricity generated from RES, as recorded in the three-year period 2011-2013. On the contrary, in 2014, the share of gas in centrally-dispatched electricity generation fell significantly, below 20 %, due to the new rules on the integration of power plants and the significantly increased supply of electricity through interconnections. There was a 10 % increase in the share of gas in 2016, which continued over the next two years as a result of the decrease in the share of lignite-fired power plants in the energy mix. This decrease was due to the limited availability of lignite-fired power plants (withdrawal of lignite-fired power plants, reduced operating hours until final withdrawal, mandatory maintenance/upgrading due to environmental constraints, faults/emergency maintenance) and for economic reasons (cost savings associated with CO2 emissions).

PREVENTIVE ACTION PLAN
CONCERNING THE SECURITY OF GAS SUPPLY IN GREECE 2021
Page 47 of 108
Table 35 presents all the thermal power plants in the interconnected system of Greece for the year 2019, including gas-fired plants (total generating capacity (MWe) and as a percentage of total generating capacity) and cogeneration units (total generating capacity (MWe) and as a percentage of total generating capacity). Respectively, Table 36 presents all the power plants in the interconnected system of Greece based on the type of fuel for the year 2019.
Table 35: Total of thermal power plants in the interconnected system of Greece for the
year 2019
TYPE GENERATING PLANT INSTALLED
POWER (MW)
% ON TOTAL THERMAL CAPACITY
LIGNITE-FIRED PLANTS (*)
Ag. Dimitrios I 300 3.2
Ag. Dimitrios II 300 3.2
Ag. Dimitrios III 310 3.3
Ag. Dimitrios IV 310 3.3
Ag. Dimitrios V 375 4.0
Amyntaio Ι 300 3.2
Amyntaio ΙI 300 3.2
Kardia Ι 300 3.2
Kardia IΙ 300 3.2
Kardia IIΙ 306 3.3
Kardia ΙV 306 3.3
Megalopoli ΙΙΙ 300 3.2
Megalopoli IV 300 3.2
Meliti Ι 330 3.5
Total power of lignite plants 4 337 46.5
COMBINED CYCLE GAS-FIRED PLANTS
Aliveri V 426.9 4.6
Komotini 484.6 5.2
Lavrio IV 560 6.0
Lavrio V 385.2 4.1
Megalopoli V 500 5.4
ENTHES (Elpedison) 408.4 4.4
HERON ΙΙ 432 4.6
Ag. Theodoroi (Korinthos power) 436.6 4.7
Thisvi (Elpedison) 421.6 4.5
Ag. Nikolaos (Protergia) 444.5 4.8
Total power of combined cycle gas-fired plants 4 499.8 48.3
OPEN CYCLE GAS-FIRED PLANTS
Heron (3 plants) 148.5 1.6
Total power of open cycle gas-fired plants 148.5 1.6
DISTRIBUTED HECHP PLANTS
Aluminium (3 plants) 334 3.6
Total power of HECHP plants 334 3.6
Total power of thermoelectric plants 9 319.3 100.0
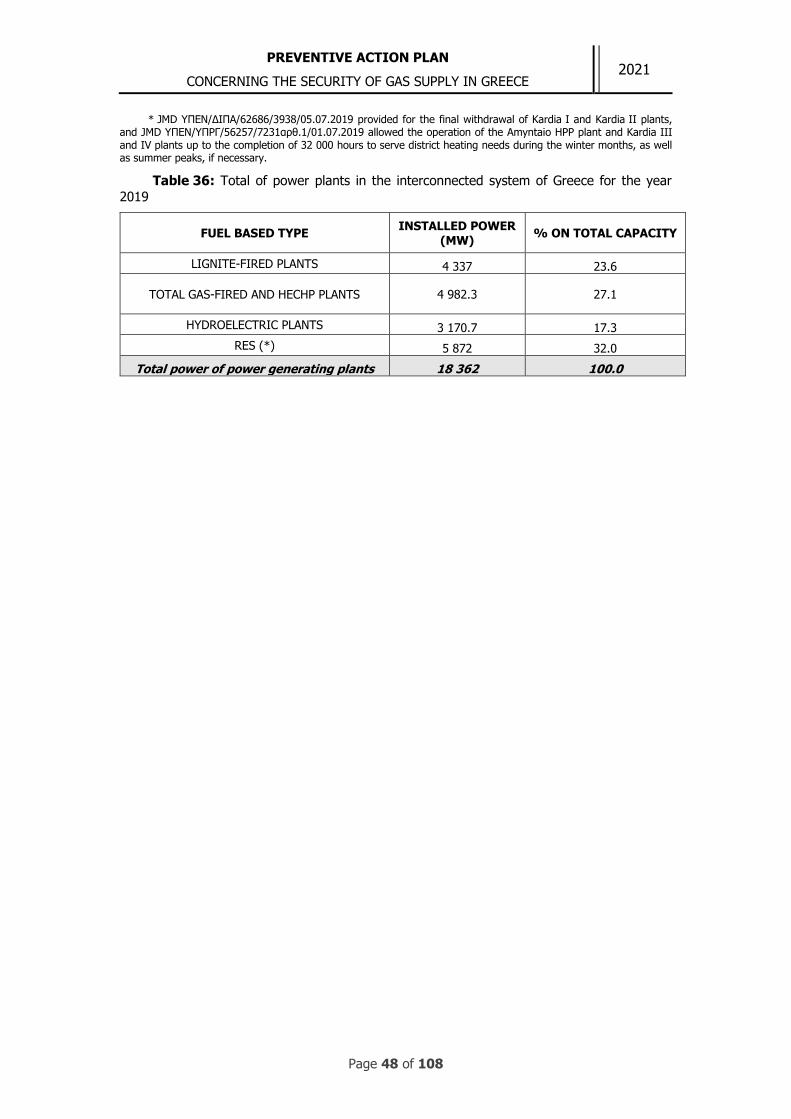
PREVENTIVE ACTION PLAN
CONCERNING THE SECURITY OF GAS SUPPLY IN GREECE 2021
Page 48 of 108
* JMD ΥΠΕΝ/ΔΙΠΑ/62686/3938/05.07.2019 provided for the final withdrawal of Kardia I and Kardia II plants, and JMD ΥΠΕΝ/ΥΠΡΓ/56257/7231αρθ.1/01.07.2019 allowed the operation of the Amyntaio HPP plant and Kardia III and IV plants up to the completion of 32 000 hours to serve district heating needs during the winter months, as well as summer peaks, if necessary.
Table 36: Total of power plants in the interconnected system of Greece for the year
2019
FUEL BASED TYPE INSTALLED POWER
(MW) % ON TOTAL CAPACITY
LIGNITE-FIRED PLANTS 4 337 23.6
TOTAL GAS-FIRED AND HECHP PLANTS 4 982.3 27.1
HYDROELECTRIC PLANTS 3 170.7 17.3
RES (*) 5 872 32.0
Total power of power generating plants 18 362 100.0

PREVENTIVE ACTION PLAN
CONCERNING THE SECURITY OF GAS SUPPLY IN GREECE 2021
Page 49 of 108
2 Summary presentation of Risk Assessment
2.1 Common Risk Assessments
The following subsections summarise the results of the Common Risk Assessments carried out in accordance with Article 7 of the Regulation, and describe the scenarios analysed on a case-by-case basis, as well as the risks identified.
2.1.1 Trans-balkan risk group
The study was carried out by RAE, as the Competent Authority and coordinator of the trans-Balkan risk group, in accordance with the provisions of Regulation (EU) 2017/1938, with the significant contribution of the Joint Research Centre of the European Commission (JRC - EU Commission) in drafting the section ‘Risk Identification and Risk Analysis’ and performing the hydraulic simulation of the transmission network of Greece and Bulgaria. Romania’s transmission network was not included in the simulation model and its operation was examined using a mass balance, due to its limited connectivity/dependence on the trans-Balkan natural gas pipeline.
The Common Risk Assessment of the trans-Balkan risk group was completed in early 2020. In drawing up the Plan, RAE worked together with the Hellenic Gas Transmission System Operator SA (DESFA SA), the Independent Power Transmission Operator (ADMIE), the Ministry of the Environment and Energy (YPEN), as well as with the Competent Authorities of Bulgaria (Ministry of Energy), Romania (Ministry of Energy) and the respective Gas System Operators of the two countries (Bulgartransgaz EAD and Transgaz SA).
The Assessment extensively identified and assessed all relevant risk factors with regional impact, using a structured questionnaire developed by the JRC in collaboration with RAE. The analysis of the above risks led to the development of six (6) basic Scenarios with twenty eight (28) sub-cases with peak demand conditions (statistical probability of once in twenty years / ‘1-in-20 years’) and a crisis duration of 7, 14 and 30 days. Especially for Greece, an analysis of demand data and temperatures was performed to draw conclusions about the correlation of demand with temperature and the estimation of the reference temperature (statistical probability of once in twenty years / ‘1-in-20 years’).
Based on the results, the Scenarios with the greatest impact are those where it is assumed that there will be a complete cessation of Russian gas exports to EU countries (S.2.a and S.2.b), in combination with a problematic operation of the Revithoussa plant (50 % reduction in capacity) due to a technical problem or delay of LNG loads (S.6.a.a and S.6.b.a). The probability of occurrence of these Scenarios is characterised as ‘Possible-average or medium’ with ‘Catastrophic Impacts’ mainly for Bulgaria, where there will be cuts in its Protected Consumers. For Greece and Romania, the occurrence of these Scenarios will not affect Protected Consumers. For Greece, the effects concern industrial consumers and gas-fired power plants.
It is worth noting that the assessment used the data submitted by the Competent Authorities of Member States during the year 2018 (‒ beginning of 2019) and did not take into account the three (3) significant changes that took place in the last months of 2019 (until the beginning of 2020), i.e.:

PREVENTIVE ACTION PLAN
CONCERNING THE SECURITY OF GAS SUPPLY IN GREECE 2021
Page 50 of 108
the positive outcome of the tripartite negotiations between Russia, Ukraine and
the EU, which allow the continuation of the transit of Russian gas through
Ukraine for the next five years,
the completion of the Turkish stream pipeline and the setup of a new Bulgaria-
Turkey interconnection point, allowing the transit of gas from Turkey to the
trans-Balkan region as of 1 January 2020, and
the increase of the uninterrupted capacity from Greece to Bulgaria through the
Interconnection Point ‘Kulata (BG) / Sidirokastron (GR)’ to 5.7 MNm3/Day from
1 January 2020.
For the above reasons, the trans-Balkan risk group decided to update the assessment.
In addition, for the above reasons, ENTSO-G prepared the addendum to the 2017 Assessment entitled ‘EU Wide Security of Supply Simulation 2017’. In the assessment, based on an agreement of the members of the Gas Coordination Group at the March 2020 meeting, it was decided to simulate 3 scenarios that were expected to have different results in 2020. One of the scenarios concerned the disruption of the largest infrastructure to the Balkan region. The assumptions taken into account regarding the demand are that the demand remained at the same levels as in 2017, the same applying to the high demand scenarios. The duration of the scenarios was two (2) weeks and one (1) month (March) which will include a cold spell lasting two (2) weeks. The results showed that there is no risk of cut in load in contrast to the results of the original 2017 Assessment.
2.1.2 Ukrainian risk group
As mentioned above, this risk group comprises Bulgaria, the Czech Republic, Germany, Greece, Croatia, Italy, Luxembourg, Hungary, Austria, Poland, Romania, Slovenia and Slovakia. The Common Risk Assessment of the Ukrainian risk group was completed in February 2019.
The aim of the Assessment was to assess the risk related to the supply of gas from the east. Representatives of the Member States’ competent authorities cooperated and engaged in extensive analysis, which resulted in the formation of 8 scenarios (with 7 additional variations).
Based on the results, the risk factor with the highest regional impact is disruption of supply from Ukraine (common thread). JRC participated in the risk analysis as a consultant. The GEMFLOW model (developed by the JRC) was chosen for simulating these scenarios. The scenarios that concern Greece are S.01 a, b and c, S.02 a and b, S.03 a and b as well as scenarios S.07 and S.08.
The results of the Assessment show a serious risk for Greece (and Bulgaria) in the following scenarios (‘Bulgaria and Greece are very exposed to supply complications affecting Ukrainian Route’):
1. S.01 b / 14-day duration, total disruption from Ukraine in early February.
Greece faces a gas deficit from day one, with an average of unsatisfied demand
of 38 % (max 47 %). Respectively, Bulgaria with an average (unserved gas)
of 78 %.
2. S.01 c / 30-day duration, total disruption from Ukraine in early February.
Greece faces a gas deficit from day one, with an average of unsatisfied demand

PREVENTIVE ACTION PLAN
CONCERNING THE SECURITY OF GAS SUPPLY IN GREECE 2021
Page 51 of 108
of 38 % (max 47 %). Respectively, Bulgaria with an average (unserved gas)
of 79 %.
3. S.02 b / 14-day duration, cold spell, total disruption from Ukraine, March.
Greece faces a gas deficit from day one, with an average of unsatisfied demand
of 22 % (max 33 %). Respectively, Bulgaria with an average (unserved gas)
of 76 %.
4. S.03 a / 14-day duration, total disruption from Russia, February. Greece faces
a gas deficit from day one, with an average of unsatisfied demand of 38 %
(max 39 %). Respectively, Bulgaria with an average (unserved gas) of 78 %,
Romania 20 %.
5. S.03 b / 30-day duration, total disruption from Russia, February. Greece faces
a gas deficit from day one, with an average of unsatisfied demand of 37 %
(max 47 %). Respectively, Bulgaria with an average (unserved gas) of 79 %,
Romania 5 %.
6. S.07 / 7-day duration, disruption from Ukraine - border with Romania,
February. Greece faces a gas deficit from day one, with an average of
unsatisfied demand of 48 % (max 55 %). Respectively, Bulgaria with an
average (unserved gas) of 81 %, Romania 22 %.
However, for the reasons mentioned above (reasons for reviewing the trans-Balkan Risk Assessment: TurkStream and renewal of contracts for the transport of Russian gas through Ukraine), ENTSO-G prepared the addendum to the 2017 Assessment entitled ‘EU Wide Security of Supply Simulation 2017’. In the assessment, based on an agreement of the members of the Gas Coordination Group at the March 2020 meeting, it was decided to simulate 3 scenarios that were expected to have different results in 2020. One of the scenarios concerned a Ukrainian disruption. The assumptions taken into account regarding the demand are that the demand remained at the same levels as in 2017, the same applying to the high demand scenarios. The duration of the scenarios was two (2) months and was examined for a day of maximum demand (peak day) and for a cold spell lasting two (2) weeks. The results showed that there is no risk of load cuts other than the 2-week scenario, where Romania faces the possibility of load cuts due to infrastructure constraints with Hungary and Bulgaria. In any case, the cuts are limited (6 %), while any possible compensatory measures have not been taken into account.
2.1.3 Algerian risk group
As mentioned above, Greece, Spain, France, Croatia, Italy, Malta, Austria, Portugal and Slovenia are members of this risk group. The import of gas supplied by Algeria in the specific Member States accounts for 27 % of total imports for 2016 and 23 % for 2017.
The representatives of the competent authorities of the Member States in the risk group, having analysed both the risks and results of the simulation (at an EU level) of the gas supply and infrastructure disruption scenarios prepared by ENTSO-G, settled on four (4) crisis scenarios. These scenarios examined (i) the total supply disturbance from Algeria, (ii) the Maghreb pipeline disturbance, (iii) the Transmed pipeline disturbance, and (iv) the disturbance in Algerian liquefaction plants.

PREVENTIVE ACTION PLAN
CONCERNING THE SECURITY OF GAS SUPPLY IN GREECE 2021
Page 52 of 108
The scenario simulations were run using a mass balance and in none of the cases examined was there any need for load cuts. The model specifically developed by the International Energy Agency (IEA) for the arrival of LNG shipments was used for that purpose.
The Common Risk Assessment was completed and notified to the Commission by the Spanish competent authority in October 2018. Working in close cooperation with the HNGS Operator, RAE contributed to the preparation of the Risk Assessment at all stages of the analysis.
2.2 National Risk Assessment
The Regulatory Authority for Energy (RAE), in the context of its responsibility as competent authority pursuant to Article 12 of Law 4001/2011, in order to ensure the implementation of the measures set out in Regulation (EU) No 994/2010 [now Regulation (EU) 2017/1938], prepared a Risk Assessment for the years 2020-2022 in May 2020. The Assessment thoroughly examined the risks that could affect the security of supply of Greece with natural gas and analysed, through simulation, fifty nine (59) different scenarios of potential disruptions of gas supply and/or demand. The
assessment took into account significant changes at international and national levels which may affect the energy market and the security of supply. These changes relate to:
the agreement entered into by and between Russia and Ukraine for Russian gas transit via the Trans Balkan pipeline as of 1 January 2020;
the change (increase) in uninterrupted capacity at the Kulata (BG) - Sidirokastron (EL) interconnection, with a Greece-Bulgaria direction;
the operation of a new entry point in the trans-Balkan region, in particular at the Bulgaria-Turkey border (connection with Turkish Stream - new border metering station (BMS) at Malkoclar);
the COVID-19 pandemic and the restrictions applied in Greece.
2.2.1 Crisis scenarios
In the context of the investigation of supply security crisis scenarios, the following natural gas demand conditions were examined, satisfying the requirements laid down in Regulation (EU) 2017/1938:
Group A Scenarios: a week of extreme temperatures occurring with a statistical probability of once in 20 years;
Group B Scenarios: a month of average winter conditions;
Group C Scenarios: a month of exceptionally high gas demand, occurring with a statistical probability of once in 20 years.
The assumptions regarding natural gas demand that were considered for all of the above scenarios were:
Gas demand for industrial customers and customers operating compressed natural gas (CNG) plants which are supplied directly by the ΗNGTS were considered not to be affected by temperature.
Regarding electricity generation, two demand profiles were examined, identified as (a) and (b), which correspond to the following conditions:
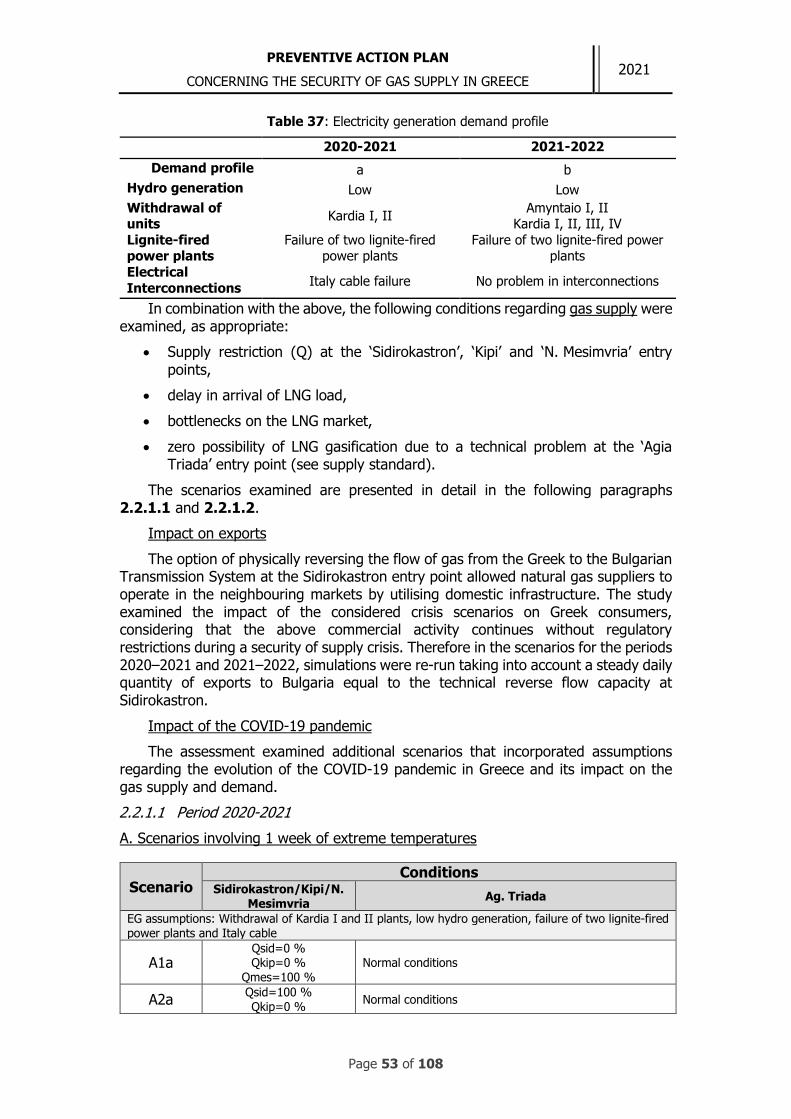
PREVENTIVE ACTION PLAN
CONCERNING THE SECURITY OF GAS SUPPLY IN GREECE 2021
Page 53 of 108
Table 37: Electricity generation demand profile
2020-2021 2021-2022
Demand profile a b
Hydro generation Low Low
Withdrawal of units
Kardia Ι, II Amyntaio Ι, II
Kardia Ι, ΙΙ, ΙΙΙ, ΙV
Lignite-fired power plants
Failure of two lignite-fired power plants
Failure of two lignite-fired power plants
Electrical
Interconnections Italy cable failure No problem in interconnections
In combination with the above, the following conditions regarding gas supply were examined, as appropriate:
Supply restriction (Q) at the ‘Sidirokastron’, ‘Kipi’ and ‘N. Mesimvria’ entry
points,
delay in arrival of LNG load,
bottlenecks on the LNG market,
zero possibility of LNG gasification due to a technical problem at the ‘Agia Triada’ entry point (see supply standard).
The scenarios examined are presented in detail in the following paragraphs 2.2.1.1 and 2.2.1.2.
Impact on exports
The option of physically reversing the flow of gas from the Greek to the Bulgarian Transmission System at the Sidirokastron entry point allowed natural gas suppliers to operate in the neighbouring markets by utilising domestic infrastructure. The study examined the impact of the considered crisis scenarios on Greek consumers, considering that the above commercial activity continues without regulatory restrictions during a security of supply crisis. Therefore in the scenarios for the periods 2020–2021 and 2021–2022, simulations were re-run taking into account a steady daily quantity of exports to Bulgaria equal to the technical reverse flow capacity at Sidirokastron.
Impact of the COVID-19 pandemic
The assessment examined additional scenarios that incorporated assumptions regarding the evolution of the COVID-19 pandemic in Greece and its impact on the gas supply and demand.
2.2.1.1 Period 2020-2021
A. Scenarios involving 1 week of extreme temperatures
Scenario Conditions
Sidirokastron/Kipi/N. Mesimvria
Ag. Triada
EG assumptions: Withdrawal of Kardia I and II plants, low hydro generation, failure of two lignite-fired power plants and Italy cable
Α1a Qsid=0 % Qkip=0 %
Qmes=100 % Normal conditions
Α2a Qsid=100 % Qkip=0 %
Normal conditions

PREVENTIVE ACTION PLAN
CONCERNING THE SECURITY OF GAS SUPPLY IN GREECE 2021
Page 54 of 108
Qmes=100 %
Α3a Qsid=0 % Qkip=50 %
Qmes=100 % Normal conditions
Α4a Qpipe=14.6 million Νm3/d
Qpipe=Qsid+Qkip+Qmes
Normal conditions
Α5a Non arrival of LNG load within the week
B. Scenarios involving 1 month of average winter conditions
Scenario Conditions
Sidirokastron/Kipi/N. Mesimvria
Ag. Triada
EG assumptions: Withdrawal of Kardia I and II plants, low hydro generation, failure of two lignite-fired power plants and Italy cable
Β1a Qsid=0 %
Qkip=100 %
Qmes=100 %
Normal conditions
Β2a Qsid=100 % Qkip=0 %
Qmes=100 % Normal conditions
Β3a Qsid=100 % Qkip=0 % Qmes=0 %
Long delay of the 1st LNG load (21 days), normal LNG market operation
Β4a Qpipe=14.6 million Νm3/d
Qpipe=Qsid+Qkip+Qmes
Normal conditions
Β5a Technical problem of gasification (0 %) for one month
C. Scenarios involving 1 month of exceptionally high demand
Scenario Conditions
Sidirokastron/Kipi/N. Mesimvria
Ag. Triada
EG assumptions: Withdrawal of Kardia I and II plants, low hydro generation, failure of two lignite-fired
power plants and Italy cable
C1a Qsid=50 % Qkip=50 %
Qmes=100 % Normal conditions
C2a Qsid=100 % Qkip=0 % Qmes=0 %
Long delay of the 1st LNG load (21 days), normal LNG market operation
C3a Qpipe=14.6 million Νm3/d
Qpipe=Qsid+Qkip+Qmes
Normal conditions
C4a Delay in arrival of the 1st LNG load (14 days) in conjunction with bottlenecks on the LNG market
2.2.1.2 Period 2021-2022
A. Scenarios involving 1 week of extreme temperatures
Scenario Conditions
Sidirokastron/Kipi/N. Mesimvria
Ag. Triada
EG assumptions: Withdrawal of Kardia I, II, III, IV and Amyntaio I, II plants, low hydro generation, failure of two lignite-fired power plants
Α1b Qsid=0 % Qkip=0 %
Qmes=100 % Normal conditions
Α2b Qsid=100 % Qkip=0 %
Qmes=100 % Normal conditions

PREVENTIVE ACTION PLAN
CONCERNING THE SECURITY OF GAS SUPPLY IN GREECE 2021
Page 55 of 108
Α3b Qsid=0 % Qkip=50 %
Qmes=100 % Normal conditions
Α4b Qpipe=14.6 million Νm3/d
Qpipe=Qsid+Qkip+Qmes
Normal conditions
Α5b Non arrival of LNG load within the week
B. Scenarios involving 1 month of average winter conditions
Scenario Conditions
Sidirokastron/Kipi/N. Mesimvria
Ag. Triada
EG assumptions: Withdrawal of Kardia I, II, III, IV and Amyntaio I, II plants, low hydro generation, failure of two lignite-fired power plants
Β1b Qsid=0 %
Qkip=100 % Qmes=100 %
Normal conditions
Β2b Qsid=100 % Qkip=0 %
Qmes=100 % Normal conditions
Β3b Qsid=100 % Qkip=0 % Qmes=0 %
Long delay of the 1st LNG load (21 days), normal LNG market operation
Β4b Qpipe=14.6 million Νm3/d
Qpipe=Qsid+Qkip+Qmes
Normal conditions
Β5b Technical problem of gasification (0 %) for one month
C. Scenarios involving 1 month of exceptionally high demand
Scenario Conditions
Sidirokastron/Kipi/N. Mesimvria
Ag. Triada
EG assumptions: Withdrawal of Kardia I, II, III, IV and Amyntaio I, II plants, low hydro generation, failure of two lignite-fired power plants
C1b Qsid=50 % Qkip=50 %
Qmes=100 % Normal conditions
C2b Qsid=100 % Qkip=0 % Qmes=0 %
Long delay of the 1st LNG load (21 days), normal LNG market operation
C3b Qpipe=14.6 million Νm3/d
Qpipe=Qsid+Qkip+Qmes
Normal conditions
C4b Delay in arrival of the 1st LNG load (14 days) in conjunction with bottlenecks on the LNG market
2.2.2 Results of scenario simulations
During the simulation of the scenarios, the mass balance was calculated and the effects of possible power supply restrictions on Electricity Generation (EG), Industrial Consumers and Protected Consumers were estimated.
The following Risk Matrices (
Graph 9 and Graph 10) present the risk assessment for each of the scenarios examined. Positions marked in red indicate high (non-tolerable) risk, while those marked in green indicate low (tolerable) risk. Positions in between, marked in yellow, indicate medium (undesirable) risk.

PREVENTIVE ACTION PLAN
CONCERNING THE SECURITY OF GAS SUPPLY IN GREECE 2021
Page 56 of 108
The order of priority for addressing the crisis scenarios in this Preventive Action Plan is as follows:
1. Priority level A - Non-tolerable (high) risk scenarios,
2. Priority level B - Undesirable (medium) risk scenarios with a class E impact on electricity generation,
3. Priority level C - Other undesirable (medium) risk scenarios.

PREVENTIVE ACTION PLAN
CONCERNING THE SECURITY OF GAS SUPPLY IN GREECE 2020
Page 57 of 108
2.2.2.1 Period 2020-2021
Not taking into account exports
Taking into account exports
EG
Negligible risk under the crisis scenarios examined
Ind
ustr
ial
Co
nsu
me
rs
Graph 9: Risk matrices for the period 2020-2021
Probability
Impact

PREVENTIVE ACTION PLAN
CONCERNING THE SECURITY OF GAS SUPPLY IN GREECE 2020
Page 58 of 108
2.2.2.2 Period 2021-2022
Not taking into account exports
Taking into account exports
EG
Negligible risk under the crisis scenarios examined
Ind
ustr
ial
Co
nsu
me
rs
Graph 10: Risk matrices for the period 2021-2022
Probability
Impact

PREVENTIVE ACTION PLAN
CONCERNING THE SECURITY OF GAS SUPPLY IN GREECE 2020
Page 59 of 108
2.2.3 Conclusions of the Risk Assessment
The conclusions of the Risk Assessment were summarised as follows:
1. Supply to protected customers is not expected to be impacted in any of the scenarios examined, provided that the exports to Bulgaria are not taken into account. However, this requires that demand-side management measures specified in the Preventive Action Plan (2018) be activated and that the Emergency Plan (2019) be implemented in relation to the interruption/restriction of natural gas.
2. Under the same conditions (zero exports to Bulgaria upon activation of a crisis scenario), the following conclusions were drawn on electricity generation:
a. For the period 2020–2021: 2 scenarios are not expected to have any impact on the supply to power plants, 6 scenarios give rise to tolerable (low) risk, 4 scenarios give rise to undesirable (medium) risk and 2 scenarios give rise to non-tolerable (high) risk.
b. For the period 2021–2022: 2 scenarios are not expected to have any impact on the supply to power plants, 4 scenarios give rise to tolerable (low) risk, 5 scenarios give rise to undesirable (medium) risk and 3 scenarios give rise to non-tolerable (high) risk.
3. Supply to industrial consumers is not expected to be impacted in any of the scenarios examined, provided that the exports to Bulgaria are not taken into account.
4. The need to improve the demand estimation methodology for all customer categories was established, which was also highlighted in the relevant JRC study. The provisions in the Preventive Action Plan on gas and electricity operators preparing a common demand estimate (seasonal demand report) made a positive contribution, but further efforts are needed for a more complete and substantiated demand estimate to be made, with regard to distribution networks in particular.
Impacts of exports
5. Maintaining trade/export activity to Bulgaria during a crisis without regulatory constraints is expected to cause a significant increase in overall risk, leading to gas cuts to Protected Consumers. This may occur in week-long scenarios A1 and A3 and in month-long scenario C2, both for the period 2020–2021 and for the period 2021–2022. These scenarios incorporate significant disruptions to gas supply mainly through pipelines.
Impacts of the COVID-19 pandemic
6. The Risk Assessment looked into the potential impact of the COVID-19 pandemic in the winter period of 2020‒2021. The simulation results showed that the impacts are negligible for all customer categories, on condition that the activities of gas operators and suppliers are not affected and business continuity is ensured in all cases.
2.2.4 Guidelines for the Preventive Action Plan
According to the provisions of the Risk Assessment, the Preventive Action Plan should take into account the following:

PREVENTIVE ACTION PLAN
CONCERNING THE SECURITY OF GAS SUPPLY IN GREECE 2021
Page 60 of 108
Operators and suppliers must ensure continuous smooth business operation even in the event of reoccurrence of the pandemic crisis or of intense economic recession.
The regulatory framework must include the necessary provisions for the unhindered utilisation of technically available capacity at the entry points under gas crisis conditions. It must also lay down the necessary restrictions for the volumes exported in case of a gas crisis, in accordance with the requirements laid down in Regulation (EU) 2017/1938 on solidarity.
Moreover, particular emphasis must be placed on the Attica distribution network, the Koropi-Markopoulo branch in particular, which is more vulnerable due to the absence of alternative supply and may, therefore, affect the supply to protected customers.
The Preventive Action Plan specifies appropriate measures to address, in order of priority, the following scenarios, without taking into account the impact of exports10.
10 The conclusions from the export simulation will be used during the preparation of the update of the trans-Balkan Risk Assessment, which will hydraulically simulate specific scenarios for drawing conclusions and facilitating the taking of necessary measures.

PREVENTIVE ACTION PLAN
CONCERNING THE SECURITY OF GAS SUPPLY IN GREECE 2021
Page 61 of 108
2020–2021 period (without exports)
No Scenario Scenario conditions
Priority level A - Non-tolerable (high) risk scenarios
1 Α3a A week with extreme temperatures, withdrawal of Kardia Ι, ΙΙ plants, low hydro generation, failure of two lignite-fired power plants and Italy cable, QSID=0 %, QKIP=50 %, QMES=100 %, Ag. Triada normal conditions:
2 C2a A month with extreme temperatures, withdrawal of Kardia Ι, ΙΙ plants, low hydro generation, failure of two lignite-fired power plants and Italy cable, QSID=100 %, QKIP=0 %, QMES=0 %, long delay of 1st LNG load, normal operation of LNG market
Priority level B - Undesirable (medium) risk scenarios with a class E impact on
electricity generation
3 A1a A week with extreme temperatures, withdrawal of Kardia Ι, ΙΙ plants, low hydro generation, failure of two lignite-fired power plants and Italy cable, QSID=0 %, QKIP=0 %, QMES=100 %, Ag. Triada normal conditions
Priority Level C - Other undesirable (medium) risk scenarios
4 C1a A month of exceptionally high gas demand, withdrawal of Kardia Ι, ΙΙ plants, low hydro generation, failure of two lignite-fired power plants and Italy cable, QSID=50 %, QKIP=50 %, QMES=100 %, Ag. Triada normal conditions
5 C4a A month of exceptionally high gas demand, withdrawal of Kardia I, ΙΙ plants, low hydro generation, failure of two lignite-fired power plants and Italy cable, normal conditions for pipeline gas (14.6 million Νm3/d), delay in arrival of 1st LNG shipment in conjunction with bottlenecks on the LNG market
6 Α4a A week of extreme temperatures, withdrawal of Kardia Ι, ΙΙ plants, low hydro generation, failure of two lignite-fired power plants and Italy cable, normal conditions for pipeline gas (14.6 million Νm3/d, Ag. Triada normal conditions

PREVENTIVE ACTION PLAN
CONCERNING THE SECURITY OF GAS SUPPLY IN GREECE 2021
Page 62 of 108
2021–2022 period (without exports)
No Scenario Scenario conditions
Priority Level Α - Non-tolerable (high) risk scenarios
1 Α3b A week with extreme temperatures, withdrawal of Kardia I, II, III, IV and Amyntaio I, II plants, low hydro generation, failure of two lignite-fired power plants, QSID=0 %, QKIP=50 %, QMES=100 %, Ag. Triada normal conditions
2 C2b A month with extreme temperatures, withdrawal of Kardia I, II, III, IV and Amyntaio I, II plants, low hydro generation, failure of two lignite-fired power plants, QSID=100 %, QKIP=0 %, QMES=0 %, long delay of 1st LNG load, normal operation of LNG market
3 C4b A month of exceptionally high gas demand, withdrawal of Kardia I, II, III, IV and Amyntaio I, II plants, low hydro generation, failure of two lignite-fired power plants, normal conditions for pipeline gas
(14.6 million Νm3/d), delay in arrival of 1st LNG shipment in conjunction with bottlenecks on the LNG market
Priority Level Β - Undesirable (medium) risk scenarios, with a class E impact on
electricity generation
4 A1b A week with extreme temperatures, withdrawal of Kardia I, II, III, IV and Amyntaio I, II plants, low hydro generation, failure of two lignite-fired power plants, QSID=0 %, QKIP=0 %, QMES=100 %, Ag. Triada normal conditions
5 C1b A month of exceptionally high gas demand, withdrawal of Kardia I, II, III, IV and Amyntaio I, II plants, low hydro generation, failure of two lignite-fired power plants, QSID=50 %, QKIP=50 %, QMES=100 %, Ag. Triada normal conditions
Priority Level C - Other undesirable (medium) risk scenarios
6 Β3b A month of average winter conditions, withdrawal of Kardia I, II, III, IV and Amyntaio I, II plants, low hydro generation, failure of two lignite-fired power plants, QSID=100 %, QKIP=0 %, QMES=0 %, long delay of 1st LNG load (21 days), normal operation of LNG market
7 C3b A month of exceptionally high gas demand, withdrawal of Kardia I, II, III, IV and Amyntaio I, II plants, low hydro generation, failure of two lignite-fired power plants, normal conditions for pipeline gas (14.6 million Νm3/d, Ag. Triada normal conditions
8 A4b A week of extreme temperatures, withdrawal of Kardia I, II, III, IV and Amyntaio I, II plants, low hydro generation, failure of two lignite-fired power plants, normal conditions for pipeline gas (14.6 million Νm3/d), Ag. Triada normal conditions
7. The Preventive Action Plan aims, through the measures to be implemented, to satisfy the following risk criteria, in descending order of priority:
Risk criterion 1: No scenarios in areas of non-tolerable (high) risk.
Risk criterion 2: No scenarios in areas of undesirable (medium) risk with a class E impact on electricity generation.
Risk criterion 3: No scenarios in areas of undesirable (medium) risk.
3 Conformity to the infrastructure standard
Pursuant to Regulation (EU) 2017/1938 (Article 5), Member States must ensure that the necessary measures are taken so that, in the event of a disruption of the

PREVENTIVE ACTION PLAN
CONCERNING THE SECURITY OF GAS SUPPLY IN GREECE 2021
Page 63 of 108
single largest gas infrastructure, the technical capacity of the remaining infrastructure, determined according to the N-1 formula as provided in point 2 of Annex II to the Regulation, is able, without prejudice to Article 5(2), to satisfy total gas demand of the calculated area during a day of exceptionally high gas demand occurring with a statistical probability of once in 20 years.
However, this obligation is without prejudice to the responsibility of the transmission system operators to make the corresponding investments and to the obligations of transmission system operators laid down in Regulation (EC) No 715/2009 and Directive 2009/73/EC.
The N-1 standard is calculated using the following formula:
where: ‘Calculated area’ means a geographical area for which the N-1 formula is calculated, as determined by the competent authority.
‘Dmax’ means the total daily gas demand (in million m3/d) of the calculated area during a day of exceptionally high gas demand occurring with a statistical probability of once in 20 years.
‘EPm’ means the technical capacity of entry points (in million m3/d), other than production, LNG and storage facilities covered by Pm, Sm and LNGm, i.e. the sum of the technical capacity of all entry points capable of supplying gas to the calculated area.
‘Pm’ means the maximal technical production capability (in million m3/d), i.e. the sum of the maximal technical daily production capacity of all gas production facilities which can be delivered to the entry points in the calculated area.
‘Sm’ means the maximal technical withdrawal capacity (in million m3/d), i.e. the sum of the maximal technical daily withdrawal capacity of all storage facilities which can be delivered to the entry points of the calculated area, taking into account their respective physical characteristics.
‘LNGm’ means the maximal technical LNG facility capacity (in million m3/d), i.e. the sum of the maximal technical daily send-out capacities at all LNG facilities in the calculated area, taking into account critical elements like offloading, ancillary services, temporary storage and re-gasification of LNG as well as technical send-out capacity to the system.
‘Im’ means the technical capacity of the single largest gas infrastructure (in million m3/d) with the highest capacity to supply the calculated area. When several gas infrastructures are connected to a common upstream or downstream gas infrastructure and cannot be operated separately, they shall be considered as one single gas infrastructure.
3.1 Calculation of the N-1 formula at a national level
3.1.1 Assumptions, methodology and data
The following facts were taken into account to calculate the N-1 ratio:
(1)
100%1N x100,maxD
mImLNGmSmPmEP%1N

PREVENTIVE ACTION PLAN
CONCERNING THE SECURITY OF GAS SUPPLY IN GREECE 2021
Page 64 of 108
Calculated area is assumed to be the Hellenic Natural Gas System (HNGS), including the Hellenic Natural Gas Transmission System in the territory of Greece and the Revithoussa LNG Terminal.
EPm: The technical capacities of the Sidirokastron, Kipi and Nea Mesimvria entry points
Pm=0: Zero natural gas production
Sm=0: There is no underground gas storage facility
LNGm: The technical capacity of the Agia Triada entry point
Ιm: The technical capacity of the single largest gas infrastructure having the highest supply capacity (Agia Triada entry point): equal to LNGm
Dmax: The maximum daily demand on the Greek market.
The technical capacities of entry points are determined by the Operator11. ‘Technical capacity’ (in accordance with Article 2(18) of Regulation (EC) No 1775/2005) means the maximum firm capacity that the transmission system operator can offer to the network users, taking account of system integrity and the operational requirements of the transmission network.
The technical capacity of the northern (via the Sidirokastron BMS) and eastern (via the Kipi BMS) HNGS entry points is estimated using a transmission system simulation, by determining the maximum daily flows through the gas entry points in the north and east. To that end, the hydraulic response of the ΗNGTS is analysed, taking into account the operating conditions and requirements of the transmission system (including delivery pressures at entry points guaranteed by the operators of the upstream systems), in the case of the estimated annual peak day, with requirements for network hydraulic stability and maximum gas supply from the north and the east. The Operator then takes into account — where feasible — available published information from the operators of the upstream transmission systems, aiming to ensure the compatibility of the figures at the interconnection points with the relevant networks. The technical capacity at those points is not limited by the capacity of the corresponding metering stations, given that the latter have sufficient capacity.
Calculation of the technical capacity of the southern entry point (via the Agia Triada metering station) is based on the gasification capacity of the Revithoussa LNG Terminal without taking into account the standby equipment (Sustained Maximum Send Out Rate) assuming an equivalence rate of 1 m3 LNG = 590 Nm3 gas, and taking into account the capacity of the Agia Triada metering station.
The values taken into account in calculating the Ν-1 ratio for calculation years 2020 to 2022 are shown in the table below:
Table 38: Ν-1 calculation data
2020-21
million Νm3/day
2021-22
million Νm3/day
EPSIDIROKASTRON 10.5 10.5
EPKIPI 4.7 4.7
11‘Method for determination of technical capacities’,

PREVENTIVE ACTION PLAN
CONCERNING THE SECURITY OF GAS SUPPLY IN GREECE 2021
Page 65 of 108
EPΝ. MESIMVRIA
Total (EPSIDIROKASTRON, EPKIPI, EPNEA
MESIMVRIA)
15.1 15.1
Im 17.2 19.4
Pm - -
Sm -
Dmax 26.6 26.8
It is noted that regarding the maximum daily demand (Dmax) the main scenario (NECP-adjusted) of DESFA is taken into account, which is adopted in the HNGS Development Study 2021-2030.
3.1.2 Results
By applying the N-1 standard, based on the calculation ratio (1) the following results emerge which show that the N-1 standard is not satisfied by the existing infrastructure at National level.
Table 39: N-1 calculation results without applying market-based demand management
measures
2020-21 2021-22
N-1 (%) 56.9 56.4
Pursuant to Article 5(2) of the Regulation, the obligation of Member States to ensure compliance with N-1 standard, i.e. to ensure in accordance with par. 1 of the same Article, that the other infrastructures have the technical capacity to meet the total gas demand, is also considered to be fulfilled if it is shown in the Preventive Action Plan that a disruption of the gas supply can be adequately and timely compensated by appropriate market-based measures, in terms of demand. For that purpose, the N-1 formula is calculated as set out in point 4 of Annex II to the Regulation. In this Plan it is considered that the implementation of the existing demand management actions results in a benefit of 1.1 (million Nm3/day) from the first-tier and second-tier interruptible customers (market-based measure), while the use of alternative fuel results in a benefit of 8.612 (million Nm3/d)13. Therefore, the implementation of market-based demand management measures (Deff =1.1 million Nm3/day) and from switching fuel at EG plants is considered to lead to total savings of 9.7 million Nm3/day
Next, the N-1 ratio is calculated according to the above, taking into account the implementation of the above demand management measures. However, the infrastructure standard is not fulfilled in this case either.
Table 40: Ν-1 calculation results after applying demand management measures
2020-21 2021-22
N-1 (%) with Deff 59.4 58.9
12 Resulting for a total output power of 1.8 GWe under the 1-day operating consideration at full charge. 13 For the calculation of the benefit from the use of alternative fuel, the available output power recorded during the 1st test was taken into account (after the signing of the contract under Article 73(4) of Law 4001/2011).

PREVENTIVE ACTION PLAN
CONCERNING THE SECURITY OF GAS SUPPLY IN GREECE 2021
Page 66 of 108
N-1 (%) with Deff and dual fuel
84.1 83.1
3.2 Calculation of the N-1 formula at a regional level
Pursuant to the Regulation [Article 5(3)], the competent authorities of the neighbouring Member States may agree on the joint fulfilment of the obligation to comply with the Infrastructure Standard.
At regional level, Greece participates in the trans-Balkan and the Ukrainian risk groups for the supply of gas from the east, in the Algerian risk group for the supply from North Africa and in the Southern Gas Corridor and Eastern Mediterranean groups for the supply from the southeast.
The results of the calculation of the N-1 standard at regional level per risk group, as included in the respective Common Risk Assessments, are given below.
Please note that the results in the risk assessment for the trans-Balkan risk group set out separately the calculations for applying or not applying demand management measures and for deducting or not deducting transit gas. In the Risk Assessment for the Algerian risk group, the standards were calculated assuming two different versions of what constitutes the single largest infrastructure (Im). A similar approach was used in the risk assessment for the Ukrainian risk group, where the standard was looked into by assuming a loss of both the single largest infrastructure and the entire Ukraine supply route. Finally, please note that the results presented for the Algerian and Ukrainian risk groups are estimates for a filling level at storage facilities of 30 % of the maximum working volume.
Table 41: Ν-1 results at a regional level for 2020 and 2021
2020 2021
Trans-Balkan risk group14
Ν-1 (%)
(Im: Isaccea)
86.47 104.71
Ν-1 with Deff (%) 90.96 110.14
Ν-1 (%)
Transit gas
46.06 64.29
Ν-1 (%)
Transit gas with Deff
48.45 67.63
Algerian risk group
Ν-1 (%) (Im: Baumgaurten)
123.00 123.00
Ν-1 (%) (Im: Mazara de Vallo)
132.00 131.00
Ukrainian risk group
Ν-1 (%)
(Im: Uzhgorod)
151.00 -
14 The standard is being updated due to the completion of the Turkish Stream pipeline and the setup of the new Bulgaria-Turkey interconnection point, allowing the transit of gas from Turkey to the trans-Balkan area as of 1 January 2020. The results will be included in the updated common risk assessment of the trans-Balkan risk group, to be notified to the Commission soon.

PREVENTIVE ACTION PLAN
CONCERNING THE SECURITY OF GAS SUPPLY IN GREECE 2021
Page 67 of 108
Ν-1 (%) (Im: Ukraine route)
144.00 -
3.3 Bidirectional flow capacity
3.3.1 Interconnection points with bidirectional flow capacity
The only interconnection point in Greece with bidirectional flow capacity is the one between Kulata (BU) and Sidirokastron. That point’s technical capacity (physical flow) is 117 804 036 kWh/day and the reverse flow technical capacity (from Greece to Bulgaria) is 64 826 100 kWh/day. The physical reverse flow capacity became operational on 1 June 2017, when the second version of the Interconnection Agreement between the DESFA and Bulgartransgaz operators took effect. The standardised physical reverse flow (one-year long) product offered by both Operators as part of a bundle was made available for the first time in annual capacity sale auctions for said interconnection point in March 2017. The reverse flow interruptible product is also offered for auction in accordance with the provisions of Regulation (EU) 2017/459.
Greece also operates an interconnection point with Turkey. As it is an interconnection point with a third country, the European Regulations are only applicable by the Greek side. For the time being, there is no possibility of physical, but only of virtual, reverse flow at this interconnection point.
3.3.2 Interconnection points for which an exemption has been granted
There are no interconnection points for which an exemption has been granted under Article 5(4) of the Regulation. Two new interconnection points are expected to become operational in 2020:
1. The Nea Mesimvria Interconnection Point between the HNGS and TAP
2. The Komotini Interconnection Point between the HNGS and IGB
The TAP and IGB pipelines will operate under an exemption granted in accordance with Article 36 of Directive 2009/73/EC, and therefore the provisions of the EU regulations will apply insofar as they do not come into conflict with the provisions of the relevant Exemption Decisions.
The HNGS-TAP interconnection point will offer bidirectional flow on the TAP side. However, achieving reverse flow requires the installation of a new compressor station in the Nea Mesimvria area on the HNGS side, which is included in DESFA’s approved 10-year Development Plan (RAE Decision No 755/2020 ‘Approval of the HNGS Development Programme 2020-2029, Government Gazette, Series II, No 1746/07.05.2020).
Achieving reserve flow (from Bulgaria to Greece) for the IGB pipeline requires the operation of a compressor on the IGB pipeline, which is only scheduled to be built in phase two of implementation/expansion of the project for increasing physical flow technical capacity from 3 bma/year to 5 bma/year.

PREVENTIVE ACTION PLAN
CONCERNING THE SECURITY OF GAS SUPPLY IN GREECE 2021
Page 68 of 108
4 Conformity to the supply standard
4.1 Definition of ‘protected customers’
Article 17(12) of L. 4203/2013 (Government Gazette, Series I, No 235/01.11.2013) added a new point (v1) to Article 2(2) of Law 4001/2011, which defines ‘protected natural gas customers’ as ‘household customers connected to a gas distribution network’. The same sentence provides that the Minister for the Environment and Energy may adopt a decision expanding the definition of ‘protected natural gas customers’ to include the additional categories envisaged in Article 2(1)(a) and (b) of the then applicable Regulation (EU) No 994/2010 [now Regulation (EU) 2017/1938].
Under the above enabling provision, by Decision No Δ1/Β/10233/2014 (Government Gazette, Series II, No 1684/24.06.2014) of the Deputy Minister for the Environment and Energy the definition of ‘protected customers’ was expanded to include the categories referred to in Article 2(a) and (b) of the Regulation. More specifically, in addition to household customers connected to a natural gas distribution network, the above Decision also defines the following categories of consumers as protected natural gas customers:
(a) The following bodies which provide essential social services, provided that they are connected to a natural gas distribution network:
(i) hospitals, primary, secondary and tertiary healthcare facilities;
(ii) school complexes, kindergartens, nurseries, schools of all educational levels;
(iii) airports;
(iv) fuel stations for public transport vehicles and waste collection vehicles;
(v) buildings housing public services, in accordance with Article 14(1) of Law
2190/1994 (Government Gazette, Series I, No 28).
(b) All commercial and industrial customers, as determined by the different gas providers or gas suppliers, falling in the category of small and medium-sized enterprises, as defined in the Commission Recommendation of 6 May 2003 (2003/361/EC), with an annual contracted consumption lower than 10 000 MWh.
(c) District heating installations, insofar as they provide heating to household customers and the customers referred to in points (a) and (b), provided that these installations cannot switch to alternative fuel and are connected either to a natural gas distribution network or to the natural gas transmission network.
Table 42 below shows ex-post data on consumption by protected customers in 2019, collected by the Ministry of the Environment and Energy in accordance with Decision No Δ1/Β/10233/2014 above and Regulation (EC) No 1099/2008.
Table 42: Ex-post data on consumption by protected customers for 2019 (source: Ministry of the Environment and Energy)
Gas consumption figures 2019 mNcm MWh
Percentage (%) of
total annual gas consumption

PREVENTIVE ACTION PLAN
CONCERNING THE SECURITY OF GAS SUPPLY IN GREECE 2021
Page 69 of 108
Total domestic gas consumption 2019
Annual gas consumption 2019 5 230.790 57 640 886.112
Consumption of protected customers 2019
1. Household customers 476.834 5 254 493.406 9.12 %
2. Commercial and industrial
customers (ACQ < 10 000 MWh) 197.026 2 171 136.168 3.77 %
3. Basic social infrastructure
(broken down into the following sub-categories)
97.534 1 074 780.826 1.86 %
Education infrastructure 17.754 195 637.744 0.34 %
Administrative services 9.784 107 811.695 0.19 %
Hospitals 44.603 491 508.148 0.85 %
Airports 12.692 139 856.704 0.24 %
Fuel stations for public transport
vehicles and waste collection
vehicles
12.702 139 966.534 0.24 %
Total (2+3) 294.560 3 245 916.994 5.63 %
4. District heating (for households
or businesses in categories 2 and 3) 12.566 138 476.698 0.24 %
Total (2+3+4) 307.127 3 384 393.692 5.87 %
4.2 Supply standard
The supply standard aims to minimise the likelihood of a reduction in demand among protected customers. To this end, Article 6 of Regulation (EU) 2017/1938 provides that the competent authority shall require the natural gas undertakings to take measures to ensure the gas supply to the protected customers of the Member State in each of the following cases:
(a) extreme temperatures during a 7-day peak period occurring with a statistical probability of once in 20 years.
In this context, this Risk Assessment looked into scenario A4a for the period 2020–2021 and scenario A4b for the period 2021–2022, which take account of conditions without disruptions in the supply of gas. The scenarios were designated as undesirable (medium) risk scenarios for electricity generation.
(b) any period of 30 days of exceptionally high gas demand, occurring with a statistical probability of once in 20 years.
In this context, this Risk Assessment looked into scenario C3a for the period 2020–2021 and scenario C3b, which take account of conditions without disruptions in the supply of gas. Scenario C3a was designated as a tolerable (low) risk scenario for EG, while scenario C3b as an undesirable (medium) risk scenario.
(c) for a period of 30 days in the case of disruption of the single largest gas infrastructure under average winter conditions.
In this context, the Risk Assessment looked into scenario B5a for the period 2020–2021 and scenario B5b (see para. Error! Reference source not found.), which have a duration of 1 month and take account of an interruption in operation of the LNG facilities on the island of Revithoussa for 1 month. The scenarios were designated as undesirable (medium) risk scenarios for electricity generation.

PREVENTIVE ACTION PLAN
CONCERNING THE SECURITY OF GAS SUPPLY IN GREECE 2021
Page 70 of 108
Thus, the supply standard is satisfied by means of the measures provided for in the provisions of the updated Emergency Plan (RAE decision No 567/2019, Government Gazette, Series II, No 2501/25.06.2019) such as:
the Emergency Gas Supply Interruption Order List (Annex 1 to the updated Emergency Plan),
the existing gas demand management measures, as presented in the
following paragraph 4.2.1,
in conjunction with the security of supply provided by the long-term gas import contracts and under the assumption of zero export activity to Bulgaria during the activation of a crisis scenario.
4.2.1 Description of existing demand management measures
The measures, which were evaluated in the Preventive Action Plan 2018 (Government Gazette, Series II, No 3329/2018 and 2672/2018) and are still in force, aiming at the management of gas demand in times of crisis, are presented below.
4.2.1.1 First-tier interruptible customers
Type of measure: National existing market-based measure for a level 2 crisis Administrative measure for a level 3 crisis
Description: The measure for ‘first-tier interruptible customers’ was adopted by RAE Decision No 344/2014 (Government Gazette, Series II, No 2536/23.09.2014), as amended by RAE Decision No 1211/2018 (Government Gazette, Series II, No 5891/31.12.2018) with a view to minimising the cost of the demand management mechanism in the market in natural gas.
The procedures for the implementation of the interruptibility measure were established in Annex 5 of the approved Emergency Plan (RAE Decision No 567/2019).
First-tier interruptible customers are committed, as a minimum: (a) to reduce their demand for gas in excess of forty percent (40 %) of their daily demand at any time within six (6) hours from a relevant supplier request during level 2 (alert) crises; (b) to maintain a reduced level of gas demand for the duration of the crisis, with a maximum limit of thirty (30) days per year; and (c) to pay retroactively the fee which corresponds to the total quantities consumed during the term of the contract, plus one hundred percent (100 %) in case of breach of the above conditions.
During a level 3 (emergency) crisis, gas supply to first-tier interruptible customers will be interrupted/reduced by way of priority over other customers, in accordance with the Emergency Gas Supply Interruption Order List of Annex 1 to the Emergency Plan using the interruption/reduction procedure set out in Annex 2 to the Plan (RAE Decision No 567/2019).
The Emergency Plan provides that large customers may, at their initiative, request to be granted ‘first-tier interruptible customer’ status by submitting a written declaration-request to the HNGS operator, which keeps a register of interruptible customers.
Addressed to: Large customers, as defined by L. 4001/2011, except those that consume gas for electricity generation.
Compliance monitoring system: In the context of its responsibilities, RAE monitors and supervises the functioning of the energy market, including the fulfilment of the above obligations by first-tier interruptible customers, in accordance with Article 22 of

PREVENTIVE ACTION PLAN
CONCERNING THE SECURITY OF GAS SUPPLY IN GREECE 2021
Page 71 of 108
Law 4001/2011. Special conditions related to monitoring are set out in Annex 5 of the current Emergency Plan.
Penalty scheme: In case RAE finds a breach of the obligations by the first-tier interruptible customer, especially after being informed by the competent Operator, the consumer is obliged to pay a security of supply fee corresponding to the total quantities consumed from the date of their registration in the Register of first-tier interruptible customers and the expiration of their twelve-month stay in the above Register during which the breach took place.
Also, in accordance with Article 36 of Law 4001/2011 on administrative penalties, RAE has the power to impose a fine of up to 10 % of the annual turnover on undertakings carrying out energy-related activities in case of breach of the provisions of Law 4001/2011 and of the relevant delegated acts or of the conditions laid down in their authorisations. RAE’s power to impose a fine on undertakings carrying out energy-related activities applies to all the actions described in this Action Plan. For the sake of brevity, we have not repeated each described action, unless there is a specificity in the action concerned.
Estimated cost: Given their contribution towards minimising the costs of the demand management mechanism, first-tier interruptible customers are exempted from payment of a security of supply fee. The maximum expected savings per year, as voluntary demand management, can be estimated at 120 000 MWh/y or 4 000 MWh/d.
Cost recovery mechanism: The cost incurred due to the first-tier interruptible customers’ exemption from payment of a security of supply fee is allocated, according to the provisions of RAE Decisions No 344/2014 and 1211/2018 to other gas consumer categories.
4.2.1.2 Second-tier interruptible consumers
Type of measure: National Existing market-based measure
Description: The measure described in Article 73(5) of Law 4001/2011 provides for the conclusion of contracts between gas suppliers and large customers for gas demand management in return for payment in order to address supply crises.
Under a contract (RAE Decision No 628/2016, Government Gazette, Series II, No 4395/31.12.2016) concluded between the HNGS Operator and individual gas suppliers, the amounts paid by the supplier for proven demand management after an alert level crisis has been declared and for as long as the crisis remains at the level of alert or emergency may be recovered, in whole or in part, up to a maximum amount to be determined by a RAE decision. The amount of the supplier’s costs to be recovered by DESFA is reduced on a case-by-case basis depending on the supplier’s contribution towards the cause of the crisis, in accordance with the more specific provisions of the HNGS Management Code.
Based on Article 73(6) of Law 4001/2011, RAE adopted Decision No 628/2016 on the approval of standard contract templates (i) for maintaining an alternative fuel reserve and the operating availability of a power plant, and (ii) for the financing of a natural gas demand management mechanism as per Article 73(4), (5) and (6) of Law 4001/2001, as currently in force, thus making it possible to recover, in whole or in part, up to the maximum amounts determined by Law 4001/2011 and RAE Decision No 344/2014, as amended under RAE Decision No 1211/2018, the amounts paid by
PREVENTIVE ACTION PLAN
CONCERNING THE SECURITY OF GAS SUPPLY IN GREECE 2021
Page 72 of 108
the supplier to second-tier interruptible customers for proven gas demand management while addressing crises as per the above.
The term ‘second-tier interruptible customer’ was introduced in the standard contract for the financing of a Natural Gas Demand Management Mechanism, approved by the above-mentioned RAE Decision No 628/2016. In accordance with the relevant definition, ‘second-tier interruptible customer’ means a large customer who has entered into a contract with a supplier for the management of gas demand in return for payment in the event of a crisis on the HNGS. The category of second-tier interruptible customers does not include first-tier interruptible customers, as defined in RAE Decision No 344/2014, as amended by RAE Decision No 1211/2018.
The measure keeps aiming to achieve a demand management level of 20 % of the maximum daily demand of large customers, for a maximum period of 5 days per year, which corresponds, in accordance with the impact analysis of the Risk Assessment for the industrial sector, to a class B impact (recoverable financial loss). The maximum daily expected savings are estimated approximately at 9 000 MWh/day (45 000 MWh/year).
The financial incentive which represents, under the current framework, the maximum unit compensation for a provenly non-received amount of natural gas in the context of demand management, after an ‘alert’ level crisis is declared, reaches 16 €/MWh.
Addressed to: Suppliers of large customers
Compliance monitoring system: In addition to the responsibility of RAE to monitor and supervise the functioning of the energy market, in accordance with Article 22 of Law 4001/2011, should the supplier fail to fulfil its obligations under Article 4 of the contract entered into with the HNGS operator in accordance with Article 73(5) of Law 4001/2011, the supplier is deemed to have failed to prove its gas demand management as per the above. As a result, in that case the supplier will not be entitled to, and the operator will not be under obligation to pay, the agreed financial consideration.
Penalty scheme: No payment of the agreed financial consideration by the HNGS operator to the gas supplier if the latter has failed to fulfil its obligations under Article 4 of the contract entered into in accordance with Article 73(5) of Law 4001/2011.
It is also explicitly provided for that the amount of supplier’s costs to be recovered by DESFA is reduced on a case-by-case basis depending on the supplier’s contribution towards the cause of the crisis, in accordance with the more specific provisions of the HNGS Management Code.
Estimated cost: 0.72 m €/year as a limit of compensation of suppliers for covering the cost of this mechanism
Cost recovery mechanism: In accordance with Article 73(6) of Law 4001/2001, in return for the fulfilment of the HNGS operator’s obligations under the contracts entered into with natural gas suppliers to second-tier interruptible customers as per Article 73(5), all HNGS users pay a security of supply fee per unit of natural gas they receive from the HNGS, which is recovered from natural gas customers, in accordance with RAE Decision No 344/2014, as amended by RAE Decision No 1211/2018.

PREVENTIVE ACTION PLAN
CONCERNING THE SECURITY OF GAS SUPPLY IN GREECE 2021
Page 73 of 108
4.2.1.3 Use of alternative fuel in gas-fired power plants
Type of measure: National15 Administrative
Description: In accordance with Article 73(4) of Law 4001/2011, holders of gas-fired electricity generation authorisations, who are under obligation to maintain alternative fuel reserves under the conditions of their authorisations, are required to sign a contract with the HNGS operator for maintaining, for a consideration, an alternative fuel reserve and maintaining the operating availability of the plant by the use of alternative fuel. The consideration covers the capital costs of the alternative fuel facilities of a standard power generation plant, as defined in RAE Decision No 344/2014, as amended by RAE Decision No 1211/2018, the capital cost of maintaining oil stocks, as well as the difference between oil and natural gas costs for the performance of tests to certify the possibility of the plant to operate with alternative fuel either before the conclusion of the contract under this paragraph, provided that the testing process results in the signing of the contract, or after the conclusion of the contract, as well as regular tests in the facilities of the holders of electricity generation authorisations, who conclude the above contract with the HNGS operator.
The process of activation and implementation of the measure will be described in detail in the Emergency Plan while the compensation for the operation of these plants during gas crises will be described in the relevant regulations governing the operation of the electricity market.
The natural gas plants that have the obligation to keep an alternative fuel (diesel) are presented in the following table.
Table 43: Total thermal power plants with an obligation to keep an alternative fuel
GENERATING
PLANT
INSTALLED POWER
(MW)
AVAILABLE POWER WITH
ALTERNATIVE FUEL (MW)
Komotini 484.6 483
Lavrio IV 560 530
ENTHES (Elpedison) 408.4 355.53
Thisvi (Elpedison) 421.6 288.42
Heron (3 plants) 148.5 137.67
Total 2 023.1 1 794.62
The expected contribution of the action is estimated at additional savings of 57 428 MWh/day for a daily load (16 hours) or approximately 86 142 MWh/day for a complete daily load (24 hours).
Addressed to: Electricity generation licence holders operating on natural gas, whose power generating plants can be operated with alternative fuel (diesel) and who, according to the terms of the relevant electricity generation licence, must keep alternative fuel reserves for this purpose.
Compliance monitoring system: According to the provisions of the Contract (RAE Decision No 628/2016, Government Gazette, Series II, No 4395/30.12.2016) signed
15 This measure is included in RAE’s proposal under consultation for the Solidarity Mechanism of Article 13 of Regulation (EU) 2017/1238 as both a voluntary and an administrative regional measure.

PREVENTIVE ACTION PLAN
CONCERNING THE SECURITY OF GAS SUPPLY IN GREECE 2021
Page 74 of 108
between the electricity generation licence holders operating on natural gas and the HNGS operator, to certify the ability of those plants to operate on an alternative fuel, regular tests with liquid diesel fuel shall be carried out in the presence of the HNGS operator at the facilities of said power generators, with a frequency of one (1) test per quarter, for a period of one (1) hour and by operating each plant at its minimum charge level. In case of unsuccessful testing of the plant to operate on an alternative fuel, the respective power generator may proceed to two (maximum) repetitions of this test, within fifteen (15) days from the day of the first unsuccessful testing in the above quarter. In addition, and in accordance with the provisions of the above Contract, the power generator must keep a quantity of alternative fuel reserves throughout the duration of the Contract at least equal to the alternative fuel reserve provided for said plant in accordance with point C.6 of RAE Decision No 1211/2018, as applicable. At least once every quarter, the power generator is obliged to check the amount of alternative fuel reserve, in the presence of the operator, to verify compliance with the obligation to cover the alternative fuel reserve. In the event that during this check, this amount is found to be lower than that of the alternative fuel stock, the power generator must replenish it at least up to the level of the alternative fuel reserve, within five working days at the latest.
Penalty scheme: Where an electricity producer that has entered into a contract for maintaining an alternative fuel reserve and maintaining the operating availability of a power plant fails to fulfil, or improperly fulfils, its obligations under said contract (RAE Decision No 628/2016), this constitutes serious grounds for terminating the contract and refusing to pay the additional fuel cost incurred for testing purposes, which is payable to the electricity producer under RAE Decision No 344/2014, as amended by RAE Decision No 1211/2018.
Estimated cost: The amount of consideration paid by DESFA to the above power plants (Table 43) consists of the following three costs: (a) the capital cost of the alternative fuel plant of a standard power plant; (b) the capital cost of maintaining oil stocks; (c) the difference between the cost of oil and gas for regular testing at the facilities of the electricity generation licence holders, and is budgeted at EUR 4.95 million per year.
Cost recovery mechanism: The above costs will be recovered through the security of supply fee that is collected from all HNGS users per unit of gas quantity that they receive from the HNGS, which is recovered from gas customers, in accordance with RAE Decision No 344/2014, as amended by RAE Decision No 1211/2018, and in accordance with the terms of the electricity generator contract entered into by and between the electricity producer and the HNGS operator (RAE Decision No 628/2016), in accordance with Article 73(4) of Law 4001/2011.
4.2.2 Additional standards and obligations relating to security of supply
In accordance with Article 6(2) of Regulation (EU) 2017/1938, Member States may adopt further standards and obligations for reasons of security of gas supply. These standards must be based on the risk assessment and must be reflected in the preventive action plan.
The significant and increasing share of natural gas in the primary energy balance of the electricity generation sector has made it necessary to adopt additional standards and obligations with a view to ensuring the security of supply to electricity consumers. Moreover, the importance of supporting critical gas-fired power plants is also stressed by the Regulation. A lack of fuel in the above plants may have a significant impact on

PREVENTIVE ACTION PLAN
CONCERNING THE SECURITY OF GAS SUPPLY IN GREECE 2021
Page 75 of 108
the operation of the electricity system and may affect gas transmission and gas supply to household customers and small and medium sized undertakings, as space heating and hot water systems always need power supply.
The following table (Table 44) shows all gas-fired power plants. The designation of these plants as ‘critical’ was based on the Risk Assessment, pursuant to the provisions of Article 11(7) of the Regulation. However, their final designation (i.e. as critical) will be made on a daily basis during crises, as a result of ad hoc short-term analyses of hydraulic stability and electrical system adequacy of the HNGS and HPTS operators (DESFA, ADMIE), taking into account the current conditions.
Please note that the table of critical plants also includes the plants with the possibility of exchanging fuel under certain conditions (e.g. restrictions on the duration of operation on diesel).
Table 44: Total of gas-fired thermal power plants with the possibility of using alternative
fuel, under critical conditions
GENERATING PLANT INSTALLED
POWER
(MW)
POSSIBILITY OF
USING
ALTERNATIVE FUEL
AVAILABLE
POWER WITH
ALTERNATIVE FUEL (MW)
Aliveri V 426.9
Komotini 484.6 √ 483
Lavrio IV 560 √ 530
Lavrio V 385.2
Megalopoli V 500
ENTHES (Elpedison) 408.4 √ 355.53
HERON ΙΙ 432
Ag. Theodoroi (Korinthos
power) 436.6
Thisvi (Elpedison) 421.6 √ 288.42
Ag. Nikolaos (Protergia) 444.5
Heron (3 plants) 148.5 √ 137.67
Aluminium (3 plants) 334

PREVENTIVE ACTION PLAN
CONCERNING THE SECURITY OF GAS SUPPLY IN GREECE 2021
Page 76 of 108
5 Preventive measures
Taking into account the Risk Assessment conclusions, the following strategies are adopted with a view to strengthening consumer protection in the event of significant disruptions in the demand and/or supply of natural gas.
Strategy S1: Improving the regulatory framework to increase the use of existing natural gas infrastructure
Strategy S2: Enhancing LNG availability in times of increased risk
Please note that infrastructure development projects (new sources of gas supply and storage), which are to be implemented from 2020 onwards, are presented in Chapter 7.
Following are the actions that were initially designated as applicable and capable of supporting the above strategies:
Table 45: List of the Plan’s actions
Action Period
A1. Regulating the special capacity offered by the Operator and distribution at the entry points
2020 onwards
combined with one of the following alternatives:
A2. Improving LNG offloading framework – scheduling A 2020 - 2025
A3. Improving LNG offloading framework – scheduling B 2020 - 2025
A4. Use of the Revithoussa facility to maintain a seasonal LNG reserve for electricity generation
2020 onwards
The above actions have a positive effect on reducing the risk of the examined crisis scenarios, according to the following tables (Table 46 and Table 47).

PREVENTIVE ACTION PLAN
CONCERNING THE SECURITY OF GAS SUPPLY IN GREECE 2021
Page 77 of 108
Table 46: Contribution of the actions in reducing the risk of crisis scenarios (2020-2021)
Impact on Action
A1 A2 A3 A4
Scenario A3a Χ Χ Χ X
Scenario C2a Χ Χ Χ
Scenario A1a Χ Χ Χ X
Scenario C1a Χ Χ Χ X
Scenario C4a Χ Χ Χ X
Scenario A4a Χ Χ X X
Table 47: Contribution of the actions in reducing the risk of crisis scenarios (2021-2022)
Impact on Action
A1 A2 A3 A4
Scenario A3b Χ Χ Χ X
Scenario C2b Χ Χ Χ
Scenario C4b X X X X
Scenario A1b Χ Χ Χ X
Scenario C1b Χ Χ Χ X
Scenario C4a Χ Χ Χ X
Scenario B3b X X X
Scenario C3b Χ Χ X X
Scenario A4b Χ Χ X X
The following paragraphs contain a detailed description and assessment of the actions.

PREVENTIVE ACTION PLAN
CONCERNING THE SECURITY OF GAS SUPPLY IN GREECE 2021
Page 78 of 108
5.1 Description of actions
5.1.1 Action A1: Regulating the special capacity offered by the Operator and distribution at the entry points
Type of measure: Market-based (regulatory) Description: The HNGS operator, based on a specific methodology, analyses the hydraulic response of the ΗNGTS and calculates the technical capacity [as defined in Article 2(18) of Regulation (EC) No 1775/2005], which it is able to offer to users, taking into account the operational requirements of the network.
Thus, specific capacities have been defined for the entry points, which are valid until the start of operation of the Compression Station in Ampelia (Thessaly) and the upgrade of the Compression Station in N. Mesimvria (Table 48).
Table 48: Current technical capacities of ΗNGTS entry points (source: DESFA)
Entry point Technical capacity (MWh/day)
Sidirokastron 117 804.036
Total of Kipi and Nea Mesimvria (TAP) 53 368.256
In cases of level 2 and/or 3 gas crisis, where there is a significant reduction in the delivery of gas quantities (i.e. in relation to the confirmed gas quantities of the transport users) and/or pressure less than the minimum entry pressure in at least one of the above ΗNGTS entry points, it is appropriate to enable the HNGS operator, taking into account the current operating conditions, to change the capacities of the other entry points and to offer them through market-based mechanisms, namely through auctions using an electronic platform. In this way the maximum technical capacity of the System can be utilised.
Implementation time: 2020 onwards Cost: None. Expected contribution: The exceptional change and utilisation of the capacity of the ‘Nea Mesimvria’ or ‘Kipi’ entry points were examined, in cases of disruption of the gas supply to the other northern Entry Points, in order to make the most of the total technical capacity of the ΗNGTS from the northern entry points, i.e. 171 172 292 kWh/day.
5.1.2 Action A2: Improving LNG offloading framework – scheduling A
Type of measure: Market-based (regulatory)
Description: The international situation with regard to the prices of Liquefied Natural Gas (LNG) in combination with the upgrade of the Revithoussa Terminal has led to a sharp increase in interest in LNG imports at this terminal. The degree of use of the LNG facility has increased significantly, resulting in the multiplication of committed slots per period by LNG users and the strengthening of competition between them for commitment of offloading time, storage space, gasification capacity and transport capacity at the entry point.

PREVENTIVE ACTION PLAN
CONCERNING THE SECURITY OF GAS SUPPLY IN GREECE 2021
Page 79 of 108
As a result of the above, after the competent operator submitted a relevant proposal to RAE for the integrated treatment of the issues of LNG facility management and the provision of LNG services, in order to facilitate the users and maximise their possibility to be active in Revithoussa, the process of the annual scheduling of LNG offloading in the context of the 6th revision of the HNGS Management Code (RAE Decision No 1433/2020, Government Gazette, Series II, No 4799/30.10.2020), was amended. Articles 81 et seq. of the HNGS Management Code and the LNG Auction Manual (RAE Decision No 1436/2020, Government Gazette, Series II, No 4803/30.10.2020), establish that:
(a) The annual schedule is drawn up with a Calendar Year implementation horizon for each of the next five Years. Especially for the first implementation of the new scheme, the process concerns only one year, i.e. 2021.
(b) The integration of the users in the annual schedule is carried out through market-based mechanisms, namely through auctions using an electronic platform. Through these auctions, which are carried out in two phases, standard LNG slots (Phase 1) and supplementary LNG capacity, which must be integrated with a bundled capacity section of Phase 1 in continuous LNG capacity for each user (Phase 2), are placed on offer. LNG users who are also transport users have the right to participate in LNG auctions.
(c) The annual LNG offloading schedule is fully binding for Users to whom LNG offloading slots are allocated and there are provisions for fines in the event that a scheduled LNG load is not offloaded and the respective slot is not allocated successfully in the secondary market by the user to whom it was primarily distributed.
The HNGS operator, taking into account the annual and seasonal gas demand in the HNGS during the last three years, divided each year into sub-consecutive time intervals (programming periods) and proposed a specific number of one or more different standard LNG slots, where the amount of LNG shipment to be offloaded amounts to 147 000 m3 LNG (1 000 000 MWh of natural gas) and 73 000 m3 LNG (500 000 MWh of natural gas) respectively, providing the necessary flexibility.
Action A2 assumes 4 arrivals of LNG shipments in January, for a total quantity of 3 000 000 MWh (Schedule A).
The implementation of Action A2 obviously excludes the implementation of Action A3 and Action A4, while it can be applied in this Plan in addition to Action A1.
Implementation time: 2020 onwards Cost: None. Expected contribution: The Action is expected to increase the availability of LNG in periods of increased risk and is implemented within a reliable market-based framework (auctions) proposed by the operator, and ensures the commitment of LNG users. However, the Action does not contribute to the observance of the infrastructure standard, while its implementation involves uncertainty related to the response of the users and the outcome of the auctions.
PREVENTIVE ACTION PLAN
CONCERNING THE SECURITY OF GAS SUPPLY IN GREECE 2021
Page 80 of 108
5.1.3 Action A3: Improving LNG offloading framework – scheduling B
Type of measure: Market-based (regulatory)
Description: Similar to Action A2 with increased LNG arrivals during the winter months.
More specifically, it assumes 5 arrivals of LNG shipments in January, for a total quantity of 4 000 000 MWh (Schedule B). Already for the year 2021, Schedule B was approved for the annual LNG schedule of the same year, pursuant to Article 110(8) of the HNGS Management Code, in RAE Decision No 1513/2020 (Government Gazette, Series II, No 5094/18.11.2020).
The implementation of Action A3 obviously excludes the implementation of Action A2 and Action A4, while it can be applied in this Plan in addition to Action A1.
Implementation time: 2020 onwards Cost: None. Expected contribution: The Action is expected to further increase the availability of LNG, compared to A2, in periods of increased risk and is implemented within a reliable market-based framework (auctions) proposed by the operator, and ensures the commitment of LNG users. However, the Action does not contribute to the observance of the infrastructure standard, while its implementation also involves uncertainty related to the response of the users and the outcome of the auctions.
5.1.4 Action A4: Use of the Revithoussa facility to maintain a seasonal LNG reserve for electricity generation
Type of measure: Administrative measure
Description: Holders of electricity generation authorisations must, under the conditions laid down in their authorisations, ensure the uninterrupted operation of their plants on natural gas for not less than five (5) days in case of an unscheduled interruption in the supply of gas, in case of an HNGS emergency in particular, in accordance with the framework in place. Some of them have opted for fulfilling the above specific condition by maintaining an LNG reserve in a storage facility. The above specific condition aims to ensure that gas supply crises are properly addressed.
Upon completion of the upgrading works at the Revithoussa terminal – upon commissioning of the third tank in particular – the terminal’s total capacity will now increase to 225 000 m3 of LNG (from 130 000 m3). The possibility of utilising the above infrastructure, up until construction of a long-term (underground) natural gas storage facility, with a view to fulfilling the relevant condition laid down in the authorisations granted to the above electricity producers, was considered and found to be inappropriate, as it was found that the estimated use of the infrastructure (temporary storage and arrival of ships with a larger capacity) would not ensure adequate availability for reserving the entire seasonal storage required (approximately 700 000 MWh) without adversely impacting the terminal’s flexibility in respect of the size and frequency of arrival of ships, whereas its use would fall back to operating conditions worse than those existing before the upgrading.

PREVENTIVE ACTION PLAN
CONCERNING THE SECURITY OF GAS SUPPLY IN GREECE 2021
Page 81 of 108
That is why it was reconsidered to utilise a specific part of the terminal’s capacity with a view to maintaining a buffer reserve for electricity generation purposes. In that case, the obliged electricity producers will have a seasonal storage option with a view to increasing the demand side response time in case of a sudden demand/supply change.
Buffer reserve quantity
The buffer reserve quantity is calculated for each obliged electricity generation licence holder whose licence includes a relevant special condition, and corresponds to a complete 16-hour load per day for 5 days for the respective power plant. Obliged plants, according to RAE Decision No 1211/2018, as applicable, are included in the following Table (Table 49).
Table 49: Electricity generation licence holders who are obliged to maintain an LNG
reserve in a storage facility
Electricity generation plant
Fuel reserve (m3 LNG)
Daily reserve –
16h
Estimated buffer
reserve – 5 days
Aliveri V 1 889 9 445
Lavrio V 1 773 8 867
Megalopoli V 2 319 11 596
Heron II 1 921 9 605
Korinthos POWER, Ag. Theodoroi 1 973 9 865
PROTERGIA Ag. Nikolaos 1 961 9 806
ALUMINIUM 1 608 8 040
Total 13 445 67 223
Description of procedure: The procedure for the implementation of this Action is included in RAE Decisions Nos 1211/2018 and 1287/2018 (Government Gazette, Series II, No 5900/31.12.2018), as in force.
Monitoring system: DESFA is responsible for monitoring the implementation of the measure, the reserve quantity and the fulfilment of the electricity producers’ obligations. DESFA must notify to RAE in writing any change to the buffer reserve during its maintenance period, as well as all other conditions that affect the implementation of the measure.
Addressed to: Electricity generation licence holders that have chosen to fulfil the specific condition on uninterrupted operation by maintaining an LNG reserve in a storage facility (electricity producers included in the ADMIE plant registry during the implementation period).
Application period: Winter 2021, 1 January – 1 March (2 months) and Winter 2022,
1 December – 1 March (3 months) where the condition will be fulfilled no later than
30 November of the year.
Implementation time: Until March 2022
To extend the implementation of the measure in the years 2021-2022, it is necessary
to properly adjust the legislative and regulatory framework.
Penalty scheme: Pursuant to Article 36 of Law 4001/2011 on administrative
penalties, RAE has the power to impose a fine of up to 10 % of the annual turnover

PREVENTIVE ACTION PLAN
CONCERNING THE SECURITY OF GAS SUPPLY IN GREECE 2021
Page 82 of 108
on undertakings carrying out energy-related activities in case of breach of the
provisions of Law 4001/2011 and of the relevant delegated acts or of the conditions
laid down in their authorisations.
Estimated cost: Compensation is paid against the cost of using the Revithoussa
facility for maintaining the entire buffer reserve. It is estimated to stand at a maximum
of approximately 1 million €/y.
The LNG supply costs, the LNG losses and other costs resulting from the maintenance of the reserve will be borne solely by the obliged electricity producer and will be recovered from the market in electricity by being included in the sales orders of the participants.
In case of implementation of Action A4, DESFA will not pay compensation to the obligors or charge them for the provision of storage space for the buffer reserve at the Revithoussa LNG Facility. It will recover the relevant costs from the Security of Supply Account.
In the event that the electricity producer proposes an equivalent storage solution (alternative to the Revithoussa tank) and the proposal is accepted by RAE, compensation will be paid to the electricity producer against the costs involved, up to a maximum amount that corresponds to the equivalent cost of the seasonal storage service in the Revithoussa tank.
Cost recovery mechanism: Through the security of supply fee collected from all HNGS users per unit of natural gas they receive from the HNGS, which is recovered from natural gas customers, in accordance with RAE Decision No 344/2014, as amended by RAE Decision No 1211/2018.
Expected contribution: The Action is expected to increase the availability of LNG in times of increased risk and in particular to contribute to reducing the response time of suppliers to a sudden change in demand or supply of LNG. The Action was implemented in the winter seasons 2018–2019 and 2019–2020 as part of implementing the provisions of the Preventive Action Plan 2018. However, the conditions in the LNG market and the alternative supply sources of Greece have since changed substantially, as described in detail in section 1.2.3 and in particular in graphs 6 and 9, limiting the need to implement the Action in relation to the intended purpose of securing the supply of Greece with LNG, especially if the caused limitation of the flexibility of the LNG terminal is taken into account. This Plan re-evaluates the Action in conjunction with Action A1. The implementation of Action A4 is considered to exclude the implementation of Actions A2 and A3.

PREVENTIVE ACTION PLAN
CONCERNING THE SECURITY OF GAS SUPPLY IN GREECE 2021
Page 83 of 108
5.2 Evaluation of actions
5.2.1 Evaluation methodology
The methodologies set out below were used to evaluate the actions described in the previous paragraphs, as they were deemed appropriate for the purposes of this Preventive Action Plan.
5.2.1.1 Multi-criterion decision analysis – Analytic Hierarchy Process (AHP)
Regulation (EU) 2017/1938 sets out the key criteria used to evaluate the actions included in the Preventive Action Plan. These relate to the economic impact, effectiveness and efficiency, the impact on the environment and on the market and, as appropriate, the impact on the security of supply of another Member State. Furthermore, it was deemed appropriate in this Plan to expand the evaluation framework in order to also take into account an assessment of the uncertainty inherent in the implementation of each action.
The multi-criterion decision analysis (MCDA), in particular the widespread analytic hierarchy process (AHP), was deemed to be the most appropriate approach to the evaluation and prioritisation of the actions considered, as it allows for looking into multiple evaluation criteria and weighing both quantitative and qualitative assessments of the impact, benefits and uncertainty of each action.
The key implementation steps of the AHP method, for the purposes of this Plan, are presented below.
A. Hierarchical analysis of the decision problem
In the first stage, the problem was analysed in terms of its components, using an appropriate hierarchical structure. The first stage of the structure presents the objective of the problem, and the last one presents the actions to be evaluated. The intermediate levels present the evaluation criteria. The above information is further detailed in the case of this Plan as follows (see also Graph 11):
Objective: To evaluate the actions of the Plan in terms of benefits, costs and uncertainty and to prioritise them
Evaluation criteria:
1 Effectiveness of the action in terms of risk mitigation: It evaluates the impact of each action on mitigating the risk level of non-tolerable (high) and undesirable (medium) risk scenarios, compared to the one presented in the Risk Assessment. The assessment of the above effect was carried out by re-simulating the crisis scenarios for each action, calculating the residual hazard and improving the gas mass deficit.
2 Charge of the security of supply fee (TAE): It evaluates the estimated costs incurred in connection with the security of supply fee (TAE).
3 Impact of action on the environment: It evaluates the estimated (qualitative) impact of the action on CO2 emissions or other negative environmental impacts.
4 Impact of action on the functioning of the market: It evaluates the expected (qualitative) impact of the action on the functioning of the markets in natural gas and electricity (e.g. protection against distortions of competition,

PREVENTIVE ACTION PLAN
CONCERNING THE SECURITY OF GAS SUPPLY IN GREECE 2021
Page 84 of 108
proportionality, difficulties in implementation, reactions from stakeholders, etc.).
5 Impact of action on the security of supply of another Member State: It evaluates the expected (qualitative) impact of the action on strengthening the capacity to show solidarity to another Member State(s).
6 Uncertainty: It evaluates the degree of uncertainty associated with the action’s capacity to attain its intended objectives. Said uncertainty may relate to the action implementation environment and potential risks to which the action is exposed during its implementation.
Graph 11: Hierarchical structure of decision model
To evaluate the actions of the Plan in terms of benefits, costs and uncertainty and to prioritise them
Risk mitigation
Financial impact - TAE fee
Impact on the environment
Impact on the market
Impact on the security of supply of another Member State
Uncertainty
Action A1 in combination with A2 (A1/2)
Action A1 in combination with A3 (A1/3)
Action A1 in combination with A4 (A1/4)
B. Benchmarking and determination of preferences
In the second stage, pairwise comparisons were made firstly between the evaluation criteria and secondly between the alternative actions and the criteria, with a view to:
determining the relative importance of the criteria;
determining the relative importance of the alternative actions.
The pairwise comparisons were made by an expert panel / decision making group, taking into account the available quantitative/qualitative data and using the 9-degree relative importance Saaty scale.
C. Calculation of priorities
Αξιολόγηση δράσεων Σχεδίου με όρους ωφελειών, κόστους και αβεβαιότητας και ιεράρχηση
Mείωση επικινδυνότητας
Οικονομικός αντίκτυπος –
επιβάρυνση ΤΑΕ
Αντίκτυπος στο περιβάλλον
Αντίκτυπος στην αγορά
Αντίκτυπος στην ασφάλεια εφοδιασμού άλλου Κ-Μ
Δράση Δ1 σε συνδυασμό με Δ2
(Δ1/2)
Δράση Δ1 σε συνδυασμό με Δ3
(Δ1/3)
Δράση Δ1 σε συνδυασμό με Δ4
(Δ1/4)
Αβεβαιότητα

PREVENTIVE ACTION PLAN
CONCERNING THE SECURITY OF GAS SUPPLY IN GREECE 2021
Page 85 of 108
Upon completion of the pairwise comparisons, the relevant weightings of the evaluation criteria and the final evaluation rating were calculated by the use of specialised software. The analysis results are presented in paragraph 5.2.2.
5.2.1.2 Evaluation of the effectiveness of the actions in terms of risk mitigation
To evaluate the effectiveness of the actions in terms of risk mitigation and to support the expert panel, the following indicators were calculated: (A) indicator of the contribution of the action to risk mitigation (IR), and (B) indicator of the contribution of the action to the total deficit under each scenario (IM).
(A) Indicator of the contribution of the action to risk mitigation (IR)
The IR indicator shows the impact of the action on mitigating the risk level of non-tolerable (high) and undesirable (medium) risk scenarios, as presented in the risk matrices (see Error! Reference source not found.).
The indicator was calculated by taking the following steps:
1. For each action considered, the resulting benefit in the demand and/or availability/supply of natural gas was assessed.
2. For each non-tolerable (high) and unacceptable (medium) risk scenario, the mass balance was recalculated, the impact on electricity generation and industrial customers was assessed, and new risk matrices were developed. It should be noted that the assumptions and simulation models used in the Risk Assessment were not modified in these calculations.
3. By comparing the initial matrices (see Error! Reference source not found.) against the new ones, the cumulative impact of each assessed action on all scenarios was calculated on the basis of the following scoring rules.
i. One (1) point is assigned for each scenario shift i (i: 1 to 6 for the period 2020-2021 and i: 1 to 8 for the period 2021-2022) by one cell in the risk matrix. It should be noted that a score of less than 1 is assigned where an action is deemed to contribute only partially, without resulting in a complete scenario shift.
ii. Where the shift relates to a priority scenario A (in a red cell), the above score is multiplied by a factor of wA=6. Where the shift relates to a priority scenario B (in a yellow cell with a class E impact on electricity generation), the above score is multiplied by a factor of wB=3. Where the shift relates to a priority scenario C (in a yellow cell with an impact of any class other than E on electricity generation), the above score is multiplied by a factor of wC=1.
iii. The cumulative impact of the action on all scenarios is calculated as the sum of the scores assigned in steps 3(i) and 3(ii).
The mathematical formula used to calculate the indicator that shows each action’s contribution to risk mitigation is:
(number of shifts Α)
(number of shifts B)
(number of shifts C)
ΙR

PREVENTIVE ACTION PLAN
CONCERNING THE SECURITY OF GAS SUPPLY IN GREECE 2021
Page 86 of 108
Scenario i: 1 to 6 for the period 2020-2021 and 1 to 8 for the period 2021-2022
Shift Α: scenario i shift from a cell of a non-tolerable (high) risk scenario, wA=6
Shift B: scenario i shift from a cell of an undesirable (medium) risk with a class E impact on electricity generation, wB=3
Shift C: scenario i shift from a cell of an undesirable (medium) risk scenario with an impact of any class other than E on electricity generation, wC=1
(B) Indicator of the contribution of the action to the total deficit under each scenario (IM)
The Im indicator shows the percentage benefit (%) from the implementation of an action in respect of the mass balance under each scenario looked into.
5.2.2 Evaluation results
5.2.2.1 Effectiveness of the actions in terms of risk mitigation
Following is an assessment of the IR and IΜ indicators for the actions in the periods 2020-2021 and 2021-2022.
I. Period 2020-2021
A. Indicators of the contribution of the actions to risk mitigation (IR)
By applying the algorithm presented in the previous paragraph, we obtain the following values for the IR indicator for each action considered. It should be noted that the maximum value that the indicator can take is 23, which corresponds to the shift of all the scenarios looked into to an acceptable/low risk area.
Table 50: Indicators of the contribution of the actions to risk mitigation (IR) for the
period 2020-2021
Actions A1/2
A1 in combination with A2
A1/3 A1 in combination with A3
A1/4 A1 in combination with
A4 Indicator ΙR (degree)
22 23 14
Indicator ΙR (%)
96 100 61
It is inferred from the above table that action A1, when applied in combination with Action A3 (A1/3), achieves the greatest positive effect on the risk matrix. Alternatives A1/2 and A1/4 follow.
B. Indicators of the contribution of the actions to the total deficit under each scenario (IM)
Similarly, the results of calculation of the indicator (ΙΜ), show that Action A1, when combined with Action A3 (A1/3) achieves the greatest contribution to covering mass balance deficits. Alternatives A1/2 and A1/4 follow.
ΙΙ. Period 2021-2022
A. Indicators of the contribution of the actions to risk mitigation (IR)

PREVENTIVE ACTION PLAN
CONCERNING THE SECURITY OF GAS SUPPLY IN GREECE 2021
Page 87 of 108
The values of the indicator (IR) for the actions concerning the period 2020-2021 are listed in the table below. It should be noted that, in the case at hand, the maximum value that the indicator can take is 34, which corresponds to the shift of all the scenarios looked into to an acceptable/low risk area.
Table 51: Indicators of the contribution to risk mitigation (IR) for the period 2021-2022
Actions A1/2
A1 in combination with A2
A1/3 A1 in combination with A3
A1/4 A1 in combination with
A4 Indicator ΙR (degree)
26 34 18
Indicator ΙR (%)
76 100 53
It is inferred from the above table that Action A1, when applied in combination with Action A3 (A1/3), achieves the greatest positive effect on the risk matrix. Alternatives A1/2 and A1/4 follow.
B. Indicator of the contribution of the actions to the total deficit under each scenario (IM)
Similarly, the results of calculation of the indicator (ΙΜ), show that Action A1, when combined with Action A3 (A1/3) achieves the greatest contribution to covering mass balance deficits. Alternatives A1/2 and A1/4 follow.

PREVENTIVE ACTION PLAN
CONCERNING THE SECURITY OF GAS SUPPLY IN GREECE 2021
Page 88 of 108
5.2.2.2 Prioritisation of actions
Applying the multi-criterion decision analysis, as described in paragraph 5.2.1.1, led to the following results from the evaluation of actions, taking into account all the criteria considered.
I. Period 2020-2021
Graph 12: Overall evaluation of actions concerning the period 2020-2021
Overall grade Actions 2020-2021
A1/2. Regulatory measures (A1) and first plan of LNG offloading (A2)
Α1/3. Regulatory measures (A1) and second plan of LNG offloading (A3)
A1/4. Regulatory measures (A1) and seasonal LNG reserve (A4)
A1/2
A1/3
A1/4
Based on the above results, the alternatives in the implementation of actions considered for the period 2020–2021 are classified in the following descending order of preference:
1. Α1/3. Regulatory measures (A1) in combination with the second plan of LNG offloading (A3)
2. A1/2. Regulatory measures (A1) in combination with the first plan of LNG offloading (A2)
3. A1/4. Regulatory measures (A1) in combination with seasonal LNG reserve (A4)

PREVENTIVE ACTION PLAN
CONCERNING THE SECURITY OF GAS SUPPLY IN GREECE 2021
Page 89 of 108
ΙΙ. Period 2021-2022
Graph 13: Overall evaluation of actions concerning the period 2021-2022
Overall grade
Actions 2021-2022
A1/2. Regulatory measures (A1) and first plan of LNG offloading (A2)
Α1/3. Regulatory measures (A1) and second plan of LNG offloading (A3)
A1/4. Regulatory measures (A1) and seasonal LNG reserve (A4)
A1/2
A1/3
A1/4
Based on the above results, the alternatives in the implementation of actions considered for the period 2021–2022 are classified in the following descending order of preference:
1. Α1/3. Regulatory measures (A1) in combination with the second plan of LNG offloading (A3)
2. A1/2. Regulatory measures (A1) in combination with the first plan of LNG offloading (A2)
3. A1/4. Regulatory measures (A1) in combination with seasonal LNG reserve (A4)
5.2.2.3 Calculation of residual risk
Following a step-by-step simulation of the implementation of the actions and a cumulative calculation of their benefits in respect of the mass balance under each scenario (risk reduction loop), the residual risk was calculated and it was found that
PREVENTIVE ACTION PLAN
CONCERNING THE SECURITY OF GAS SUPPLY IN GREECE 2021
Page 90 of 108
the risk criteria set for this Plan were met (see paragraph Error! Reference source not found.).
A. Period 2020-2021
For the period 2020–2021 it was found that the implementation of Action A1 in combination with A3 (A1/3) satisfies all the risk criteria.
More specifically:
Risk criterion 1 was satisfied, namely there were no high risk scenarios, as both (2) scenarios (A3a, C2a) shifted from the non-tolerable risk area in the risk matrix.
Risk criterion 2 was satisfied, namely there were no undesirable (medium) risk scenarios with class E impact for electricity generation, as scenario A1a shifted from the specific cell of the risk matrix.
Risk criterion 3 was satisfied, namely there was complete absence of non-
desirable risk scenarios.
B. Period 2021-2022
Similarly, for the period 2021–2022 it was found that the implementation of Action A1 in combination with A3 (A1/3) satisfies all the risk criteria.
More specifically:
Risk criterion 1 was satisfied, namely there were no high risk scenarios, as all 3 scenarios (A3b, C2b, C4b) shifted from the non-tolerable risk area in the risk matrix.
Risk criterion 2 was satisfied, namely there were no undesirable (medium) risk scenarios with class E impact for electricity generation, as scenarios A1b and C1b shifted from the specific cell of the risk matrix.
Risk criterion 3 was satisfied, namely there was complete absence of non-desirable risk scenarios.
Based on the above, this Preventive Action Plan proposes the implementation of Action:
A1. Regulating the special capacity offered by the Operator and distribution at the entry points
in combination with Action:
A3. Improving LNG offloading framework – scheduling B.

PREVENTIVE ACTION PLAN
CONCERNING THE SECURITY OF GAS SUPPLY IN GREECE 2021
Page 91 of 108
6 Other measures and obligations
6.1 Development of specifications and guidelines for the establishment of Business Continuity Systems
As the Risk Assessment points out, the pandemic crisis and the implementation of restrictive measures throughout the country to prevent the transmission of the COVID-19 virus have also affected the natural gas and electricity market, but have not caused any problems related to security of supply. This was achieved, on the one hand, by the readiness of the operators and the main gas suppliers, in combination with the relatively limited illness from the virus and, on the other hand, by the significantly low gas and electricity demand due to the general suspension of businesses and mild weather conditions.
However, the intense uncertainty regarding the evolution of the phenomenon, especially during the winter period (2020–2021) but also the extent of the economic recession makes it necessary for actors with a particularly critical role in the security of supply to take measures in order to ensure, in all cases, the continuation of their smooth operation. To this end, the Commission has published a list of good practices16 for tackling the pandemic crisis in the energy sector.
In this context, RAE deems it appropriate to establish appropriate Business Continuity Systems (BCS), especially for gas and electricity operators and electricity generation licence holders. In order to support the effort made by the actors to develop the above Systems and at the same time to ensure their suitability in relation to security of supply, it intends to implement the following actions:
Development of minimum standards for the design, installation and monitoring of BCS.
These specifications will be based on relevant international standards (e.g. ISO 22301) and good practices and will cover, for example:
- the objectives, the business continuity strategy and the plans to achieve them,
- the analysis of operational impact and impact on security of supply,
- the establishment and implementation of documented business continuity procedures.
Development of guidelines for the design, installation and monitoring of BCS.
These guidelines will aim to facilitate the above actors during the design phase of the new Systems or the adaptation of the existing ones to the requirements set.
6.2 Obligation of operators and electricity generation licence holders to maintain Business Continuity Systems
In the context of the above, operators and electricity generation licence holders are obliged to:
16 https://ec.europa.eu/energy/sites/ener/files/1_en_document_travail_service_part1_v3.pdf
PREVENTIVE ACTION PLAN
CONCERNING THE SECURITY OF GAS SUPPLY IN GREECE 2021
Page 92 of 108
- develop a Business Continuity System that will meet the specifications
set by RAE (see §6.1),
- regularly brief RAE in writing about the ability of the body to deal with disorganising events and threats, and the relevant measures that it plans or has implemented. RAE shall be briefed weekly in case of crisis and every three months in any other occasion.
6.3 Risk Management System planning to ensure the security of supply
The increased importance of the identification, assessment and monitoring of risks that may affect natural gas supply in Greece, in an ever-changing international environment, requires migrating to an organisation method that allows for continuous effective cooperation between stakeholders, monitoring and assessment of environment conditions which may give rise to crisis situations and ensuring the uniformity, accuracy and adequacy of risk analysis substantiation.
In this context, RAE finds it appropriate to undertake, as competent authority and in the context of Regulation (EU) 2017/1938, the implementation of the following measures:
Assessment of the existing risk management framework, including, but not be limited to, an analysis of:
- the procedures followed to identify, analyse and assess the risk;
- the methodologies, tools and techniques used;
- the framework of cooperation between the parties involved, the relevant responsibilities and accountability obligations;
- the risk management structures and organisation method.
Development of a risk management system, setting out:
- the policy, objectives and scope of risk management, in relation to the security of natural gas supply in Greece;
- the environment/framework in which risk management is to be carried out;
- the appropriate permanent and/or ad-hoc risk management bodies, such as the risk management team and appropriate working groups;
- the method of cooperation, obligations and responsibilities of the parties involved;
- the appropriate standardisation of actions for the identification, analysis, assessment and monitoring of risks.
6.4 Obligations to transmission system operators in respect of substantiated demand assessment
To better assess potential risks on the HNGS and HPTS due to possible gas supply problems in Greece and, therefore, to better and more effectively plan measures for preventing and addressing these problems, it is necessary to carry out the fullest possible natural gas demand assessment per critical period and develop potential demand development scenarios.
In this context, the transmission system operators (DESFA SA and ADMIE SA) jointly prepare, by 30 April each year, a seasonal demand report, which sets out

PREVENTIVE ACTION PLAN
CONCERNING THE SECURITY OF GAS SUPPLY IN GREECE 2021
Page 93 of 108
scenarios on the daily (Dmax), weekly and monthly demand for natural gas (1.7 and 30 days with a day time step). The scenarios relate to winter periods in the following four years.
The assessment will include demand under the conditions referred to in Regulation (EU) 2017/1938:
(a) Extreme temperatures during a 7-day peak period occurring with a statistical probability of once in 20 years.
(b) Any period of 30 days of exceptionally high gas demand, occurring with a statistical probability of once in 20 years.
(c) Any period of 30 days under average winter conditions.
(d) ‘Dmax’ means the total daily natural gas demand (in million m3/d) of the calculated area during a day of exceptionally high gas demand occurring with a statistical probability of once in 20 years.
More specifically:
The gas demand scenarios for electricity generation are based on a study (seasonal/short-term adequacy forecasts) prepared by the HPTS operator using, if possible, the methodology proposed by ENTSO-E. The study is submitted to RAE along with the seasonal demand report, i.e. by 30 April each year at the latest.
Account should be taken in particular of the evolution of demand in relation to temperature. Moreover, the methodology used in each case should be presented, along with any assumptions made for the assessment and integration in the demand scenarios of the energy inputs uncertainty, the RES and hydro generation variability, the availability of lignite-fired plants (taking into account fuel quality considerations), any interconnector balance models, as well as the overall impact of seasonality on the capacity of plants (maintenance schedule, decommissioning, failure forecast).
The gas demand scenarios other than those relating to electricity generation will be prepared by DESFA in cooperation with the distribution network operators, taking due account of the demand-temperature correlation.
The report will include a record of the methodology used to determine temperature from 1 to 20 (demand-temperature correlation) and a record of the methodology used to estimate the maximum daily demand (Dmax).
Similarly, the distribution system operators provide DESFA with all information that is necessary for determining the demand scenarios per customer category.
Moreover, the distribution system operators should distinguish between the above demand estimates per category of protected consumers, in accordance with the definition in place (Government Gazette, Series II, No 1684/24.06.2014).
6.5 Obligations of natural gas suppliers
In accordance with the Regulation on Gas Supply Authorisations (Government Gazette, Series II, No 3430/17.10.2018), each holder of a supply authorisation that provides services, directly or indirectly, to protected customers, as defined in the legislation in force, is under obligation to take all measures necessary to secure the
PREVENTIVE ACTION PLAN
CONCERNING THE SECURITY OF GAS SUPPLY IN GREECE 2021
Page 94 of 108
uninterrupted supply of natural gas to those customers, complying with the supply standard in accordance with the provisions of Regulation (EU) 2017/1938, and in particular Article 6 thereof.
Furthermore, the above Suppliers are required to provide information, i.e. to notify in writing to RAE by 30 June each year:
i) A list of the measures they plan to implement with a view to complying with the supply standard, in accordance with the provisions of Article 48(1)(a) of Law 4001/2011 and the provisions of Regulation (EU) 2017/1938 (Article 6 in particular), also providing a brief substantiation of the adequacy of these measures.
ii) An ex post assessment of the adequacy of the measures implemented with a view to complying with the above standard during the previous winter period.
In this regard, RAE has the authority to require those gas supply authorisation holders to add further measures to the list referred to under point (i) if it considers that the uninterrupted gas supply to protected customers is not ensured and the supply standard is not satisfied.
Finally, according to the same Regulation, gas suppliers are obliged to secure an adequate quantity of natural gas to meet the supply obligations they have undertaken under the supply agreements they have concluded with customers. Moreover, gas importers/suppliers holding gas-fired electricity generation authorisations are under obligation to fulfil their contractual obligations to electricity producers by covering 100 % of the MDCQ for which a contract has, or will be, entered into for the winter periods, in particular for the period from 1 December to the end of March.
6.6 Obligations of holders of gas-fired electricity generation authorisations
As explained in paragraph 4 and in accordance with the Risk Assessment results, the role of natural gas in electricity generation on the Greek interconnected system is crucial. Therefore, a potential deficiency in gas supply to gas-fired power plants will seriously impair the functioning of the electricity system and/or impede the transmission of natural gas.
Thus, the uninterrupted availability of the gas-fired power plants in the System, according to the provisions of the HPTS Management Code (RAE Decision No 1412/2020, Government Gazette, Series II, No 4658/20.10.2020) and of the Regulation on the Operation of the Day-Ahead and Intra-Ahead Market Schedule (Energy Exchange Regulation), is critical to the operational security of the electrical system. Therefore it is appropriate to impose certain obligations on holders of gas-fired electricity generation authorisations as follows:
i) Holders of gas-fired electricity generation authorisations are obliged to inform the Authority about the ways in which the operation of their plants is ensured, in accordance with the HPTS Management Code and the Regulation on the Operation of the Day-Ahead and Intra-Ahead Market Schedule, especially for the winter season (December to February).
ii) In particular, they must, by 30 October each year at the latest, notify to the authority a brief written document substantiating the adequacy of the actions taken to comply with the conditions laid down in their

PREVENTIVE ACTION PLAN
CONCERNING THE SECURITY OF GAS SUPPLY IN GREECE 2021
Page 95 of 108
authorisations and to ensure the functioning of their plants, in accordance with the HPTS Management Code and the Regulation on the Operation of the Day-Ahead and Intra-Ahead Market Schedule.
iii) RAE may request holders of gas-fired electricity generation authorisations to take additional measures, if it considers that the achievement of the above objective is not ensured.
6.7 Exemption of the diesel used as alternative fuel from excise duty
The exemption from the excise duty of diesel, which is used for the production of electricity as an alternative fuel during gas crises, is considered a necessary measure both to streamline the operating costs of these plants and to reduce the burden on the final consumer, as well as to the compliance of the current framework with L. 2960/2001 (‘customs code’).
Consideration is thus being given to the possibility of exempting the internal combustion diesel used as alternative fuel in gas-fired power plants from excise duty, in the context of shifting to a different fuel only in the event of a gas crisis, under alarm levels 2 and 3, as per the provisions of the legislative and regulatory framework in force. This measure aims to streamline the operating costs of these plants when they function on alternative fuel, which increases significantly as a result of the excise duty imposed on diesel and which is passed on to final electricity consumers.
In a level 2 and 3 gas crisis, the diesel concerned is used in replacement of gas, which, when used as fuel for electricity generation purposes only, is exempted from excise duty under Article 78(1)(g) of the customs code. In this respect, the customs code provides in Article 78(4) that, without prejudice to other Community and national provisions, the exemptions from excise duty granted under that Article will also apply mutatis mutandis to products other than those referred to in Article 72 of the code, where they are used as substitutes of energy products, are intended for the same purposes as those of the substituted products and are subject to tax control to verify that they are used lawfully.

PREVENTIVE ACTION PLAN
CONCERNING THE SECURITY OF GAS SUPPLY IN GREECE 2021
Page 96 of 108
7 Infrastructure projects
The tables below present infrastructure projects that are included in the fourth (4th) list of projects of common interest [PCI List, Delegated Commission Regulation (EU) 2020/389 of 31 October 2019 amending Regulation (EU) No 347/2013 of the European Parliament and of the Council as regards the Union list of projects of common interest], as well as projects that are in progress which are included in HNGS’s ten-year development plan. The above projects are expected to significantly improve the security of supply in Greece on a medium-/long-term basis (from 2021 onwards).
1. Trans Adriatic Pipeline
Description
The Trans-Adriatic Pipeline (TAP) is a gas pipeline construction project intended for the transmission of natural gas from the Caspian region to Europe. The TAP is interconnected with the Trans-Anatolian Natural Gas Pipeline (TANAP) at the Greece-Turkey border and crosses North Greece, Albania and the Adriatic Sea before it lands on the North Italian coast, to connect to the Italian gas network. Companies participating in the share capital of the TAP: BP (20 %), SOCAR (20 %), Snam (20 %), Fluxys (19 %), Enagás (16 %) and Axpo (5 %).
Length The TAP route will have a length of 878 km (550 km in Greece, 215 km in Albania, 105 km in the Adriatic Sea, and 8 km in Italy)
Capacity 10 bcm/y. Option for increasing capacity to 20 bcm/y
Map
Source: https://www.tap-ag.gr
Included in Project of common interest (List 4) High-priority project under the CESEC
Estimated time schedule
The construction of the pipeline has been completed and it has been put into operation
Implementation phase
Completed

PREVENTIVE ACTION PLAN
CONCERNING THE SECURITY OF GAS SUPPLY IN GREECE 2021
Page 97 of 108
2. Interconnector Greece-Bulgaria (IGB)
Description
The Interconnector Greece-Bulgaria (IGB) Project comprises a pipeline approximately 182 km in length (with 31 km in Greece), as well as the necessary support installations (metering stations, valve stations, operating centre). The pipeline will start in Komotini and end up in Stara Zagora, to link the Greek and Bulgarian gas networks, also featuring a reverse flow option. The Shareholders of ICGB AD are the Bulgarian State Company Bulgarian Energy Holding (BEH) (50 %) and the Greek Company YAFA POSEIDON (50 %), in which DEPA SA and the Italian EDISON have an equal share.
Length/Diameter 182 Km / 32’’
Capacity Up to 3 bcm/y and 5 bcm/y (phase 2) from Greece to Bulgaria. The reverse flow option will be implemented in phase 2.
Map
Source: ICGB
Included in Project of common interest (List 4) Priority project under the CESEC
Estimated time schedule
2021 (gas filling – commissioning)
Implementation phase 12/2015 FID (Final Investment Decision); Construction began in the last four months of 2019

PREVENTIVE ACTION PLAN
CONCERNING THE SECURITY OF GAS SUPPLY IN GREECE 2021
Page 98 of 108
3. Compression station at Kipi17
Description
The aim of the project is to increase the pressure at the Kipi entry point in order to increase the current technical capacity of 4.3 million Nm3/d for natural gas imports from Turkey. It will also ensure natural reverse flow at the Sidirokastron interconnection point above the current technical capacity of 5.7 million Nm3/d (in conjunction with the Ampelia compression station project) and will allow gas flow into the HNGS from the underground storage in Kavala or the FSRU in Alexandroupolis.
Capacity The capacity of the compressor is initially estimated at (1+1) x 2.5 MW ISO
Map
Included in 2021-2030 Development Plan Projects of common interest (List 4)
Estimated time schedule
Commissioning date: 23 July Date of inclusion in the system: 23 October
Implementation phase
Under maturation
17 Projects included in the 2021-2030 DESFA Development Plan, which is subject to approval

PREVENTIVE ACTION PLAN
CONCERNING THE SECURITY OF GAS SUPPLY IN GREECE 2021
Page 99 of 108
4. Compression station at Ampelia
Description
The purpose of the project is to ensure the hydraulic adequacy of the ΗNGTS given the expected increase in the transported quantities of natural gas from north to south with the commissioning of the TAP pipeline and its interconnection with the ΗNGTS
Capacity 2 compression units in a backup unit with power (2+1)x10 MW
Map
Included in 2021-2030 Development Plan Possible subsidy from NSRF 2014-2020
Estimated time schedule Commissioning date: 23 March Date of inclusion in the system: 23 June
Implementation phase Implementation of basic design

PREVENTIVE ACTION PLAN
CONCERNING THE SECURITY OF GAS SUPPLY IN GREECE 2021
Page 100 of 108
5. Underground storage facility in Kavala
Description
The project involves converting the submarine gas field in the South Kavala area, which is being depleted, into Greece’s first underground gas storage (UGS) facility. The underground storage of South Kavala is an energy infrastructure of strategic importance, as it is expected to strengthen the energy security of the natural gas market (security of supply) at national and European level, but also to contribute significantly to reducing energy costs and optimising the system operation (load balancing, gas hub)
Capacity
The capacity of the underground storage (UGS) is estimated at approximately 1 bcm. The annual volume throughput is estimated at 360 18million Nm3 or 720 million Nm3, for one or two cycles per year, respectively, however it may vary (the same applies to the injection/deliverability rates, respectively). The maximum daily capacity of natural gas delivered and injected into the ΗNGTS is estimated at 4 million Nm3/d. The maximum daily injection capacity of the underground storage with natural gas, is estimated at 5 million Nm3/d.
Map
Vc -=M
Source: Energean Oil & Gas
Included in Project of common interest (List 4)
Estimated time schedule
2023
Implementation phase
A tender of the Hellenic Republic Asset Development Fund (‘TAIPED’) for the appointment of a Contractor for the concession, use, development and exploitation of the underground natural space of the field as a storage space for natural gas, is currently in progress.
6. North Greece LNG
18 It may vary (the same applies to the injection/deliverability rates, respectively). Depends on the
investment.

PREVENTIVE ACTION PLAN
CONCERNING THE SECURITY OF GAS SUPPLY IN GREECE 2021
Page 101 of 108
Description
The ‘Independent Natural Gas System of Alexandroupolis’ project comprises an offshore floating LNG reception, storage and gasification unit and a submerged and onshore pipeline system used to transmit gas to the HNGS and then to final customers.
Length 28 km (gas transmission pipeline)
Diameter 30’’
Capacity 6.1 bcm/y
Map
Included in Project of common interest (List 4), priority project under CESEC, subject to certain conditions.
Estimated time schedule
2023
Implementation phase:
Completion of a front end engineering design (FEED) for the Alexandroupolis LNG project (update 09.2017, source Gastrade)

PREVENTIVE ACTION PLAN
CONCERNING THE SECURITY OF GAS SUPPLY IN GREECE 2021
Page 102 of 108
7. KORINTHOS LNG – ASFA DIORYGA GAS
Description
The ‘Independent Natural Gas System of Korinthos’ (ASFA) project comprises an offshore floating LNG reception, storage and gasification of Liquefied Natural Gas unit (Floating storage and Regasification Unit - FSRU) with a capacity of 135 000-170 000 m3 of LNG and a 20” system of a submarine pipeline with a length of approximately 500 m and a land pipeline with a length of approximately 1 650 m, through which the natural gas is forwarded to the HNGS and from there to the final consumers. More specifically, it consists of:
a floating storage and regasification unit (FSRU);
four LNG storage tanks with a total storage
capacity of 130 000-180 000 m3;
a gasification unit with a capacity of 300-500 m3
LNG/hour;
gas connection pipes for the supply of fuel to the
HNGS through a new metering station.
The project, due to its location in the area of Agioi Theodoroi, will enable the import of gas quantities to the southern part of the HNGS, where there is significant gas consumption.
Length 2.15 km
Capacity 1.6-2.6 bcm/y, with the possibility to reach 4 bcm/y
Included in To be included in the DESFA Development Plan
Estimated time schedule 2022 (Commissioning)
Implementation phase Capacity Commitment Application to DESFA
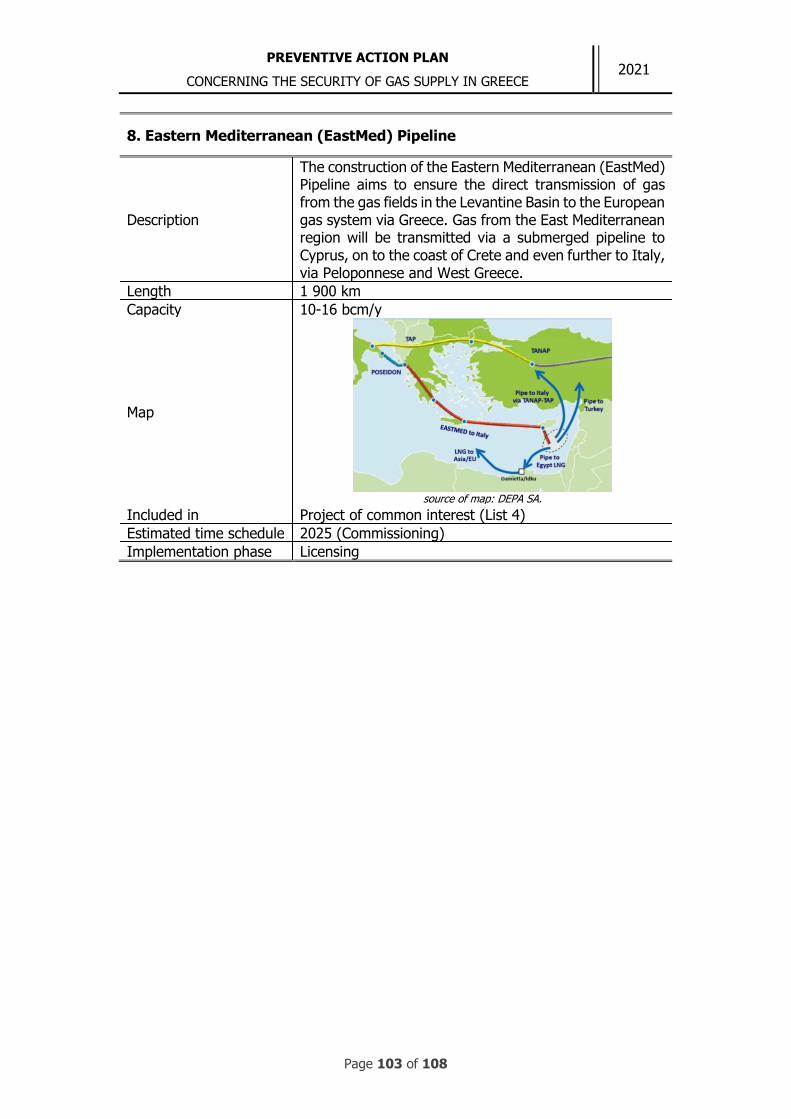
PREVENTIVE ACTION PLAN
CONCERNING THE SECURITY OF GAS SUPPLY IN GREECE 2021
Page 103 of 108
8. Eastern Mediterranean (EastMed) Pipeline
Description
The construction of the Eastern Mediterranean (EastMed) Pipeline aims to ensure the direct transmission of gas from the gas fields in the Levantine Basin to the European gas system via Greece. Gas from the East Mediterranean region will be transmitted via a submerged pipeline to Cyprus, on to the coast of Crete and even further to Italy, via Peloponnese and West Greece.
Length 1 900 km
Capacity 10-16 bcm/y
Map
source of map: DEPA SA.
Included in Project of common interest (List 4)
Estimated time schedule 2025 (Commissioning)
Implementation phase Licensing

PREVENTIVE ACTION PLAN
CONCERNING THE SECURITY OF GAS SUPPLY IN GREECE 2021
Page 104 of 108
8 Obligations of services of general interest relating to security of supply
No services of general interest (SGI) have been defined at present in accordance with Article 55 of L. 4001/2011 on security of supply.

PREVENTIVE ACTION PLAN
CONCERNING THE SECURITY OF GAS SUPPLY IN GREECE 2021
Page 105 of 108
9 Consultations with interested parties
This Plan was put up for public consultation on the Authority’s website (http://www.rae.gr/site/categories_new/about_rae/factsheets/2020/maj/101120.csp) and was notified in English to the competent authorities of the relevant Member States, in accordance with Annex I to Regulation (EU) 2017/1938, to the Risk Groups of which Greece is a member, namely the trans-Balkan, the Ukrainian and the Algerian. Until the expiry of the time limit (i.e. on 12 February 2021) set by RAE to the Competent Authorities of the Member States to which the draft preventive action was sent, the competent authority of Romania was the only Member State that forwarded its comments, which were taken into account during the elaboration of the final Preventive Action Plan.
The consultation lasted from 10 November 2020 until 20 November 2020, and continued, following a decision of RAE for its extension, until 4 December 2020 (http://www.rae.gr/site/categories_new/about_rae/factsheets/2020/maj/181120_3.csp).
In the context of the consultation, RAE received comments from EDA ATTIKIS SA, PPC SA, DEPA SA, MYTILINEOS SA – GROUP OF COMPANIES, DESFA SA, as well as opinions submitted as confidential regarding the details of their sender and their content.

PREVENTIVE ACTION PLAN
CONCERNING THE SECURITY OF GAS SUPPLY IN GREECE 2021
Page 106 of 108
10 Regional dimension
The strategies chosen include actions focusing on improving the regulatory framework, increasing the use of existing infrastructure and enhancing the availability of LNG in times of increased risk. Demand-driven actions, such as the measure of switching fuels at gas-fired power plants, also remain in place. These measures are expected to have a positive impact on neighbouring Member States. Please note also that strengthening the capacity to show solidarity to neighbouring Member States was a benchmark criterion for the actions considered (see paragraph 5.2.1).
10.1 Calculation of the N-1 formula at risk group level
The calculations are shown in paragraph 3.2.
10.2 Mechanisms developed for cooperation
The cooperation mechanisms developed in accordance with Article 7 of the Regulation were notified to the European Commission in November 2017, at the meeting of the Gas Coordination Group. In this text the axes of cooperation, the means of communication and the decision-making process were agreed, and the responsibilities and the common objectives to which the competent authorities were committed were defined.
10.3 Solidarity measures
RAE prepared and put in public consultation19 with the Greek market and the neighbouring countries a ‘Regulation Plan’ for the implementation of the Solidarity Mechanism, in accordance with the provisions of Article 13(10) of Regulation (EU) 2017/1938 as well as Commission Recommendation (EU) 2018/177 of 2 February 2018. In drawing up the Plan, RAE worked together with the Hellenic Gas Transmission System Operator SA (DESFA SA), the Independent Power Transmission Operator (ADMIE), the Ministry of the Environment and Energy (YPEN) and the Ministry of Foreign Affairs (YPEX). It was based on the relevant ACER Study (Study on the estimation of the Cost of Disruption of Gas supply in Europe), as well as on the submission of opinions by market participants.
Processing of the comments submitted during the above consultation is in progress.
19 http://www.rae.gr/site/categories_new/about_rae/factsheets/2020/gen/0510.csp

PREVENTIVE ACTION PLAN
CONCERNING THE SECURITY OF GAS SUPPLY IN GREECE 2021
Page 107 of 108
11 Summary – conclusions
This Preventive Action Plan was drawn up by RAE, in accordance with the provisions of Articles 8 and 9 of Regulation (EU) 2017/1938 concerning measures to safeguard the security of gas supply.
The Plan presented, initially, the key data on the Greek market in natural gas and the main characteristics of the national gas system (HNGS), as well as the regional systems in which Greece participates. It then outlined the conclusions of the recent Risk Assessment (2020) and used them as a basis to set out priorities for addressing the security of supply crisis scenarios considered. Therefore, the following scenarios are addressed by order of priority: (A) non-tolerable risk crisis scenarios (2 scenarios for the period 2020-2021, 3 scenarios for the period 2021-2022), (B) undesirable risk crisis scenarios which could cause a capacity/energy deficit in electricity generation and extensive power outages (1 scenario for the period 2020-2021, 3 scenarios for the period 2021-2022), and (C) other undesirable risk crisis scenarios (3 scenarios for the period 2020-2021, 3 scenarios for the period 2021-2022). Respectively, the results of the Common Risk Assessments of the Risk Groups in which Greece participates were presented.
As regards compliance with the supply standard (Article 5 of Regulation (EU) 2017/1938), it has been found that the standard is currently not met by the existing infrastructure at national level, without implementing demand management measures.
Apart from that, in recognition of the considerable and increasing share of natural gas in the primary energy balance of the electricity generation sector, the Preventive Action Plan has included measures focusing on mitigating the impact on electricity generation of potential cuts in the supply to gas-fired power plants.
In the context of strengthening consumer protection in the event of occurrence of the above disruptions in the demand and/or supply of natural gas, the Plan considered measures (actions) related to the improvement of the regulatory framework to increase the use of existing gas infrastructure and to strengthen LNG availability in times of high risk.
Following are the actions considered:
A1. Regulating the special capacity offered by the Operator and distribution at the entry points
combined with one of the following alternatives:
A2. Improving LNG offloading framework – scheduling A
A3. Improving LNG offloading framework – scheduling B
A4. Use of the Revithoussa facility to maintain a seasonal LNG reserve for electricity generation
The above actions were evaluated in terms of (a) their effectiveness in risk mitigation, (b) the burden caused in terms of the security of supply fee, (c) the impact on the environment, (d) the impact on the functioning of the markets in natural gas and electricity, (e) the impact on the security of supply in neighbouring Member States and – (f) the uncertainty inherent in the implementation of the actions. The evaluation conclusion is that, for both periods 2020-2021 and 2021-2022, the implementation of Action A1 in combination with Action A3 makes it possible to reduce the risk to an acceptable level, in the most efficient way.

PREVENTIVE ACTION PLAN
CONCERNING THE SECURITY OF GAS SUPPLY IN GREECE 2021
Page 108 of 108
The Plan also presented infrastructure projects that are included in list 4 of projects of common interest (PCI List), as well as projects that are in progress which are included or considered to be included in the HNGS’s ten-year development plan. The above projects are expected to significantly improve the security of supply in Greece on a medium-/long-term basis (from 2020 onwards).
Finally, it set out a set of soft measures and obligations to strengthen prevention and secure functioning of the natural gas system.