prevention through mentoring - iconsortium.subst...
TRANSCRIPT

Annual Outcome Evaluation Report July 1, 2014 – July 31, 2015
With Funds Provided By: Iowa Department of Public Health, Division of Behavioral Health, Bureau of Substance Abuse
© 2015 The University of Iowa
THE IOWA CONSORTIUM FOR SUBSTANCE ABUSE RESEARCH AND EVALUATION
Prevention Through Mentoring
Prevention Through Mentoring
Annual Outcome Evaluation Report July 1, 2014- July 31, 2015
Heather Hershberger, MPP Evaluation Coordinator
Julie Palmer, BA
Associate Director
Stephan Arndt, PhD Director
Citation of references related to this report is appreciated. Suggested citation:
Hershberger, H., Palmer, J., & Arndt, S. (2015). Prevention Through Mentoring Program Evaluation: Annual Outcome Evaluation Report 2015. (Iowa Department of Public Health Contract #5885YM50). Iowa City, IA: Iowa Consortium for Substance Abuse Research and Evaluation: http://iconsortium.subst-abuse.uiowa.edu

TABLE OF CONTENTS
Background ................................................................................................................................ 1
Overview ............................................................................................................................... 1 Evaluation Design ............................................................................................................. 1
Outcomes .................................................................................................................................. 2
Demographics ....................................................................................................................... 2 Changes from Pre-Test to Post-Test ..................................................................................... 2
Past 30-Day Use ............................................................................................................... 3 Table 1. Change in Past 30-Day Use: PTM Survey Participants ................................ 4 Figure 1: Change in Past 30-Day Use: PTM Survey Participants ................................ 5
Attitudes Toward Substance Use ...................................................................................... 5 Figure 2: Change in Attitudes Toward Alcohol, Cigarette, Marijuana Use: PTM Survey Participants ......................................................................... 6 Figure 3: Change in Attitudes Toward Alcohol, Cigarette, Marijuana Use:
One on One Mentoring Participants, PTM Survey ................................... 6 Figure 4: Change in Attitudes Toward Alcohol, Cigarette, Marijuana Use:
Children of Promise Youth Leadership Program Participants .................. 7 Figure 5: Change in Attitudes Toward Alcohol, Cigarette, Marijuana Use: K-5 Survey Participants ........................................................................... 7
Perceived Risk of Harm from Substance Use ................................................................... 8 Figure 6: Change in Perceived Risk of Harm from Alcohol, Cigarette, Marijuana Use:
All PTM Survey Participants .................................................................... 8 Figure 7: Change in Perceived Risk of Harm from Alcohol, Cigarette, Marijuana Use: One on One Mentoring Participants, PTM Survey ................................... 9 Figure 8: Change in Perceived Risk of Harm from Alcohol, Cigarette, Marijuana Use:
Children of Promise Youth Leadership Program Participants .................. 9 Figure 9: Change in Perceived Risk of Harm from Alcohol, Cigarette, Marijuana Use: K-5 Survey Participants ..........................................................................10
Mentor-Mentee Match Data .............................................................................................10 Conclusion ................................................................................................................................11
Table 2. Positive Outcome Percentages for Attitudes Toward Substance Use by Participant Group ...............................................................................12
Table 3. Positive Outcome Percentages for Perceived Risk of Harm of Substance Use by Participant Group ......................................................................12

Prevention Through Mentoring Annual Outcomes Evaluation Report 2015 1
BACKGROUND
Overview
The purpose of the Prevention Through Mentoring (PTM) project is to promote the creation and support of community youth mentoring programs to achieve Iowa’s goal of primary prevention of the use and abuse of alcohol, tobacco, and other drugs. The Iowa Consortium for Substance Abuse Research and Evaluation (Consortium) conducts the evaluation of the Prevention Through Mentoring project for the Iowa Department of Public Health (IDPH). Eight community organizations participate in this project: Big Brothers Big Sisters of Central Iowa; Big Brothers Big Sisters of Siouxland; Clinton Community School District; Community Correction Improvement Association; Compass Pointe/YMCA; Helping Services of Northeast Iowa; Henry County Extension; and Mason City Youth Task Force. These eight agencies implemented mentoring programs that pair a youth with an adult mentor. Some programs use an individual mentoring format (one mentor and one mentee), some use a group mentoring format, and some use a combination of individual and group mentoring. Evaluation Design
The evaluation employs a matched pre-post design, whereby a survey is administered when a participant enters the mentoring program and at the beginning of each subsequent project year (pre-test), then again at the end of each project year (post-test). Two survey instruments are used: the Prevention Through Mentoring Survey, designed for participants in the sixth grade and above; and the Prevention Through Mentoring K-5 Survey, designed for participants in kindergarten through fifth grade. Agency staff collects the survey data and enters it into an online system called Qualtrics. The Consortium downloads the data for analyses and reporting. This report provides data for State Fiscal Year 2015 (FY15) and includes participants involved in the program between July 2014 and July 2015. Participants’ who entered the program in April, May, June, or July 2015 are not included in the analysis, as agencies are not required to administer post-tests to participants who took pre-tests less than three months prior to the end of the fiscal year. Participating agencies entered 372 pre-tests and 280 post-tests into Qualtrics during FY15, yielding 266 matched pre- and post-tests. The pre-post data were used to help answer the following evaluation questions:
Has alcohol/cigarette/marijuana use changed in the target population?
Has the percentage of the target population who indicate positive attitudes at baseline (pre-test) maintained or increased after the intervention (post-test)?
Has perceived risk of harm from alcohol/cigarette/marijuana use maintained a positive response or increased from pre-test to post-test?

Prevention Through Mentoring Annual Outcomes Evaluation Report 2015 2
OUTCOMES
Demographics
The median age of all PTM participants at post-test was 12 years. The median age of PTM Survey respondents (sixth grade and above) at post-test was 13 years. The median age of K-5 Survey respondents at post-test was 10 years. Across all PTM participants, 54.4% were female, while 45.6% of participants are male. Approximately 13.6% of PTM participants were Hispanic or Latino. Participant racial groups are delineated below:
60.0% White
13.8% Black/African American
1.8% Asian
1.1% American Indian/Alaskan Native
4.4% Some other race
18.9% More than one race
Changes from Pre-Test to Post-Test
The figures included in this section detail results from the standard PTM Survey and the K-5 Survey, showing the change in responses from pre-test to post-test. PTM Survey results include past 30-day substance use, attitudes toward substance use, and perceptions of risk of harm from substance use. K-5 Survey results include attitudes toward substance use and perceptions of risk of harm from substance use. PTM Survey data are provided for all project participants with matching PTM Survey pre- and post-tests, and for two of the mentoring programs: Children of Promise Youth Leadership Program and One on One Mentoring. The One on One Mentoring program also served youth who completed the K-5 Survey. One on One Mentoring program data comprise roughly 71.1% of all data collected using the K-5 Survey and therefore are not reported separately from the K-5 totals. The remaining seven mentoring programs implemented in the project did not meet the minimum sample size necessary for individual reporting (i.e., 50 matched surveys). However, data for participants in those programs are included in the appropriate survey totals.
Attrition analyses were performed to identify potential differences between participants who terminated their involvement in the program or who did not complete a post-test and those who remained in the program/completed a post-test this fiscal year. Nearly one-fourth (24.3%) of PTM Survey respondents who completed a pre-test did not complete a post-test. However, no significant differences were found between the PTM Survey participants completing both a pre- and a post-test and those only completing a pre-test.
One-third (33.3%) of the Younger Youth survey respondents who completed a pre-test did not complete a post-test. Sex was significantly associated with attrition in the Younger Youth survey group: significantly more girls (43.4%) than boys (22.7%) dropped out of the program or did not complete a post-test (Cochran-Mantel-Haenszel test, p= 0.0096). Participants’ race was also associated with program or post-test completion. Respondents who indicated their race as “American Indian/Alaskan Native,” “Native Hawaiian/Other Pacific Islander” or “more than one race” were more likely to drop out or not complete a post-test than respondents of other races (Cochran-Mantel-Haenszel test, p= 0.0445). Therefore, the Younger Youth participants represented by the outcome data in this report differ from those who initiated the program. This selective attrition should be taken into consideration when interpreting outcomes.

Prevention Through Mentoring Annual Outcomes Evaluation Report 2015 3
Past 30-Day Use
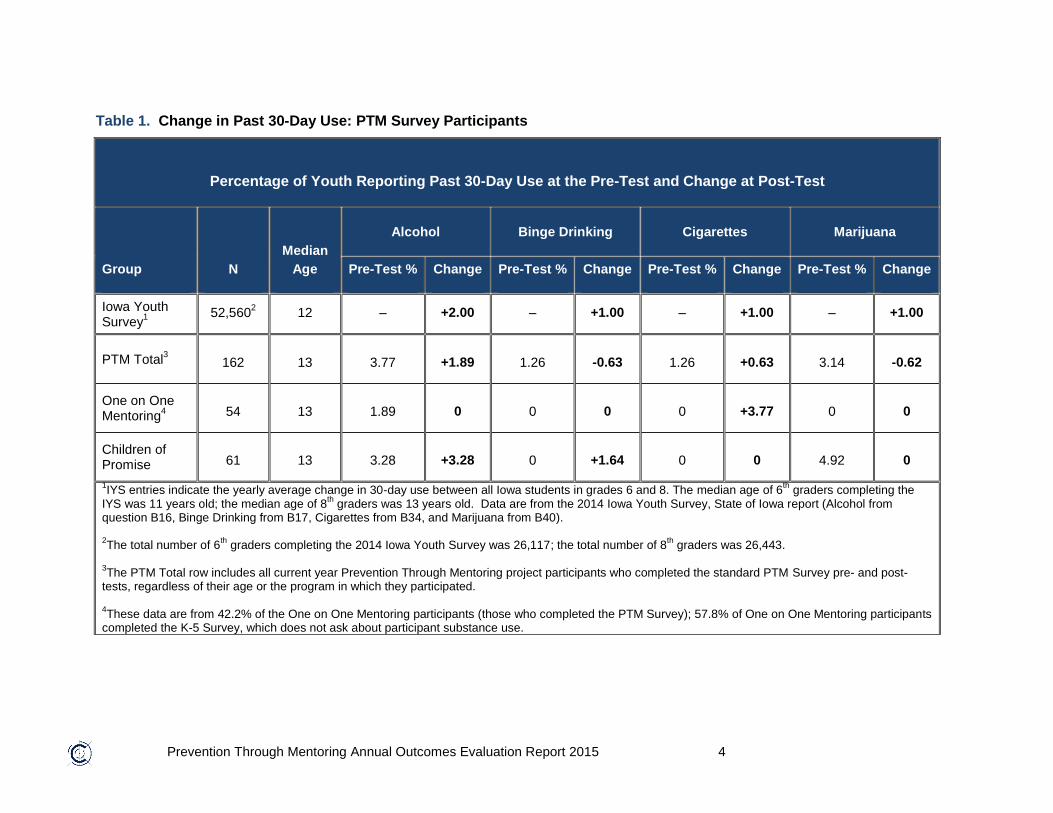
Table 1 on page 4 presents data on past 30-day alcohol, binge drinking, tobacco, and marijuana use for matched pre- and post-tests for all participants completing the PTM Survey, for One on One Mentoring program participants completing the PTM Survey, and for Children of Promise Youth Leadership Program participants (all of whom completed the PTM Survey).
Iowa Youth Survey (IYS) data are provided as a reference point for interpreting the substance use outcome data in this report. The Iowa Youth Survey is a biennial census assessment of Iowa students’ attitudes and behaviors, including attitudes toward substance use, and actual use of substances. Students in grades 6, 8 and 11th grades complete the IYS. However, for this comparison we are only looking at grades 6 and 8. The 2014 IYS data included here provide an estimate of the change one might expect to see each year in Iowa’s general youth population due to maturation. Thus, IYS data serve as a general point of reference when examining PTM program outcomes (i.e., change from pre-test to post-test, rather than comparing program percentages to zero, or no change). It is important to note youth who participated in PTM programming may also have completed the IYS.
The change figures shown in Table 1 for the three PTM groups are the percentage point increases or decreases in use from pre-test to post-test. The change figures shown for IYS participants are the estimated percentage point change in use in one year. However, the change values presented in the table do not indicate statistically significant differences from pre-test to post-test. There was no statistical evidence of change from pre-test to post-test for alcohol, binge drinking, cigarette, or marijuana use in the PTM Survey participant group or the individual program groups (statistical tests yielded p values greater than 0.05). However, this also means that use of those substances showed no evidence of increasing as would be expected due to maturation.
Prevention Through Mentoring Annual Outcomes Evaluation Report 2015 4
Table 1. Change in Past 30-Day Use: PTM Survey Participants
Percentage of Youth Reporting Past 30-Day Use at the Pre-Test and Change at Post-Test
Group N
Median
Age
Alcohol Binge Drinking Cigarettes Marijuana
Pre-Test % Change Pre-Test % Change Pre-Test % Change Pre-Test % Change
Iowa Youth Survey
1
52,5602
12 – +2.00 – +1.00 – +1.00 – +1.00
PTM Total3 162 13 3.77 +1.89 1.26 -0.63 1.26 +0.63 3.14 -0.62
One on One Mentoring
4 54 13 1.89 0 0 0 0 +3.77 0 0
Children of Promise 61 13 3.28 +3.28 0 +1.64 0 0 4.92 0
1IYS entries indicate the yearly average change in 30-day use between all Iowa students in grades 6 and 8. The median age of 6
th graders completing the
IYS was 11 years old; the median age of 8th
graders was 13 years old. Data are from the 2014 Iowa Youth Survey, State of Iowa report (Alcohol from question B16, Binge Drinking from B17, Cigarettes from B34, and Marijuana from B40). 2The total number of 6
th graders completing the 2014 Iowa Youth Survey was 26,117; the total number of 8
th graders was 26,443.
3The PTM Total row includes all current year Prevention Through Mentoring project participants who completed the standard PTM Survey pre- and post-
tests, regardless of their age or the program in which they participated. 4These data are from 42.2% of the One on One Mentoring participants (those who completed the PTM Survey); 57.8% of One on One Mentoring participants
completed the K-5 Survey, which does not ask about participant substance use.

Prevention Through Mentoring Annual Outcomes Evaluation Report 2015 5
Figure 1 provides the percentage point change in use of participant in all PTM programs.
Figure 1. Change in Past 30-Day Use: PTM Survey Participants
Attitudes Toward Substance Use
Figures 2 through 5 on the following pages show change in participants’ attitudes from pre- to post-test toward the use of alcohol, cigarettes, and marijuana. Individual attitudes either:
1) “improved,” which means that attitudes grew more unfavorable toward use of alcohol, tobacco, or marijuana (e.g., respondent felt alcohol use was wrong at pre-test and very wrong at post-test);
2) “maintained +,” which means that the pre- and post-test responses remained the same and were unfavorable toward alcohol, tobacco, or marijuana use (a positive outcome);
3) “maintained –,“ which means that the pre- and post-test responses remained the same and were favorable toward alcohol, tobacco, or marijuana use (a negative outcome); or
4) “worsened,” meaning that attitudes grew more favorable toward alcohol, tobacco, or marijuana use from pre-test to post-test (e.g., respondent felt marijuana use was very wrong at pre-test and a little bit wrong at post-test).
Desired outcomes for these questions are improvement in (“improved”) or positive maintenance (“maintained +”) of attitudes toward substance use. The positive attitude outcome percentages provided below each figure represent participants in the “improved” and “maintained +” categories for that survey or program group. The number of matched pre- and post-tests containing a response to the question is shown in parentheses at the bottom of the data table following each substance.
2.001.89
0.0
3.28
1.00
-0.63
0.0
1.64
1.00
0.63
3.77
0.0
1.00
-0.62
0.0 0.0
-1
0
1
2
3
4
5
Alcohol Binge Drinking Cigarettes Marijuana
2014 IYS Total PTM Total One on One Children of Promise

Prevention Through Mentoring Annual Outcomes Evaluation Report 2015 6
Figure 2. Change in Attitudes Toward Alcohol, Cigarette, Marijuana Use:
All PTM Survey Participants
7.7%
83.2%
0.0%
9.3%6.3%
87.3%
0.6%
5.7%5.6%
82.6%
2.5%
9.3%
0
10
20
30
40
50
60
70
80
90
100
Pe
rce
nt o
f R
esp
on
dan
ts
How wrong do you think it is for someone your age to use
Alcohol (N = 161) Cigarettes (N = 158) Marijuana (N = 161)
Improved Maintained + Maintained - Worsened
PTM Survey respondents’ positive attitude outcomes are as follows: Alcohol – 90.9%; Cigarettes – 93.7%; and Marijuana – 88.2%. Figure 3. Change in Attitudes Toward Alcohol, Cigarette, Marijuana Use:
One on One Mentoring Participants
13.0%
81.5%
0.0%
5.6%9.3%
85.2%
0.0%
5.6%5.6%
87.0%
0.0%
7.4%
0
10
20
30
40
50
60
70
80
90
100
Pe
rce
nt o
f R
esp
on
dan
ts
How wrong do you think it is for someone your age to use
Alcohol (N = 54) Cigarettes (N = 54) Marijuana (N = 54)
Improved Maintained + Maintained - Worsened
One on One Mentoring program participants who completed the PTM Survey showed positive attitudes outcomes as follows: Alcohol – 94.4%; Cigarettes – 94.5%; and Marijuana – 92.6%.

Prevention Through Mentoring Annual Outcomes Evaluation Report 2015 7
Figure 4. Change in Attitudes Toward Alcohol, Cigarette, Marijuana Use: Children of Promise Youth Leadership Program Participants
Children of Promise Youth Leadership Program participants’ positive attitude outcomes are as follows: Alcohol – 83.6%; Cigarettes – 93.2%; and Marijuana – 78.7%. Figure 5. Change in Attitudes Toward Alcohol, Cigarette, Marijuana Use:
K-5 Survey Participants
K-5 Survey respondents’ positive attitude outcomes are as follows: Alcohol – 97.9%, Cigarettes –95.7%; and Marijuana – 100.0%.
6.6%
77.1%
0.0%
16.4%
6.8%
86.4%
1.7%5.1%
9.8%
68.9%
4.9%
16.4%
0
10
20
30
40
50
60
70
80
90
100
Pe
rce
nt o
f R
esp
on
dan
ts
How wrong do you think it is for someone your age to use
Alcohol (N = 61) Cigarettes (N = 59) Marijuana (N = 61)
Improved Maintained + Maintained - Worsened
2.2%
95.7%
1.1% 1.1%2.2%
93.6%
0.0%4.3%2.2%
97.9%
0.0% 0.0%0
10
20
30
40
50
60
70
80
90
100
Pe
rce
nt o
f Re
spo
nd
en
ts
How wrong do you think it is for someone your age to use
Alcohol (N = 93) Cigarettes (N = 93) Marijuana (N = 147)
Improved Maintained + Maintained - Worsened

Prevention Through Mentoring Annual Outcomes Evaluation Report 2015 8
Perceived Risk of Harm from Substance Use
Figures 6 through 9 illustrate the change in participants’ perceived risk of harm from using alcohol, cigarettes, and marijuana. Perceptions of risk either:
1) “increased,” which means that their reported perceived risk regarding alcohol, tobacco, or marijuana use increased from pre-test to post-test (e.g., Respondent felt alcohol use was a moderate risk at pre-test and a great risk at post-test);
2) “maintained +,” which means that the pre- and post-test responses remained the same and were unfavorable toward alcohol, tobacco, or marijuana use (a positive outcome);
3) “maintained -,” which means that the pre- and post-test responses remained the same and were favorable toward alcohol, tobacco, or marijuana use (a negative outcome); or
4) “decreased,” meaning that their reported perception of risk of harm decreased from pre-test to post-test (e.g., respondent reported that marijuana use posed a moderate risk of harm at pre-test and no risk at post-test).
Desired outcomes for these questions are an increase in or positive maintenance (“maintained +”) of change in perceived risk. The positive attitude outcome percentages provided below each figure represent participants in the “improved” and “maintained +” categories for that survey or program group. The number of matched pre- and post-tests containing a response to the question is shown at the bottom of the data table, in parentheses, following each substance. Figure 6. Change in Perceived Risk of Harm from Alcohol, Cigarette, Marijuana Use:
All PTM Survey Participants
PTM Survey respondents’ positive attitude outcomes are as follows: Alcohol – 83.8%; Cigarettes – 84.8%; and Marijuana – 73.0%.
14.4%
69.4%
5.0%
11.3%14.6%
70.3%
4.4%
10.8%
18.9%
54.1%
8.8%
18.2%
0
10
20
30
40
50
60
70
80
90
100
Pe
rce
nt o
f R
esp
on
de
nts
How much do you think you risk harming yourself if you use
Alcohol (N = 160) Cigarettes (N = 158) Marijuana (N = 159)
Improved Maintained + Maintained - Worsened

Prevention Through Mentoring Annual Outcomes Evaluation Report 2015 9
Figure 7. Change in Perceived Risk of Harm from Alcohol, Cigarette, Marijuana Use: One on One Mentoring Participants
One on One Mentoring participants who completed the PTM Survey showed positive attitude outcomes as follows: Alcohol – 96.3%; Cigarettes – 92.6%; and Marijuana – 85.2%. Figure 8. Change in Perceived Risk of Harm from Alcohol, Cigarette, Marijuana Use:
Children of Promise Youth Leadership Program Participants
Children of Promise Youth Leadership Program participants (all of whom completed the PTM Survey) showed positive attitude outcomes as follows: Alcohol – 75.0%; Cigarettes – 79.7%; and Marijuana – 62.7%.
11.1%
85.2%
0.0%3.7%
9.3%
83.3%
0.0%
7.4%11.1%
74.1%
0.0%
14.8%
0
10
20
30
40
50
60
70
80
90
100
Pe
rce
nt o
f Re
spo
nd
en
ts
How much do you think you risk harming yourself if you use
Alcohol (N = 54) Cigarettes (N = 54) Marijuana (N = 54)
Improved Maintained + Maintained - Worsened
20.0%
55.0%
11.7% 13.3%
22.0%
57.6%
10.2% 10.2%
27.1%
35.6%
20.3%17.0%
0
10
20
30
40
50
60
70
80
90
100
Pe
rce
nt o
f Re
spo
nd
en
ts
How much do you think you risk harming yourself if you use
Alcohol (N = 60) Cigarettes (N = 59) Marijuana (N = 59)
Improved Maintained + Maintained - Worsened

Prevention Through Mentoring Annual Outcomes Evaluation Report 2015 10
Figure 9. Change in Perceived Risk of Harm from Alcohol, Cigarette, Marijuana Use: K-5 Survey Participants
K-5 Survey respondents’ positive attitude outcomes are as follows: Alcohol – 81.5%; Cigarettes – 85.7%; and Marijuana – 81.5%.
Mentor-Mentee Match Data
Agencies submitted tracking forms to the Consortium containing information about meetings between mentors and mentees. This information included: 1) the total number of meetings between each pair; 2) the average length of meetings between each pair; and 3) the average number of meetings per month for each pair. Seven of the eight participating agencies submitted match data for this project year. The match data analysis included 302 mentor-mentee pairs. All other pairs are not included due to incomplete reporting or the matches had occurred less than three months before the end of the reporting period (agencies were not required to report match meeting data for those participants). The total number of reported mentor-mentee meetings for the year was 4,953. The median number of meetings for each mentor and mentee pair or group was 18 (Minimum = 2; Maximum = 60). The median duration of individual meetings between pairs or groups was 2 hours (Minimum = 40 minutes; Maximum = 420 minutes, or 7 hours). The median number of meetings per month was 2 (Minimum = 1; Maximum = 5).
8.7%
72.8%
1.1%
17.4%
7.7%
78.0%
3.3%
11.0%10.9%
70.7%
4.4%
14.1%
0
10
20
30
40
50
60
70
80
90
100
Pe
rce
nt o
f R
esp
on
de
nts
How much do you think you risk harming yourself if you use
Alcohol (N = 92) Cigarettes (N = 91) Marijuana (N = 92)
Improved Maintained + Maintained - Worsened

Prevention Through Mentoring Annual Outcomes Evaluation Report 2015 11
CONCLUSION
The following outcomes should be examined in light of the selective attrition identified in the attrition analysis discussion on page 2. The evaluators recommend that participating agencies explore possible reasons Younger Youth female participants and respondents indicating their race as “American Indian/Alaskan Native,” “Native Hawaiian/Other Pacific Islander” or “more than one race” are dropping out of programs or failing to complete the post-test at significantly higher rates than other participants. This evaluation of the Prevention Through Mentoring project answers the following questions:
Has alcohol/cigarette/marijuana usage changed in the target population?
Answer: No There were no statistically significant changes in past 30-day use in Prevention Through Mentoring participants as a whole or for the One on One Mentoring or Children of Promise Youth Leadership Program participant groups. However, this means that use of alcohol, cigarettes, and marijuana showed no evidence of increasing as would be expected due to maturation. This suggests that there could be some benefit derived from the programs in deflecting the increases normally seen in adolescents.
Has the percentage of the target population who indicate positive attitudes (believing substance use in someone their age is wrong or very wrong) at baseline (pre-test) maintained or increased after the intervention (post-test)?
Answer: Yes, 88% in PTM, 78% in Children of Promise, and 95%+ in K-5. Table 2 below presents positive outcome percentages for attitudes toward alcohol, tobacco, and marijuana use for all PTM Survey participants, One on One PTM Survey participants completing the PTM Survey, Children of Promise Youth Leadership Program participants and all K-5 Survey participants. More than 88% of all PTM Survey participants and One on One Mentoring participants maintained or increased their belief from pre-test to post-test that alcohol, tobacco, and marijuana use are wrong. More than 78% of Children of Promise Youth Leadership Program participants maintained or increased their belief that use of those substances is wrong. Nearly all K-5 Survey respondents (95% or more) showed positive attitude outcomes for all three substances. All PTM, One on One Mentoring, and Children of Promise Survey Participants, believe that alcohol and tobacco are more wrong for someone their age to use than marijuana.

Prevention Through Mentoring Annual Outcomes Evaluation Report 2015 12
Table 2. Positive Outcome Percentages for Attitudes Toward Substance Use by Participant Group
Positive Outcome Percentages for Attitudes Toward Substance Use
Participant Group Alcohol Tobacco Marijuana
All PTM Survey Participants 90.9% 93.7% 88.2%
One on One Mentoring Participants – PTM Survey
94.4% 94.5% 92.6%
Children of Promise Youth Leadership Program Participants
83.6% 93.2% 78.7%
All K-5 Survey Participants 97.9% 95.7% 100.0%
Has perceived risk of alcohol/cigarette/marijuana use maintained a positive response or increased from pre-test to post-test?
Answer: Yes, 73% for PTM, One on One PTM, and K-5; 62.7% for Children of Promise Table 3 below presents positive outcome percentages for perceived risk of harm from alcohol, tobacco, and marijuana use for all PTM Survey participants, One on One PTM Survey participants completing the PTM Survey, Children of Promise Youth Leadership Program participants and all K-5 Survey participants. At least 73% of participants in all groups maintained or increased their perception that using alcohol, cigarettes, or marijuana posed moderate to great risk of harm, with the exception of Children of Promise participants. Children of Promise participants’ positive outcome percentage for marijuana was lower, at 62.7%. In addition, participants in all groups perceive marijuana as being less risky than tobacco, while three out of four groups perceive tobacco as being more risky than alcohol. Table 3. Positive Outcome Percentages for Perceived Risk of Harm of Substance Use by Participant Group
Positive Outcome Percentages for Perceived Risk of Harm from Substance Use
Participant Group Alcohol Tobacco Marijuana
All PTM Survey Participants 83.8% 84.8% 73.0%
One on One Mentoring Participants – PTM Survey
96.3% 92.6% 85.2%
Children of Promise Youth Leadership Program Participants
75.0% 79.7% 62.7%
All K-5 Survey Participants 81.5% 85.7% 81.5%