preventing residential burglary in cambridge: … residential burglary in cambridge: ... police...
TRANSCRIPT

Police Research Series Paper 108
Preventing ResidentialBurglary in Cambridge:
From Crime Audits toTargeted Strategies
Trevor BennettLinda Durie

Police Research Series Paper 108
Preventing ResidentialBurglary in Cambridge:
From Crime Audits toTargeted Strategies
Trevor Bennett
Linda Durie
Editor: Barry Webb
Home Office
Policing and Reducing Crime Unit
Research, Development and Statistics Directorate
50 Queen Anne’s Gate
London SW1H 9AT

Crown Copyright 1999
First Published 1999
Policing and Reducing Crime Unit: Police Research Series
The Policing and Reducing Crime Unit (PRC) was formed in 1998 as a result of
the merger of the Police Research Group (PRG) and the Research and Statistics
Directorate. PRC Unit is now part of the Research, Development and Statistics
Directorate of the Home Office. The PRC Unit carries out and commissions
research in the social and management sciences on policing and crime reduction,
broadening out the role that PRG played.
The PRC has now combined PRG’s two main series into the Police Research
Series, continuing PRG’s earlier work. This will present research material on crime
prevention and detection as well as police management and organisation issues.
Research commissioned by PRG will appear as a PRC publication. Throughout the
text there may be references to PRG and these now need to be understood as
relating to the PRC Unit.
ISBN 1-84082-265-1
Copies of this publication can be made available in formats accessible to
the visually impaired on request.
(ii)
C

Foreword
This report describes work undertaken by Cambridgeshire Police in conjunction
with the Cambridge Domestic Burglary Task Force to design and implement a
strategy to counter domestic burglary in the city.
The report is timely. The 1998 Crime and Disorder Act places a statutory duty
upon police forces and local authorities to work together to identify and tackle
local crime and disorder problems. The Cambridge initiative provides a good
example of a crime audit and practical example of the partnership approach
encouraged by the Act.
The importance of a strategic approach to tackling domestic burglary is reflected in
the Government’s new crime reduction strategy. The report provides a candid
account of the issues involved in implementing such strategies. Police forces and
local authorities will be interested in the range of initiatives identified to tackle
various aspects of the problem.
Dr GLORIA LAYCOCK
Head of the Policing and Reducing Crime Unit,
Research, Development and Statistics Directorate,
Home Office.
May 1999.
(iii)

Acknowledgements
We would like to acknowledge the members of the Domestic Burglary Task Force
(DBTF) who volunteered to meet on many occasions in order to design and
implement the programme elements. Special thanks are given to the Employment
Foundation Scheme of Cambridge City Council Planning Department for
providing the repeat victim package and to John Houston (formerly of Cambridge
City Council) and Nicholas Lidstone (Crime Reduction Unit of Cambridgeshire
Police) for chairing the DBTF meetings.
We would also like to acknowledge the County Council Crime Reduction Co-
ordination Department for their work in generating a crime audit and the Safer
Cambridge Steering Group for supporting and guiding the work of the DBTF.
Special thanks are also due to the Southern Division of Cambridgeshire Police who
assisted the project through the staff and resources of the Crime Reduction Unit
and through the operational staff involved in implementing parts of the
programme.
We would like to thank the governor and staff at Bedford Prison and Brian Kirby
and staff at Cambridge Probation for providing access to offenders.
We would to thank the Police Research Group for funding the evaluation of the
programme and Barry Webb and Tim Read for acting as supportive project liaison
officers.
Finally, we would like to acknowledge the contribution of the members of the
community in the target areas for attending the community seminar and for
agreeing to be interviewed as part of the evaluation. We would also like to thank
the local burglars who agreed to be interviewed.
The Authors
Trevor Bennett is Acting Director at the Institute of Criminology at the University
of Cambridge and fellow of Wolfson College.
Linda Durie is a researcher with Her Majesty’s Inspectorate of Prisons. She was
previously a research assistant at the Institute of Criminology at the University of
Cambridge.
PRC would like to thank Professor Tim Hope of Keele University for acting as
independent assessor for this report.
(iv)

Executive summary
The report describes the work of the Domestic Burglary Task Force (DBTF) in
Cambridge, which was established in July 1994 to examine the nature of residential
burglary in Cambridge and to design and implement initiatives to prevent it. The
group devised an overall strategy which was to divide the work into two stages: (1)
a data-gathering stage, during which information about burglary in Cambridge was
collected, and (2) a programme implementation stage, during which various
projects were designed and implemented.
The main findings of the data-gathering stage were that residential burglary in
Cambridge was concentrated within specific wards to the north of the city and
within specific ‘hot spots’ within these wards. The ‘hot spots’ and the ‘hot wards’
were characterised by high levels of repeat victimisation. There was some evidence
that residential burglaries in the area were committed by local youths who lived in
the same or adjacent wards and who selected the target areas as a result of
convenience, easy access through footpaths and alleyways, and the perceived
abundance of suitable targets. As a result of these findings, the DBTF identified the
largest ‘hot spot’ in the north of the City, and the two wards which contained the
‘hot spot’, as the targeted area.
One of the key principles of the overall programme strategy was that the nature of
the solution to burglary in Cambridge should be based on sound knowledge of the
nature of the problem. A number of seminars were organised for representatives of
local agencies in order to identify burglary prevention strategies which would best
match the nature of the problems identified. As a result of these seminars, a
number of burglary prevention strategies were identified and implemented. The
final list of projects implemented was as follows:
Projects aimed at potential victims
● Cocoon neighbourhood watch
● Loan alarm scheme
● Security advice to victims
● KeepSafe (fitting additional security locks)
● GateSafe (fitting additional external gates)
● Security pack to residents
Projects aimed at potential capable guardians
● Post Watch
● Enhanced neighbourhood watch
● Community seminar
● Community Centre Information Link
● Targeted police patrols
(v)

Projects aimed at potential offenders
● Youth Development project
The results of the outcome evaluation showed that total burglaries reduced in the
targeted wards and in the targeted ‘hot spot’ over the evaluation period and that
repeat burglaries reduced in one of the targeted wards, but not in the other ward or
in the targeted ‘hot spot’. The results also showed that burglary reduced generally
by the same or greater amounts in the City as a whole, and in the various
comparison areas, over the same period of time.
The results of the implementation evaluation concluded that the majority of the
projects were implemented as planned and were generally regarded positively by
the residents and victims to whom they were directed. However, the intensity and
coverage of the projects as a whole was not great in terms of the number of
residents involved or the time or area over which the scheme operated. It is
possible that Arbury and Castle Wards (areas which included long-term burglary
‘hot spots’) required larger amounts of crime prevention resources and greater
intensity and coverage than were achieved by the Domestic Burglary Task Force.
Overall, the report concludes that there was evidence of a reduction in burglary in
the targeted areas. However, the most likely causes of this reduction were wider
developments in policing during the programme period and economic and social
factors that were affecting property crime generally.
(vi)

(vii)
ContentsPage
Foreword (iii)
Acknowledgements (iv)
Executive Summary (v)
List of tables (ix)
List of figures (ix)
1. Background 1
The Domestic Burglary Task Force 1
The general strategy 1
The data gathering process 1
The programme implementation process 2
Structure of the report 2
2. The nature of the problem: residential burglary in Cambridge 4
The data collection strategy 4
Crime pattern analysis 6
Burglars in Cambridge 12
Offender interviews 15
Conclusion 17
3. The nature of the solution: programme elements 18
The relationship between the problem and the solution 18
The selection of projects 18
Programmes aimed at potential victims 20
Programmes aimed at potential capable guardians 22
Programmes aimed at potential offenders 23
4. Outcome effectiveness: did the programme work? 25
Trends in total residential burglaries 25
Trends in repeat residential burglaries 30
Conclusion 34

(viii)
5. Implementation effectiveness: was the programme
implemented as planned? 35
Programmes aimed at potential victims 35
Programmes aimed at potential capable guardians 37
Programmes aimed at potential offenders 40
Conclusion 40
6. Discussion 43
Issues relating to burglary prevention 43
Issues relating to programme multi-agency co-operation 44
Issues relating to lessons learned 45
References 47
Appendix A 48

List of figures
Figure No. Caption Page
1. Map of north Cambridge showing programme wards,
comparison wards, enumeration districts, and the
programme area burglary ‘hot spot ’ 5
2. Residential burglaries by ward: 1993 6
3. ‘Hot spots’ of residential burglary in Cambridge:
1993 and 1994 8
4. Repeat rate for dwellings by ward: 1993 11
5. Distance in metres from the offender’s address to the victim’s
address: Arbury and Castle Wards: September 1994
to August 1996 13
6. Location of offender ‘hot spots’ in relation to offence
‘hot spots’: Cambridge: September 1994 to August 1996 14
7. Map of north Cambridge showing programme wards,
comparison wards and boundaries of the 5-year ‘hot spots’ 28
8. Residential burglaries per month during the pre-programme
and programme periods 29/30
9. Repeat rates of residential burglaries over 12-month
rolling window periods during the pre-programme
and programme periods 33/34
10. ‘Hot spots’ of residential burglary: Cambridge City: 1991-1996 48
11. Residential burglary: Cambridge City: 1991-1997 49
(ix)
List of tables
Table No. Caption Page
1. Repeat victimisation rate within Cambridge City and
selected areas: 1993 12
2. Projects proposed and implemented by the Domestic
Burglary Task Force 19
3. Residential burglary during the 12-month period before
and during the programme 27
4. Repeat rates of residential burglary during the 12-month
period before and during the programme 31

1. Background
The Domestic Burglary Task Force
The Domestic Burglary Task Force (DBTF) was established in July 1994 as a
multi-agency group of representatives from the City Council, the County Council,
the police, the Probation Service, Victim Support, and the University of
Cambridge, with the task of reducing residential burglary in Cambridge. The
specific aims of the DBTF were to examine the nature and extent of residential
burglary and to suggest and implement initiatives on a pilot basis to prevent it.
The DBTF was a sub-group of the Safer Cambridge Steering Group which was also
a multi-agency group which aimed to reduce crime and increase community safety.
The Steering Group was established in 1992 with the remit to co-ordinate practical
projects involving different organisations in order to reduce crime and fear of
crime. The motivation for the creation of both groups was to broaden the base of
crime prevention activity in the City by involving a broad spectrum of agencies in
the crime prevention process.
The general strategy
The general strategy of the DBTF was to collect information on the nature of the
problem of residential burglary in Cambridge before proposing actions on how to
deal with it. It was proposed that information should be collected on the nature of
burgled properties, the characteristics of burgled victims, and the characteristics of
known burglars.
The main administrative strategy of the group was to divide the work into two
stages: (1) the first stage of the project was a data-gathering stage, which aimed to
identify the nature of the problem of residential burglary; and (2) the second stage
was the implementation stage, which aimed to establish and monitor individual
projects generated from the findings of the first stage. The first stage of the
programme began with the first meeting of the group in July 1994 and ended in
December 1995. The PRG-funded evaluation period began in January 1996 along
with the beginning of the second stage of the programme. The majority of the
projects were devised and implemented between January 1996 and August 1996
(two projects were implemented in 1997). The formal evaluation period for the
purposes of assessment of the programme began in September 1996 and ended at
the end of the programme in August 1997.
The data-gathering process
The first stage of the programme involved extensive data gathering as a means of
informing the second stage. During the first year, various methods were used to
collect information on the nature and distribution of residential burglary:
BACKGROUND
1

● Crime pattern analysis: Police-recorded data on residential burglary in the City of
Cambridge were mapped in order to determine spatial patterns of burglary.
● Offender address analysis: Police data on offenders were used to identify the
addresses of all offenders convicted of residential burglary in Cambridge.
● Interviews with local burglars: Local burglars were interviewed from among current
clients of Cambridge Probation Service and from among offenders currently held
on charges of burglary at the local prison in Bedford.
● Environmental survey: Two local police officers experienced in crime prevention
conducted on-the-street surveys of properties in the areas targeted by the DBTF
in order to identify environmental factors that generate opportunities for
burglary.
● Repeat burglary victim survey: A self-completed questionnaire was given to every
new burglary victim by the investigating police officer in order to determine the
previous burglary histories of current victims.
● Household survey: A limited household survey was conducted using postal
questionnaires in order to confirm the location of burgled dwellings identified
from the analysis of police-recorded crimes.
The programme implementation process
The main method used for converting the findings of the data gathering stage to a
programme of projects designed to reduce residential burglaries in the targeted areas
was to convene three ‘brainstorming’ sessions involving representatives from
relevant agencies and organisations. The design of the sessions was based on the
three main elements of crime identified in the academic literature: vulnerable
victims, motivated offenders, and capable guardians (Cohen and Felson, 1979).
Three groups of discussants were generated to consider each of these three elements
of crime.
Structure of the report
Chapter 2 presents the main findings of the data-gathering phase of the research in
which the characteristics and spatial patterns of residential burglary in Cambridge
were identified. Chapter 3 describes the main programme elements implemented
during the second stage of the project. The fourth chapter presents the main
findings of the evaluation on the extent to which the programme was successful in
BACKGROUND
2

reducing residential burglary in the targeted areas. The fifth chapter assesses
implementation effectiveness and considers the strength of the programme
elements. The final chapter discusses the effectiveness of the multi-agency
partnership as a whole and the lessons that were learned.
BACKGROUND
3
2. The nature of the problem: residential burglary in
Cambridge
The first stage of the programme involved data gathering as a means of identifying
the nature of the problem to be tackled. The results of three of the six methods of
data gathering (crime pattern analysis, offender address analysis, and interviews
with burglars) are discussed below.
The data-collection strategy
The data-collection process was split into two distinct stages. The first stage was
conducted shortly after the establishment of the DBTF with the main purpose of
identifying the targeted locations. The second stage was conducted after the
selection of the programme areas with two main purposes: the first was to provide
detailed information on the nature of burglaries in order to inform the choice of
preventative strategies and the second was to provide time-series data for the
purpose of monitoring and evaluating the projects implemented.
The first stage of data collection and analysis was conducted mainly by Cambridge
County Council Research Group from both new and existing sources. Some
information on the broad distribution of burglary in Cambridge was already known
as a result of periodic reports to the Safer Cambridge Steering Group by the
Research Group. Additional geographic information was also collected and
analysed by the Research Group specifically at the request of the DBTF. These
included maps of burglaries in Cambridge, plotted by hand, covering three
consecutive six-month periods, spanning the whole of 1993 and half of 1994 (the
period immediately before the establishment of the DBTF). The three maps
identified the existence of a large ‘hot spot’ of burglary in the north of the City
spanning two wards that was more or less stable in size and location across the
three periods. This ‘hot spot’ and the two wards in which the major share of the
‘hot spot’ fell (Castle and Arbury Wards) were subsequently selected by the DBTF
as the areas to be targeted. The location of the selected wards and the ‘hot spot’
area (drawn at the level of particular streets) are shown in the map below.
Castle Ward was predominantly owner-occupied (65%), with a small proportion of
housing rented from the local authority (4%), whereas Arbury Ward was partly
owner-occupied (45%) and partly rented from the local authority (47%)(all figures
are taken from the 1991 Census). Castle had a resident population of 6,064 people
comprising 2,665 households and 643 resident students (with a home address in
Cambridge) and Arbury had a resident population of 6,895 people comprising
3,024 households and 127 resident students. Castle Ward had 6 university colleges
within its area, while Arbury had none.
THE NATURE OF THE PROBLEM: RESIDENTIAL BURGLARY IN CA M B R I D G E
4

The second stage of data gathering drew mainly on police-recorded crime data on
burglaries in Cambridge and the police database of offenders found guilty of
burglaries in Cambridge. The first database covered the period from the beginning
of 1991 (and was updated to the end of the project) and the second database
covered the period from the beginning of 1994 (and was similarly updated).
THE NATURE OF THE PROBLEM: RESIDENTIAL BURGLARY IN CA M B R I D G E
5
Figure 1: Map of north Cambridge showing programme wards, comparison wards, enumeration districts, and the programme area burglary ‘hot spot’
Targeted wards
Targeted hot spot
KINGS HEDGES
ED14
ED9
ED7
ED11
ED12
ED6
MARKET
WEST CHESTERTON
ED13
ED10
NEWNHAM
ED5 ED6
ED3
ARBURY
ED1
ED2
CASTLE
ED4

Crime pattern analysis
The following analysis is based mainly on the data collected for 1993 and 1994 as
these were the years assessed by the DBTF in making decisions about the
programme location and preventative strategies. However, the tables and figures
presented are not necessarily those used at the time by the group. At the beginning
of the project, most of the maps used were plotted by hand, while by the end of the
projects most of the maps were produced by GIS software packages.
Geographic distribution of burglaries
Figure 2 shows the 14 wards of Cambridge ranked by number of residential
burglaries in the year 1993 (the main year of the original crime analysis). The five
most heavily burgled wards were all in the north of the city in close proximity to
the targeted wards (Arbury and Castle). The four highest-ranking wards accounted
for half of all burglaries in Cambridge for 1993 and included the two targeted
wards, which were second and fourth in the ranking. These two wards accounted
for almost one-quarter (23%) of all residential burglaries in Cambridge in that year.
THE NATURE OF THE PROBLEM: RESIDENTIAL BURGLARY IN CA M B R I D G E
6
Figure 2: Residential burglaries by ward: 1993
400
300
200
100
0
Ward

The following four charts show the location of burglary ‘hot spots’ in Cambridge for
1993 and 1994. The charts show two large ‘hot spots’ (labelled as ‘1’ and ‘2’ in the
enlarged maps) in the northern part of the City. These two ‘hot spots’ were fairly
stable over the period 1993 to 1994. However, other ‘hot spots’ (particularly the
larger ‘hot spot’ in the far north of the City) became visible in 1993, but
disappeared again in 1994. The analysis of ‘hot spots’ for 1991 (see Figure 10 in
Appendix A), and anecdotal information from the police, suggested that these two
‘hot spots’ had been stable in Cambridge for many years.
‘Hot spot’ 1 was the largest ‘hot spot’ in the targeted wards in 1993 and included
almost 10 per cent (9.5%) of all residential burglaries in Cambridge for the year.
‘Hot spot’ 2, just outside the targeted wards, included just over 5 per cent of all
burglaries (5.5%). The smaller ‘hot spots’ in the targeted area included a further
2 per cent and 1 per cent respectively of all burglaries. In 1994, ‘hot spot’ 1
declined in size a little (containing 7 per cent of burglaries in Cambridge) and ‘hot
spot’ 2 increased in size (containing 8 per cent of burglaries in Cambridge).
The first rather than the second ‘hot spot’ was chosen for targeting by the group for
two main reasons. The first reason was that the main part of the first stage of crime
analysis was conducted on data relating to 1993 when the ‘hot spot’ was dominant.
The second reason was that the first ‘hot spot’ spanned both privately owned and
publicly owned housing and it was believed at the time that such a spread would
maximise opportunities for intervention.
THE NATURE OF THE PROBLEM: RESIDENTIAL BURGLARY IN CA M B R I D G E
7

THE NATURE OF THE PROBLEM: RESIDENTIAL BURGLARY IN CA M B R I D G E
8
Figure 3: ‘Hot spots’ of residential burglary in Cambridge: 1993 and 1994
Figure notes: The marker symbols represent the location of residential burglaries to the nearest 100m
grid square. The symbols have been graduated from 1 to 22 (1993) and 1 to 15 (1994) to
represent the frequency of burglaries in each 100m grid square. The ‘hot spot’ ellipses were
calculated using STAC [1] software based on a search radius of 150m and drawn using
MapInfo. All ellipses identified in the analysis are included on the full-sized maps.
[1] The Spatial and Temporal Analysis of Crime Software was developed by the Illinois
Criminal Justice Information Authority. Any opinions, findings, and conclusions or
recommendations expressed in this publication are those of the authors and do not
necessarily reflect the views of the Illinois Criminal Justice Information Authority.
Residential burglaryhot spots: 1993
Residential burglaryhot spots: 1994
Residential burglaryhot spots: 1993Magnified view
Residential burglaryhot spots: 1994Magnified view

Geographic distribution of repeat burglaries
The DBTF was established at a time of growing interest in the phenomenon of
repeat victimisation. There was some evidence from recent research that high
crime areas and crime ‘hot spots’ contained high rates of repeat victimisation
(Tricket et al., 1992). Conversely, the research suggested that high crime areas and
crime ‘hot spots’ were to an extent created by high levels of repeat victimisation.
Previous research has shown that it is not straightforward to calculate repeat rates
of dwellings using police-recorded data (Anderson et al., 1995). There are at least
two large problems to overcome. First, it is difficult to identify unique dwellings,
which is an essential part of the process of measuring repeats. Address data are not
always entered correctly or according to the same protocols. House names and
house numbers may or may not be included and street names may be spelled
correctly or incorrectly or abbreviated or not abbreviated. Second, it is difficult to
identify whether or not an address is a multi-occupancy address. Police data on
residential burglary do not necessarily conform to specific rules in relation to
identifying multi-occupancy addresses. A burglary in a flat might be recorded at the
level of the individual dwelling unit (for example, 13a Madeup Court) or at the
level of the building unit (Madeup Court). It would be expected that repeat rates of
the latter would be greater than repeat rates of the former.
It might be helpful in terms of explaining the following figures, and in terms of
identifying some of the problems that might be faced by others in performing the
same task, to explain the way in which these two problems were handled by the
current analysis.
The method used for identifying unique addresses was to sort addresses by street
number and street name and to identify variations in presentation by eye and
correct them. Unique identifier numbers were then given to each address by
combining recoded versions of the two variables making up the address (that is,
street number and street name). These were once again sorted and checked
manually and missing values were added by hand.
The method used for identifying the level of the address in terms of whether or not
it identified an individual dwelling unit (e.g. individual houses or flats) or whether
it identified a block of dwelling units (e.g. a block of flats, a college, a hostel, or a
hotel) was to generate an additional variable for each address that showed whether
or not it was multi-occupancy or non-multi-occupancy. These variables were
created from information contained in the Electoral Register, from the addresses
THE NATURE OF THE PROBLEM: RESIDENTIAL BURGLARY IN CA M B R I D G E
9
themselves (for example, when the name of the dwelling indicated its status), and
from lists of multiple occupancy dwellings made available by the City Council
Housing Department.
In most cases it was fairly obvious whether the address referred to a single house or
flat (the address was recorded by the police at the dwelling unit level) or whether
the address referred to a block of flats or to a college or hotel (the address was
recorded by the police at the building unit level). However, there were a number of
cases when ‘best estimates’ had to be generated from the information at hand.
In order to reduce the number of uncertain cases as much as possible, the analyses
of the data which follow are based only on addresses recorded at the dwelling unit
level (either single houses or single flats). In most cases, this comprises the vast
majority of the data collected (for example, in the analysis that follows for repeat
burglary in 1993, 86 per cent of cases were classified as single dwelling units and
were included in the analysis). However, 14 per cent of cases comprised multi-unit
addresses (for example, colleges, hotels, hostels, and blocks of flats), and these were
excluded from the analysis.
There are at least two methods of calculating repeat rates from police data. The
first might be referred to as the ‘calendar year-within year comparison’. The repeat
rate is calculated as the percentage of dwellings burgled two or more times during a
particular calendar year. This method has the advantage that it is fairly simple to
analyse and to present graphically. However, it has the disadvantage that dwellings
burgled at the beginning of the year have a longer time period in which to be
burgled again than those burgled at the end of the year.
The second method might be referred to as the ‘target month-previous 12 month
comparison’. The repeat rate is calculated by selecting a target month (or similarly
short period) and determining the proportion of dwellings burgled in that month
that were also burgled in the previous 12 months. This method has the advantage
that it overcomes the problem of a variable ‘period at risk’ of the previous method
as each dwelling has exactly 12 months to be burgled again. However, it has the
disadvantage that it requires a reasonably large number of burglaries to occur in the
target month (or other short period) to be able to arrive at an accurate rate. For
example, 10 burglaries recorded in the target month would yield a repeat rate of 10
per cent if 1 of the dwellings had been burgled in the previous 12 months and a
repeat rate of 20 per cent if 2 had been burgled previously.
THE NATURE OF THE PROBLEM: RESIDENTIAL BURGLARY IN CA M B R I D G E
10

The following chart shows the geographic distribution of repeat burglaries of single
dwelling units in Cambridge for the year 1993 (the year used for most of the early
analysis of the data by the DBTF) using the first method (the ‘calendar year-within
year comparison’). This method was chosen as the number of burglaries per month
was too small in each ward to use the second method. The chosen method would
tend to generate slightly lower repeat rates than the alternative method. However,
the main purpose of the graph is to make comparisons across wards. As the same
method is used across all wards over the same period of time, it is still possible to
make comparisons among them and (the main point) to compare the repeat rates
of the targeted wards with the other wards in the City.
The ranked order of wards for repeat rates among single dwellings (excluding
colleges, etc.) is similar to the ranked order of wards for all offences (see Figure 2).
The top three wards in terms of total burglaries were the same top three wards in
terms of repeat burglaries. Castle Ward was second in rank order in terms of both
total burglaries and repeat burglaries. However, Arbury was the fourth highest ward
in terms of total burglaries, but the sixth highest ward in terms of repeat burglaries.
THE NATURE OF THE PROBLEM: RESIDENTIAL BURGLARY IN CA M B R I D G E
11
Figure 4: Repeat rate for dwellings by ward: 1993
Ward
14
12
10
8
6
4
2
0

The proportion of dwellings burgled in each of the targeted wards is shown more
clearly in Table 1 below.
Eleven per cent of dwellings in Castle Ward and 8 per cent of dwellings in Arbury
Wards were burgled more than once. The Castle rate was higher than the rate for
Cambridge City as a whole, but Arbury had an identical rate to the city as a whole.
The repeat rate for the targeted ‘hot spot’ (13%) was higher than the repeat rate
for the wards within which it fell, and for Cambridge as a whole. These results lend
support to results of other studies which show that areas with high total offence
rates also have high repeat offence rates.
Burglars in Cambridge
The first part of the following analyses is based on the police offender database and
relates to offender address locations. The second part is based on the interviews
with offenders and relates to offenders’ accounts of why they selected areas within
Cambridge and whether they committed repeat burglaries.
Offender address locations
The original analysis of offender address locations was based on data held for
offences committed in 1994, during the first stage of crime analysis. The number of
offenders found guilty of offences in the targeted wards was fairly small, which
hindered the investigation. In order to increase the number of cases, the following
analysis is based on all offenders found guilty of burglaries within the targeted wards
during the two-year period immediately before the implementation of the
programme, covering the period from September 1994 to August 1996.
THE NATURE OF THE PROBLEM: RESIDENTIAL BURGLARY IN CA M B R I D G E
12
Table 1: Repeat victimisation rate within Cambridge City and selected areas: 1993
Area Repeat rate [1]
n %
‘Hot Spot’ 1 (targeted ‘hot spot’) 2 166 13
Arbury Ward (targeted ward) 161 8
Castle Ward (targeted ward) 208 11
Cambridge City 1531 8
Table notes: [1] The repeat rate calculated as a percentage of dwellings burgled two or more times in
1993; [2] See Figure 3.

In this two-year period, there were 592 residential burglaries in the targeted wards.
N i n e t y-seven of these (16%) were ‘cleared up’, which resulted in 37 unique offenders
who worked alone or in collaboration with others. Thirty-two of these had addresses
in Cambridge. These 32 offenders generated 100 offence-offender combinations and
the distance between the offender’s address and the offence address in each of these
combinations was used as the basis for the following analysis.
Figure 5 shows the distance decay curve for offences committed in the targeted
wards in the two-year period. The chart shows that the estimated mean distance
travelled by these offenders to offences committed in Arbury and Castle Wards was
1,459 metres (see table note for method of calculation). The minimum distance
travelled was zero metres (the offender lived in the same 100 metre grid square as
the burglary victim) and maximum distance travelled was 6,185 metres.
Recoding the distance travelled shows that 15 per cent of ‘cleared up’ offences
where the offenders had Cambridge addresses were committed by offenders who
lived 500 metres or less from the dwelling and just over half (51%) of ‘cleared up’
THE NATURE OF THE PROBLEM: RESIDENTIAL BURGLARY IN CA M B R I D G E
13
Figure 5: Distance in metres from the offender’s address to the victim’s address:
Arbury and Castle Wards: September 1994 – August 1996
Table note: The histogram shows various distance ranges between the offender’s address and the victim’s
address measured from the centroid of the 100m grid square in which each address postcode
fell. The chart is based on all offences ‘cleared up’ during the two-year period before the
programme for which offender details were included in the police offender database.
0 500 1000 1500 2000 2500 3000 3500 4000 4500 5000 5500 6000
Distance in metres from offender ’s address to the victim’s address
40
30
20
10
0

offences were committed by offenders who lived 1,000 metres or less from the
dwelling. Two-thirds of offences were committed by offenders who lived 1,500
metres or less from the dwelling and over three-quarters (77%) involved offenders
who lived 2,000 metres or less away. In terms of ward of residence, two-thirds of
offences (69%) committed in the Arbury and Castle Wards were committed by
offenders who lived in those two wards.
Figure 6 shows the spatial relationship between the offender’s address and the
victim’s address in terms of the position of offence and offender ‘hot spots’. The
THE NATURE OF THE PROBLEM: RESIDENTIAL BURGLARY IN CA M B R I D G E
14
Figure 6: Location of offender ‘hot spots’ in relation to offence ‘hot spots’: Cambridge:
September 1994-August 1996
Figure notes: The shaded ‘hot spots’ show the aggregates of address locations (of points [not shown]
drawn to the nearest 100m) of burglars who were found responsible (by various methods
of ‘clearing up’) for burglaries committed in the two-year period before the full
implementation of the programme (September 1994-August 1996) in the two targeted
wards. The non-shaded ‘hot spots’ show the offence locations for those offences ‘cleared
up’ during the same period.

shaded ellipses represent the three largest ‘hot spots’ of offender address locations.
The non-shaded ellipses show the three largest ‘hot spots’ of burglary offence
locations for those offences which were ‘cleared up’. The figure shows that the
largest ‘hot spot’ of offenders’ addresses almost completely overlaps the largest ‘hot
spot’ of offence addresses. In other words, the offenders tended to live in, or close
to, the offence ‘hot spots’. Six of the 32 offenders responsible for all ‘cleared up’
burglaries in Castle and Arbury Wards during this period lived within the largest
offence ‘hot spot’ and 8 lived in the largest offender ‘hot spot’.
Hence, the evidence from each of the preceding analyses of the relationship
between offence and offender address location among burglars who were resident in
Cambridge shows that burglaries committed in the target wards during the period
before the implementation of the programme tended to be committed by offenders
who lived nearby.
Offender interviews
In order to obtain greater insight into burglary in the targeted area, interviews were
conducted with local burglars. The interviewing was completed in two stages. The
first stage was conducted shortly after the DBTF was established in order to provide
information that might instruct the choice of strategies for preventing burglary.
The primary aim of this stage was to speak to local offenders who might have
committed burglaries in the targeted areas. The local probation department
representative of the DBTF asked all clients who had recent convictions for
burglary in Cambridge if they would be willing to be interviewed by researchers
from the Institute of Criminology. At the time, Cambridge Probation Service had
about 30 clients on its register who met our conditions. In the first year of the
DBTF, interviews were conducted with 10 of these offenders.
The second stage was conducted mainly during the second year of the
programme in order to provide additional information on repeat burglaries and
target selection. It was felt unlikely that we would be successful in interviewing
many more offenders on probation. Hence, we approached Bedford Prison and
requested access to detainees currently convicted of burglary. During the second
year of the work of the DBTF, interviews were conducted with 16 burglars from
Bedford Prison and a further two burglars from Cambridge Probation Service.
Overall, 28 burglars were interviewed.
All of the burglars interviewed in the first round of interviews had committed at
least one offence in Cambridge and 8 of the 10 had committed the majority of
their offences in the City. Six of the eight offenders said that they had committed
THE NATURE OF THE PROBLEM: RESIDENTIAL BURGLARY IN CA M B R I D G E
15

the majority of their offences in the two targeted wards. Hence, while the number
of offenders interviewed was small, they represented a relevant group of offenders
whose opinions were of particular interest to the DBTF.
One issue of particular concern to the DBTF was the relationship between the
location of the offence address and the location of the offender’s address. The
interviews showed that most of the offenders interviewed committed most of their
offences less than a mile from their home. Four of the six offenders who said that
they committed most of their offences in the targeted wards also lived in the
targeted wards. When asked why they chose their main offence locations, the
majority (6 out of the 10) gave the nearness of the offence site to their home as
their primary reason. The remainder gave a variety of reasons relating to the
general attractiveness of the area in terms of burglary.
Three of the ten offenders admitted committing recent burglaries in the targeted
‘hot spot’. Two of the three offenders said that the most important reason for
choosing the ‘hot spot’ was that it was near to where they lived. Other reasons
given related to their perceptions of the risks, rewards, and effort involved,
including the perceived vulnerability of the windows of dwellings in the ‘hot spot’
area, the existence of passageways to facilitate entrance and escape, and the
expectations that there would be something worth stealing in the area. They all
believed that other burglars would also find the ‘hot spot’ an attractive site for
burglary for the same reasons.
The issue of repeat victimisation was of particular interest to DBTF as the group
wanted to find out whether they should target repeat victimisation in the second
stage of their work. Repeat victimisation was also of a more general interest as it
was unknown at the time why dwellings were repeatedly victimised. Three
potential explanations could be found in the research literature: (1) the same
offender returns; (2) the offender tells others and they return; (3) the home is
generally an attractive target to all potential burglars (Polvi et al., 1991). The
offenders were asked if they ever went back to any of the dwellings that they had
burgled. The responses given by the first-stage, local burglars in Cambridge and the
second-stage, imprisoned burglars in Bedford were different.
The majority of offenders in the first stage of interviewing in Cambridge said that
they had gone back to dwellings that they had burgled in the past. The main
reasons for returning covered the main reasons given by burglars generally for
committing offences (namely perceived low risks, high rewards, or ease of
access)(see Bennett and Wright, 1984). They were also asked whether they had
THE NATURE OF THE PROBLEM: RESIDENTIAL BURGLARY IN CA M B R I D G E
16

ever burgled a dwelling as a result of other burglars giving them information.
Almost half of the offenders said that they had committed this kind of repeat
b u r g l a r y. When asked why they returned to the homes that others had burgled,
they gave a number of reasons that focused mainly on the nature of the goods to
be stolen (rather than low risk or ease of entry).
The majority of offenders in the second stage of interviewing in Bedford said that
they did not return to dwellings previous burgled and none of the burglars said that
they committed offences as a result of information from other burglars. Those who
did commit repeat burglaries explained this in terms of the benefits of the knowledge
gained about the method of entry and what goods the property contained.
Conclusion
The results of the data-gathering stage were important in orienting the DBTF to
the nature of the problem being addressed. The key characteristics of the problem
of residential burglary in the north of Cambridge were the concentrations of
burglary within specific ‘hot spots’ and within particular wards. The ‘hot spots’ and
the ‘hot wards’ were characterised by high levels of repeat victimisation. There was
some evidence from detected offences and from offender interviews that residential
burglaries were committed by local youths who lived in the same or adjacent wards
and who selected the target areas as a result of convenience, easy access through
footpaths and alleyways, and the perceived abundance of suitable targets which
were within the ability of these offenders to overcome.
THE NATURE OF THE PROBLEM: RESIDENTIAL BURGLARY IN CA M B R I D G E
17

3. The nature of the solution: programme elements
The relationship between the problem and the solution
One of the key principles of the overall programme strategy was that the nature of
the solution to burglary in Cambridge should be based on sound knowledge of the
nature of the problem. However, it was not clear from the outset by what process
information about the problem could be converted into crime prevention strategies.
The method chosen by the DBTF to achieve this was discussed briefly in Chapter
1. It was decided that three seminars should be organised to address what were
regarded as the three main elements of crime: vulnerable victims, motivated
offenders, and the absence of capable guardians.
The idea for developing seminars based on these topics derived from routine
activity theory. The theory is most commonly associated with the early research of
Cohen and Felson (1979) in which they state that in order for a crime to occur
there must be three essential conditions: a likely offender, a suitable target, and the
absence of capable guardians. The authors argued that increases in residential
burglary in the United States during the 1960s and 1970s were the result of
changes in routine activities which affected occupancy patterns (guardianship) and
the availability of stealable goods (suitable targets). This theory has been very
influential and provides not only a powerful explanation of changes in crime, but
also a rational means of generating targeted crime prevention strategies. For
example, programmes based on CCTV systems can be thought of as methods of
extending capable guardianship (Brown, 1995) and programmes based on repeat
victimisation can be viewed as methods of reducing the vulnerability of potential
victims (Chenery et al., 1997).
Representatives of various agencies with particular knowledge or expertise in these
areas were invited to attend one or more of the seminars. The three groups
discussed the nature of the problem in relation to their topic area and potential
strategies to affect the problem in the targeted areas. The ideas generated from
these discussions were fed back to the DBTF. A number of the projects suggested
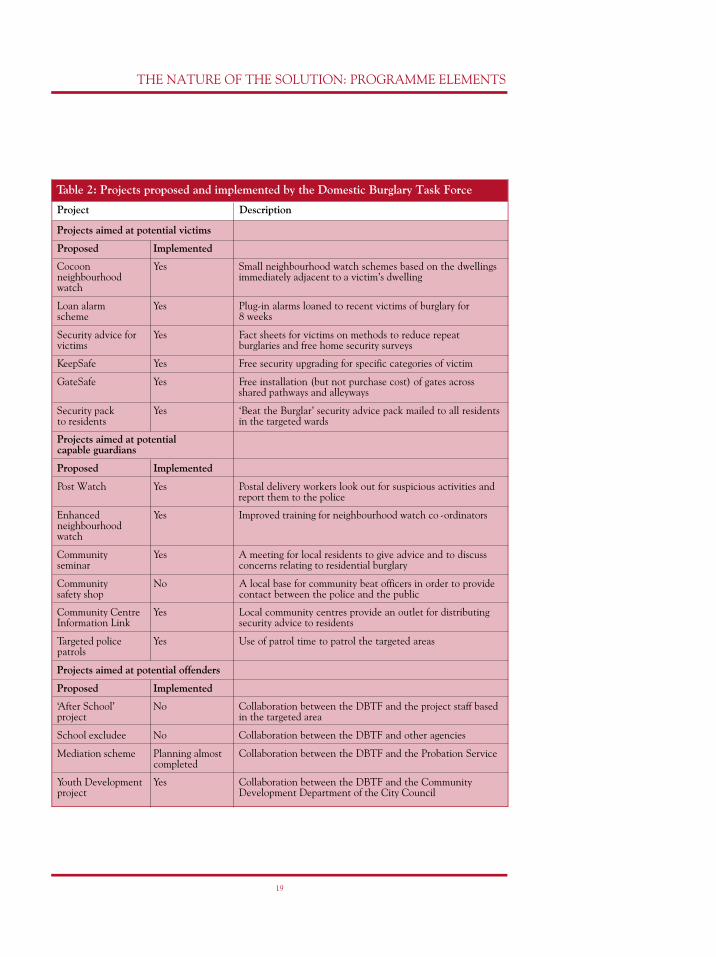
were submitted to the Safer Cambridge Steering Group for approval. Table 2
summarises some of the initial list of projects suggested and those that were
eventually selected.
The selection of projects
Action plans were drawn up by various members of the DBTF (depending on their
knowledge and expertise) for selected projects. In practice, not all of the projects
initially identified were eventually implemented. The idea of a community shop as
a local police base was eventually abandoned as a result of the lack of suitability of
available accommodation and as a result of the reluctance of the police to dedicate
THE NATURE OF THE SOLUTION: PROGRAMME ELEMENTS
18
THE NATURE OF THE SOLUTION: PROGRAMME ELEMENTS
19
Table 2: Projects proposed and implemented by the Domestic Burglary Task Force
Project Description
Projects aimed at potential victims
Proposed Implemented
Cocoon Yes Small neighbourhood watch schemes based on the dwellings neighbourhood immediately adjacent to a victim’s dwellingwatch
Loan alarm Yes Plug-in alarms loaned to recent victims of burglary for scheme 8 weeks
Security advice for Yes Fact sheets for victims on methods to reduce repeat victims burglaries and free home security surveys
KeepSafe Yes Free security upgrading for specific categories of victim
GateSafe Yes Free installation (but not purchase cost) of gates acrossshared pathways and alleyways
Security pack Yes ‘Beat the Burglar’ security advice pack mailed to all residentsto residents in the targeted wards
Projects aimed at potential capable guardians
Proposed Implemented
Post Watch Yes Postal delivery workers look out for suspicious activities andreport them to the police
Enhanced Yes Improved training for neighbourhood watch co -ordinatorsneighbourhoodwatch
Community Yes A meeting for local residents to give advice and to discussseminar concerns relating to residential burglary
Community No A local base for community beat officers in order to providesafety shop contact between the police and the public
Community Centre Yes Local community centres provide an outlet for distributingInformation Link security advice to residents
Targeted police Yes Use of patrol time to patrol the targeted areaspatrols
Projects aimed at potential offenders
Proposed Implemented
‘After School’ No Collaboration between the DBTF and the project staff basedproject in the targeted area
School excludee No Collaboration between the DBTF and other agencies
Mediation scheme Planning almost Collaboration between the DBTF and the Probation Servicecompleted
Youth Development Yes Collaboration between the DBTF and the Communityproject Development Department of the City Council

police time to staffing the shop. The police were concerned at the time that
policing in the area should aim to respond to current tasking policy, which required
police to tackle a range of local problems in a flexible way. The projects originally
identified as focusing on potential offenders (in practice, young people) all made
some progress during the lifetime of the DBTF. The Youth Development project
was implemented during the programme period and the mediation scheme reached
an advance planning stage. However, the ‘After School’ project and the ‘School
Excludee’ project had made little progress by the end of the programme.
The final list of projects also differed from the initial list as a result of the addition
of the Community Centre Information Link that aimed to provide security advice
to members of the local community through local community centres.
Programmes aimed at potential victims
The first five projects listed in the preceding table were implemented as a package
of measures. They were all aimed at recent victims of burglary and were organised
by Cambridge Police Crime Reduction Unit in collaboration with the Employment
Foundation Scheme (EFS) of the Cambridge City Council Planning Department.
The process of organising the package began with the Crime Reduction Unit who
trawled, every few days, the list of recently reported crimes and identified
residential burglaries that fell in the targeted area. Initially, a trawl was made just
among burglaries committed in the ‘hot spot’, but this was later extended to the
two targeted wards. The police then sent a letter to the victim stating that they
were sorry to learn about the recent burglary and offered a list of practical services
(the first five projects listed in the table above). A pre-paid envelope was provided
for the victim’s reply which was posted and returned to the Crime Reduction Unit
who (in those cases when help was sought) made a referral to the EFS by
telephone. A member of the EFS was funded by the City Council to work one-fifth
full-time on the project (with the support of other staff members) and trained by
the Crime Reduction Unit to carry out visits with those victims who requested the
programme services.
Cocoon neighbourhood watch
The aim of the cocoon neighbourhood watch scheme was to reduce the risk of
repeat victimisation and fear of burglary among recent victims. The idea for the
scheme derived from the Kirkholt and Huddersfield crime prevention projects
( Forrester et al., 1988; Anderson et al., 1995). It was based on the principle of
involving immediate neighbours in looking out for anything suspicious in the area in
the period immediately following a burglary. The representative from the EFS aske d
THE NATURE OF THE SOLUTION: PROGRAMME ELEMENTS
20

the victims if they would be willing for him to speak to their immediate neighbours.
They would then visit the neighbours in order to discuss what had happened and
what they could do to help. It was hoped that on some occasions these embryonic
watch schemes might develop into larger and longer-lasting schemes.
Loan alarms
Residents visited by the EFS were offered a plug-in loan alarm that fitted directly
into a domestic electrical power socket. The alarm detected movement in the room
in which it was placed and emitted a loud tone inside the home when triggered.
The main aim of the alarm was to provide reassurance to the victim of burglary and
to reduce the risk of repeat burglaries. The alarm was collected by the EFS after
eight weeks following the initial burglary and reissued to new victims.
Security advice to victims
Recent victims of burglary in the targeted wards were given an advice sheet on
basic home security. The sheet was contained in the original letter sent to the
victim by the Crime Reduction Unit. The aim of the advice was to enable victims
to take early action to prevent a repeat burglary. In addition to the fact sheet, those
victims who requested a visit were asked at the time if they would like the
representative from the EFS to conduct a home security survey.
KeepSafe
The KeepSafe scheme was funded by Cambridge City Council and provided by the
EFS. The scheme aimed to make available to certain eligible categories of
householders free security upgrading on their property. Pensioners, people who were
registered as disabled, single parents, and people who had been unemployed for six
months or longer were eligible for free installation of locks and people who, in
addition, were on full housing benefit, full council tax benefit, full family credit, or
income support were eligible for a free supply of locks. The KeepSafe scheme was
available to residents across the whole of Cambridge. However, all recent victims of
burglary who were visited by the EFS were specifically asked if they would like to
receive this service.
GateSafe
The GateSafe scheme was also funded by Cambridge City Council and provided by
the EFS. The scheme aimed to provide and fit gates to access ways and shared
passageways at the side and rear of properties. The supply and installation of the
gates was arranged by the EFS and was free. However, residents were required to
pay for the purchase of the gates. In the case of communal gates covering access
ways across two or more properties, the resident had to obtain agreement from the
THE NATURE OF THE SOLUTION: PROGRAMME ELEMENTS
21
immediate neighbours. The aim of the scheme was to prevent access to the side
and rear of the property by potential offenders. The gates were six feet high and
cost between £100 and £300 each which was typically shared among the
neighbours benefiting from the scheme.
Security pack to residents
The security pack was a separate initiative covering all residents and was unrelated
to the security advice given to victims of burglary. At an early stage of the
programme, all residents in Arbury and Castle Wards were mailed a copy of the
Home Office ‘Beat-the-Burglar’ pack which was funded by Cambridge City
Council. The main difference in the advice given to victims and the advice given
to all residents was that the security pack was wider ranging and covered both long-
term and short-term measures to reduce the risk of burglary.
Programmes aimed at potential capable guardians
Post Watch
The Post Watch scheme involved postal workers who delivered mail in the
targeted areas looking out for anything suspicious during their rounds and reporting
these to the police. The postal workers were given advice on the kinds of things to
look out for, including: lights left on, insecure windows or doors, items which
appeared to be hidden or abandoned, and suspicious people or vehicles. In cases of
emergency, the postal worker was required to make a ‘999’ call to the police. In
other cases, the postal workers wrote down what they had seen on an incident form
which was handed to the postal manager who forwarded the information to the
police.
Enhanced neighbourhood watch
The aim of the enhanced neighbourhood watch scheme was to make
neighbourhood watch schemes already operating in the targeted area more
effective. In order to achieve this, the police organised a training day for local
neighbourhood watch co-ordinators who were advised on the nature of crime in
the area and what could be done to prevent it. At a later date, the local police
organised a similar series of meetings in the targeted wards for neighbourhood
watch co-ordinators. These were primarily established as part of the new system of
sector policing, but involved collaboration between the police and the DBTF. The
two sessions organised for the two targeted wards involved informing the co-
ordinators about local policing initiatives and matters relating to: communication
between the police, the co -ordinators and the watch members, information
available to co-ordinators from the police, and the level of support that the police
could offer.
THE NATURE OF THE SOLUTION: PROGRAMME ELEMENTS
22
Community seminar
The community seminar comprised a local evening meeting which covered issues
relating to residential burglary in the targeted wards. The seminar was attended
by senior representatives of the police and Cambridge City Council, members of
the DBTF, and invited local residents. The main aims of the seminar were to
m a ke contact with those members of the community who had not necessarily
been burgled (the EFS part of the programme focused wholly on victims of
burglary) and to broaden the intervention to include a community-level
approach to crime prevention. The seminar included presentations by
representatives of the police, the local council, and residents involved in local
anti-burglary community action.
Community Centre Information Link
The aim of the Community Centre Information Link was to provide local residents
with information about community safety and crime prevention through local
community centres. The DBTF obtained funds from the City Council to provide
information racks for five community centres in the target area. The racks
contained a range of leaflets on crime prevention literature and other advice that
could be offered to residents attending the centre. A separate advice sheet was
displayed near to the racks listing useful contact names and telephone numbers
relating to crime prevention and community safety.
Targeted patrols
The aim of the targeted patrols project was to use police time, when they were not
responding to calls for service, to patrol the target areas. The project developed
through two distinct stages. In the first stage, routine patrol officers were tasked by
their shift sergeant or inspector to use any uncommitted time to patrol the two
targeted wards. The decision to patrol the wards was then left up to the individual
patrol officers. In the second stage (which followed the transition of Cambridge
Police to a system of sector policing), patrolling the targeted area was established
more formally. This involved: four dedicated officers who were tasked with
patrolling the targeted areas as part of their proactive duties, a response car staffed
by two officers which contained a record sheet for officers using the car to record
time spent in the targeted wards, and the involvement of six community beat
officers who were allocated to the beats covered by the target area.
Programmes aimed at potential offenders
Youth Development
A number of youth projects were in operation in the north of Cambridge during
the programme period as part of the general work of the Community Development
THE NATURE OF THE SOLUTION: PROGRAMME ELEMENTS
23

Department. However, the DBTF were particularly interested in monitoring the
work of one of these projects which involved young people in a central location of
the targeted area. The programme was based on contacts between young people
and detached youth workers and involved providing intensive support and focused
activities in order to help the young person’s development with particular attention
to anti-social behaviour.
THE NATURE OF THE SOLUTION: PROGRAMME ELEMENTS
24
4. Outcome effectiveness: did the programme work?
One of the most important measures of crime prevention effectiveness was whether
the programme succeeded in reducing the number of residential burglaries in the
target areas.
The main method for determining a programme effect used in the research was to
compare changes over time in the rates of residential burglaries in the programme
areas (areas which received additional crime prevention initiatives) with
comparison areas (areas which did not receive additional crime prevention
initiatives). In the following analysis the results for the programme areas have
been presented in an aggregated form comprising the combined area, and in a
disaggregated form comprising the two wards, four enumeration districts making up
these wards, and the targeted ‘hot spot’. The results for the comparison areas have
also been presented in an aggregated form comprising the whole city, and in a
disaggregated form comprising the four nearby wards, 10 enumeration districts
making up the these wards, and the three comparison long-term ‘hot spots’. At
each level of analysis, changes in residential burglary in the programme areas over
the 12 month period before and during the programme are compared with changes
over the same period in the comparison areas. Initial evidence of a programme
effect would be shown when burglary reduced by a greater amount (or increased by
a lesser amount) in the programme areas than in the comparison areas.
Trends in total residential burglaries
Table 3 summarises trends in residential burglary in the City of Cambridge and in
various parts of the city in the 12-month period before the programme was
implemented (September 1995 to August 1996) and in the 12-month period during
maximum programme implementation (September 1996 to August 1997).
The first section of the table shows that the number of burglaries committed in the
City as a whole fell by 19 per cent from the pre-programme period to the
programme period. The number of burglaries committed in the combined area
comprising the two targeted wards reduced by 4 per cent during the same period.
Hence, the first comparison does not suggest that burglary in the programme area
reduced by a greater amount than the City as a whole.
The previous comparison does not by itself suggest the absence of a programme
effect. It is possible that burglary reduced by greater amounts in specific parts of the
target area. The second section of the table show changes in burglary at the ward
level. Burglary in both Castle and Arbury Wards reduced, but by amounts less than
the reductions shown for the City as a whole. However, the most important
comparison is not with the City of Cambridge, but with similar wards in a similar
OUTCOME EFFECTIVENESS: DID THE PROGRAMME WORK?
25
location. A more equal comparison can be made between the targeted wards and
their adjacent wards, which share many of the characteristics of the target area.
The table shows that three of the comparison wards showed greater reductions in
residential burglary than were shown in the targeted wards. The only exception was
Newnham ward which showed a substantial increase in burglary over the same
period. However, this finding goes against the trend of burglary in the city as a
whole and the difference between the Newnham and Arbury and Castle appears to
be more a product of unusually high levels of criminal activity in Newnham than a
result of unusually low levels of criminal activity in the targeted wards. Hence,
while the comparison could be used to show that Castle and Arbury in a sense
‘outperformed’ Newnham, the combined evidence of the other comparisons does
not suggest that the difference could be attributed to a programme effect.
It still remains possible that, while there were no greater reductions in burglary in
the two targeted wards than in neighbouring wards, there were areas within the
targeted wards that were particularly affected by the programme and which reduced
by greater amounts. The third section of the table shows the changes in burglary at
the enumeration district (ED) level.
The table shows that in two of the four EDs within the target wards (ED1 and
ED3) burglary increased over the programme period. The table also shows that in
two of the four EDs (ED2 and ED4) burglary reduced. The reduction in ED4 was in
line with reductions across the city as a whole, while the reduction in ED2 was
higher than the average reduction for burglary in the city as a whole. It is perhaps
significant that the two EDs that showed reductions were mainly in the south of
the combined programme area and the two EDs which showed increases were in
the north of the area. It is possible that the programme had a greater impact in the
south of the area (around the area of the main ‘hot spot’ of the programme site)
and less of an impact in the north. It is also possible that the observed movements
might have been a result of some displacement of burglary out of the south and
into the north of the area. However, in order to attribute this movement to a
programme effect (rather than an unrelated characteristic of burglary reduction in
the area generally), it would have to be shown that there was in fact a greater-than-
expected reduction in burglary in the main programme area ‘hot spot’.
The fourth section of the table shows changes in numbers of burglaries at the ‘hot
spot’ level. The first row shows the change in number of burglaries in the original
programme area ‘hot spot’. The number of burglaries committed in the original
programme ‘hot spot’ reduced during the evaluation period by 18 per cent. In order
to determine whether this was greater than what might have been expected in
similar areas, changes in other ‘hot spots’ in the north of the City were also
measured.
OUTCOME EFFECTIVENESS: DID THE PROGRAMME WORK?
26

OUTCOME EFFECTIVENESS: DID THE PROGRAMME WORK?
27
Table 3: Residential burglary during the 12-month period before and during the
programme
Pre-programme Programme Percentage
period [1] period change
City level
Whole city 1,974 1,597 –19%
Programme area part of the city [2] 298 286 –4%
Ward level
Programme area: Castle
Programme area: Arbury
Comparison: Kings Hedges
Comparison: Market
Comparison: Newnham
Comparison: West Chesterton
Enumeration district level
Programme area ED1 (Arbury)
Programme area ED2 (Arbury)
Programme area ED3 (Castle)
Programme area ED4 (Castle)
Comparison ED5 (Kings Hedges)
Comparison ED6 (Kings Hedges)
Comparison ED7 (Market)
Comparison ED8 (Market)
Comparison ED9 (Market)
Comparison ED10 (Newnham)
Comparison ED11 (Newnham)
Comparison ED12 (Newnham)
Comparison ED13 (West Chesterton)
Comparison ED14 (West Chesterton)
‘Hot spot’ level [3]
Original programme ‘hot spot’
Programme 5-year ‘hot spot’ 1
Programme 5-year ‘hot spot’ 2
Comparison 5-year ‘hot spot’ 3
Comparison 5-year ‘hot spot’ 4
Comparison 5-year ‘hot spot’ 5
200
98
140
196
100
209
194
92
96
146
157
145
–3%
–-6%
–31%
–26%
+57%
–31%
63
31
72
130
50
91
47
73
75
23
48
31
99
114
71
17
76
117
37
59
28
52
55
60
64
35
69
78
+13%
–45%
+6%
–10%
–26%
–35%
–19%
–29%
–27%
+161%
+33%
+13%
–30%
–32%
114
15
111
83
37
22
94
7
70
58
17
10
–18%
–53%
–37%
–30%
–54%
–55%
Table Notes: [1] Pre-programme=September 1995-August 1996; programme period=September 1996-August 1997. [2] Castle and Arbury wards. [3] The original programme ‘hot spot’ comprises the area of high levels of
residential burglary identified by the DBTF in Stage 1 of the programme. The 5-year ‘hot spots’ were
created by mapping police data for residential burglary for the period September 1991 to August 1996.
The counts shown comprise the number of burglaries which fell inside the 5-year ‘hot spot’ boundaries
during the pre-programme and programme periods.

This analysis was based on identifying the location of ‘hot spots’ in the area using
data for five years before the programme was implemented (see Figure 7). Once
located, the number of burglaries committed inside these ‘hot spots’ during the year
before and year during the programme was calculated. This method has the
advantage that it makes use of computer-generated ‘hot spots’ rather than ‘hot
spots’ drawn by hand and that the ‘hot spot’ is held stable over time. Table 3 shows
that burglary in the smaller ‘hot spot’ within the programme area (‘hot spot’ 1)
reduced by over 50 per cent during the course of the programme and the larger ‘hot
spot’ in the programme area (‘hot spot’ 2) reduced by 37 per cent. However, the
table also shows similar reductions in burglary in the comparison ‘hot spots’.
Another consideration is whether or not the reductions were related in any way to
the development of the programme and the crime prevention mechanisms which
might be generated by it. It would be expected that the crime prevention effect of
the programme would increase over time as these processes strengthened over the
evaluation period.
OUTCOME EFFECTIVENESS: DID THE PROGRAMME WORK?
28
Figure 7: Map of north Cambridge showing programme
wards, comparison wards and boundaries of the
5-year ‘hot spots’
Figure notes: The shaded area
covers the programme wards
and comparison wards. The
areas with the bold outline
comprise the programme wards.
The five ellipses labelled 1 to 5
represent the 5-year ‘hot spots’.
1
2 3
54

The following figures show the monthly changes in burglary during the 12-month
period before the programme evaluation period and the 12-month period during
programme implementation for Cambridge City as a whole and for the two targeted
OUTCOME EFFECTIVENESS: DID THE PROGRAMME WORK?
29
Figure 8: Residential burglaries per month during the pre-programme and programme
periods
Cambridge City
Arbury Ward
Programme start
Programme start
220
200
180
160
140
120
100
80
6057 58 59 60 61 62 63 64 65 66 67 68 69 70 71 72 73 74 75 76 77 78 79 80
57 58 59 60 61 62 63 64 65 66 67 68 69 70 71 72 73 74 75 76 77 78 79 80
Month No. (57 = September 1995)
Month No. (57 = September 1995)
20
10
0
Evaluation period start
Evaluation period start

wards. The figures show some evidence of a steady reduction over time in Arbury
Ward, dropping from an early peak to just three burglaries in the last month shown.
However, there is less evidence of a month-by-month reduction in burglary in
Castle Ward. In fact, there is a steeper reduction in burglary towards the end of the
programme period in the City as a whole than in Castle Ward.
It is hard to explain why the trend in burglary in Castle Ward showed less of a
reduction over time than was shown for the City as a whole. It is possible that
some of the variation across the wards of the City might be explained by broader-
based changes in factors relating to crime (such as economic change) or by policing
and other crime-reducing interventions conducted outside the evaluated
programme which impacted in different ways across the wards of the city.
Hence, while there is some evidence of a reduction in burglary across the
programme period in both the targeted wards and in ‘hot spots’ within those wards,
the level of the reduction is not markedly different to that of comparison wards and
comparison ‘hot spot’ areas.
Trends in repeat residential burglaries
It is possible that, while there might have been no reduction in total burglaries in
the programme wards, there might have been a reduction in repeat burglaries
(which might either have been too small to detect when measuring total burglaries
OUTCOME EFFECTIVENESS: DID THE PROGRAMME WORK?
30
Castle Ward
40
30
20
10
057 58 59 60 61 62 63 64 65 66 67 68 69 70 71 72 73 74 75 76 77 78 79 80
Month No. (57 = September 1995)
Programme startEvaluation period start
or might have been accompanied by an increase in single burglaries). A large
proportion of the programmes implemented were designed to impact on repeat
burglaries. Hence, it is plausible that any programme effect would be most clearly
identified by examining changes in repeats.
As before, the data were based only on addresses that were recorded by the police
at the dwelling unit level (either single houses or single flats). The method of
calculating repeat was the same as described earlier (calculating the percentage of
dwellings burgled once in a calendar year that were burgled again in the same
year). It was noted earlier that the method of counting repeats within a set
window period had the effect of providing a longer time gap in which to detect a
repeat burglary among dwellings burgled at the beginning of the period than at
the end. However, this method has certain advantages over other methods
(discussed earlier) and is less problematic in relation to the current analysis as the
main point is to make comparisons across areas. The fact that the same method is
used for measuring repeats across all areas in both periods should not bias in
favour of any of them.
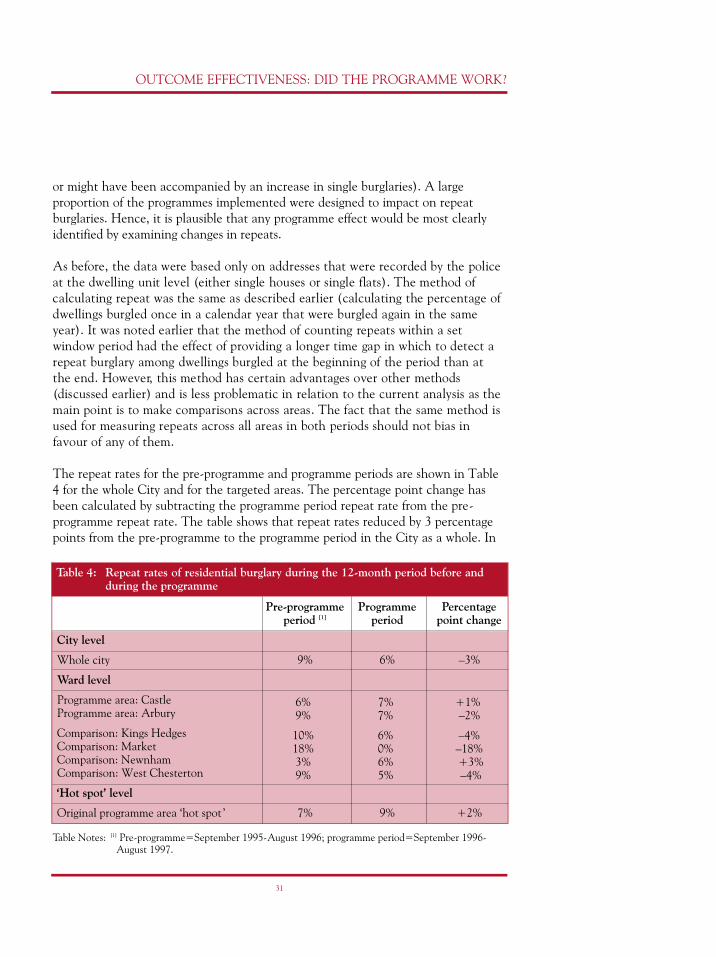
The repeat rates for the pre-programme and programme periods are shown in Table
4 for the whole City and for the targeted areas. The percentage point change has
been calculated by subtracting the programme period repeat rate from the pre-
programme repeat rate. The table shows that repeat rates reduced by 3 percentage
points from the pre-programme to the programme period in the City as a whole. In
OUTCOME EFFECTIVENESS: DID THE PROGRAMME WORK?
31
Table 4: Repeat rates of residential burglary during the 12-month period before and
during the programme
Pre-programme Programme Percentage
period [1] period point change
City level
Whole city 9% 6% –3%
Ward level
Programme area: Castle
Programme area: Arbury
Comparison: Kings Hedges
Comparison: Market
Comparison: Newnham
Comparison: West Chesterton
‘Hot spot’ level
Original programme area ‘hot spot ’ 7% 9% +2%
6%
9%
10%
18%
3%
9%
7%
7%
6%
0%
6%
5%
+1%
–2%
–4%
–18%
+3%
–4%
Table Notes: [1] Pre-programme=September 1995-August 1996; programme period=September 1996-
August 1997.

comparison, the repeat rate in Arbury Ward reduced by 2 percentage points and
increased in Castle Ward by 1 percentage point. These changes do not suggest that
the targeted area ‘outperformed’ in any way the City as a whole. However, a closer
comparison can be made between changes in the targeted wards and the
surrounding wards. In relation to three of these wards, the percentage point
reduction was greater in the comparison areas than in the targeted wards (ranging
from –4 percentage points to –18 percentage points).
It is also possible that the main impact of the programme on repeat rates occurred
over time and aggregated 12-month periods might obscure much larger reductions
towards the end of the programme. Figure 9 shows the rolling 12-month repeat
rates for the City as a whole and for the target wards spanning the pre-programme
and programme periods. The method of calculating the number of dwellings
burgled two or more times during a specified window period is the same as that
used in the previous analysis. However, the 12-month window period was allowed
to roll in 12-month blocks from the beginning of the pre-programme period
(month 57= September 1995). Hence, a repeat rate for the period month 46 to 57
was calculated (months before month 57 are not shown on the graph) and entered
as a point at month 57. A second repeat rate was calculated for the period month
47 to 58 and entered at month 58 on the chart, and so on.
This method overcomes the problem of variable periods of time for repeats to occur
among dwellings burgled at different times during the 12-month window period.
Each offence is included in the calculation at each position in the 12-month
period. Hence, all offences will be included at the beginning of a 12-month
window period (allowing a full 12 months for repeat to occur) and all offences will
be included at the end of a 12-month window period (allowing just 1 month for a
repeat to occur). For example, an offence occurring in say month 67 will be
included in the calculations for the 12-month periods 56-67, 57-68, 59-69 and so
on, with the time allowed for a repeat to occur varying accordingly from 1 month,
2 months, 3 months (and so on).
The results of this analysis are shown in Figure 9. The first chart shows that the
rolling repeat rate for dwellings in the City as a whole declined during the
programme period. The same analysis conducted for Arbury Ward also shows a
declining rate, which is particularly sharp towards the end of the programme,
reducing from a high of about 13 per cent to a low of about 6 per cent over a six
month period. The rolling repeat rate for Castle Ward shows a flatter curve with
little evidence of any trend in repeats in either direction over the programme
period.
OUTCOME EFFECTIVENESS: DID THE PROGRAMME WORK?
32

OUTCOME EFFECTIVENESS: DID THE PROGRAMME WORK?
33
Figure 9: Repeat rates of residential burglaries over 12 month rolling window periods
during the pre-programme and programme periods
Cambridge City
Arbury Ward
11
10
9
8
7
6
5
16
14
12
10
8
6
57 58 59 60 61 62 63 64 65 66 67 68 69 70 71 72 73 74 75 76 77 78 79 80
57 58 59 60 61 62 63 64 65 66 67 68 69 70 71 72 73 74 75 76 77 78 79 80
Month No. (57 = September 1995)
Month No. (57 = September 1995)
Evaluation period start
Programme start
Programme start
Evaluation period start

Conclusion
The findings relating to changes in total burglaries and changes in repeat rates of
burglary are similar. In Castle Ward, there was an overall small reduction in total
burglaries during the 12-month programme period and little evidence of a month-
on-month trend. There was also no evidence of an overall reduction in repeat
burglaries during the programme and no evidence of any general monthly trend. In
Arbury, there was a slightly larger overall reduction in total burglaries and stronger
evidence of a month-on-month trend starting half-way through the evaluation
period. There was also a small reduction overall in repeat rates and stronger
evidence of a reducing trend.
The issue of whether or not the programme worked cannot be resolved from these
data alone as it is necessary to determine the causes of the reductions shown. One
method of determining whether the programme might have produced these
reductions is to examine the implementation effectiveness of each of the
programme elements.
OUTCOME EFFECTIVENESS: DID THE PROGRAMME WORK?
34
Castle Ward
16
14
12
10
8
6
4
257 58 59 60 61 62 63 64 65 66 67 68 69 70 71 72 73 74 75 76 77 78 79 80
Month No. (57 = September 1995)
Programme start
Evaluation period start
5. Implementation effectiveness: was the programme
implemented as planned?
The main aim of examining the nature and level of implementation of the
programme elements (the projects) is to determine the extent to which they had
the power and ability to generate the mechanisms that could have led to a
reduction in burglary or to an enhancement of feelings of safety. In order for the
process to be effective, the projects need to instigate mechanisms which are
theoretically sound (in order to avoid ‘theory failure’) and to implement
programme elements strong enough to initiate the processes in practice (in order to
avoid ‘programme failure’). The following appraisal will consider the extent to
which the projects implemented by the DBTF were effective in achieving these
objectives and the extent to which they could have brought about the reductions
in burglary identified in the previous chapter.
Programmes aimed at potential victims
The five initiatives for victims of burglary were implemented as a package as a
means of reducing the risk of repeat victimisation and reducing anxiety. The
programme was initially directed at victims living in the programme area ‘hot spot’,
but was later broadened to include the two targeted wards. In the 14-month period
of the scheme (July 1996 to August 1997), 171 burglaries were committed in the
area covered by the scheme. A letter was sent by the Crime Reduction Unit of
Cambridge Police to all victims offering a visit and the five services provided in the
package. Just over one-fifth (21%) of all victims requested a visit. In order to find
out the reasons for the losses at each stage, the Crime Reduction Unit telephoned
as many non-respondents as possible to find out why they had not replied. The
main reasons given were: the burglary was not serious enough, the victim had
already taken actions to improve security, the victims were not interested, and the
victims thought that there was nothing that could be done. Twenty-eight of the 35
people requesting a visit were actually visited. The main reason for not visiting a
victim who requested a visit was that the person changed his or her mind or did
not respond to repeated attempts to be contacted. Fifteen of the 28 residents who
were visited were interviewed a few months later to find out how useful the services
had been to them.
Cocoon neighbourhood watch
The aim of the cocoon neighbourhood watch package was to enhance guardianship
of the victim and the victimised dwelling during the period immediately following
a burglary when the risk of repeat is possibly higher than normal. Two of the 28
victims visited said that they would like the EFS visitor to contact the immediate
neighbours with the view of establishing a cocoon neighbourhood watch scheme.
IMPLEMENTATION EFFECTIVENESS
35

The majority of the remainder (22 of the 26) said that they intended to contact
their neighbours themselves (although there was little evidence from the follow-up
interviews that any of the victims had done so). Some believed that a more
informal personal contact would be more suitable than a formal programme. Some
residents said that they ‘ kept themselves to themselves’ and did not want to
contact their neighbours. Others said that they already operated their own version
of a cocoon neighbourhood watch scheme.
Loan alarms
The aim of the loan alarm was to provide a deterrent to burglars and comfort to
victims during the period immediately following a burglary. Fifteen victims (54%)
visited requested the use of a loan alarm. Some of the victims who did not request
an alarm said that they were concerned about the alarm being triggered by pets and
others thought that the alarm would not be effective in deterring burglars. Others
had already installed alarms. Elderly victims tended to be worried by the idea of an
alarm going off. Residents who requested an alarm typically responded positively to
it (particularly those who were burgled at night). Some mentioned that they were
comforted by the alarm and said that it made them feel safer at home and helped
them sleep more easily at night.
Security advice to victims
The aim of security advice was to ensure that properties were secure during the
period of heightened risk following a burglary. The majority of victims (93%) said
that they would like the representative from the EFS to conduct a security survey
of the dwelling and to give advice on what further measures might be taken.
Residents interviewed as part of the evaluation generally spoke very favourably
about the advice. Some said that it motivated them to take action and had made
security changes on the basis of it. Others said that they thought that it was helpful
to be able to discuss their particular security needs with another person rather than
to read about general security advice in official leaflets. Others simply welcomed
the support and ‘caring’ nature of the person offering the advice.
KeepSafe
The aim of KeepSafe was also to ensure that properties were secure during the
period of heightened risk following a burglary. Just under half of all victims (43%)
qualified to receive free installation of additional window and door locks and other
security devices (such as door chains and ‘spy holes’) and about half of these (6
people in total) also qualified to receive free locks. All of those who qualified for
the scheme completed an application form to receive additional locks. Residents
interviewed thought that the scheme was very useful and succeeded in motivating
IMPLEMENTATION EFFECTIVENESS
36

them to take action. Some residents attributed the fact that they had not been
burgled since to the installation of the locks. The only negative comments came
from elderly people who sometimes thought the locks difficult to operate.
GateSafe
None of the victims visited said that they would like to be considered for free
installation of security gates. The main reason given for not taking up the scheme
was that the property did not have a communal alleyway or pathway. (However,
the number of victims spoken to was small and many of the other properties in the
target area did have alleyways or pathways suitable for gating.)
Programmes aimed at potential capable guardians
Post Watch
The main aim of the Post Watch scheme was to encourage postal delivery workers
to look out for suspicious incidents and to report these to the police. The aim of
the project was to reduce opportunities for crime. Information about programme
implementation effectiveness was obtained from weekly monitoring forms which
showed (amongst other things) the number and nature of incidents reported to the
scheme manager and the nature of the information reported to the police for
action. Monitoring forms were returned each week during the period from the start
of the project (end of April 1997) and the end of programme (August 1997).
During this period, 15 weekly forms were returned. The results showed that between
8 and 13 postal workers were involved in the project each week. In total, 19
incidents were reported to the police (typically one or two per week). These included
reports of suspicious people (typically looking at properties or vehicles), suspicious
vehicles (including sightings of stolen vehicles from information given to them by
the police), insecure properties, concern about the welfare of occupants, and alarms
s o u n d i n g. The only problems reported by the postal workers in relation to the
operation of the scheme were occasional lapses or lateness in the weekly information
from the police and problems relating to periods of leave taken by key personnel.
Enhanced neighbourhood watch
The aim of the neighbourhood watch co-ordinators’ training day was to provide co-
ordinators with advice and resources that might enhance neighbourhood watch in
the target area. The meeting was attended by local and force-level police,
representatives of security companies, local business people, and the neighbourhood
watch co-ordinators. The session considered methods of communication, methods
of reporting suspicious incidents to the police, and methods of improving domestic
IMPLEMENTATION EFFECTIVENESS
37

security. At the end of the session, the co-ordinators completed a brief
questionnaire evaluating the training given.
Thirty neighbourhood watch co-ordinators attended the training session and 22
completed the questionnaire. Almost all thought that the aims of the session had
been met and almost all thought that the content of the session was useful.
Overall, the response to the session was positive and co-ordinators reported that
the session had helped them to do their job better and had re-motivated them.
Community seminar
The aim of the community seminar was to make contact with residents of the
targeted wards who had not necessarily been victims of burglary. The DBTF hoped
that, in bringing together a broader spectrum of local residents in the context of a
community seminar, some of the social mechanisms of community crime
prevention might be instigated.
The seminar was monitored using two questionnaires: the first (the monitoring
questionnaire) to collect information about local residents before the seminar
started and the second (the evaluation questionnaire) to collect information on the
usefulness of the seminar when it was over. In total, 43 people attended the
seminar and 89 per cent returned the monitoring questionnaire and 92 per cent
returned the evaluation questionnaire. Seventy-six per cent of residents lived in
Castle Ward and 21 per cent lived in Arbury Ward (the remainder lived
elsewhere). The majority (78%) were aged over 40 years.
The results of the analysis showed that 68 per cent of respondents had heard about
the Safer Cambridge Steering Group. Ninety-seven per cent of residents said that
they were better informed as a result of the seminar. Forty-three per cent said that
they would definitely take some action against burglary and a further 39 per cent
said that they may take some action. Eighty-seven per cent of respondents
recommended holding similar meetings in the future.
Community Centre Information Link
The Community Centre Information Link aimed to provide local residents with
information about crime prevention and general security. It was hoped that
information received in the context of a community centre might be more relevant
to local people and might be more easily accessed and understood. Local staff were
also available to give additional advice and contact telephone numbers were made
available for members.
IMPLEMENTATION EFFECTIVENESS
38

The programme was implemented in five community centres and was monitored
using forms completed by the staff at the centres for each week of operation. The
number of each of the different kinds of leaflet taken by members was counted each
week. The result was entered on the monitoring form along with other information
relating to the effectiveness of the scheme.
In the first 3 months of the scheme, 300 leaflets were taken from the information
racks. Almost one-third of these (30%) comprised the ‘Make your Mark’ anti-
burglary pack, with a free property marker pen. Other popular information material
included: a leaflet on car crime (13%), a simple guide to choosing an alarm (11%),
a security-based anti-burglary leaflet (11%), and a ‘lock or lose it’ general security
leaflet (10%). The monthly return forms from the community centres included a
short section of the scheme manager’s view of public reaction to the scheme. Of
the six responses received, 2 rated resident interest as ‘good’, 3 rated the level as
‘fair’, and 1 rated it as ‘non-existent’.
Targeted patrols
The targeted patrols project aimed to increase the visible presence of the police in
the programme areas in order to deter potential offenders and to increase
perceptions of safety among local residents. Routine patrol officers were tasked with
patrolling the area when they were not responding to calls for service and
Community Beat Officers working in beats in the targeted wards were similarly
tasked. The project developed in two phases.
The first phase was implemented on 1st July 1996 and was monitored by time
sheets completed by the shift sergeant indicating each occasion on which the
targeted area was visited by routine patrols. During the period from January to
April 1997 no monitoring forms were returned and there were some concerns
expressed among the police about the appropriateness of the programme following
the recent transition of Cambridge Police to sector policing. Following discussions
with the new sector inspector in May 1997, a revised system of targeted patrols was
agreed which fitted more easily into the objectives of the sector as a whole. The
inspector took an active interest in the work of the DBTF and attended some of its
meetings. Twelve officers were dedicated to the task of patrolling the target area
when not involved in other duties. The second phase began in June 1997 and was
monitored using revised time sheets which included information on what actions
were taken by the officers when in the targeted area.
During the course of the evaluation year of the programme, 240 patrols (including
foot and mobile patrols and single and double crewed vehicles) went out and spent
IMPLEMENTATION EFFECTIVENESS
39

over 400 hours in Castle and Arbury wards. During the first two months of phase 1
of the project, 29 patrols went out covering the area for 56 hours (an average of 28
hours per month) and during the three most active months of the first phase, 162
patrols went out covering the area for 304 hours (an average of 101 hours per
month). During the most active month of phase 2 of the project, 45 patrols were
sent out providing 96 hours of cover in the programme area (an average of 96 hours
per month). The kinds of actions taken were recorded on the revised forms used for
phase 2 of the scheme. These showed that the most common actions taken apart
from routine patrols were person checks (43 per cent of all actions) and arrests (9
per cent of all actions).
Comparing the most active period of targeted patrols with trends in burglary over
the evaluation period (see Figure 8) does not reveal any obvious connection
between the two. During the first period of heightened police activity (months 69
to 72) burglaries increased in Arbury Ward and increased then decreased in Castle
Ward. During the second period of heightened police activity (months 79 and 80)
burglary reduced a little in Arbury Ward and increased a little in Castle Ward.
Programmes aimed at potential offenders
Youth Development
The Youth Project aimed to support young people living in the target area who
were currently experiencing various social and individual problems and who were
identified as being at risk of offending. The project was based on work with up to
13 young people who were befriended by youth workers. The youths and the youth
workers met regularly and formed a strong relationship. An internal evaluation of
the project showed that there had been some positive changes among the young
people, especially in relation to behaviour and attitudes towards each other. Since
starting the project, three members of the group had gained employment. The
report concluded that crime and anti-social behaviour had reduced in the specific
location of the project and it was not thought that the continuing problems on the
estate were caused by the current group members. Since completion of the project
the members of the group have continued to meet at a local community centre.
Conclusion
The projects aimed at potential victims were implemented as planned by the Police
who organised the referrals and the EFS who provided the services. However,
community interest in the programme as a whole was mixed. The take-up rate of
the home visits was fairly low (about one-fifth of victims contacted) and the take-
up rate of the services provides was variable. There was little interest in cocoon
IMPLEMENTATION EFFECTIVENESS
40

neighbourhood watch and for most of them the GateSafe scheme was
inappropriate. However, there was greater interest in loan alarms, home security
surveys, and the KeepSafe scheme. Victims who received these services were
generally happy with them and made use of them. Overall, it might be concluded
that the programme was strong, but the level of take-up was variable.
The projects aimed at potential capable guardians were all strongly implemented
within the context in which they operated. The Post Watch scheme worked very
well, but was limited to the period of time in which the area was covered by postal
workers. The enhanced neighbourhood watch initiative, the community seminar,
and the Community Centre Information Link initiatives were all implemented as
planned, but were limited to specific audiences and specific occasions on which
they were operated. The targeted patrols project involved a substantial number of
hours of patrol time spent in the target area, but again only provided cover at times
when police officers were present. Overall, the projects aimed at increasing
guardianship were established as planned. However, the total amount of
guardianship given to the area as a whole was limited to some extent by the time
and locations covered.
The project aimed at young people was established in the target area during the
course of the programme. The evidence of the internal evaluation suggested that
substantial progress had been made with the young people involved in the scheme.
Once again, the project operated as planned but covered only a small proportion of
young people in the area.
The aim of this chapter is to consider whether the programme was successfully
implemented (whether or not there was programme failure) and whether once
implemented it was capable of instigating the processes that might lead to a
reduction in burglary (whether or not there was theory failure). The evidence
suggests that the individual projects were implemented as planned. However, there
is some doubt about whether the programme as a whole was sufficiently powerful in
its design to instigate the kinds of processes required to reduce burglary rates at the
community level.
One interpretation of these findings (using a medical analogy) is that it was the
right medicine, but the wrong dosage. It is plausible that the amount of programme
resources needed to reduce residential burglary varies by area depending on a range
of factors, including: the level of motivation of local burglars, the existence of other
interventions, the impact of prior attempts to reduce burglary, and environmental
and other opportunities for crime. In other words, it might be harder to generate
IMPLEMENTATION EFFECTIVENESS
41

marginal reductions in crime in areas in which the balance of these factors is
unfavourable to crime prevention. It is possible that Arbury and Castle Wards
(areas which included long-term burglary ‘hot spots’) required larger amounts of
crime prevention resources than were feasible within the financial constraints of
the Domestic Burglary Task Force.
IMPLEMENTATION EFFECTIVENESS
42

6. Discussion
Issues relating to burglary prevention
One of the main issues to consider in relation to burglary prevention is whether the
programme reduced burglary in the target areas. It was shown earlier that
residential burglary reduced during the programme period and repeat burglary
reduced in one of the two target wards. One explanation of this reduction is that it
was brought about by the prevention programme. However, there are rival
explanations which should be assessed before arriving at a conclusion. Some of
these are shown below:
1. The prevention programme caused the reduction.
2. Other preventative programmes operating in the target areas caused the
reduction.
3. Other factors which affect crime rates generally caused the reduction.
The first explanation is the default explanation which could be accepted if no
other explanations could reasonably explain the reduction in burglary.
The second explanation might explain the reduction as a number of changes
occurred in the City of Cambridge during the course of the evaluation which might
have impacted on crime in the target areas. One significant change was the
development of sectorisation by Cambridge Police and the more general focus on
targeted and proactive policing. As the reduction in burglary was widespread in the
area (and not limited to repeat victims or particular ‘hot spots’), it is very possible
that the more proactive approach to policing had some impact on burglary in the
programme areas and in Cambridge generally.
The third explanation is also plausible. The reduction in burglary in the targeted
wards was similar to the reduction in burglary across the City as a whole and across
the country as a whole during the same period (notified residential burglary
reduced nationally by 6 per cent during the period 1995-1996). There is also some
evidence that the reduction in burglaries began to occur before the programme was
implemented. (See Figure 12 in Appendix A which plots the number of burglaries
per month in Cambridge City for the period 1991 to 1997 and shows that the
number of burglaries has been steadily declining since 1993.) Hence, there is some
evidence to suggest that the reduction in the targeted wards also reflected general
trends in burglary over the period of the evaluation.
In order to determine causality (for example, the programme caused the reduction
in burglary) it is necessary to identify correlation, temporal order, and absence of
rival explanations (control of extraneous variables). The evidence presented
DISCUSSION
43

suggests that there is some correlation (the development of the programme and the
reduction in burglary moved together in time) and there is mixed evidence relating
to temporal order (the reduction in burglary was sometimes shown to precede and
sometimes shown to follow programme implementation). However, there is less
evidence to suggest that no other factors could be involved in explaining the
reduction. In fact, the evidence suggests that it is very likely other factors which
explain property crime generally also explain at least some of the reduction of
burglary in the targeted wards. The evidence presented also suggests that, while the
projects were implemented largely as planned, there is some doubt about whether
the programme as a whole was sufficiently powerful to show a measurable reduction
in burglary at the community level.
On these grounds, we cannot conclude that the programme resulted in a
measurable reduction in burglary. However, this does not mean that the programme
did not contribute to these reductions in a way which was not detected within the
context of the current research design. On balance, the most likely explanation of
the reduction in burglary was a combination of changes in policing and other
economic and social factors which affect crime. However, this conclusion is based
on a balance of probabilities. The most probable explanation is that the programme
did not cause the reduction.
Issues relating to programme multi-agency co-operation
Despite the fact that there is little evidence that the programme reduced burglary,
it is possible that there were other successful outcomes. In the last few weeks of the
programme, all the members of the DBTF and some other key players were
interviewed to obtain their more general evaluations of the programme. The
responses showed that there were a number of beneficial outcomes.
Composition
The multi-agency structure of the DBTF was thought to be one of its strengths. It
was generally thought that the balance of agencies was about right and that the
level of the representatives (described as middle management) was also about right.
The involvement of criminologists in the group was also seen to be an advantage.
It was believed that the agencies were represented by particularly able and
motivated people which was important to the development of the programme.
However, attendance was inevitably variable and the important knowledge and
skills of absent representatives on some occasions were missed.
DISCUSSION
44

Leadership
The issue of leadership was considered very important by all of the respondents.
One common view was that leadership of the group should be attached to the main
representative who was responsible for making sure that things happened. It was
generally agreed that leadership was strongest at the beginning and at the end of
the life of the DBTF when these two roles were closely combined (with a
representative of the local council in the lead in the former and a representative of
the police in the latter). During the middle period, the group lost direction a little
during the transition from one state to the other. The respondents also commented
on the personalities of the leadership and stressed the importance that the person in
this role should be motivated and effective in action
Effectiveness
It was unanimously agreed that the group had achieved a considerable amount and
some thought that it had achieved more than was normal for sub-groups of its kind.
It was felt that the group had achieved its objectives in terms of analysing the
problem of burglary in Cambridge and devising and implementing burglary
prevention strategies. This objective had been achieved regardless of whether or
not burglary declined. It was also widely believed that the group worked together
effectively as a multi-agency group and overcame many of the problems inherent in
multi-agency partnerships. In addition, it was also believed that inter-agency skills
had been developed during the programme which it was felt could be transferred to
future partnerships.
Issues relating to lessons learned
We believe that the DBTF achieved a considerable amount during its two years or
so of operation. It analysed the problems of residential burglary in Cambridge and
implemented 12 burglary prevention projects. In a general sense, it achieved what
it aimed to achieve and did this within the context of a friendly and effective
working relationship of local agencies. However, this does not mean that
everything worked to plan and that no lessons were learned.
One lesson was that co -operation and commitment of member agencies could have
been administered more effectively had the level of expected involvement of
agencies been agreed from the outset. There was no early discussion on who the
‘stakeholders’ were in the partnership or what level or resources each agency would
be expected to commit. While substantial staff resources were allocated to staffing
the DBTF meetings, project resources were harder to secure. It would have been
helpful if some kind of commitment could have been made at both senior and
DISCUSSION
45

middle management levels to the level of resource input that could be expected in
order to enable effective programme planning.
Another important lesson was the key role of leadership in the group. In one sense,
the issue of leadership refers specifically to the need to have one person who can
steer the group and ensure that actions are taken. However, in another sense
leadership refers to the ability of the individual to motivate and empower the group
and to give a positive sense of direction. While the group experienced some
difficulty in relation to leadership and direction in the middle stages of the project,
it was the strength of leadership at the beginning and end of the project which
gave the group its reason for existence and its energy to sustain the long period of
programme implementation.
DISCUSSION
46
References
Anderson, D., Chenery, S. and Pease, K. (1995) Biting Back: Tackling Repeat
Burglary and Car Crime. Crime Detection and Prevention Series, Paper 58. London:
Home Office.
Bennett, T.H. and Wright, R. (1984) Burglars on Burglary: Prevention and the
Offender. Aldershot: Gower.
Brown, B. (1995) Closed Circuit Television in Town Centres: Three Case Studies.
Crime Detection and Prevention Series, Paper 68. London: Home Office.
Chenery, S., Holt, J. and Pease, K. (1997) Biting Back II: Reducing Repeat
Victimisation in Huddersfield. Crime Detection and Prevention Series, Paper 82.
London: Home Office.
Cohen, L.E., and Felson, M. (1979) ‘Social change and crime rate trends: a
routine activity approach’, American Sociological Review, 44. pp. 588-608.
Forrester, D., Chatterton, M. and Pease, K. (1988) The Kirkholt Burglary
Prevention Project, Rochdale. Crime Prevention Unit: Paper 13. London: Home
Office.
Polvi, N., Looman, T., Humphries, C. and Pease, K. (1991) ‘The time course of
repeat burglary victimisation’, British Journal of Criminology, Vol.31, pp. 411-414.
Trickett, A., Osborn, D.K., Seymour, J. and Pease, K. (1992) ‘What is different
about high crime areas?’ British Journal of Criminology , Vol.32, pp. 81-90.
REFERENCES
47

Appendix A
APPENDIX A
48
Figure 10: ‘Hot spots’ of residential burglary: Cambridge City: 1991-1996
Burglary hotspots: 1991
Burglary hotspots: 1993
Burglary hotspots: 1995
Burglary hotspots: 1992
Burglary hotspots: 1994
Burglary hotspots: 1996

49
APPENDIX A
Figure 11: Residential burglary: Cambridge City: 1991-1997
400
300
200
100
01 3 5 7 9 11 13 15 17 19 21 23 25 27 29 31 33 35 37 39 41 43 45 47 49 51 53 55 57 59 61 63 65 67 69 71 73 75 77 79
Month No. (1 = January 1991)
Evaluation periodstart
Programme start
50
RECENT POLICE RESEARCH GROUP AND POLICING AND REDUCINGCRIME UNIT PUBLICATIONS:
Police Research GroupCrime Detection and Prevention Series papers
91. Auditing Crime and Disorder: Guidance for local partnerships.Michael Hough and Nick Tilley. 1998.
92. New Heroin Outbreaks Amongst Young People in England andWales. Howard Parker, Catherine Bury and Roy Eggington. 1998.
Policing and Reducing Crime UnitPolice Research Series papers
93. Brit Pop II: Problem-oriented policing in practice. Adrian Leigh, TimRead and Nick Tilley. 1998.
94. Chid Abuse: Training Investigating Officers. Graham Davies, EmmaMarshall and Noelle Robertson. 1998.
95. Business as Usual: An Evaluation of the Small Business and Crime Initiative. Nick Tilley and Matt Hopkins. 1998.
96. Public Expectations and Perceptions of Policing. Russell Bradley. 1998.
97. Testing Performance Indicators for Local Anti-Drugs Strategies.Mike Chatterton, Matthew Varley and Peter Langmead-Jones. 1998.
98. Opportunity Makes the Thief: Practical theory for crime prevention. Marcus Felson and Ronald V. Clarke. 1998.
99. Sex Offending Against Children: Understanding the risk. Don Grubin. 1998.
100. Policing Domestic Violence: Effective Organisational Structures. Joyce Plotnikoff and Richard Woolfson. 1999.
101. Pulling the Plug on Computer Theft. Paula Whitehead and Paul Gray. 1999.
102. Face Value? Evaluating the Accuracy of Eyewitness Information. Mark R. Kebbell and Graham F. Wagstaff. 1999.
103. Applying Economic Evaluation to Policing Activity. J.E. Stockdale, C.M.E. Whitehead and P.J.Gresham. 1999.
104. Arresting Evidence: Domestic Violence and Repeat Victimisation. Jalna Hanmer, Sue Griffiths and David Jerwood. 1999.
105. Proactive Policing on Merseyside. Alana Barton, Roger Evans. 1999.
106. Tenure: Policy and Practice. Gary Mundy. 1999.
107. Career Progression of Ethnic Minority Police Officers. Nick Bland, Gary Mundy, Jacqueline Russell and Rachel Tuffin. 1999.

Home OfficeResearch, Development and Statistics Directorate