prevalence, risk factors and outcomes of...
TRANSCRIPT

PREVALENCE, RISK FACTORS AND OUTCOMES OF MULTIDRUG RESISTANT TUBERCULOSIS IDENTIFIED BY GENEXPERT MTB/RIF ASSAY IN BUKAVU,
DEMOCRATIC REPUBLIC OF THE CONGO
by
Yifeng Lu
BS, University of Pittsburgh at Johnstown, 2013
Submitted to the Graduate Faculty of
Graduate School of Public Health in partial fulfillment
of the requirements for the degree of
Master of Science
University of Pittsburgh
2016

ii
UNIVERSITY OF PITTSBURGH
Graduate School of Public Health
This thesis was presented
by
Yifeng Lu
It was defended on
April 19, 2016
and approved by
Committee Chair: Kristine M. Ruppert, DrPH, Assistant Professor, Department of Epidemiology, Graduate School of Public Health, University of Pittsburgh
Committee Member: Jean B. Nachega, MD, PhD, MPH, Associate Professor, Department of Epidemiology, and Department of Infectious Diseases and Microbiology, Graduate School of
Public Health, University of Pittsburgh
Committee Member: Jeremy J. Martinson, DPhil, Assistant Professor, Department of Infectious Diseases and Microbiology, Graduate School of Public Health, University of
Pittsburgh

iii
Copyright © by Yifeng Lu
2016

iv
Kristine M. Ruppert, DrPH
PREVALENCE, RISK FACTORS AND OUTCOMES OF MULTIDRUG RESISTANT
TUBERCULOSIS IDENTIFIED BY GENEXPERT MTB/RIF ASSAY IN BUKAVU,
DEMOCRATIC REPUBLIC OF THE CONGO
Yifeng Lu, MS
University of Pittsburgh, 2016
ABSTRACT
Background: Tuberculosis (TB) has been the top-ranked infectious disease in human
history for a very long time. According to World Health Organization (WHO), Democratic
Republic of the Congo (DRC) has been high HIV/TB co-infection burden area for decades.
However, MDR-TB were underreported in DRC due to the incompetent healthcare infrastructure
and the lack of diagnostic method.
Method: This study aims to provide more epidemiological information on the prevalence
of multidrug resistant tuberculosis (MDR-TB) infection identified by GeneXpert MTB/RIF
assay, which is a new diagnostic method. The data were collected at the General Referral
Hospital of Bukavu, DRC. Subject population was the suspected TB patients who visited the
hospital of Bukavu, DRC. Retrospective analyses were done based on those data to identify risk
factors. In addition, multiple statistical analyses, including multivariate logistic regression,
Pearson Chi-square test were performed to investigate how the TB prevalence and treatment
outcomes relate to risk factors and GeneXpert assay.
v
Results: The Prevalence of all TB in the study population is 15.6% as identified by
GeneXpert Assay. MDR-TB prevalence is 3.2% among the whole study population and 20%
among TB positive subgroup. Logistic regression showed that previous TB episode and HIV
known status are risk factors for developing MDR-TB. However, no risk factor for treatment
failure was found in this study.
Conclusions: GeneXpert Assay provided reliable TB and MDR-TB prevalence data in
the resource limited area Bukavu, DRC. We noticed that MDR-TB prevalence from our study is
significantly higher than national level, which suggests severe underestimation of MDR-TB
burden in DRC. However, loss to follow-up of treatment outcome and high proportion of HIV
status unknown are significantly affecting the data validity of this study.
Public Health Significance: The control of MDR-TB in DR Congo requires diagnostic
methods that are not only easy to implement in resource limited area, but also fast in turnaround
time for both TB infection and drug resistance detection. GeneXpert MTB/RIF assay is an ideal
test, but lack of field test. This study provides solid evidence of the performance of GeneXpert
assay in the field as a solution of MDR-TB underreported issue.
vi
TABLE OF CONTENTS
PREFACE ..................................................................................................................................... X
1.0 INTRODUCTION ........................................................................................................ 1
1.1 HISTORY AND GLOBAL BURDEN OF TUBERCULOSIS ........................ 1
1.2 GEOGRAPHIC BACKGROUND ..................................................................... 2
1.3 PATHOGEN BACKGROUND .......................................................................... 5
1.4 HIV-TB COINFECTION ................................................................................... 7
1.5 DIAGNOSTIC TESTS ........................................................................................ 8
1.5.1 Cell Culture Tests ............................................................................................ 8
1.5.2 Sputum Smear Tests ........................................................................................ 9
1.5.3 GeneXpert MTB/RIF Assay ......................................................................... 11
1.6 MANAGEMENT, PREVENTION AND CONTROL OF MDR-TB IN US
AND IN SUB-SAHARAN AFRICA .................................................................................. 13
2.0 SPECIFIC AIMS ........................................................................................................ 18
3.0 METHODS ................................................................................................................. 19
3.1 DATA RESOURCE ........................................................................................... 19
3.2 OUTCOMES ...................................................................................................... 20
3.2.1 Treatment Outcomes ..................................................................................... 20
3.2.2 Death ............................................................................................................... 21
vii
3.3 STATISTICAL ANALYSIS ............................................................................. 21
4.0 RESULTS ................................................................................................................... 23
4.1 BASELINE CHARACTERISTICS ................................................................. 23
4.1.1 TB Prevalence and Baseline Characteristics............................................... 24
4.1.2 HIV Status and HAART ............................................................................... 26
4.2 LOGISTIC REGRESSION ANALYSES FOR MDR-TB RISK FACTORS ..
............................................................................................................................. 27
4.3 TREATMENT OUTCOMES AND MORTALITY RATE ........................... 29
5.0 DISCUSSION ............................................................................................................. 31
5.1 TB AND MDR-TB PREVALENCE................................................................. 31
5.2 MDR-TB RISK FACTORS .............................................................................. 33
5.3 TREATMENT OUTCOMES ........................................................................... 35
5.4 STRENGTH AND LIMITATION ................................................................... 36
6.0 PUBLIC HEALTH SIGNIFICANCE ...................................................................... 38
APPENDIX: NO HUMAN SUBJECTS DETERMINATION LETTER .............................. 39
BIBLIOGRAPHY ....................................................................................................................... 41
viii
LIST OF TABLES
Table 1. First line drugs for TB treatment. ................................................................................... 13
Table 2. Common Second line drugs for TB treatment. ............................................................... 14
Table 3. Baseline Characteristics for overall Bukavu suspected TB sample and by TB groups. . 23
Table 4. Baseline Characteristics for TB Positive Sub-population............................................... 24
Table 5. HAART (Highly Active Antiretroviral Therapy) status in HIV positive patients. ........ 24
Table 6. Treatment And Mortality for overall Bukavu suspected TB sample and by TB groups. 29
Table 7. Univariate Logistic Regression Models for identifying risk factors............................... 30
ix
LIST OF FIGURES
Figure 1. The map of Democratic Republic of the Congo. ............................................................. 4
Figure 2. GeneXpert MTB/RIF Assay Procedure......................................................................... 12
Figure 3. Odds Ratio for HIV status (HIVstatus) and Previous TB Episode Number
(TB_Episodnumber) after adjusting for age and sex. ................................................................... 27
Figure 4. MDR-TB prevalence in Bukavu and Democratic Republic of the Congo in 2012. ...... 31
Figure 5. Treatment Outcomes in Bukavu Sample by Drug-susceptible TB and MDR-TB
Groups. .......................................................................................................................................... 35
x
PREFACE
I am very grateful for the help from so many people during my time at Graduate School
of Public Health. First of all, I would like to thank the faculty of Graduate School of Public
Health’s Department of Epidemiology. Your knowledge, wisdom and enthusiasm make my time
at Graduate School of Public Health become an unforgettable experience in my life, and this
experience always inspires me to do my best in my professional journey. I especially want to
thank Dr. Jean Nachega for the guidance on my thesis and mentorship throughout this process.
And I am also very grateful for getting the Bukavu TB dataset from Dr. Nachega through his
connection with Bukavu researchers. Additionally, I would like to thank Dr. Kristine Ruppert for
the valuable suggestions on my statistical analyses and the excellent work on organizing the
committee. And I would like to thank Dr. Jeremy Martinson for the insightful comments on my
thesis, which help me a lot in revising this thesis.
1
1.0 INTRODUCTION
1.1 HISTORY AND GLOBAL BURDEN OF TUBERCULOSIS
Tuberculosis (TB) is a well-known infectious disease which has been a major health
burden in human history and still is a major leading cause of death in developing countries[1].
The oldest descriptions of TB can be found in documents that were written more than 5000 years
ago in Egypt, and the discovery of the DNA of Mycobacterium tuberculosis (the pathogen of
TB) in Egyptian mummies supports those descriptions[2]. Due to lack of effective prevention
and treatment methods against TB, this disease had been widely spread throughout Europe
during the Middle Ages. Even though not many infectious diseases could be controlled at that
time, TB was still an outstanding one and earned the name “White Plague” because its reputation
was as terrifying as “Black Plague” [2]. Although the discovery of anti-tuberculosis drugs started
back in 1942 once showed promising effectiveness on TB control, the rapid growth of drug
resistant TB strains and slow development on new antibiotics in recent decades have both
contributed to the persistence of TB epidemics in developing countries and the reemerging of TB
in developed countries[3].
According to World Health Organization (WHO) annual TB report, there were estimated
9.6 million people infected with TB and 1.5 million died in 2014, and most of the cases were
detected in developing countries and areas[4]. In addition, the Human Immunodeficiency Virus
2
(HIV) pandemic has enlarged both scale and severity of TB epidemics, especially in sub-Sahara
Africa[5]. The Democratic Republic of the Congo (DRC) is one of the Sub-Sahara African
countries that are heavily affected by both TB and HIV epidemics[6]. It has been named in all
three high burden countries list (TB/HIV list, TB list, and MDR-TB list) by WHO in the Global
Tuberculosis Report 2015[1]. As one of the 22 high burden countries of TB disease, DRC
notified 116,894 new cases of all kinds of TB patients in 2014 and among the new cases about
2.2% were infected with multidrug-resistant TB (MDR-TB) strains[1]. Thus, evaluating the
management of TB, especially MDR-TB among HIV co-infected patients, at DRC could provide
meaningful insight not only for regional TB control, but also for the global TB control. By
applying epidemiological methods, this study provided deeper understanding of MDR-TB
burden and treatment outcomes in DRC.
1.2 GEOGRAPHIC BACKGROUND
The Democratic Republic of the Congo, also known as DR Congo or DRC, is the largest
country in sub-Saharan Africa by area. DRC is located in central Africa and borders the Republic
of Congo, the Central African Republic, South Sudan, Uganda, Rwanda, Burundi, Tanzania,
Zambia and Angola. The total population in DRC is about 79 million, which is the fourth most
populated country in Africa. Although DRC has rich natural resources especially mineral
resource, the basic infrastructure is poorly developed due to political instability, civil wars, and
other problems. After 1960, DR Congo suffered a severely unstable transition from a colony of
Belgium to an independent country. 5 years after Independence, Joseph Mobutu renamed DR
Congo as Zaire and started his 32 years dictatorship[7]. Infrastructure was underdeveloped due to

3
the corrupt government led by Mobutu, and basic health care system collapsed in some areas
because of anti-Mobutu rebellion. In 1999, 2 years after Mobutu escaped from DR Congo, a war
involving several neighboring countries broke out, which was also called “Africa’s first world
war” and millions of people were killed during the war. Although Lusaka peace accord was
signed by warring countries, regional conflicts still occurred from time to time especially in the
east provinces including South Kivu province. The most recent events in east DR Congo are the
M23 rebellion from 2012 to 2013, and the clash between Congolese and Rwandan troops in
2014[7].

4
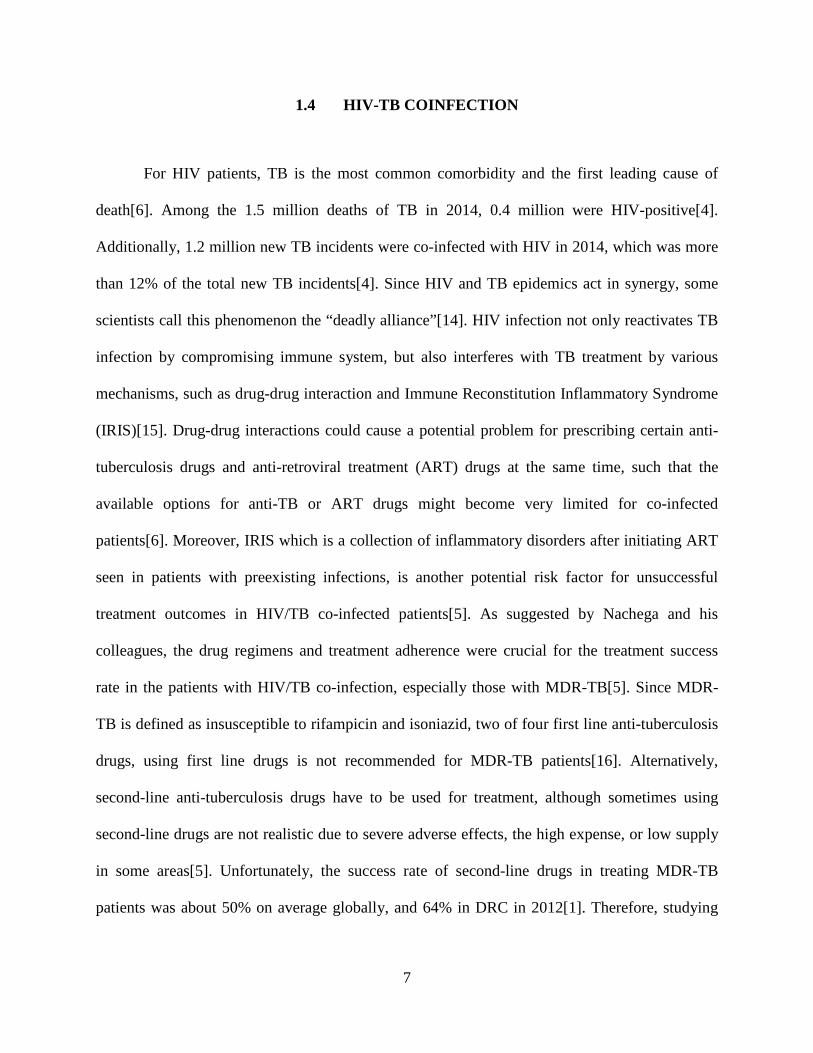
Figure 1. The map of Democratic Republic of the Congo. Source: http://www.ezilon.com/maps/africa/d-r-of-congo-maps.html
Bukavu is a city located at the east part of DRC and is the capital of South Kivu province,
with a population of about 806,940. The total area of Bukavu is 60 km2, one of the four major
cities in DRC. In addition, Bukavu is the hub of health services in South Kivu province. Panzi

5
Hospital is one of biggest hospitals in Bukavu, and is famous because of its great contribution in
hospitalizing victims of sexual violation during wars and conflicts. What’s more, Dr. Wukwege,
the director of Panzi hospital, has been nominated for Nobel Peace Prize for his remarkable work
of helping victims of sexual violation[8]. Bukavu also has a medical school in the Catholic
University of Bukavu to ensure continuous training of physicians and further development of
health service in that area.
1.3 PATHOGEN BACKGROUND
The pathogen of Tuberculosis, Mycobacterium tuberculosis (M. tuberculosis), is a rod-
shaped bacterium which was thought to be an obligate aerobe originally by microbiologists.
However, some studies indicated that M. tuberculosis might become microaerophilic during the
late stages of infection[9]. As a intracellular pathogen only has human reservoir[9], M.
tuberculosis has developed several unique structures to adjust for human body internal
environment and to evade immune responses.
The first example is the envelope of M. tuberculosis, which is composed of a high lipid
proportion cell wall and an outer-membrane containing mycolic acids[10]. The high lipid
proportion cell wall makes M. tuberculosis impervious to Gram staining, the most common
method for bacterial staining, therefore the acid-fast stain is the preferred staining method for
identifying M. tuberculosis[11]. In addition, the high lipid content in the cell wall provides M.
tuberculosis the ability to persist in host cells by preventing attacks from oxygen radicals in
phagolysosomes[10]. In extracellular environment, the envelope of M. tuberculosis can also
protect this bacterium from the activation of complement system in serum[10].

6
Secondly, M. tuberculosis can evade the host’s innate immune response in several
different ways. Since the macrophage is the primary host cell for M. tuberculosis and a major
phagocytic cell in the innate immune response, M. tuberculosis has to evolve evading
mechanisms in order to stay and replicate in macrophages safely. One of the mechanism is to
synthesize specific molecules to interfere the fusion between lysosomes and phagosomes, for
example mannosylated lipoarabinomannan in the cell wall inhibits the process of Calcium
increase in cytosol which is important for lysosome-phagosome fusion[12]. Such a mechanism
means that lysozymes and other bacteria killing molecules cannot reach the pathogen, M.
tuberculosis, residing in the phagosome, and therefore the pathogen cannot be destroyed.
Another mechanism to evade innate immune response is that M. tuberculosis postpones
apoptosis in the infected macrophages[13]. Usually macrophages will undergo apoptosis after
they phagocytize too many pathogens, such that pathogens will be restrained in several small
apoptotic bodies and other phagocytes will come to clean those apoptotic bodies. Hence, the
pathogens contained inside macrophages cannot escape from dead macrophages[13]. Postponing
apoptosis allows M. tuberculosis to have sufficient time for replication inside the host cell, and
that’s critical for M. tuberculosis survival because of its slow replication process[11]. Moreover,
altering the apoptosis pathway to the necrosis pathway ensures a successful release of M.
tuberculosis from the host cell[13].
Due to the unique features mentioned above, M. tuberculosis is hard to be completely
eliminated by the host body alone even though its activities can be suppressed when the host is in
a healthy status. Hence, the success of TB epidemic control largely depends on the success rate
of anti-TB treatments and early detection.
7
1.4 HIV-TB COINFECTION
For HIV patients, TB is the most common comorbidity and the first leading cause of
death[6]. Among the 1.5 million deaths of TB in 2014, 0.4 million were HIV-positive[4].
Additionally, 1.2 million new TB incidents were co-infected with HIV in 2014, which was more
than 12% of the total new TB incidents[4]. Since HIV and TB epidemics act in synergy, some
scientists call this phenomenon the “deadly alliance”[14]. HIV infection not only reactivates TB
infection by compromising immune system, but also interferes with TB treatment by various
mechanisms, such as drug-drug interaction and Immune Reconstitution Inflammatory Syndrome
(IRIS)[15]. Drug-drug interactions could cause a potential problem for prescribing certain anti-
tuberculosis drugs and anti-retroviral treatment (ART) drugs at the same time, such that the
available options for anti-TB or ART drugs might become very limited for co-infected
patients[6]. Moreover, IRIS which is a collection of inflammatory disorders after initiating ART
seen in patients with preexisting infections, is another potential risk factor for unsuccessful
treatment outcomes in HIV/TB co-infected patients[5]. As suggested by Nachega and his
colleagues, the drug regimens and treatment adherence were crucial for the treatment success
rate in the patients with HIV/TB co-infection, especially those with MDR-TB[5]. Since MDR-
TB is defined as insusceptible to rifampicin and isoniazid, two of four first line anti-tuberculosis
drugs, using first line drugs is not recommended for MDR-TB patients[16]. Alternatively,
second-line anti-tuberculosis drugs have to be used for treatment, although sometimes using
second-line drugs are not realistic due to severe adverse effects, the high expense, or low supply
in some areas[5]. Unfortunately, the success rate of second-line drugs in treating MDR-TB
patients was about 50% on average globally, and 64% in DRC in 2012[1]. Therefore, studying

8
the factors that affect the treatment success rate in MDR-TB/HIV patients in source-limited areas
is crucial for future TB management as HIV era continues.
1.5 DIAGNOSTIC TESTS
1.5.1 Cell Culture Tests
Cell culture is one of the oldest TB diagnostic tests and had been used as the only gold
standard for decades before new reliable molecular diagnostic techniques were available. To
perform a culture test, a sample of phlegm will be collected from the suspected patient and firstly
treated with NaOH in order to kill other contaminating bacteria. Since M. tuberculosis has high
lipid content envelope, treating with NaOH will not kill TB pathogen but will kill other bacteria.
Then the sputum sample can be cultured on specific media for between 9 days and 6 weeks,
depending on the methods[11].
Cell culture techniques include two major categories: solid-media based and liquid-media
based. Lowenstein-Jensen (LJ) media is one of the most widely used commercially available
solid-media for M. tuberculosis cell culture test, but this requires an average 3-6 weeks for
isolation and 1-2 weeks for speciation[17]. Due to its high specificity and sensitivity, LJ cell
culture is the gold standard for TB diagnosis. Also, due to the growth of pathogen in the culture,
additional drug resistance tests can be done by adding TB drugs in the LJ media and inoculate
isolated M. tuberculosis on LJ + drug media. However, a solid-based culture cannot fulfill the
need of quick feedback in MDR-TB diagnosis because of its prolonged turnaround and culture
facility requirement.
9
Compared to a solid-based media culture, liquid based culture techniques have a
significant advantage on diagnostic turnaround time because M. tuberculosis grows faster in
liquid media. For example, the BACTEC960 Mycobacterium Growth Indicator Tube (MGIT)
system developed by Becton, Dickinson and Company (US) is an automated liquid-based rapid
TB culture diagnostic system that can diagnosis sputum positive result in 7 days[18].
BACTEC960 MGIT is an unbreakable plastic tube which contains rich liquid media for M.
tuberculosis to grow and has chemicals for fluorimetric detection of bacterial oxygen
consumption, and its result can be read manually or by automated systems[19]. However, since
liquid-based media are more prone to contamination, using liquid-based media like BACTEC
requires highly trained technicians. Moreover, the automated reading machine and culture
facility for liquid-based culture are too expensive for resource-limited countries.
TB culture is also widely used for various drug susceptibility tests (DST). To perform
DST by using culture method, an antituberculosis drug will be mixed with TB culture media in a
certain concentration and isolated TB bacilli will be inoculated to this combined media[20]. If
the TB bacilli isolated from a sample can grow on the combined media, it is very likely to be
insusceptible to this specific antituberculosis drug. DST will take additional 3 to 6 weeks after
culture isolation, which is too slow to provide meaningful information to clinicians[18].
1.5.2 Sputum Smear Tests
The sputum smear test is a much faster and easier test for identifying TB infection
compared to the culture tests, because it uses an acid-fast staining technique to stain M.
tuberculosis in sputum smears, and just needs several hours and a microscope to examine the
result[11]. The Ziehl-Nelsen (ZN) microscopy test is the most widely used diagnostic method,

10
especially in resource-limited countries, because of its ease of operation, fast turnaround time
and low requirement of facilities[21]. The procedure for this test is to use Ziehl-Nelsen staining
to mark mycobacteria in a sputum smear slide and observe the result under 100X light or bright
field microscope[22]. However, this test has a relatively low sensitivity specificity (68%
sensitivity, 98% specificity in non-HIV patients, and 49%~67% sensitivity, 97% specificity in
HIV patients[23]) because stained TB bacteria could be hard to see under the circumstance that
the technician is tired or the number of bacteria is low in the smear slide. Although the
specificity of the ZN microscopy test can reach 98%, false positive results can still be a problem
since acid-fast staining bacteria also include other mycobacteria besides M. tuberculosis. In
addition, the smear test cannot test drug resistance due to the nature of staining.
Compared to traditional ZN microscopy, fluorescence microcopy (FM) provides about
10% higher sensitivity results[23] and requires only 25% ZN microscopy time[24]. According to
a meta-analysis[23], the TB test sensitivity of fluorescence microscopy among HIV patients was
lower than the result in non-HIV patients, but fluorescence microscopy is still about 10% higher
than ZN microscopy used in the same situation. Another study indicated that fluorescence
microscopy would have lower specificity (FM 81% vs ZN 96%) for HIV patients[21]. To
preform fluorescent microscopy tests, Auramine O staining need to be used and a fluorescence
microscope is required[25]. Since 2009, the LED microscope has been recommended to replace
conventional fluorescence microscope by WHO, because LED microscope is relatively less
expensive than conventional microscope, and LED has a much longer life time and low power
need (can work with battery)[24].
11
1.5.3 GeneXpert MTB/RIF Assay
The GeneXpert MTB/RIF assay is a relatively newly developed molecular test for MDR-
TB diagnosis. This assay was recommended as a major milestone for global TB diagnosis and
care by WHO in December 2010[26]. Depending on polymerase chain reaction technique,
GeneXpert MTB/RIF assay can detect both M. tuberculosis specific genome and rifampin
specific drug resistance gene (rpoB) in the sputum sample from a MDR-TB patient within 90
minutes[27]. Also, this assay provides very high specificity (identified 99.2% people without TB
infection from all non-infected people) and sensitivity (97.6% for rifampin-resistant TB and
98.1% for rifampin-sensitive TB) for both TB and MDR-TB diagnosis[27]. According to WHO,
there were 39 sites in DRC performing GeneXpert MTB/RIF assay in 2015[1].
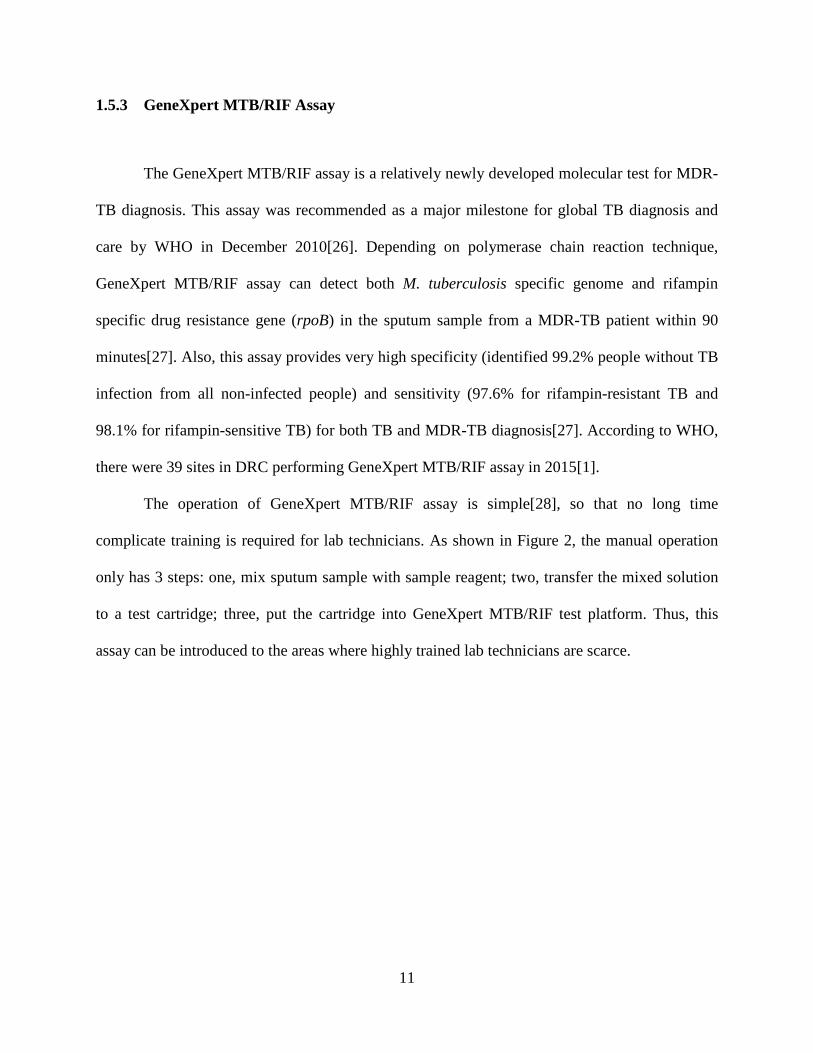
The operation of GeneXpert MTB/RIF assay is simple[28], so that no long time
complicate training is required for lab technicians. As shown in Figure 2, the manual operation
only has 3 steps: one, mix sputum sample with sample reagent; two, transfer the mixed solution
to a test cartridge; three, put the cartridge into GeneXpert MTB/RIF test platform. Thus, this
assay can be introduced to the areas where highly trained lab technicians are scarce.

12
Figure 2. GeneXpert MTB/RIF Assay Procedure. Source: Boehme, et al. Rapid Molecular Detection of Tuberculosis and Rifampin Resistance. N Engl J Med 2010.[27]
One of the disadvantages of the GeneXpert MTB/RIF assay is the high cost of
the GeneXpert station and its cartridges, which can reach US$98.10 per person[29].
However, thanks to the agreement hold by Foundation of Innovative New Diagnosis
(FIND), USAID, UNITAID, and Bill & Melinda Gates Foundation with Cepheid (the producer
of GeneXpert), the price of each cartridge has been reduced to US$9.98 for eligible FIND list
countries (including DRC) since August 6th, 2012[30]. Another disadvantage of the GeneXpert
is the need of a stable electric supply due to the continuousness of nucleic acid amplification
tests. In resource-limited countries, stable electric supply could be a problem in some areas.
To overcome this barrier, international grants and local governments work together to ensure
GeneXpert labs have stable
13
electric supply. TB REACH is one of the international programs promoting GeneXpert
implementation, and one review article of this program mentioned a suggestion that a standard
800-2000VA inverter and a 12 V/120-200 AH battery which can be procured locally can support
a GeneXpert system for 6 hours[31]. Therefore, the GeneXpert assay can still be implemented in
areas where electric supply is not very stable as long as an alternative electric supply is available.
1.6 MANAGEMENT, PREVENTION AND CONTROL OF MDR-TB IN US AND IN
SUB-SAHARAN AFRICA
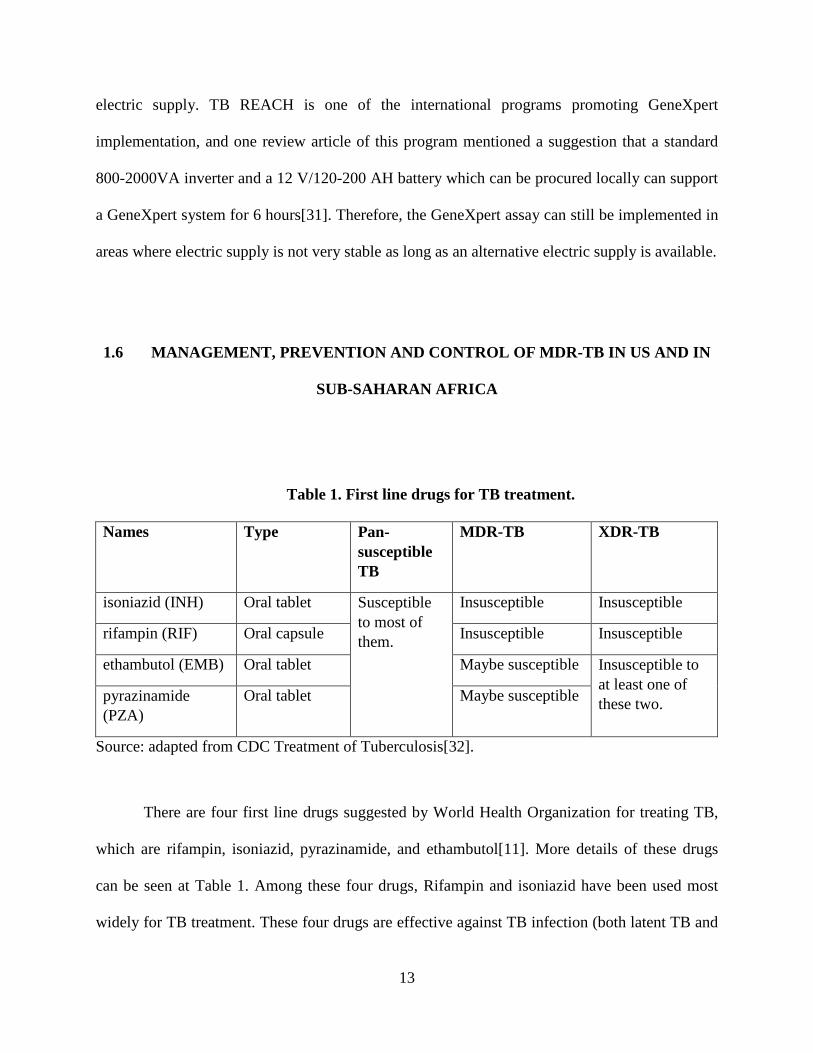
Table 1. First line drugs for TB treatment.
Names Type Pan-susceptible TB
MDR-TB XDR-TB
isoniazid (INH) Oral tablet Susceptible to most of them.
Insusceptible Insusceptible
rifampin (RIF) Oral capsule Insusceptible Insusceptible
ethambutol (EMB) Oral tablet Maybe susceptible Insusceptible to at least one of these two. pyrazinamide
(PZA) Oral tablet Maybe susceptible
Source: adapted from CDC Treatment of Tuberculosis[32].
There are four first line drugs suggested by World Health Organization for treating TB,
which are rifampin, isoniazid, pyrazinamide, and ethambutol[11]. More details of these drugs
can be seen at Table 1. Among these four drugs, Rifampin and isoniazid have been used most
widely for TB treatment. These four drugs are effective against TB infection (both latent TB and
14
active TB) if patients follow their physicians’ prescription, although adverse effects may occur at
some cases[5]. In the United States, the drug-susceptible TB treatments usually takes 6 to 9
months, and can be divided into initial phase (2 months) and continue phase (4 to 7 months)
according to CDC suggestion[33]. Since these first line drugs have been used for more than 4
decades (rifampin was introduced to clinical use in 1968[34]), multi-drug resistant TB, which is
defined as insusceptible to rifampin and isoniazid, is very likely to be insusceptible to other first
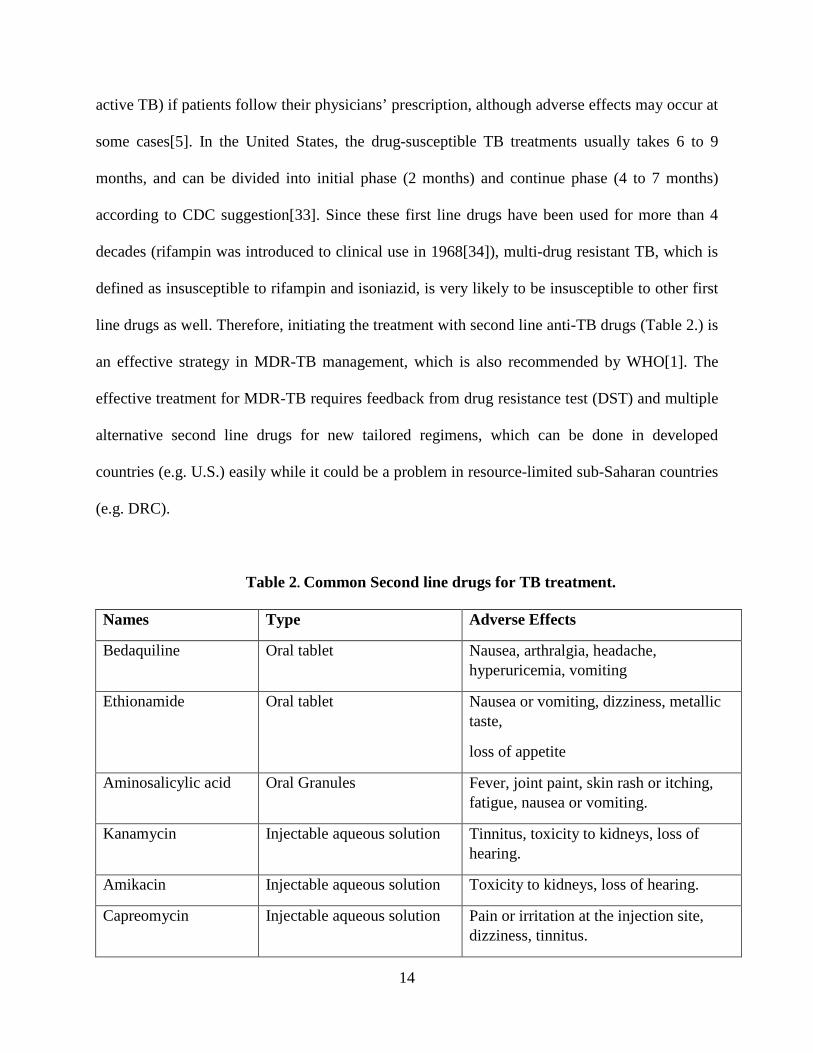
line drugs as well. Therefore, initiating the treatment with second line anti-TB drugs (Table 2.) is
an effective strategy in MDR-TB management, which is also recommended by WHO[1]. The
effective treatment for MDR-TB requires feedback from drug resistance test (DST) and multiple
alternative second line drugs for new tailored regimens, which can be done in developed
countries (e.g. U.S.) easily while it could be a problem in resource-limited sub-Saharan countries
(e.g. DRC).
Table 2. Common Second line drugs for TB treatment.
Names Type Adverse Effects
Bedaquiline Oral tablet Nausea, arthralgia, headache, hyperuricemia, vomiting
Ethionamide Oral tablet Nausea or vomiting, dizziness, metallic taste,
loss of appetite
Aminosalicylic acid Oral Granules Fever, joint paint, skin rash or itching, fatigue, nausea or vomiting.
Kanamycin Injectable aqueous solution Tinnitus, toxicity to kidneys, loss of hearing.
Amikacin Injectable aqueous solution Toxicity to kidneys, loss of hearing.
Capreomycin Injectable aqueous solution Pain or irritation at the injection site, dizziness, tinnitus.
15
Source: adapted from CDC Treatment of Tuberculosis[32] and Guidelines for Bedaquiline for the Treatment of Multidrug-Resistant Tuberculosis[35]
In the U.S., CDC guidelines for MDR-TB treatment suggested the patients should be
referred to specialized treatment centers for direct observation of therapy (DOT), and close
consultation and monitoring from experts[32]. Also, this guideline suggested that the MDR-TB
treatment should be initiated with an empirical regimen of at least 6 drugs (other than isoniazid
and rifampin) and later changed to a tailored regimen when DST result gets back to the
clinicians[32]. Since the treatment of MDR-TB is complicated, the duration of its treatment is
longer than the normal TB treatment, which can last for 20 to 27 months while the normal
treatment usually lasts for 6 to 9 months [36]. In the U.S., the cured outcome of MDR-TB
treatment is based on both the number of total doses taken and culture conversion (negative
culture results for 5 consecutive specimens in final 12 months of treatment), while drug-
susceptible TB treatment completion mainly bases on the number of total doses taken and X-ray
results[32]. With sufficient resources and high coverage public health infrastructure, MDR-TB
treatment completion rate is still not very high in the U.S. due to the complication of MDR-TB
management. One study based on 2005-2007 reported case data in California, Texas and New
York, NY which showed that MDR-TB treatment completion rates reached 78% while 11% were
transferred within or outside the U.S., and 9% death occurred during treatment[36]. Among those
patients treated with second line drugs, several adverse effects were observed, including hearing
impairment (13%), hepatitis (13%), renal impairment (11%), difficulty ambulating (8%), visual
impairment (7%), and seizures (1%)[36]. HIV co-infected MDR-TB patients had much lower
treatment completion rate due to the synergism between HIV and MDR-TB. According to one
16
meta-analysis review, MDR-TB treatment success rate only reached 12.19% in 2000 in the
U.S.[16], although the ineffective anti-retroviral treatment might be one of the reasons.
In contrast to developed countries like the U.S., sub-Saharan countries have been high
burden MDR-TB areas for many years and even worse in the HIV pandemic era[37]. Due to the
limitations on both human and material resources, the diagnosis of MDR-TB was depended on
referral and national level laboratories which were scarce in sub-Saharan countries and only
provided 15% patient coverage[22]. Thus, it was difficult for healthcare professionals to find out
every MDR-TB case in sub-Saharan countries and many of them were treated as normal TB at
the beginning. Treating MDR-TB as normal TB not only has little effect on positive treatment
outcome, but also provides more chance for MDR-TB transmission[5]. To prevent the
transmission of TB in sub-Saharan area, WHO has been introducing directly observed treatment,
short course (DOTS) for all TB patients in this area, implemented by the Stop TB partnership
and other international TB programs since 1995[1]. And this strategy is also essential for MDR-
TB management in sub-Saharan area, because DOTS ensures treatment adherence for both
normal TB and MDR-TB patients. As long as patients follow the prescription, the probability of
primary transmission of MDR-TB will be limited and there would be fewer secondary MDR-TB
transmission (patient developing MDR-TB from mono-resistant TB due to lack of treatment
adherence). MDR-TB regimens in sub-Saharan Africa are based on second line anti-TB drugs
and initiated with empirical regimens first due to the delay of DST feedback[38]. At the
empirical regimens, at least four second line drugs should be included and drug-drug interaction
with ART should be considered because most MDR-TB patients in sub-Saharan area are HIV co-
infected[5]. When the DST result is available, individualized regimens can be made for the
patients, although the availability of second line drugs might limit the options for making
17
individualized regimens[5]. The treatment success rate of MDR-TB in Africa was 47% in a 2012
cohort[1], and the HIV positive patients had a lower success rate. One study conducted in South
Africa showed that the treatment success rate among HIV positive patients was about 9% lower
than HIV negative patients (40% vs 49%)[39]. Despite many barriers for sub-Saharan countries
to control MDR-TB infection, the trend of MDR-TB incidence is declining among majority of
sub-Saharan countries in recent years[1].
MDR-TB prevention depends heavily on the adherence of TB treatment and precaution
of nosocomial infection. As mentioned above, adherence of TB treatment reduces the incidence
of MDR-TB for both primary and secondary transmission. On the other hand, preventing
nosocomial infection can block a major pathway for primary MDR-TB transmission. According
to a study conducted in South African public hospitals, potential TB cases were more than
expected and MDR-TB was observed commonly among active TB patients (one in six)[40].
Therefore, providing training to health care workers and distributing personal protective devices
(PPD), disposable facial mask, in health service facilities can help to prevent MDR-TB infection.

18
2.0 SPECIFIC AIMS
We hypothesize a relatively high prevalence of MDR-TB in patients with previously or
recurrent TB as well as suboptimal outcomes, especially in patients with HIV co-infection.
Therefore, we developed the following specific aims from our hypothesis:
Aim 1. To assess the prevalence of MDR-TB patients as identified by GeneXpert in Bukavu,
DRC.
Aim 2. To assess risk factors of MDR-TB patients as identified by GeneXpert in Bukavu, DRC.
Aim 3. To assess treatment outcomes (e.g. cure, death, lost-to-follow-up), both overall and by
HIV status in TB and MDR-TB patients as identified by GeneXpert in Bukavu, DRC.
19
3.0 METHODS
This study involved existing data collected at the Provincial General Hospital of Bukavu.
Secondary analysis was done based on these data by the primary investigator. Data details and
analysis plan are described in the following sections. Since no private information was recorded
in this dataset, and the primary investigator and thesis mentor were not involved in the data
collection, a “No Human Subject Determination” was obtained from University of Pittsburgh
Internal Review Broad (appendix A) for this study.
3.1 DATA RESOURCE
The records of suspected TB cases were collected by a multi-disciplinary staff at the
Provincial General Hospital of Bukavu as a part of the WHO supported GeneXpert MTB/RIF
assay programmatic implementation project in Democratic Republic of the Congo. The multi-
disciplinary staff included clinicians and laboratory scientists. The original purpose of
establishing this database was for TB active-case finding and laboratory technician training. To
be included in the database, people with suspected TB were recruited and investigated clinically
(symptom/signs of TB, physical examination and Chest X-Ray) as well as bacteriologically
(Acid-Fast Bacilli sputum smear test) before GeneXpert MTB/RIF evaluation. The information

20
was recorded without any personal identifiers or linkage code by the staff; sequential ID numbers
were assigned to each subject at the creation of this database.
The time frame for the data used in this study is from February through December in
2012, and in total 410 cases were included. The majority of information was collected at the
screening session, while outcomes such as treatment outcome and vital status were collected
during the following period.
Sputum samples were collected from all suspected people. The sputum smear light
microscope test was performed before the GeneXpert assay, and then the remaining sputum
samples would be used for the GeneXpert assay. However, Drug Susceptibility Testing and
conventional TB culture facilities were not available in this setting, so no bacteriological
confirmation could be done to verify GeneXpert assay results. HIV status categories (positive,
negative or unknown) and Highly Active Retroviral Treatment (HAART) status (on HAART,
not on HAART, unknown) were documented for all of the TB suspected people.
3.2 OUTCOMES
3.2.1 Treatment Outcomes
WHO defined the success outcome of TB treatment as “treatment completed as
recommended by the national policy without evidence of failure AND three or more consecutive
cultures taken at least 30 days apart are negative after the intensive phase”[41]. However, due to
the lack of available TB culture laboratories in the Bukavu area, the sputum smear test was used
for verifying TB treatment outcome as an alternative. If the sputum smear test was still positive

21
at the end of the planned treatment, this treatment would be defined as “failure”. The treatment
success rate of MDR-TB is defined as the proportion of successfully treated patients among
MDR-TB patients.
Treatment outcomes were collected afterwards. And if no information could be obtained,
they were defined as “loss to follow-up”.
3.2.2 Death
Since Bukavu lacks a competent health service network and sufficient health care
workers, it is hard to obtain vital statistics for all participants in this study population. Death
records were sought after the screening session and the vital status was categorized as
“unknown” if no available information could be found.
3.3 STATISTICAL ANALYSIS
For these baseline characteristics, Student-t test was performed by comparing the mean of
normally distributed numerical variables between drug-susceptible TB and MDR-TB groups.
Not normally distributed variables were compared by Wilcoxon Rank Sum test instead. In
addition, categorical variables were compared via Pearson chi-square test or Fisher’s exact test
depending on whether one of the cells has less than 5 expected counts in the variable table.
To assess risk factors of MDR-TB patients as identified by GeneXpert in Bukavu as
stated at Aim 2, Pearson chi-square test or Fisher’s exact test was used for screening potential
risk factors of MDR-TB by testing the associations between categorical variables, for example
22
sex, and TB groups. Associations between HIV status and MDR-TB infection were evaluated as
well. Logistic regression was performed to identify independent risk factors of MDR-TB
infection by reporting their relevant Odds Ratio and 95% confidence interval after adjusting for
other covariates such as HIV status, HAART stage, previous TB infection episodes, age, and
gender. Backward selection with p<0.20 staying criterion was used for building the best fit
prediction model, because a statistical study recommended p<0.15 as a good inclusion
criterion[42] and the small sample size in this study requires a larger staying p-value for
including all significant covariates.
To assess treatment outcomes in TB patients, treatment success rate was calculated as the
success event proportion in the treated population. Pearson chi-square test or Fisher’s exact test
was used for the comparison of the treatment success rate across drug-susceptible TB and MDR-
TB groups, national level and Bukavu level, depending on suitable conditions. Backward
selection logistic regression with 0.20 staying significant level was also used to identify risk
factors of treatment failure. Odds Ratio and 95% confidence interval were reported for risk
factors after adjusting for covariates.
All statistical analyses were performed via SAS 9.3 (SAS Institute, Cary, NC, USA) and
Stata SE 13.1 (StataCorp LP, TX, USA) while data were stored and managed in Microsoft Excel
2013.
23
4.0 RESULTS
4.1 BASELINE CHARACTERISTICS
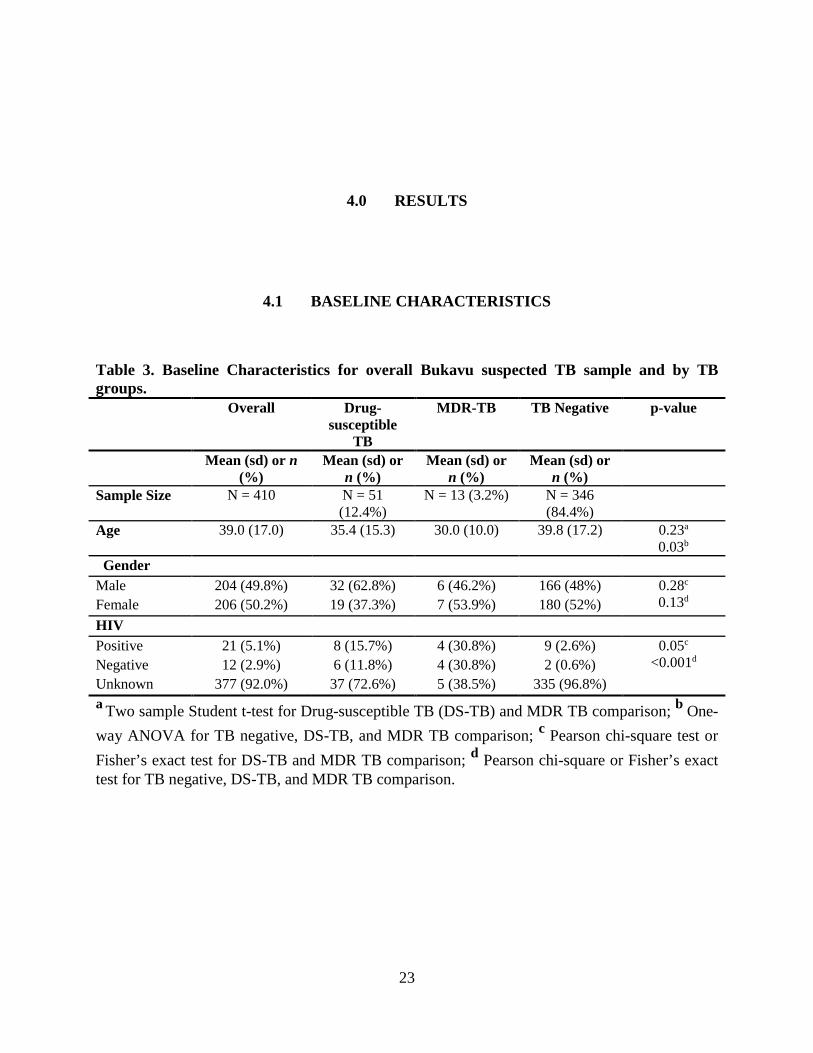
Table 3. Baseline Characteristics for overall Bukavu suspected TB sample and by TB groups. Overall Drug-
susceptible TB
MDR-TB TB Negative p-value
Mean (sd) or n (%)
Mean (sd) or n (%)
Mean (sd) or n (%)
Mean (sd) or n (%)
Sample Size N = 410 N = 51 (12.4%)
N = 13 (3.2%) N = 346 (84.4%)
Age 39.0 (17.0) 35.4 (15.3) 30.0 (10.0) 39.8 (17.2) 0.23a
0.03b
Gender Male 204 (49.8%) 32 (62.8%) 6 (46.2%) 166 (48%) 0.28c
0.13d Female 206 (50.2%) 19 (37.3%) 7 (53.9%) 180 (52%) HIV Positive 21 (5.1%) 8 (15.7%) 4 (30.8%) 9 (2.6%) 0.05c
<0.001d Negative 12 (2.9%) 6 (11.8%) 4 (30.8%) 2 (0.6%) Unknown 377 (92.0%) 37 (72.6%) 5 (38.5%) 335 (96.8%) a Two sample Student t-test for Drug-susceptible TB (DS-TB) and MDR TB comparison; b One-way ANOVA for TB negative, DS-TB, and MDR TB comparison; c Pearson chi-square test or Fisher’s exact test for DS-TB and MDR TB comparison; d Pearson chi-square or Fisher’s exact test for TB negative, DS-TB, and MDR TB comparison.
24
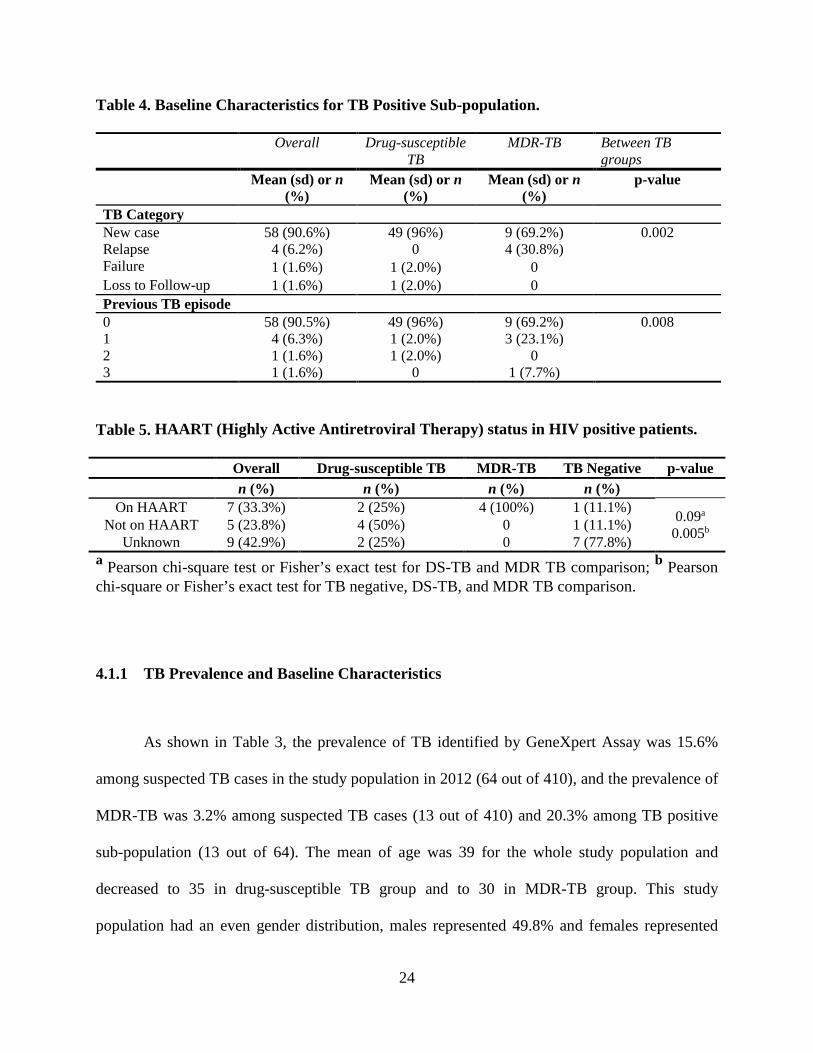
Table 4. Baseline Characteristics for TB Positive Sub-population.
Overall Drug-susceptible TB
MDR-TB Between TB groups
Mean (sd) or n (%)
Mean (sd) or n (%)
Mean (sd) or n (%)
p-value
TB Category New case 58 (90.6%) 49 (96%) 9 (69.2%) 0.002 Relapse 4 (6.2%) 0 4 (30.8%) Failure 1 (1.6%) 1 (2.0%) 0 Loss to Follow-up 1 (1.6%) 1 (2.0%) 0 Previous TB episode 0 58 (90.5%) 49 (96%) 9 (69.2%) 0.008
1 4 (6.3%) 1 (2.0%) 3 (23.1%) 2 1 (1.6%) 1 (2.0%) 0 3 1 (1.6%) 0 1 (7.7%)
Table 5. HAART (Highly Active Antiretroviral Therapy) status in HIV positive patients.
Overall Drug-susceptible TB MDR-TB TB Negative p-value n (%) n (%) n (%) n (%)
On HAART 7 (33.3%) 2 (25%) 4 (100%) 1 (11.1%) 0.09a
0.005b Not on HAART 5 (23.8%) 4 (50%) 0 1 (11.1%) Unknown 9 (42.9%) 2 (25%) 0 7 (77.8%)
a Pearson chi-square test or Fisher’s exact test for DS-TB and MDR TB comparison; b Pearson chi-square or Fisher’s exact test for TB negative, DS-TB, and MDR TB comparison.
4.1.1 TB Prevalence and Baseline Characteristics
As shown in Table 3, the prevalence of TB identified by GeneXpert Assay was 15.6%
among suspected TB cases in the study population in 2012 (64 out of 410), and the prevalence of
MDR-TB was 3.2% among suspected TB cases (13 out of 410) and 20.3% among TB positive
sub-population (13 out of 64). The mean of age was 39 for the whole study population and
decreased to 35 in drug-susceptible TB group and to 30 in MDR-TB group. This study
population had an even gender distribution, males represented 49.8% and females represented

25
50.2% of the study population, this distribution could also be seen in MDR-TB (46.2% male,
53.9%female) and TB negative (48%male, 52%female) groups. However, drug-susceptible TB
group had more male patients compared to females (62.8% vs 37.3%).
Among these confirmed TB positive cases, 90.6% (n=58) of them are new cases (first
time infected with TB) and only 6.25% (n=4) are relapse cases (Table 4.). By comparing drug-
susceptible TB and MDR-TB groups, we found that they were significantly different for the new
cases and relapse cases proportion (p=0.002). 96.1% of drug susceptible TB cases are new cases
while only 69.2% of MDR-TB cases are new cases. All 4 relapse cases are found in the MDR-
TB group, which represents 30.8% of MDR-TB cases. What’s more, the MDR-TB group has
significant different proportions of previous TB infection episodes compared with the drug-
susceptible TB group (p=0.008). Besides 3 cases (23.1% in MDR-TB) have 1 previous TB
episode, MDR-TB group has 1 case (7.7% in MDR-TB) has 3 previous TB infection history,
which is the highest number of previous TB episodes in TB positive population.
The individual who had a previous treatment failure was HIV negative and did not
develop MDR-TB, although he had 2 previous TB episodes. Another individual in the drug-
susceptible TB group who was in the loss to follow-up TB category was also HIV negative and
MDR-TB negative. Both of them completed their TB treatment successfully at this study.
Among the relapse cases, three were females and one was male. Two females were HIV
negative and one was HIV unknown, but all of them completed TB treatment successfully. The
only male relapse case was HIV positive and taking HAART. He failed his TB treatment and
subsequently died. No available information about the cause of his death was available in the
dataset, so the association of his TB treatment failure and death is in doubt.

26
4.1.2 HIV Status and HAART
In the whole study population, 21 participants are HIV positive (5.1%) and 12
participants are HIV negative (2.9%), such that most of the participants (n=377, 92%) have
unknown HIV status (Table 3). Among these 21 positive HIV patients, 12 of them are TB co-
infected and one third is MDR-TB co-infected (n=4). Among TB positive patients (Table 3),
HIV status is on the margin of significantly different across drug-susceptible TB and MDR-TB
groups (p= 0.05). However, TB-HIV co-infection rate in the TB patients with known HIV status
is significantly greater than the 2012 DR Congo national level[43] (Bukavu 50% vs DRC 16%,
p< 0.0001) according to the binomial test.
As shown on Table 5, one third of the HIV positive patients are on highly active anti-
retroviral treatment (HAART) (n=7, 33%) and two thirds are not on HAART (not on HAART
n=5, 23.8% vs unknown n=9, 42.9%). Although all MDR-TB HIV co-infection patients (n=4)
were on HAART, the difference between drug-susceptible TB and MDR-TB groups on the
proportion of HIV co-infected patients on HAART is not statistical significant due to the small
number of HIV co-infection cases (drug susceptible 25% vs MDR-TB 100%, p= 0.09). However,
the comparison among TB negative, drug susceptible TB, and MDR-TB showed a significant
difference by using Fisher’s exact test.

27
4.2 LOGISTIC REGRESSION ANALYSES FOR MDR-TB RISK FACTORS
Figure 3. Odds Ratio for HIV status (HIVstatus) and Previous TB Episode Number (TB_Episodnumber) after adjusting for age and sex.
The potential risk factors of developing MDR-TB included previous TB episode, HIV
status, HAART status, age, and sex. By using the overall population (TB positive + TB negative)
of this dataset, logistic regression that regressed on MDR-TB status with all potential risk factors
showed previous TB episode (p=0.01) and HIV status (p=0.0007) are significantly associated
with MDR-TB positive status. However, this outcome cannot be replicated in the TB positive
subgroup population (previous TB episode, p=0.18; HIV status p=0.25); no potential risk factors

28
were significantly associated with MDR-TB positive when the logistic regression is done on the
TB positive subgroup population.
After excluding non-significant covariates, the new logistic model showed the odds ratio
(OR) for previous TB episode was 4.1 (95% CI, 1.6 to 10.8) (Figure 3), which means 1 previous
TB episode increase is associated with 4.1 times greater odds for a patient to be MDR-TB
positive. The OR for HIV positive vs HIV unknown was 22 (95% CI, 5 to 100), and for HIV
negative vs HIV unknown OR was 26 (95% CI, 5 to 144) (Figure 3).
If we use HIV negative as reference group, HIV positive was not significantly associated
with MDR-TB (p-value=0.92), while HIV unknown was significantly associated with MDR-TB
by a negative association (OR=0.042, p=0.0001, 95% CI 0.008 to 0.2). The reason could be the
majority of cases was HIV unknown (n=380) and most of cases were MDR-TB negative
(n=397), such that the sample size of MDR-TB positive with HIV co-infection is so small that
type 2 error could be induced.
29
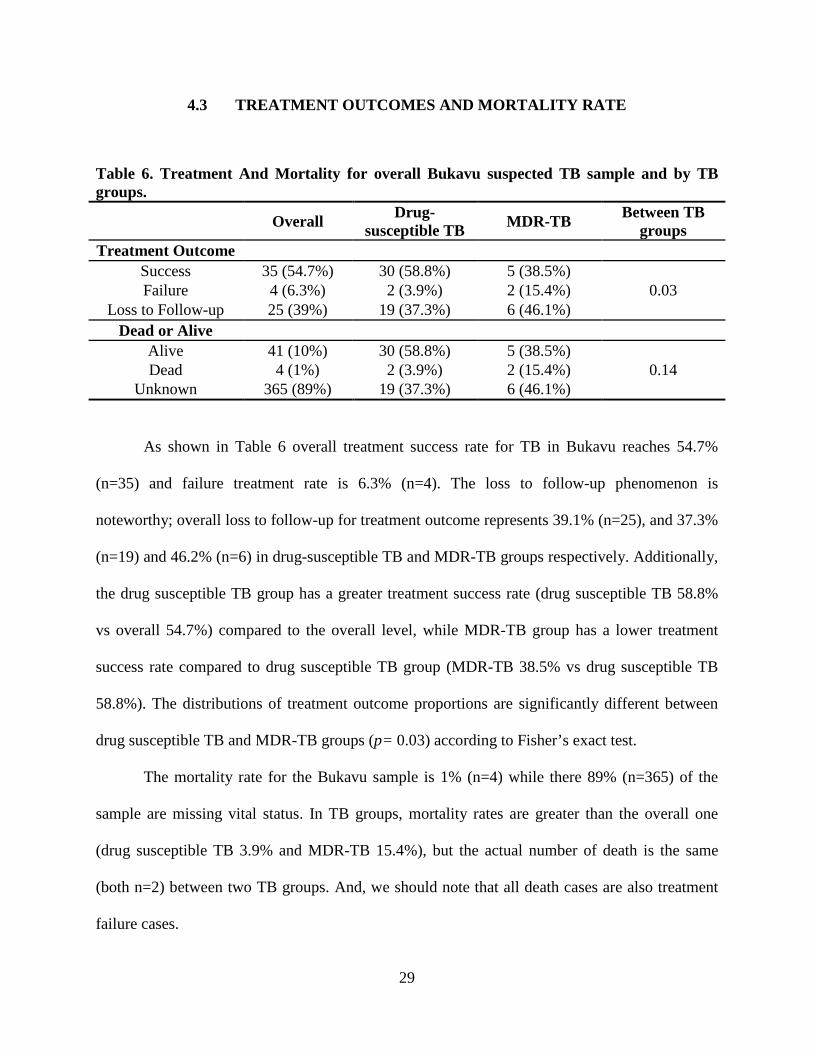
4.3 TREATMENT OUTCOMES AND MORTALITY RATE
Table 6. Treatment And Mortality for overall Bukavu suspected TB sample and by TB groups.
Overall Drug-susceptible TB MDR-TB Between TB
groups Treatment Outcome
Success 35 (54.7%) 30 (58.8%) 5 (38.5%) 0.03 Failure 4 (6.3%) 2 (3.9%) 2 (15.4%)
Loss to Follow-up 25 (39%) 19 (37.3%) 6 (46.1%) Dead or Alive
Alive 41 (10%) 30 (58.8%) 5 (38.5%) 0.14 Dead 4 (1%) 2 (3.9%) 2 (15.4%)
Unknown 365 (89%) 19 (37.3%) 6 (46.1%)
As shown in Table 6 overall treatment success rate for TB in Bukavu reaches 54.7%
(n=35) and failure treatment rate is 6.3% (n=4). The loss to follow-up phenomenon is
noteworthy; overall loss to follow-up for treatment outcome represents 39.1% (n=25), and 37.3%
(n=19) and 46.2% (n=6) in drug-susceptible TB and MDR-TB groups respectively. Additionally,
the drug susceptible TB group has a greater treatment success rate (drug susceptible TB 58.8%
vs overall 54.7%) compared to the overall level, while MDR-TB group has a lower treatment
success rate compared to drug susceptible TB group (MDR-TB 38.5% vs drug susceptible TB
58.8%). The distributions of treatment outcome proportions are significantly different between
drug susceptible TB and MDR-TB groups (p= 0.03) according to Fisher’s exact test.
The mortality rate for the Bukavu sample is 1% (n=4) while there 89% (n=365) of the
sample are missing vital status. In TB groups, mortality rates are greater than the overall one
(drug susceptible TB 3.9% and MDR-TB 15.4%), but the actual number of death is the same
(both n=2) between two TB groups. And, we should note that all death cases are also treatment
failure cases.

30
Table 7. Univariate Logistic Regression Models for identifying risk factors.
Covariate Odds Ratio Estimate 95% Wald Confidence Limits
p-value
MDR-TB (positive vs negative)
6.0 (0.68, 52.9) 0.11
Previous TB episode 1 vs 0 3.33 (0.26, 42.9) 0.84 2 vs 0 <0.001 --- 3 vs 0 <0.001 ---
TB category Relapse vs New <0.001 --- 0.78 Failure vs New 3.89 (0.30, 49.9)
Loss to follow-up vs New
<.0001 ---
HIV status (positive vs negative)
>999 --- 0.99
HAART (Yes vs No) >999 --- 0.17 Age 0.96 (0.88, 1.06) 0.42
Gender (male vs female)
0.59 (0.74, 4.71) 0.62
No significant risk factor can be found via univariate logistic regression models (Table
7), but the comparison of MDR-TB positive vs negative samples has the lowest p-value=0.11
among all covariates. The p-value close to 0.1 makes MDR-TB positive a very likely risk factor
for treatment failure considering the sample size is very small (treatment failure n=4) in this
study. Alpha level 0.1 can be used for this analysis due to the extremely low sample size.

31
5.0 DISCUSSION
5.1 TB AND MDR-TB PREVALENCE
2%10%
16%
100%
0%
10%
20%
30%
40%
50%
60%
70%
80%
90%
100%
MDR-TB (new case) MDR-TB (relapse)
MDR-TB Prevalence among TB postive patients in 2012
National level Bukavu
Figure 4. MDR-TB prevalence in Bukavu and Democratic Republic of the Congo in 2012. National level data are from the DR Congo country profile in the WHO 2012 annual TB report[43].
According to the 2013 WHO annual TB report, TB prevalence at the national level in
DRC is estimated to be 0.58%, or 576 per 100,000 population in 2012. Compared to the national
level, Bukavu sample has a significantly higher prevalence of TB (p< 0.0001), which is 15.61%
and about 20 times greater the national level. This significant discrepancy is contributed by
32
several reasons, and the first one that should be noted is the population difference. In the national
level, the denominator of TB prevalence is the total population of DR Congo in 2012. This
population includes both high risk and low risk people while the Bukavu sample population is
composed of high risk people from a local referral hospital. Therefore, the composition of the
Bukavu sample contributes to a high likelihood of selection bias. The second reason can be the
national wide TB underreported issue. Due to the difficulty to access health services, many TB
patients in DRC may not have TB tests before severe symptoms onset, such that the reported TB
cases only represent a small proportion of all TB patients in DRC. Furthermore, lack of high
sensitivity diagnostic tests worsen the underreporting, especially in rural area[44]. Since the TB
cases were identified by GeneXpert Assay, a high sensitivity molecular test, in Bukavu sample,
more actual TB infections were detected in Bukavu than the national surveillance which heavily
depended on Ziehl-Nelsen Microscopy. The third possible reason can be the living environment.
Bukavu is one of the four major cities in DRC so that it has a higher population density than
many other places in DRC. In such urban environment, TB is more likely to spread out due to the
frequent and close interaction among people living in urban area.
MDR-TB prevalence is also significantly higher in Bukavu compared to national level,
no matter in new case group (15.5% vs 2.2%, p<0.0001) or in relapse group (100% vs 10%,
p<0.0001). This discrepancy should be largely contributed of the extremely small sample size.
There are only 58 new cases of TB infection and 4 relapse cases in Bukavu sample, so random
effects might affect the results significantly. Similar to general TB prevalence, MDR-TB
prevalence is also increased by using a more accurate diagnostic test, GeneXpert Assay, for
screening, while many places in DRC do not have the ability to test drug resistance TB
strains[44].

33
5.2 MDR-TB RISK FACTORS
As shown in the result section, the risk factors we identified in this study are HIV status
and previous TB episode number. These two factors are also found in many previous studies[16,
39, 45], however, the HIV status is not showing the same effect in the MDR-TB predicting
model as it did in previous studies. In previous studies, HIV positive status is significantly
associated with a higher risk of developing MDR-TB compared to HIV negative status. But in
our study, we found that HIV positive vs negative is not significantly associated with MDR-TB
infection (Odds ratio= 1.2, 95% CI = (0.19, 7.5)). This result could be affected by the even
distribution of HIV positive (n=4) and negative (n=4) subgroups in MDR-TB patients. Because
the actual numbers of HIV positive and negative are less than 5 in MDR-TB group, this
distribution could be a consequence of random effect and made the OR of HIV positive vs
negative close to 1. Also the small sample size enlarged the 95% confidence interval such that it
is more likely to contain 1. In other words, our logistic regression analysis could not reject the
false null hypothesis which hypothesizes HIV positive has the same odds as HIV negative in the
MDR-TB model (type 2 error).
As shown in Figure 4, both HIV positive vs unknown and HIV negative vs unknown are
significantly associated with MDR-TB positive. One possible explanation for this phenomenon is
that the people have screened for HIV infection in Bukavu because they are at a high risk of all
kinds of infectious diseases including MDR-TB, while the people have not screened for HIV are
generally healthy. Due to the insufficient HIV screening capacity, people in DRC do not have a
very large scale of HIV screening. Under such condition, HIV screening is provided to people in
need first, for example TB patients[46]. Hence, healthy people or people living in low risk
environment are not likely to take a HIV test voluntarily. On the other hand, people at risk will

34
be recommended to take a HIV test by health care workers, for example TB relapse patients are
more likely to have HIV test. Therefore, it is reasonable to speculate that knowing HIV status
becomes a risk factor due to the difference between the tested for HIV population and the not
tested for HIV population in Bukavu.
Previous TB episode number represents how likely an individual is infected by TB. In
other words, this variable indicates likelihood of TB infection for a certain individual. A person
with many previous TB episodes can be related to his/her poor immunity or the lack of
successful TB treatment. Under such circumstance, this individual is prone to be infected with
drug resistant TB strains from other patients, or develop drug resistant TB from his own drug-
susceptible TB infection after treatment failure. Therefore, a 1 unit increase in previous TB
episode number is associated with about 4 times more odds to develop MDR-TB (odds ratio =
4.1).

35
5.3 TREATMENT OUTCOMES
Figure 5. Treatment Outcomes in Bukavu Sample by Drug-susceptible TB and MDR-TB Groups.
Treatment success rate in DRC was 87% for drug susceptible new and relapse cases and
for MDR-TB was 64% in 2012, as well as 3% loss to follow-up according to DRC TB country
profile in WHO 2013 Global Tuberculosis Report[43]. Compared to the national level, Bukavu
sample’s drug-susceptible treatment success rate is significantly low than national level (58.8%
vs 87%, p=<.0001), but MDR-TB treatment success rate is not significantly lower than the
national level (64% vs 38%, p=0.06). The possible reasons for the difference between Bukavu
and national level in treatment success rate can be the poor access to health services and high
quality drugs, and high HIV comorbidity in Bukavu area. The percentage of HIV/TB co-
infection cases among TB patients with known HIV status is 36% in Bukavu, while the national
level is only 16% (p=0.0017)[43]. Thus, high HIV comorbidity is a severe public health issue in

36
Bukavu area, and this issue reduces the TB treatment success rate in local area because of the
complexity of TB/HIV co-infection management[5].
High percentage of loss to follow-up can be another problem for treatment success
outcome in Bukavu. Since TB treatment takes no less than 6 months, loss to follow-up is a
common problem in developing countries. However, the percentage of loss to follow-up in
Bukavu is much higher than sub-Sahara Africa average (37% vs 18%, p=0.0003)[47]. This high
percentage loss to follow-up suggests there are more cases that could be treatment failure
because those patients are not likely to complete their treatment and hard to have proper post
treatment evaluation. Although loss to follow up percentage of MDR-TB is not significantly
greater than drug susceptible TB in Bukavu (p= 0.56), we should note that the small sample size
might lead to type 2 error in this problem. MDR-TB treatment requires a longer time frame (12-
24 months) and has more expensive cost and more adverse events during treatment[39], such that
loss to follow up could be easier to see in MDR-TB group. Besides, the greater treatment failure
rate in MDR-TB group compared to drug susceptible TB group (p=0.13 close to statistical
significance due to the small sample size) indicates that MDR-TB treatment is more difficult to
succeed in Bukavu area.
5.4 STRENGTH AND LIMITATION
This study provides 2012 MDR-TB prevalence in Bukavu based on a quick feedback
diagnostic technique, GeneXpert which is not available in many other places in DRC. Thus, the
MDR-TB prevalence in Bukavu provided by this study is valuable for local and national TB

37
management and surveillance in DRC. In addition, logistic regression analysis provides
meaningful insight for identifying potential risk factors of MDR-TB and TB treatment failure.
The major limitation of this study is the small sample size of TB positive patients. This
small sample size limits the power of many analyses and may induce type 2 error. It is difficult
to assume our study population can represent the characteristics of Bukavu population
accurately. Hence, the generalizing ability of this study is not ideal. In addition, since the study
population was recruited at a local referral hospital, the participants were more likely to be TB
patients than the general healthy citizens in Bukavu area. Therefore, there is a selection bias
impairing the generalizability of this study as well. Lastly, high percentage of loss to follow-up
existed in several outcome variables such as treatment outcome and vital status affect the internal
validity of this study. The high percentage of loss to follow-up could be caused by the lack of
health care workers in Bukavu[48]. As Mukungo et al mentioned in their study, lacking health
care workers is a general problem in DRC, such that it is reasonable to assume the staff in
Bukavu referral hospital did not have too much time and resources to keep in touch with every
participants. Also, the high mobility of people in DRC might worsen this situation[48]. No
competent public health infrastructure is another possible reason for the loss to follow-up issue,
especially in vital status records. Without a death registry system with high coverage, it was very
difficult to retrieve vital status in DRC as well as Bukavu[49]. And without complete
information on vital status, we could not calculate an accurate mortality rate for the TB patients
and no meaningful comparison could be made between different TB groups.
Future studies should try to adjust these limitations and include more information of the
study sample, such that more potential risk factors could be analyzed.

38
6.0 PUBLIC HEALTH SIGNIFICANCE
Due to the implementation of GeneXpert Assay in Bukavu General Referral Hospital,
MDR-TB prevalence is available in that area and we found our study population has a high
MDR-TB prevalence in 2012. From our study, we recognize previous TB infection and HIV
comorbidity are important risk factors for MDR-TB. To improve the lower than national average
treatment success rate in Bukavu, HIV and TB prevention programs should be emphasized and
expanded to the whole population in Bukavu. Also, we found that GeneXpert Assay provides
significant help for MDR-TB screening in Bukavu, such that this diagnostic tool should be
implemented to more health zones in DRC in order to improve community level MDR-TB
surveillance and treatment.

39
APPENDIX: NO HUMAN SUBJECTS DETERMINATION LETTER
MEMORANDUM
TO: Yifeng Li
FROM: Judith L. Navratil BA, CIP
Faculty Liaison, University of Pittsburgh Institutional Review Board
DATE: February 15, 2016
SUBJECT: Prevalence, Risk Factors and Outcomes of Multidrug Resistant Tuberculosis
Identified by GeneXpert MTB/RIF Assay in Bukavu, Democratic Republic of the Congo.
The above-referenced protocol has been reviewed by the University of Pittsburgh Institutional
Review Board. Based on the information provided to the IRB, this project includes no
involvement of human subjects, according to the federal regulations [§45 CFR 46.102(f)]. That
is, the investigator conducting research will not obtain information about research subjects via an
40
interaction with them, nor will the investigator obtain identifiable private information. Should
that situation change, the investigator must notify the IRB immediately.

41
BIBLIOGRAPHY
1. World Health Organization., Global tuberculosis report 2015. 2015, Geneva: World Health Organization. 192 p.
2. Daniel, T.M., The history of tuberculosis. Respiratory Medicine, 2006. 100(11): p. 1862-1870.
3. Fogel, N., Tuberculosis: A disease without boundaries. Tuberculosis, 2015. 95(5): p. 527-531.
4. World Health Organization., Global TB Facts 2015, in Global Tuberculosis Report 2015. 2015, World Health Organization.
5. Nachega, J.B., et al., Management of adult active tuberculosis disease in era of HIV pandemic, current practices and future perspectives. Infect Disord Drug Targets, 2011. 11(2): p. 134-43.
6. Henegar, C., et al., Impact of HIV on clinical presentation and outcomes of tuberculosis treatment at primary care level. Int J Tuberc Lung Dis, 2013. 17(11): p. 1411-3.
7. The British Broadcasting Corporation. Democratic Repbulic of Congo profile - Timeline. 2015 [cited 2016 April 2nd]; Available from: http://www.bbc.com/news/world-africa-13286306.
8. Panzi Hospital. History. 2016 [cited 2016 April 14th]; Available from: http://www.panzihospital.org/about/history.
9. Smith, I., Mycobacterium tuberculosis Pathogenesis and Molecular Determinants of Virulence. Clinical Microbiology Reviews, 2003. 16(3): p. 463-496.
10. Niederweis, M., et al., Mycobacterial outer membranes: in search of proteins. Trends in microbiology, 2010. 18(3): p. 109-116.
11. Todar, K., Todar's Online Textbook of Bacteriology. 2008, Madison, Wisconsin: University of Wisconsin Department of Bacteriology.
12. Guirado, E., L.S. Schlesinger, and G. Kaplan, Macrophages in Tuberculosis: Friend or Foe. Seminars in immunopathology, 2013. 35(5): p. 563-583.
42
13. Behar, S.M., M. Divangahi, and H.G. Remold, Evasion of innate immunity by Mycobacterium tuberculosis: is death an exit strategy? Nature reviews. Microbiology, 2010. 8(9): p. 668-674.
14. Gupta, A. and S.R. Chaphalkar, HIV and Tuberculosis: Overview. Bioengineering and Bioscience, 2015. 3(6): p. 95-99.
15. Pawlowski, A., et al., Tuberculosis and HIV Co-Infection. PLoS Pathog, 2012. 8(2): p. e1002464.
16. Isaakidis, P., et al., Treatment Outcomes for HIV and MDR-TB Co-infected Adults and Children: Systematic Review and Meta-analysis. 2015, International Union Against Tuberculosis and Lung Disease. p. 969-78.
17. Naveen, G. and B.V. Peerapur, Comparison of the Lowenstein-Jensen Medium, the Middlebrook 7H10 Medium and MB/BacT for the Isolation of Mycobacterium Tuberculosis (MTB) from Clinical Specimens. Journal of Clinical and Diagnostic Research : JCDR, 2012. 6(10): p. 1704-1709.
18. Guillerm, M., M. Usdin, and J. Arkinstall, Tuberculosis Diagnosis and Drug Sensitivity Testing -- An overview of the current daignostic pipeline. 2006: Paris.
19. Foundation for Innovative New Diagnostics. Liquid culture and drug susceptibility testing. 2016 [cited 2016 Jan 20th ].
20. Kim, S.J., Drug-susceptibility testing in tuberculosis: methods and reliability of results. European Respiratory Journal, 2005. 25(3): p. 564-569.
21. Cattamanchi, A., et al., Sensitivity and Specificity of Fluorescence Microscopy for Diagnosing Pulmonary Tuberculosis in a High HIV Prevalence Setting. The international journal of tuberculosis and lung disease : the official journal of the International Union against Tuberculosis and Lung Disease, 2009. 13(9): p. 1130-1136.
22. UNITAID Secretariat, Tuberculosis Diagnostic Technology and Market Landscape, 4th edition. 2012: Geneva.
23. Davis, J.L., et al., Diagnostic accuracy of same-day microscopy versus standard microscopy for pulmonary tuberculosis: a systematic review and meta-analysis. The Lancet Infectious Diseases, 2012. 13(2): p. 147-154.
24. Foundation of Innovative New Diagnosis. Light-emitting diode(LED) fluorescence microscopy. 2016 [cited 2016 Jan 20].
25. Alfred, N., et al., Optimising Mycobacterium tuberculosis detection in resource limited settings. BMJ Open, 2014. 4(3).

43
26. World Health Organization. WHO endorses new rapid tuberculosis test. 2010 8 DECEMBER 2010 [cited 2015 December 13th]; Available from: http://www.who.int/mediacentre/news/releases/2010/tb_test_20101208/en/.
27. Boehme, C.C., et al., Rapid Molecular Detection of Tuberculosis and Rifampin Resistance. New England Journal of Medicine, 2010. 363(11): p. 1005-1015.
28. Stop TB partnership Secretariat. Introduction of Xpert MTB/RIF to improve early diagnosis and treatment of smear negative TB at the primary health care level Kinshasa, DRC (Xpert MTB Project). 2015 [cited 2016 Feb 18]; Available from: http://www.stoptb.org/assets/documents/global/awards/tbreach/Congo%20UNCC.pdf.
29. Choi, H.W., et al., Cost-effectiveness of Xpert® MTB/RIF for diagnosing pulmonary tuberculosis in the United States. The international journal of tuberculosis and lung disease : the official journal of the International Union against Tuberculosis and Lung Disease, 2013. 17(10): p. 1328-1335.
30. Foundation of Innovative New Diagnosis. Price for Xpert MTB/RIF and FIND country list. 2013 [cited 2016 Jan 20th].
31. Creswell, J., et al., Results from early programmatic implementation of Xpert MTB/RIF testing in nine countries. BMC Infectious Diseases, 2014. 14(1): p. 1-12.
32. Centers for Disease Control and Prevention., Treatment of Tuberculosis, American Thoracic Society, CDC, and Infectious Diseases Society of America. MMWR, 2003. 52(RR-11).
33. Centers for Disease Control and Prevention. Basic TB Facts. 2012 June 28, 2012 [cited 2015 December 9]; Available from: http://www.cdc.gov/tb/topic/basics/signsandsymptoms.htm.
34. Sensi, P., History of the Development of Rifampin. Reviews of Infectious Diseases, 1983. 5: p. S402-S406.
35. Centers for Disease Control and Prevention., Provisional CDC Guidelines for the Use and Safety Monitoring of Bedaquiline Fumarate (Sirturo) for the Treatment of Multidrug-Resistant Tuberculosis. MMWR, 2013. 62(No. RR-9).
36. Suzanne, M.M., et al., Treatment Practices, Outcomes, and Costs of Multidrug-Resistant and Extensively Drug-Resistant Tuberculosis, United States, 2005–2007. Emerging Infectious Disease journal, 2014. 20(5): p. 812.
37. Nachega, J.B. and B. Rosenkranz, Targeting tuberculosis and HIV/AIDS: a global progress report of a deadly partnership. Infect Disord Drug Targets, 2011. 11(2): p. 96-7.
38. World Health Organization. Treatment of tuberculosis: guidelines -- 4th edition. 2011 [cited 2016 Jan 21st]; Available from: http://www.who.int/tb/publications/tb_treatmentguidelines/en/.
44
39. Farley, J.E., et al., Outcomes of Multi-Drug Resistant Tuberculosis (MDR-TB) among a Cohort of South African Patients with High HIV Prevalence. PLoS ONE, 2011. 6(7): p. e20436.
40. Bantubani, N., et al., High Rates of Potentially Infectious Tuberculosis and Multidrug-Resistant Tuberculosis (MDR-TB) among Hospital Inpatients in KwaZulu Natal, South Africa Indicate Risk of Nosocomial Transmission. PLoS ONE, 2014. 9(3): p. e90868.
41. World Health Organization, Definitions and Reporting Framework for Tuberculosis - 2013 revision. Updated Dec 2014, World Health Organization.
42. Bursac, Z., et al., Purposeful selection of variables in logistic regression. Source Code for Biology and Medicine, 2008. 3(1): p. 1-8.
43. World Health Organisation, Global Tuberculosis Report 2013. 2013, World Health Organisation.
44. Kaswa, M.K., et al., Multi Drug Resistant Tuberculosis in Mosango, a Rural Area in the Democratic Republic of Congo. PLoS ONE, 2014. 9(4): p. e94618.
45. Mukinda, F.K., et al., Rise in rifampicin-monoresistant tuberculosis in Western Cape, South Africa. Int J Tuberc Lung Dis, 2012. 16(2): p. 196-202.
46. Vanden Driessche, K., et al., Training health care workers to promote HIV services for patients with tuberculosis in the Democratic Republic of Congo. Hum Resour Health, 2009. 7: p. 23.
47. Akessa, G.M., M. Tadesse, and G. Abebe, Survival Analysis of Loss to Follow-Up Treatment among Tuberculosis Patients at Jimma University Specialized Hospital, Jimma, Southwest Ethiopia. International Journal of Statistical Mechanics, 2015. 2015: p. 7.
48. Mukungo, S.a.K., B., Intensive TB Case Finding in Unsafe Settings: Testing an Outreach Peer Education Intervention for Increased TB Case Detection among Displaced Populations and Host Communities in South-Kivu Province, Democratic Republic of Congo. Journal of Tuberculosis Research, 2014. 2: p. 160-167.
49. Immigration and Refugee Broad of Canada. Canada: Immigration and Refugee Board of Canada, Democratic Republic of the Congo: Whether a birth, marriage or death certificate can be obtained by a person residing outside the country; the procedure to follow and the fees required. 2011. [cited 2016 April 27th]; Available from: http://www.refworld.org/docid/4f9e60512.html.