prevalence of restricted spirometry within two eastern
TRANSCRIPT

University of Kentucky University of Kentucky
UKnowledge UKnowledge
Theses and Dissertations--Public Health (M.P.H. & Dr.P.H.) College of Public Health
2020
Prevalence of Restricted Spirometry within Two Eastern Kentucky Prevalence of Restricted Spirometry within Two Eastern Kentucky
Counties A Cross Sectional Study Counties A Cross Sectional Study
Quincy Bascombe University of Kentucky, [email protected]
Follow this and additional works at: https://uknowledge.uky.edu/cph_etds
Part of the Public Health Commons
Right click to open a feedback form in a new tab to let us know how this document benefits you. Right click to open a feedback form in a new tab to let us know how this document benefits you.
Recommended Citation Recommended Citation Bascombe, Quincy, "Prevalence of Restricted Spirometry within Two Eastern Kentucky Counties A Cross Sectional Study" (2020). Theses and Dissertations--Public Health (M.P.H. & Dr.P.H.). 268. https://uknowledge.uky.edu/cph_etds/268
This Graduate Capstone Project is brought to you for free and open access by the College of Public Health at UKnowledge. It has been accepted for inclusion in Theses and Dissertations--Public Health (M.P.H. & Dr.P.H.) by an authorized administrator of UKnowledge. For more information, please contact [email protected].

STUDENT AGREEMENT: STUDENT AGREEMENT:
I represent that my capstone and abstract are my original work. Proper attribution has been
given to all outside sources. I understand that I am solely responsible for obtaining any needed
copyright permissions. I have obtained needed written permission statement(s) from the
owner(s) of each third-party copyrighted matter to be included in my work, allowing electronic
distribution (if such use is not permitted by the fair use doctrine) which will be submitted to
UKnowledge as Additional File.
I hereby grant to The University of Kentucky and its agents the irrevocable, non-exclusive, and
royalty-free license to archive and make accessible my work in whole or in part in all forms of
media, now or hereafter known. I agree that the document mentioned above may be made
available immediately for worldwide access unless an embargo applies.
I retain all other ownership rights to the copyright of my work. I also retain the right to use in
future works (such as articles or books) all or part of my work. I understand that I am free to
register the copyright to my work.
REVIEW, APPROVAL AND ACCEPTANCE REVIEW, APPROVAL AND ACCEPTANCE
The document mentioned above has been reviewed and accepted by the student’s advisor, on
behalf of the advisory committee, and by the Director of Graduate Studies (DGS), on behalf of
the program; we verify that this is the final, approved version of the student’s capstone including
all changes required by the advisory committee. The undersigned agree to abide by the
statements above.
Quincy Bascombe, Student
Wayne T. Sanderson, PhD, MS, CIH, Committee Chair
Brian A. Jackson, PhD, Director of Graduate Studies

Prevalence of Restricted Spirometry within Two
Eastern Kentucky Counties
A Cross Sectional Study
CAPSTONE PROJECT PAPER
A paper submitted in partial fulfillment of the
Requirements for the degree of
Master of Public Health in the
University of Kentucky College of Public Health
By
Quincy Bascombe, MD
Lexington, Kentucky
Final Examination:
04/22/2020
Capstone Committee:
Wayne T. Sanderson, PhD, MS, CIH, (Chair)
Steven R. Browning, PhD
Susan E. Spengler, MD, MSPH, FACOEM
Timothy S. Prince, MD, MSPH

2
Acknowledgments
1. Capstone Committee
• Dr. Wayne Sanderson
• Dr. Steven Browning
• Dr. Susan Spengler
• Dr. Timothy Prince
2. Dr. David Mannino
3. Central Appalachian Region Educational Research Center

3
Abstract (or Executive Summary)
Objective: This study examines the prevalence of restrictive spirometry in Eastern
Kentucky and its association among men and women with various demographic and
exposure (occupational and environmental) factors.
Methods: A cross sectional, cluster sample (N = 685) of participants from Letcher and
Harlan Counties, aged 21 and over, answered a questionnaire focused on risk factors for
respiratory health outcomes including questions on demographic, health, occupational, and
environmental exposures variables. Pulmonary function tests were administered to all
participants with no significant cardiovascular or cerebrovascular events within the past 30
days. Log-binomial regression was used to calculate prevalence ratios (PRs) adjusted for
multiple covariates.
Results: The prevalence of restricted spirometric pattern (RSP) among men and women
was 24.3% and 30.6%, respectively. RSP prevalence was particularly high among men and
women with comorbidities. Significant associations for restricted spirometry among
women included Age35-64: adjusted prevalence (PR: 5.49, 95% CI 1.69 to 17.8, p=0.005),
Age≥65 (PR:7.23, 95% CI 2.20 to 23.7, p=0.001), widowed, single or divorced women
(PR: 1.78, 95% CI 1.02 to 3.10, p=0.043), one comorbidity (PR: 1.79, 95% CI: 1.14 to
2.80) and obesity (PR: 2.21, 95% CI 1.05 to 4.64, p=0.036). Significant associations for
restricted spirometry among men was obesity (PR: 2.68, 95% CI 1.05 to 6.80, p=0.039).
Conclusions: The prevalence of RSP in Central Appalachia is substantially higher when
compared with previous literature. Increased RSP in our cohort is multifactorial but may
be due to higher prevalence of obesity and comorbid conditions, which is in line with

4
previous studies. Occupational and environmental exposures did not show association with
RSP despite many participants living in proximity to coal mines and mining activities.
Keywords: pulmonary disease; restricted spirometry; restrictive spirometric pattern

5
Table of Contents
I. Introduction………………………………………………………………………
II. Methods……………………………………………………………………………
III. Results………………………………………..……………………………………
IV. Discussion…………………………………………………………………………
V. Tables……………………………………………………………………………..
VI. References…………………………………………………………………………

6
Introduction
Restrictive lung disease may be broadly defined as “reduced lung expansion
expressed as a decreased total lung capacity (TLC).”1 When the TLC is not available, one
can look at the restrictive spirometric patterns. These non-obstructive patterns are
characterized by deficits in forced expiratory volume in one second (FEV1) and forced vital
capacity (FVC), with FEV1/FVC ratios that are within normal limits.2 Collectively, these
patterns may be referred to as restrictive spirometric patterns, preserved ratio-impaired
spirometry (PRiSM), GOLD-unclassified, restrictive lung disease (RLD) patterns, or
nonspecific patterns (when accompanied by a normal TLC).1-3 Receiver operating
characteristics’ (ROC) curves best cut-off point for FVC detection of restrictive spirometric
patterns is approximately 70%.4
Restrictive spirometric patterns are associated with several risk factors, including
defects in the chest wall, changes in the lung parenchyma, diseases of the pleura, adverse
reaction to certain drugs or neuromuscular disorders, and cardiovascular risk factors such
as obesity, diabetes, systemic arterial hypertension, smoking, and physical inactivity.3,5
Besides airflow obstruction, restrictive spirometry has also been associated with
congestive heart failure.6
Chest wall pathology may play a major role in restrictive spirometry as it is a
critical part of the respiratory pump, responsible for the expansion and contraction of the
lungs and causing air to flow from the atmosphere to the alveoli and back out. Some
diseases of the chest wall include congenital and childhood abnormalities, kyphosis and
scoliosis, ankylosing spondylitis, traumatic and iatrogenic processes, and morbid
obesity.7

7
Abnormal changes in lung parenchyma comprise of interstitial lung diseases
(ILDs) and are a heterogeneous group of disorders with similar pathologic, clinical,
imaging, and physiologic findings. These abnormalities can have either known or
unknown etiologies. The most identifiable known cause and risk factors of ILD are
exposure to occupational and environmental agents, which include inorganic or organic
dusts, drug-induced pulmonary toxicity, and radiation-induced lung injury. Unexplained
causes for ILD include cryptogenic organizing pneumonia, sarcoidosis, and idiopathic
interstitial pneumonias.8
Occupational exposure to inorganic dust such as respirable crystalline silica is
particularly important as it known to cause several lung diseases in susceptible hosts,
including classic pneumoconiosis (silicosis), nodular interstitial lung disease of coal
workers’ pneumoconiosis (CWP), and lung cancer. Crystalline silica has also been
associated with other lung pathology not commonly recognized with restricted
spirometry, such as chronic obstructive pulmonary disease (COPD).9,10 In regards to
silicosis, the risk of disease appears to be higher with exposure to the more toxic, clean,
silica dioxide (SiO2) tetrahedral form.11 Exposure to respirable crystalline silica occurs in
a vast array of occupations and industries. It is estimated that over two million workers
are exposed to crystalline silica with jobs in foundry, brick making, and abrasive blasting
operations; paint, glass, china dishes, pottery, and plumbing fixture manufacturing; and in
many construction activities such as highway repair, masonry, concrete work, rock
drilling, and tuck pointing.9
Previous epidemiological studies indicate the prevalence of disease among silica
exposed workers. One cohort study comprised of 2342 individuals employed at a

8
diatomaceous earth mining facility reported substantially increased standardized
mortality ratios (SMR) for lung cancer mortality (RR: 2.15; 95% CI 1.08 to 4.28) for 15-
year lagged exposure and non-malignant respiratory disease (SMR: 5.35; 95% CI 2.23 to
12.8).10 A population-based case only study of 6521 individuals with lung cancer had a
weighted prevalence of exposure to crystalline silica of 25.7% (95% CI 24.7 to 26.8)
across all histological types of lung cancer.12
Occupational exposure to respirable coal mine dust can lead to the development
of restrictive or obstructive lung disease. Respirable coal dust causes coal mine dust lung
disease (CMDLD), which encompasses mixed dust pneumoconiosis with coexistent silica
exposure, chronic bronchitis, emphysema, and dust-related diffuse fibrosis, in addition to
classical CWP and the severe form, complicated or progressive massive fibrosis (PMF).13
A study of 5605 active coal miners outside of Central Appalachia, regardless of tenure,
found a prevalence of restrictive lung disease via spirometric analysis in three different
regions. The highest prevalence (6.3%) was among 213 coal miners in the Eastern region
from Alabama, Maryland, Ohio, Pennsylvania and Tennessee.14 In Kentucky from
January 2015 through August 2016, 60 active or former coal miners were found to have
radiographic findings consistent with PMF; 56 of them (93%) were residents of four
contiguous counties: Floyd, Knott, Letcher and Pike, which are all a part of the central
Appalachian coalfield.15
Pleural diseases, which can also cause restrictive spirometric patterns, affects the
pleural space and the parietal pleura, which covers the chest wall, diaphragm, and the
mediastinum. Almost 1.5 million people in the United States per year develop pleural
effusions primarily due to congestive heart failure, pneumonia, and cancer.16 Asbestosis

9
is one of more common pleural diseases caused by inhaling asbestos fibers and is
characterized by slowly progressive, diffuse pulmonary fibrosis.17 Asbestosis is also a
form of interstitial lung disease that is indiscernible from idiopathic pulmonary fibrosis
(IPF).18 Involvement of the pleura (pleural effusion or pleural plaques) is considered a
hallmark sign of asbestos exposure and is unusual in other interstitial lung disorders.17 It
demonstrates restrictive ventilatory patterns with decreased lung volumes on pulmonary
function testing.
Jobs with potential exposure to asbestosis include electrical workers, power plant
employees, aircraft mechanics and manufacturers, telephone lineman, shipyard workers,
building supply manufacturers, operational navy and coast guard personnel, power plant
employees, railroad and sheet metal workers, and asbestosis mining and transport.19,20
Prevalence of asbestos exposure is demonstrated in a population-based case only study of
6521 individuals with lung cancer by El Zoghbi et al12, where they reported a weighted
prevalence of exposure to asbestos of 33.9% (95% CI: 32.8 to 35.1), according to
histological types of lung cancer. There was no statistically significant difference in the
weighted prevalence of exposure when looking at the different types of histological lung
cancer.
Adverse reactions to certain drugs or physical agents are another potential cause
of restrictive spirometry. Farmers were found them to have a substantial reduction in
FVC and FEV1 with normal FEV1/FVC ratios on pulmonary function tests after
occupational exposure to low levels of organophosphates.21 Drugs potentially linked to
restrictive lung disease include--but are not limited to--amiodarone, methotrexate, and
nitrofurantoin.3
10
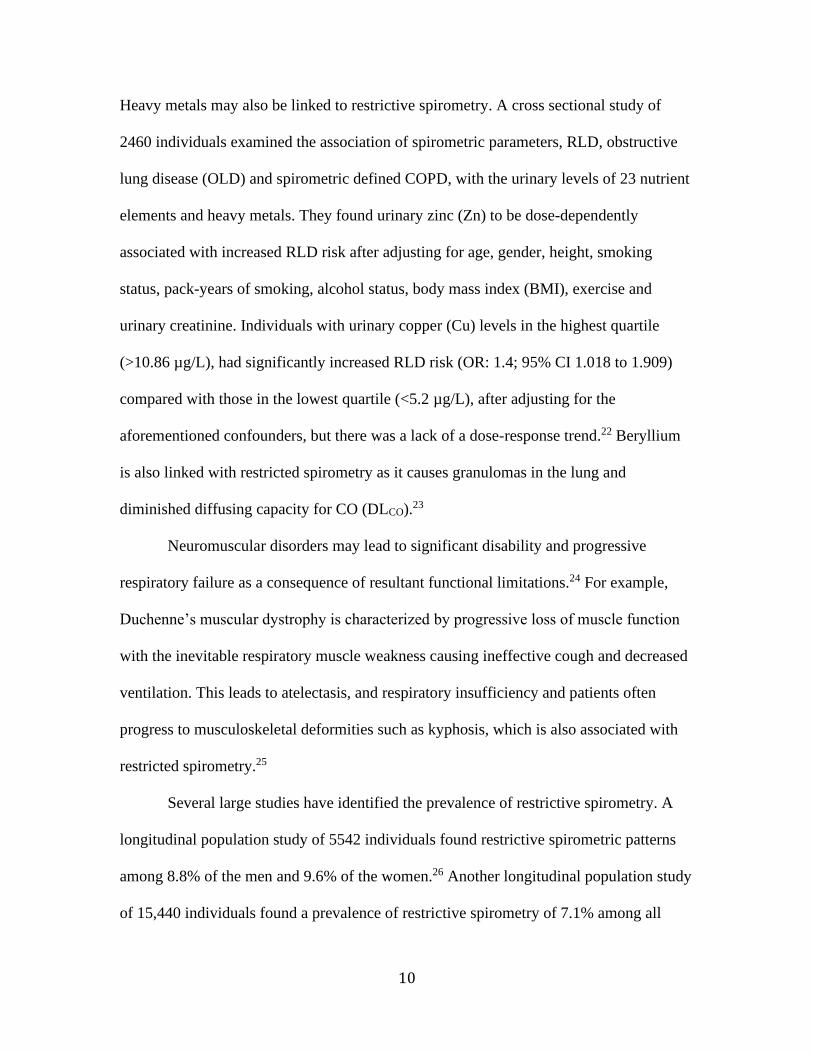
Heavy metals may also be linked to restrictive spirometry. A cross sectional study of
2460 individuals examined the association of spirometric parameters, RLD, obstructive
lung disease (OLD) and spirometric defined COPD, with the urinary levels of 23 nutrient
elements and heavy metals. They found urinary zinc (Zn) to be dose-dependently
associated with increased RLD risk after adjusting for age, gender, height, smoking
status, pack-years of smoking, alcohol status, body mass index (BMI), exercise and
urinary creatinine. Individuals with urinary copper (Cu) levels in the highest quartile
(>10.86 µg/L), had significantly increased RLD risk (OR: 1.4; 95% CI 1.018 to 1.909)
compared with those in the lowest quartile (<5.2 µg/L), after adjusting for the
aforementioned confounders, but there was a lack of a dose-response trend.22 Beryllium
is also linked with restricted spirometry as it causes granulomas in the lung and
diminished diffusing capacity for CO (DLCO).23
Neuromuscular disorders may lead to significant disability and progressive
respiratory failure as a consequence of resultant functional limitations.24 For example,
Duchenne’s muscular dystrophy is characterized by progressive loss of muscle function
with the inevitable respiratory muscle weakness causing ineffective cough and decreased
ventilation. This leads to atelectasis, and respiratory insufficiency and patients often
progress to musculoskeletal deformities such as kyphosis, which is also associated with
restricted spirometry.25
Several large studies have identified the prevalence of restrictive spirometry. A
longitudinal population study of 5542 individuals found restrictive spirometric patterns
among 8.8% of the men and 9.6% of the women.26 Another longitudinal population study
of 15,440 individuals found a prevalence of restrictive spirometry of 7.1% among all
11
participants.27 A cross-sectional study of 121,965 French adults presenting for regular
evaluations found a prevalence of 4.6% among all participants.28
Studies have shown that within the general population, between 7% to 13% of adults
have FVCs <80% of expected for their gender, age, and height in the presence of normal
FEV1/FVC ratios, indicating a restrictive spirometric pattern. Individuals showing
restricted spirometry have increased risk for all-cause, and cardiovascular mortality.29
Restrictive spirometric patterns have also been shown to be associated with various
comorbid conditions including diabetes, metabolic syndrome, hypertension, stroke, and
cardiovascular disease.29 Metabolic syndrome specifically, is characterized by a
constellation of metabolically related cardiovascular risk factors, including insulin
resistance, hyperlipidemia, hypertension, and central obesity. Low FVC is substantially
associated with increasing prevalence of metabolic syndrome along with increasing
mortality.2,30
Restrictive spirometry is particularly important to individuals who live and work
in the central Appalachian regions of Eastern Kentucky. After adaptation of the Coal
Workers’ Health Surveillance Program (CWHSP) in the late 1960s, which was used to
identify coal worker pneumoconiosis (CWP) and prevent its progression, the rate of CWP
amongst coal miners dropped sharply in the 1970s.31 By the 1990s, the prevalence of
CWP and PMF had fallen to 5% and 0.5%, respectively, compared to a prevalence of
CWP and PMF in the 1970s among long tenured (≥ 25 years) underground coal miners of
30% and 3.5%.31 However, during the 2000s, there has been a resurgence of CWP in
central Appalachian regions in Kentucky, Virginia, and West Virginia. By 2015, the
prevalence of PMF among long tenured miners had reached 5% in central Appalachia,

12
which was the highest percentage ever recorded.31 Increases in this prevalence has been
linked to increased coal mine dust levels, longer working hours, especially at the face of
the mine, increased exposure to silica, and employment in smaller mines.13 These
individuals face a future of severe and disabling disease.31
The objectives of this cross-sectional study were to assess the prevalence of
restrictive spirometry among residents of two Eastern Kentucky counties and evaluate
how the prevalence differs by men and women across various demographic factors, and
by occupation and environmental exposure differences. Understanding how various
exposure parameters may be associated with the prevalence of restrictive spirometry, may
guide implementation of preventive measures to reduce the prevalence of disease and
associated morbidity and mortality.
Methods
The Mountain Air Project (MAP) is a cross-sectional epidemiologic study with a
primary goal of applying an environmental public health action strategy (EPHAS) to
address community priorities regarding respiratory health. The project enhanced the
identification of persons with respiratory disease and obtained a wide range of
information regarding community-identified exposures of concern. The study was also
designed to obtain individual-level exposure data to assess the association between
putative mining and environmental exposures and respiratory health outcomes which had
been reported in previous ecologic studies.
Study Area and Population
Our study focused on two Appalachian Kentucky counties (Letcher and Harlan)
with long histories of coal mining and economic disadvantage. This area has the nation’s

13
highest burden of respiratory disease, as well as environmental justice concerns stemming
from air-borne contaminant exposures. The study area was selected based on the
presence of extractive industries, marked disparities in respiratory disease, community
concerns regarding the health impacts of mining, and infrastructure for mobilizing the
project from previous community-based health research. Community stakeholders
suggested using “hollows” as the most relevant geographic unit for defining
“neighborhoods” for the cross-sectional study and for ambient air sampling. This
approach is discussed further in a previous publication by May et al.32 The study was
approved by the University of Kentucky Institutional Review Board and written informed
consent was obtained from all participants.
Eligibility
Inclusion criteria included non-institutionalized, English-speaking adults age 21
or older, of any race or ethnicity, residing within an eligible household in either Letcher
or Harlan counties. Eligible households consisted of single-family residences, apartment
housing, or mobile homes. One adult participant was recruited per household. If an adult
in the household reported having asthma, COPD, black lung or other respiratory health
condition, he or she was encouraged to serve as the participant for that household. If the
person with respiratory disease declined to participate and another adult household
member without a respiratory condition was eligible, then that person was recruited for
the study.
Geographic Site and Enrollment of Study Participants
We used an adaptive stratified cluster sampling technique to select small
geographic areas in Harlan and Letcher counties to be the sampling units. We defined

14
candidate ‘hollows’ using GIS map layers representing the boundaries of 14-digit
hydrologic unit codes (HUCs). These are the smallest hydrologic units available and
often coincide with residential development patterns in the study region, since streets and
homes are often ordered in linear fashion along narrow valleys. We calculated the
following metrics to characterize each HUC in ArcGIS: 1) surface mining, as a percent of
HUC total surface area; 2) underground mining, as a percent of HUC total surface area;
3) road miles per square mile; 4) coal haul route miles per square mile; and 5) oil and gas
wells per square mile. We then summed these ordinal values to create an index of overall
environmental risk to respiratory health. The index was divided into tertiles of high,
medium, and low presumptive exposure levels to the five sources of airborne particulates
above. The final set of around 30 HUCs (hollows) was selected in each county.
Homes were enumerated on-the-ground within the HUCs by field staff. Within each
hollow, homes were sampled by dividing the total number of homes by an appropriate
fraction to yield at least 10 homes per hollow for the study. Eligible homes were selected
using a random starting point and systematic sample of every nth home. Each selected
home had its GPS coordinates logged using a QStarz GPS data logger. The GPS data
were linked with the household survey data and the environmental sampling data so that
we were able to develop maps and integrate other datasets with the final epidemiologic
files.
HUCs with insufficient residences to yield at least 10 eligible households were
eliminated from the sample and randomly selected replacement HUCs were provided to
the field staff. Nine replacement HUCs were identified through a two-step process that
included random selection followed by rooftop survey using Google satellite imagery.

15
Data Collection
Community Health Workers (CHW), most with previous experience in
community-based research, were hired for recruiting and data collection. CHWs recruited
selected households for the study. Household contact forms which collected demographic
information and respiratory health status for each member of the household were entered
into a database for tracking of response and participation rates. Details of the field
operations for the MAP study are described in May et al.32 One CHW was responsible for
recruiting, obtaining informed consent, and using GPS to locate the home. Others were
assigned to recruited households to administer the questionnaire and collect spirometry.
Data were collected on iPads using the Redcap survey software. Participants received $40
for survey completion. Interviewers used REDCap for all data collection. The REDCap
database, stored and backed up on servers, was exported to SAS datasets.
The survey, which took approximately 40 minutes to administer, focused on established
and potential risk factors for respiratory health outcomes, and obtained data on current
and past symptoms of respiratory health over the past 2 to 12 months before the survey.
Questions were drawn primarily from established questionnaires, including the ISAAC
questionnaire on wheezing and asthma, the Medical Research Council symptom-based
questionnaire, and the Seattle Healthy Homes I baseline questionnaire.33-37 Family history
of respiratory disease, allergies, chronic conditions, and eczema was obtained. We
assessed chemical and biological environmental triggers, focusing on environmental
tobacco smoke (ETS), pesticides, VOCs, dust mites, molds, rodent and cockroach feces,
and animal dander; home heating (wood, coal, gas, space heaters, etc.), home cooking
(electric, wood, gas, oil), indoor smoking, pets, molds, and dampness. Detailed
16
information was obtained on demographic and lifestyle factors (education, marital status,
employment status, occupational exposures, dietary intake, alcohol consumption, and
tobacco use). At the time of the interview, pulmonary function tests were also
administered to all participants who did not report a stroke or myocardial infarction in the
past 30 days. At a later date, a convenience subsample of 72 participants received indoor
air quality and exposure assessment to quantify fine particulates and record in-home and
outdoor exposure sources. For the analysis in this paper, we deleted the subjects with
obstructed spirometry, defined as the presence of an FEV1/FVC ratio less than 0.70.
Spirometry testing was completed for all participants using the Easy On PC®
Spirometer, ndd Medical Technologies Inc., Andover, MA. NHANES prediction
equations, which are programmed into the Easy On PC spirometers (ndd), were used to
calculate the percent predicted lung function levels. These require the input of age,
height, and race/ethnicity (White, Black, Hispanic). Spirometry results were sent for
central review for quality control assurance and adjudication of results. Study participants
performed three to eight efforts, with appropriate coaching by the research coordinators.
Every spirometric effort was assessed and the initial quality assessment was over read by
the central reader. Only results with quality grades of A, B, C, and D were used in the
data analysis. Importantly, the presence of obstruction on spirometry was determined by
the presence of an FEV1/FVC ratio less than 0.70. Presence of restriction was determined
by the presence of an FEV1/FVC ratio greater than or equal to 0.70 with an FEV1 less
than 80% of the predicted value.

17
Statistical Analysis
Frequency distributions of the demographic characteristics of our sample of
respondents were calculated using SAS v9.6 (SAS Institute, Inc.). The health outcome
variable, restricted spirometry, was highly prevalent (>10%) in our sample.
Consequently, log-binomial regression, a generalized linear method with a link function,
to calculate prevalence ratios (PRs) adjusted for multiple covariates.
Results
Table 1 shows the prevalence of restricted spirometric pattern by selected
characteristics of the study participants stratified by gender. A total of 685 individuals
participated in the study comprising 424 women and 261 men with a prevalence in
restricted spirometry of 24.3% and 30.6%, respectively. Age appears to be a factor
significantly affecting the prevalence of restricted spirometry for both men and women.
Hence, the prevalence of restricted spirometry among women age 35 to 64 was 23.9%, and
there was a 65% increase in the prevalence (PR: 1.65, 95% CI: 1.20-2.29) of restricted
spirometry compared to women aged 18 to 34 years. The prevalence of restricted
spirometry among men age 35 to 64 years was 31.4%, and there was greater than 2.5-fold
increase in the prevalence (PR: 2.52, 95% CI 1.06 to 5.95) of restricted spirometry
compared to men aged 18 to 34 years. Age group ≥65 continued to be significant for
restricted spirometry risk for both genders, but much more significant for women as the
prevalence (PR: 10.9, 95% CI 3.5 to 33.9) increased more than 10-fold with a 39.5%
prevalence compared to women 18 to 34 years.
Marriage or living as married appeared to be protective for women having restricted
spirometry, but no such association was seen for men. In this population, there was no

18
strong association between socioeconomic factors such as education level or household
annual income, although lower prevalences were observed among the more highly
educated. Obesity (BMI: 30+ kg/m2) appears to be significantly associated with restricted
spirometry risk for both women (PR: 2.91, 95% CI 1.47 to 5.76) and men (PR: 3.04, 95%
CI 1.30 to 7.12) when compared to people in the normal BMI ranges. Several
comorbidities, such as coronary artery disease (CAD) or ever having a heart attack, were
also significantly related to having restricted spirometry for both men and women.
Particularly with women, two or more comorbid conditions appear to be significant for
restricted spirometry risk as the prevalence (PR: 2.62, 95% CI 1.74 to 3.94) increased 360%
when compared to women who had no comorbidities. Other characteristics in Table 1 did
not appear to have any statistically significant effect with restricted spirometry.
Table 2 shows the effect of environmental and occupational factors on restricted
spirometry prevalence. Women and men who were disabled had the highest prevalence of
restricted spirometry at 48.0% and 37.9%, respectively. The prevalence of restricted lung
dysfunction of women who spent no time outside the home each day was 37.2%, and there
was a 3.5-fold increase in the prevalence (PR: 3.42, 95% CI 1.93 to 5.99) compared to
women who spent ≥ 8 hrs outside the home each day. In addition, the prevalence of
restricted lung dysfunction of women who spent 1 to 3 hours outside the home each day
was 30.4% and there was a 1.8 fold increase in the prevalence (PR: 2.77, 95% CI 1.59 to
4.84) compared to women who spent ≥ 8 hrs outside the home each day.
The prevalence of restricted spirometry was elevated amongst women who had a history
of working in underground and surface coal mining. Although only four women had ever
worked as underground coal miners, three of them had restricted spirometry, a prevalence

19
of 75% (PR: 3.15, 95% CI 1.74 to 5.68). The prevalence of restricted spirometry among
the very few women who had ever worked in logging, roadway construction, and building
was also increased, significantly so for the 2 out of 3 women who had worked in roadway
construction. However, the prevalence of restricted spirometry was actually decreased for
men who had worked in these trades.
Overall, there was no significant association with the environmental parameters
studied and restricted spirometry, except for men in the middle quartile of abandoned
underground mining, % HUC area, who had a prevalence of 39.6% with a prevalence ratio
of 1.72 (95% CI 1.09 to 2.73) when compared to the lowest quartile of abandoned
underground mining, % HUC area.
Table 3 shows the adjusted restricted spirometry prevalence by selected variables.
Among women age 35-64, there was more than a 5-fold increase in the adjusted prevalence
(PR: 5.49, 1.69 to 17.8, p=0.005) for restrictive spirometry compared to women age 18 –
34 years. With women over age 65, there was more than a 7-fold increase in the adjusted
prevalence (PR: 7.23, 2.20 to 23.7, p=0.001) for restricted spirometry compared to women
age 18 – 34 years. There was no statistically significant difference in the prevalence for
men cross the three age groups. With single, widowed, or divorced women, there was 1.8
times increase in the adjusted prevalence (PR: 1.78, 95% CI 1.02 to 3.10, p=0.043) for
restrictive spirometry, but there was no association for this variable in men. In the adjusted
model, obesity continued to show significance with restricted spirometry for both women
and men. Obese women had over a two-fold increase in the adjusted prevalence ratio
(women PR: 2.21, 95% CI 1.05 to 4.64, p=0.036) of restricted spirometry compared to
women with normal. Obese men had a 1.7-fold increase in the adjusted prevalence ratio

20
(PR: 2.68, 95% CI 1.05 to 6.80, p=0.039) of restricted spirometry compared to men with
normal BMI. One and two or more comorbidities in women continued to be significant for
restrictive spirometry, but not in men. There were no strong associations between
occupation or environmental exposure categories, for either men or women, and restrictive
spirometry. Table 4 provides the final adjusted model for the most important variables
associated with restricted spirometry.
Discussion
This is the first known study that primarily focuses on determining the prevalence
of restricted spirometry patterns in Appalachian regions of eastern Kentucky and evaluates
how the prevalence differs in gender by various demographic, occupational, and
environmental exposure factors. Nearly 1000 people participated in this cross-sectional
study (n=972), which was the target population size, but a larger cohort would have
provided greater power to evaluate associations between respiratory patterns and
occupational and environmental exposure categories. The number of participants in this
paper was 685 however, because persons with obstructed spirometry patterns were deleted
and the subject of a separate manuscript.
This study found a high prevalence (26.7%) of restricted spirometry among the
participants in this study, who were drawn from the Appalachian region of eastern
Kentucky which is noted to have among the highest prevalence of lung disease in the U.S.
This prevalence of restricted spirometry may be compared to the Burden of Lung Disease
(BOLD) cross sectional study by Mannino et al38 which found a restricted spirometry
prevalence of 11.7% in men (546/4664) and 16.4% in women (836/5098). Another cross
sectional study by Eriksson et al39 with a comparable sample size (n=642), also found a

21
restricted spirometry prevalence of only 3.1% in men (10/321) and 2.8% in women (9/321).
Other aforementioned epidemiological studies that assessed restricted spirometry
prevalence also had substantially lower prevalence among men and women.12,13
The reason for the much higher restricted spirometry prevalence in eastern
Appalachian regions is likely multifactorial. In our study, participants also had high
prevalence of cardiovascular disease, diabetes, and obesity. As the literature indicates,
these conditions are strongly associated with restricted spirometry patterns.38,40 The
etiology of cardiovascular diseases leading to restricted spirometry may be associated with
inflammatory conditions that cause endothelial dysfunction with reduced airflow in the
lung and lung capacity. An association between restricted spirometry patterns and diabetes
may be associated with its association with obesity, vascular disease, and neuromuscular
weakness. Increased waist circumference from large amounts of visceral and subcutaneous
fat around the central body region can decrease lung volume by reducing diaphragm and
thoracic cage mobility.40 However, in the Third National Health and Nutrition to
Examination Survey (NHANES), only 9% of individuals in the obese category (BMI: 30+
kg/m2) were found to have restricted spirometry.41 Therefore, the increased prevalence of
restricted spirometry patterns in this population from two counties in Eastern Kentucky is
likely to be due at least in part to the high prevalence of obesity, and comorbid conditions.
Individuals age 35 – 64 and ≥ 65 years were more likely to have an increased restricted
spirometry prevalence compared with individuals age 18 – 34 years of age. Although,
results were only statistically significant for women age 35 - 64 and ≥ 65, they reflect
previous literature.38,42 Women married or living as married served as a protective factor
for restricted spirometry and was statistically significant. We suspect that being married

22
may be associated with better overall health outcomes or better controlled risk factors
associated with restricted spirometry. This suspicion is supported by Waldrone et al43 who
reported lower morbidity and mortality rates among married couples, along with better
physical and mental health compared with individuals who were not married.
Higher educational attainment also served as a protective factor for restricted
spirometry in both women and men which has been found in other studies.5,42 In NHANES
1988 – 1994, individuals who had at least some college education were significantly less
likely to have a restricted spirometry pattern (OR: 0.62, 95% CI: 0.42 to 0.90).42 Sperandio
et al5 also reported a substantially lower prevalence of respiratory lung disease in
individuals with restrictive patterns on spirometry who reported yes to higher education
completion compared with individuals with restrictive patterns on spirometry who reported
no to higher education completion. We suspect individuals with higher educational
attainment are less likely to have the potential risk factors (e.g., CVD, obesity, hazardous
occupational exposure, etc.) that may be associated with restricted spirometry.
One of our more compelling findings was that smoking did not have a strong effect
on restricted spirometry prevalence; this finding is not congruent with the literature. For
example, current smokers from NHANES 1988 -1994 were 31% more likely to have a
restricted spirometry pattern compared to never smokers (OR: 1.31, 95% CI: 1.04 – 1.65).42
In addition, current smokers from NHANES 1998 – 1994 were 89% more likely to have
moderate to more severe restrictive patterns (FVC < lower limits of normal (LLN),
FEV1/FVC > LLN, FEV1 < 70%) compared to never smokers from 1988 – 1994 (OR: 1.89,
95% CI: 1.24 – 2.86).42 Schoenberg et al44 reported women and men from Appalachian
Kentucky smoke cigarettes at rates 1.8 times and 1.6 times higher, respectively, compared

23
to their national counterparts. Therefore, we would expect a higher restricted spirometry
prevalence in Letcher and Harlan counties associated with a higher prevalence of cigarette
smoking.
Importantly, our study is subject to limitations. Selection bias was introduced into
our study when we encouraged individuals with underlying respiratory disease (e.g.,
asthma etc.) to serve as the participants representing the household. So, our cohort may not
be representative of Letcher or Harlan County as it may undermine external validity. It may
have also overestimated RSP prevalence. Spirometry is a useful test in occupational health
evaluations to rule out restrictive lung patterns with acceptable accuracy.4 However, it is
incapable of determining TLC which is performed by lung plethysmography and known to
be the gold standard for determining RSPs.4
The primary hypotheses in our study were that the prevalence of lung diseases
among participants in these two Eastern Kentucky counties would be associated with
environmental exposures, mainly living near coal mines or mining activities. However, no
statistically significant associations with either selected environmental, or occupational,
exposure factors with restricted spirometry prevalence was found. Regarding our
occupational exposure factors, this in line with previous literature. The NHANES 2007 –
2010 also found no statistically significant associations between occupational exposure
factors and restricted lung disease prevalence (OR:1.05, 95% CI: 0.81 – 1.35).42 The lack
of low adjusted RSP prevalence mean estimates in our study with occupational and
environmental factors may reflect employers, health officials, and workers in Appalachian
Kentucky adopting and adhering to appropriate preventative measures (e.g., strict
compliance of OSHA safety and health standards, appropriate personal protective

24
equipment etc.). Further research looking at occupational and environmental factors are
needed to further classify their relationship with RSP.

25

26

27

28

29

30

31
References 1. Backman H, Eriksson B, Hedman L, et al. Restrictive spirometric pattern in the
general adult population: Methods of defining the condition and consequences on prevalence. Respiratory Medicine. 2016;120:116-123.
2. Godfrey MS, Jankowich MD. The Vital Capacity Is Vital: Epidemiology and Clinical Significance of the Restrictive Spirometry Pattern: Epidemiology and Clinical Significance of the Restrictive Spirometry Pattern. Chest. 2016;149(1):238-251.
3. Johnson JD, Theurer WM. A stepwise approach to the interpretation of pulmonary function tests. American family physician. 2014;89(5):359-366.
4. Mehrparvar AH, Sakhvidi MJZ, Mostaghaci M, Davari MH, Hashemi SH, Zare Z. Spirometry values for detecting a restrictive pattern in occupational health settings. TANAFFOS - Journal of Respiratory Disease, Thoracic Surgery, Intensive Care and Tuberculosis. 2014;13(2):27-34.
5. Sperandio EF, Arantes RL, Matheus AC, et al. Restrictive pattern on spirometry: association with cardiovascular risk and level of physical activity in asymptomatic adults. Jornal Brasileiro de Pneumologia. 2016;42(1):22-28.
6. Jankowich M, Elston B, Liu Q, et al. Restrictive Spirometry Pattern, Cardiac Structure and Function, and Incident Heart Failure in African Americans. The Jackson Heart Study. Annals of the American Thoracic Society. 2018;15(10):1186-1196.
7. Scwartzstein RM. Chest wall diseases and restrictive physiology. Waltham, Massachusetts: UpToDate; 2019.
8. King TE. Approach to the adult with interstitial lung disease: Clinical evaluation. Waltham, Massachusetts: UpToDate; 2019.
9. Cohen RAC, Patel AHY, Green FHY. Lung Disease Caused by Exposure to Coal Mine and Silica Dust. Seminars In Respiratory And Critical Care Medicine. 2008;29(6):651-661.
10. Checkoway H, Heyer NJ, Seixas NS, et al. Dose-response associations of silica with nonmalignant respiratory disease and lung cancer mortality in the diatomaceous earth industry. American journal of epidemiology. 1997;145(8):680-688.
11. Schatzel SJ. Identifying sources of respirable quartz and silica dust in underground coal mines in southern West Virginia, western Virginia, and eastern Kentucky. International journal of coal geology. 2009;78(2):110-118.
12. El Zoghbi M, Salameh P, Stücker I, et al. Prevalence of occupational exposure to asbestos and crystalline silica according to phenotypes of lung cancer from the CaProMat study: A case‐ only study. American Journal of Industrial Medicine. 2018;61(1):85-99.
13. Perret JL, Plush B, Lachapelle P, et al. Coal mine dust lung disease in the modern era. In. Vol 22. Chichester, UK2017:662-670.
14. Reynolds LE, Blackley DJ, Laney AS, Halldin CN. Respiratory morbidity among U.S. coal miners in states outside of central Appalachia. American Journal of Industrial Medicine. 2017;60(6):513-517.
32
15. Blackley DJ. Resurgence of progressive massive fibrosis in coal miners—Eastern Kentucky, 2016. Morbidity and mortality weekly report : MMWR /. 2016;65(49):1385.
16. Ingelfinger JR, Feller-Kopman D, Light R. Pleural Disease. The New England Journal of Medicine. 2018;378(8):740-751.
17. King TE. Asbestos-related pleuropulmonary disease. Waltham, MA: UpToDate; 2020.
18. Gulati AM, Redlich AC. Asbestosis and environmental causes of usual interstitial pneumonia. Current Opinion in Pulmonary Medicine. 2015;21(2):193-200.
19. Lazarus AA, Philip A. Asbestosis. Dm Disease-A-Month. 2011;57(1):14-26. 20. O'Reilly K, McLaughlin A, Beckett W, Sime P. Asbestos-Related Lung Disease.
American Family Physician. 2007;75(5):683-690. 21. Peiris-John RJ, Ruberu DK, Wickremasinghe AR, van-Der-Hoek W. Low-level
exposure to organophosphate pesticides leads to restrictive lung dysfunction. Respiratory Medicine. 2005;99(10):1319-1324.
22. Feng W, Huang X, Zhang C, et al. The dose-response association of urinary metals with altered pulmonary function and risks of restrictive and obstructive lung diseases: a population-based study in China. BMJ open. 2015;5(5):e007643.
23. Newman LS, Maier LA. Chronic beryllium disease (berylliosis). Waltham, MA: UpToDate; 2020.
24. Gartman EJ. Pulmonary Function Testing in Neuromuscular and Chest Wall Disorders. Clinics in Chest Medicine. 2018;39(2):325-334.
25. Sharma GD. Pulmonary function testing in neuromuscular disorders. Pediatrics. 2009;123 suppl 4(Supplement 4):S219-S221.
26. Mannino DM, Buist AS, Petty TL, Enright PL, Redd SC. Lung function and mortality in the United States: data from the First National Health and Nutrition Examination Survey follow up study. Thorax. 2003;58(5):388.
27. Mannino DM, Doherty DE, Sonia Buist A. Global Initiative on Obstructive Lung Disease (GOLD) classification of lung disease and mortality: findings from the Atherosclerosis Risk in Communities (ARIC) study. Respiratory Medicine. 2006;100(1):115-122.
28. Leone N, Courbon D, Thomas F, et al. Lung function impairment and metabolic syndrome: the critical role of abdominal obesity. American journal of respiratory and critical care medicine. 2009;179(6):509.
29. Guerra S, Sherrill DL, Venker C, Ceccato CM, Halonen M, Martinez FD. Morbidity and mortality associated with the restrictive spirometric pattern: a longitudinal study. Thorax. 2010;65(6):499.
30. Lee HM, Chung SJ, Lopez VA, Wong ND. Association of FVC and Total Mortality in US Adults With Metabolic Syndrome and Diabetes. Chest. 2009;136(1):171-176.
31. Blackley DJ, Halldin CN, Laney AS. Continued Increase in Prevalence of Coal Workers' Pneumoconiosis in the United States, 1970-2017. American journal of public health. 2018;108(9):1220.

33
32. May BA, Cardarelli KM, Silver R, Christian WJ, Schoenberg NE, Browning SR. Hollows as sampling units for community-based participatory research in appalachia: The mountain air project. Progress in Community Health Partnerships: Research, Education, and Action. 2019;13(4):401-410.
33. Krieger J, Takaro TK, Song L, Beaudet N, Edwards K. A randomized controlled trial of asthma self-management support comparing clinic-based nurses and in-home community health workers: the Seattle-King County Healthy Homes II Project. Arch Pediatr Adolesc Med. 2009;163(2):141-149.
34. Krieger JK, Takaro TK, Allen C, et al. The Seattle-King County healthy homes project: implementation of a comprehensive approach to improving indoor environmental quality for low-income children with asthma. Environ Health Perspect. 2002;110 Suppl 2:311-322.
35. Krieger JW, Takaro TK, Song L, Weaver M. The Seattle-King County Healthy Homes Project: a randomized, controlled trial of a community health worker intervention to decrease exposure to indoor asthma triggers. Am J Public Health. 2005;95(4):652-659.
36. Braun-Fahrlander C, Gassner M, Grize L, et al. Comparison of responses to an asthma symptom questionnaire (ISAAC core questions) completed by adolescents and their parents. SCARPOL-Team. Swiss Study on Childhood Allergy and Respiratory Symptoms with respect to Air Pollution. Pediatr Pulmonol. 1998;25(3):159-166.
37. Valle SO, Kuschnir FC, Sole D, Silva MA, Silva RI, Da Cunha AJ. Validity and reproducibility of the asthma core International Study of Asthma and Allergies in Childhood (ISAAC) written questionnaire obtained by telephone survey. J Asthma. 2012;49(4):390-394.
38. Mannino DM. Restricted spirometry in the Burden of Lung Disease Study. The International Journal of Tuberculosis and Lung Disease. 2012;16(10):1405-1411.
39. Eriksson B, Lindberg A, Müllerova H, Rönmark E, Lundbäck B. Association of heart diseases with COPD and restrictive lung function – Results from a population survey. Respiratory Medicine. 2013;107(1):98-106.
40. Kurth L, Hnizdo E. Change in prevalence of restrictive lung impairment in the U.S. population and associated risk factors: the National Health and Nutrition Examination Survey (NHANES) 1988-1994 and 2007-2010. Multidisciplinary respiratory medicine. 2015;10(1):7-7.
41. Mannino DM, Ford ES, Redd SC. Obstructive and restrictive lung disease and markers of inflammation: data from the third national health and nutrition examination. The American Journal of Medicine. 2003;114(9):758-762.
42. Kurth L, Hnizdo E. Change in prevalence of restrictive lung impairment in the U.S. population and associated risk factors: the National Health and Nutrition Examination Survey (NHANES) 1988–1994 and 2007–2010. Multidisciplinary Respiratory Medicine. 2015;10(1).
43. Waldron I, Hughes ME, Brooks TL. Marriage protection and marriage selection—Prospective evidence for reciprocal effects of marital status and health. Social Science & Medicine. 1996;43(1):113-123.

34
44. Schoenberg EN, Huang CB, Seshadri CS, Tucker CT. Trends in Cigarette Smoking and Obesity in Appalachian Kentucky. Southern Medical Journal. 2015;108(3):170-177.