prevalence of preclinical alzheimer disease - n.neurology.org ·...
TRANSCRIPT

ARTICLE OPEN ACCESS
Prevalence of preclinical Alzheimer diseaseComparison of current classification systems
Silke Kern, MD, PhD, Henrik Zetterberg, MD, PhD, Jurgen Kern, MD, PhD, Anna Zettergren, PhD,
Margda Waern, MD, PhD, Kina Hoglund, PhD, Ulf Andreasson, PhD, Hanna Wetterberg, MSc,
Anne Borjesson-Hanson, MD, PhD, Kaj Blennow, MD, PhD, and Ingmar Skoog, MD, PhD
Neurology® 2018;90:e1682-e1691. doi:10.1212/WNL.0000000000005476
Correspondence
Dr. Kern
AbstractObjectiveTo determine the prevalence of preclinical Alzheimer disease (AD) according to currentclassification systems by examining CSF from a representative general population sample of70-year-olds from Gothenburg, Sweden.
MethodThe sample was derived from the population-based H70 Gothenburg Birth Cohort Studies inGothenburg, Sweden. The participants (n = 322, age 70 years) underwent comprehensiveneuropsychiatric, cognitive, and somatic examinations. CSF levels of β-amyloid (Aβ)42, Aβ40,total tau, and phosphorylated tau were measured. Preclinical AD was classified according tocriteria of the A/T/N system, Dubois 2016, National Institute on Aging–Alzheimer’s Associ-ation (NIA-AA) criteria, and International Working Group-2 (IWG-2) criteria. Individualswith Clinical Dementia Rating score >0 were excluded, leaving 259 cognitively unimpairedindividuals.
ResultsThe prevalence of amyloid pathology was 22.8%, of total tau pathology was 33.2%, and ofphosphorylated tau pathology was 6.9%. With the A/T/N system, the prevalence of A+/T−/N− was 13.1%, A+/T−/N+ was 7.3%, A+/T+/N+ was 2.3%, A−/T−/N+ was 18.9%, and A−/T+/N+ was 4.6%. When the Dubois criteria were applied, the prevalence of asymptomatic atrisk for ADwas 36.7% and of preclinical ADwas 9.7%.With the NIA-AA criteria, the prevalenceof stage 1 was 13.1% and stage 2 was 9.7%. With the IWG-2 criteria, the prevalence ofasymptomatic at risk for AD was 9.7%. The APOE e4 allele was associated with several of thecategories. Men more often had total tau pathology, A+/T−/N+, preclinical AD according toDubois 2016, asymptomatic at risk for AD according to the IWG-2 criteria, andNIA-AA stage 2.
ConclusionThe prevalence of pathologic AD markers was very common (46%) in a representative pop-ulation sample of 70-year-olds. The clinical implications of these findings need to be scrutinizedfurther in longitudinal studies.
From the Department of Neuropsychiatric Epidemiology Unit (S.K., J.K., A.Z., M.W., H.W., A.B.-H., I.S.) and Clinical Neurochemistry Laboratory (S.K., H.Z., K.H., U.A., K.B.,), Departmentof Psychiatry and Neurochemistry, Institute of Neuroscience and Physiology, Sahlgrenska Academy at the University of Gothenburg, Sweden; and UCL Institute of Neurology (H.Z.),Queen Square, London, UK.
Go to Neurology.org/N for full disclosures. Funding information and disclosures deemed relevant by the authors, if any, are provided at the end of the article.
The Article Processing Charge was funded by Swedish Research Council.
This is an open access article distributed under the terms of the Creative Commons Attribution License 4.0 (CC BY), which permits unrestricted use, distribution, and reproduction in anymedium, provided the original work is properly cited.
e1682 Copyright © 2018 The Author(s). Published by Wolters Kluwer Health, Inc. on behalf of the American Academy of Neurology.

The hallmarks of Alzheimer disease (AD) include the aggre-gation of β-amyloid (Aβ) into plaques, the hyper-phosphorylation of tau protein with the formation of tangles,and brain atrophy.1 In neuropathologic series, a largeproportion of cognitively normal elderly have Alzheimerpathology.2 In the Cognitive Function and Ageing (CFAS)population study, one-fifth of elderly without dementia ful-filled neuropathologic criteria for AD, and one-third hadmoderate to severe plaque pathology.3 The correspondingfigure in those with dementia was 59%.3 PET studies reportamyloid pathology in ≈30% of healthy elderly from control orconvenience samples.4–7 CSF studies show frequenciesranging from 12% to 36%.8–11
Most data are derived from convenience samples, e.g., normalcontrols from memory clinics or volunteers. Data from rep-resentative samples are needed to clarify the populationprevalence of preclinical AD pathology.
Biomarkers reflecting the accumulation of Aβ deposition arethe earliest sign of AD in healthy elderly.12,13 Aβ pathology isdetected earlier in CSF than in PET.12,14 Brain autopsy andbiomarker studies indicate that amyloid pathology is initiated≈10 to 20 years before clinical symptoms.15 Presently, there are4 different classifications in use for preclinical AD. The mostrecent, the A/T/N system, was introduced in 2016.16 Theconsensus group–defined criteria for preclinical AD (Duboiscriteria)17 came in 2016, the International Working Group-2(IWG-2) criteria7 in 2014, and the National Institute onAging–Alzheimer’s Association (NIA-AA) criteria18,19 in 2011.The only classification that differentiates between phosphor-ylated (p)-tau and total (t)-tau is the A/T/N system. Theprevalence of preclinical AD in accordance with these differentclassification systems needs to be elucidated in representativepopulation samples. The aim of the current study was to de-termine the prevalence of preclinical AD in accordance withthe 4 current classification systems based on CSF data froma representative population-based sample of 70-year-olds.
MethodsThe baseline sample was derived from the 2014 to 2016examinations of the H70 Gothenburg Birth Cohort Studies inGothenburg, Sweden. The sample was obtained from theSwedish Population Registry and included persons living inprivate households and individuals in residential care.20
Every 70-year-old in Gothenburg, Sweden, born during1944 on prespecified birthdates was invited to the exami-nation in 2014 to 2016, and 1,203 participated (responserate 72.2%). Of these, 430 (35.8%) consented to a lumbarpuncture (LP). Contraindications (anticoagulant therapy,immune-modulated therapy, cancer therapy) were presentin 108, leaving 322 (26.8%). CSF volume was insufficientfor 4 participants.
For the purpose of the present study, we defined our studycohort as cognitively unimpaired as operationalized bya Clinical Dementia Rating (CDR) score of 0. Thus, partic-ipants with CDR score >0 (n = 63) were excluded, leaving 259participants with a CDR score of 0.
Standard protocol approvals, registrations,and patient consentsAll participants and/or their close relatives gave written in-formed consent. The study was approved by the RegionalEthics Review Board in Gothenburg.
AssessmentsParticipants were examined at the neuropsychiatric memoryclinic at Sahlgrenska University Hospital in Gothenburg or athome. Experienced psychiatric research nurses performed theneuropsychiatric examinations, which comprised ratings ofpsychiatric symptoms and signs, and tests of mental func-tioning, including assessments of episodic memory (short-term, long-term memory), aphasia, apraxia, agnosia, executivefunctioning, and personality changes.21–23 Key informantinterviews were performed by psychiatric research nurses asdescribed previously.21
Examinations included the Mini-Mental State Examination(MMSE) and the CDR. A geriatric psychiatrist and neurol-ogist (S.K.) assigned the final ratings.
Dementia was diagnosed according to the DSM-III-R crite-ria21 because these criteria have been used in the Gothenburgstudies for >30 years.
Stroke and TIA information was acquired from self-reportsand key informants. The participants underwent compre-hensive somatic examinations.22 Education, defined in yearsof education, was assessed by self-report or close informantinformation.
GlossaryAβ = β-amyloid; AD = Alzheimer disease; AR-AD = at risk for Alzheimer disease; CDR = Clinical Dementia Rating; CFAS =Cognitive Function and Ageing; DSM-III-R = Diagnostic and Statistical Manual of Mental Disorders, 3rd edition, revised; DSM-V = Diagnostic and Statistical Manual of Mental Disorders, 5th edition; IWG-2 = International Working Group-2; LP = lumbarpuncture; MCI = mild cognitive impairment; MMSE = Mini-Mental State Examination; NIA-AA = National Institute onAging–Alzheimer’s Association; p-tau = phosphorylated tau; SNAP = non–Alzheimer disease pathophysiology; SNP = singlenucleotide polymorphism; t-tau = total tau.
Neurology.org/N Neurology | Volume 90, Number 19 | May 8, 2018 e1683
APOE genotypingThe single nucleotide polymorphisms (SNPs) rs7412 andrs429358 in APOE (gene map locus 19q13.2) were geno-typed, with a success rate of 100%, with the KASPar PCR SNPgenotyping system (LGC Genomics, Hoddesdon, Herts,UK). Genotype data for these 2 SNPs were used to define thee2, e3, and e4 alleles.
CSF sampling and biomarker analysesLPs to collect CSF samples were performed in the L3-4 orL4-5 interspace in the morning.24 The first 10 mL CSF wascollected in a polypropylene tube and immediately trans-ported to the laboratory for centrifugation at 1,800g at 20°Cfor 10 minutes. The supernatant was gently mixed to avoidpossible gradient effects, divided into aliquots in the poly-propylene tubes, and stored at −70°C.10,24
CSF total tau (t-tau) and tau phosphorylated at threonine 181 (p-tau) were determined with a sandwich enzyme-linked immu-nosorbent assay (INNOTEST htau Ag and PHOSPHO_TAU[181P], Fujirebio [formerly Innogenetics], Ghent, Belgium).25,26
CSF Aβ42 was measured with a sandwich enzyme-linked im-munosorbent assay (INNOTEST Aβ1–42) specifically con-structed to measure Aβ starting at amino acid 1 and ending atamino acid 42.27 For the Aβ42/Aβ40 ratio, the V-PLEX AβPeptide Panel 1 (6E10) Kit (Meso Scale Discovery, Rockville,MD) was used.28 All assays are included in the panel of clinicalroutine analyses at the Molndal Clinical Neurochemistry labo-ratory. Analytic runs had to pass quality control criteria for thecalibrators, and internal quality control samples had to be ap-proved. The CSF cutoffs in this study were as follows: CSF Aβ42levels ≤530 pg/mL, CSF t-tau levels ≥350 pg/mL, and p-taulevels ≥80 pg/mL.10
A/T/N classificationAccording to the A/T/N classification scheme,16 each par-ticipant was classified into 3 binary categories. A refers to Aβpathology (CSF Aβ42 levels ≤530 pg/mL), T to pathologicp-tau (CSF p-tau ≥80 pg/mL), and N to neurodegenerationbiomarker (CSF t-tau ≥350 pg/mL). Participants can have 8possible biomarker combinations.
The Dubois 2016 criteriaIn accordance with the criteria from Dubois et al.,17 personswith both amyloid and tau pathology were classified as havingpreclinical AD. Cognitively normal participants (i.e., CDRscore 0) with either amyloid pathology or tau pathology areconsidered to be at risk for AD (AR-AD).
IWG-2 criteriaAccording to the IWG-2 criteria,7 asymptomatic at risk for ADis defined as cognitively normal persons (i.e., CDR score 0)with Alzheimer pathology (here defined as CSF Aβ42 levels≤530 pg/mL) and pathologic CSF t-tau or p-tau (CSF t-taulevels ≥350 pg/mL or p-tau levels ≥80 pg/mL). We were notable to use the IWG-2 criteria of increased retention offibrillary amyloid PET.
NIA-AA criteriaThe NIA-AA criteria for preclinical AD include 3 stages. Stage1 refers to asymptomatic individuals with abnormal amyloidmarkers; stage 2 refers to asymptomatic individuals withabnormal amyloid and injury markers (markers of neuro-degeneration such as high CSF t-tau or p-tau, neuronal dys-function on fluorodeoxyglucose-PET, cortical thinning, andhippocampal atrophy on MRI); and stage 3 refers to indi-viduals with subtle cognitive changes and abnormal amyloidand injury markers.18 An additional category, suspected non-AD pathophysiology (SNAP), defined as abnormal tauopathywithout amyloidopathy, was later suggested.19 In our study,only stage 1, stage 2, and SNAP were included; all were basedon CSF injury markers only.
Overlap between currentclassifications systemsThe following categories coincide here:
1. A+/T−/N−, A−/T−/N+ or A−/T+/N−, or A−/T+/N+;AR-AD according to Dubois 2016; and the combinationof SNAP (isolated tauopathy) and stage 1 (isolatedamyloidopathy) in the NIA-AA criteria.
2. A+/T+/N−, A+/T−/N+, or A+/T+/N+ according toA/T/N; preclinical AD in the Dubois criteria; stage 2 ofthe NIA-AA criteria; and asymptomatic at risk for ADaccording to the IWG-2 criteria.
3. A+/T−/N− and stage 1 according to the NIA-AA criteria.4. Total pathology of Dubois 2016 criteria and the NIA-AA
criteria.
Statistical methodsDifferences in proportions and means were tested with theFisher exact test and t test.
To address the concern that the prevalence figure could bebiased because only 36% consented to an LP, we used pro-pensity score weighting. First, we conducted a binary re-gression model in those with CDR score of 0 in the totalsample to identify variables that predicted participation inCSF. We considered male sex, education, depressionaccording to DSM-V, self-reported stroke, age, systolic bloodpressure, living alone, and income. In a final model, we usedmale sex, education, depression according to DSM-V, andself-reported stroke. From this, a probability of accepting theCSF was calculated for each person, and the inverse of thisprobability defined the weights to be used in a weighted cal-culation of the sample prevalence. The weighted prevalenceswere very similar to the unweighted (see Results). Becausethese differences were regarded as trivial, we chose to useunweighted prevalences for the sake of clarity.
A 2-tailed level of significance was used (p < 0.05). Statisticalanalyses were completed with SPSS forWindows (version 17;SPSS, Chicago, IL), SAS (version 9.4; SAS Institute Inc,Cary, NC), or STATA (version 14; StataCorp, CollegeStation, TX).
e1684 Neurology | Volume 90, Number 19 | May 8, 2018 Neurology.org/N

Data availability statementThe authors state that anonymized data on which the article isbased will be shared by request from any qualifiedinvestigator.
ResultsTable 1 gives the baseline characteristics of participants andnonparticipants in the CSF examination. The dementiaprevalence for the entire sample was 2.3% (n = 28).
Those who were excluded from the LP because of contra-indications (n = 108) were similar regarding age, sex, MMSEscore, living alone, years of education, economic status, andprevalence of dementia and depression, but they had moreoften had strokes and had lower mean systolic and diastolicblood pressures than participants with CSF data (table 1).Among those with CSF, 259 (80.4%) had a CDR score of 0,60 (18.6%) had a CDR score of 0.5, and 3 (0.009%) hada CDR score of 1. Participants with CSF were similar to therest of the sample regarding age, MMSE score, mean systolicand diastolic blood pressures, education, economic status,living alone, and prevalence of stroke, dementia, and de-pression, but they were more often male (table 1). The co-efficient of variation for the different quality control samplesused for each biomarker assay was in the interval of 3.6% to9.9% (table e-1, links.lww.com/WNL/A424). The CSF bio-marker levels, ranges, and variations are given in table e-2. Thedistributions for Aβ42, t-tau, and p-tau were slightly skewed;therefore, the mean and median were provided. Aβ40 was
normally distributed. The distributions for Aβ42, t-tau, andp-tau were similar to those seen in Alzheimer’s DiseaseNeuroimaging Initiative 29 (table e-2).
Despite the small number, those with dementia (n = 5) hada lower mean level of Aβ42 ( 428.2 vs 718.9 ng/L, p = 0.004),lower Aβ40 level (4,781.8 vs 6,220.3 pg/mL, p = 0.02), lowerAβ42/Aβ40 ratio (0.55 vs 0.87), higher t-tau level (531.2 vs331.1 ng/L, p = 0.001), and higher p-tau level (67.6 vs49.4 ng/L, p = 0.021) than those without dementia (table e-2,links.lww.com/WNL/A424).
Among those without dementia, there was no difference be-tween those with a CDR score of 0.5 (n = 57) and those witha CDR score of 0 (n = 259) in Aβ42 (697.4 vs 724.5 ng/L, p =0.41), Aβ40 (6,052.7 vs 6,250.9 pg/mL, p = 0.31), Aβ42/Aβ40ratio (0.86 vs 0.88, p = 0.53) t-tau (328.3 vs 332.0 ng/L, p =0.83), and p-tau (49.1 vs 49.5 ng/L, p = 0.86) levels.
The analyses that follow include only those with a CDR scoreof 0 because a CDR score of 0.5 is an exclusion criterion in allclassifications.
Prevalence of amyloid and tau pathologyAmong those with a CDR score of 0, the prevalence of amyloidpathology was 22.8%, of t-tau pathology was 33.2%, and ofp-tau pathology was 6.9% (table 2). The weighted prevalenceof amyloid pathology was 22.5%, of t-tau pathology was 33.7%,and of p-tau pathology was 7.1%. Because these differencesmust be regarded as trivial, we chose to use unweightedprevalences in the rest of the results for the sake of clarity.
Table 1 Characteristics of a representative population-based sample of 70-year-olds by LP participation status
CSF (n = 322)Excluded from CSF(n = 108)
Declined CSF(n = 772) p Valuea p Valueb p Valuec
Age, mean (SD), y 70.6 (0.3) 70.6 (0.3) 70.5 (0.3) 0.58 0.56 0.12
MMSE score, mean (SD) 28.9 (1.4) 28.7 (2.1) 28.9 (2.3) 0.73 0.68 0.75
Systolic blood pressure, mean (SD) 139.6 (17.2) 132.9 (15.6) 140.6 (20.1) 0.0004 0.42 0.02
Diastolic blood pressure, mean (SD) 79.5 (9.3) 76.6 (8.6) 79.6 (10.2) 0.0037 0.98 0.2
Education, mean (SD), y 12.4 (3.5) 13.1 (3.8) 12.8 (3.8) 0.08 0.096 0.3
Total household income, mean (SD), SEKd 38.130 (21.713) 40.316 (23.249) 38.771 (24.830) 0.42 0.73 0.97
Women, n (%) 155 (48) 47 (43.5) 440 (57.0) 0.44 0.012 0.0014
Living alone, n (%) 111 (34.9) 40 (38.5) 281 (36.9) 0.59 0.60 0.73
Stroke, n (%) 14 (4.4) 20 (18.5) 43 (5.7) 0.00001 0.45 0.18
Dementia, n (%) 5 (1.6) 5 (4.6) 18 (2.3) 0.13 0.56 0.85
Any depression, n (%) 30 (9.3) 5 (4.7) 72 (9.3) 0.19 0.94 0.54
Abbreviations: LP = lumbar puncture; MMSE = Mini-Mental State Examination; SEK = Swedish krona.a Test of the difference in means and proportions between CSF participants (n = 322) and those excluded because of contraindications (n = 108).b Test of difference in means and proportions between CSF participants (n = 322) and participants who declined an LP (n = 722).c Test of difference in means and proportions between all participants who consented to undergo an LP (n = 430) and participants who declined the LP (n =772).d Total gross household income in SEK.
Neurology.org/N Neurology | Volume 90, Number 19 | May 8, 2018 e1685

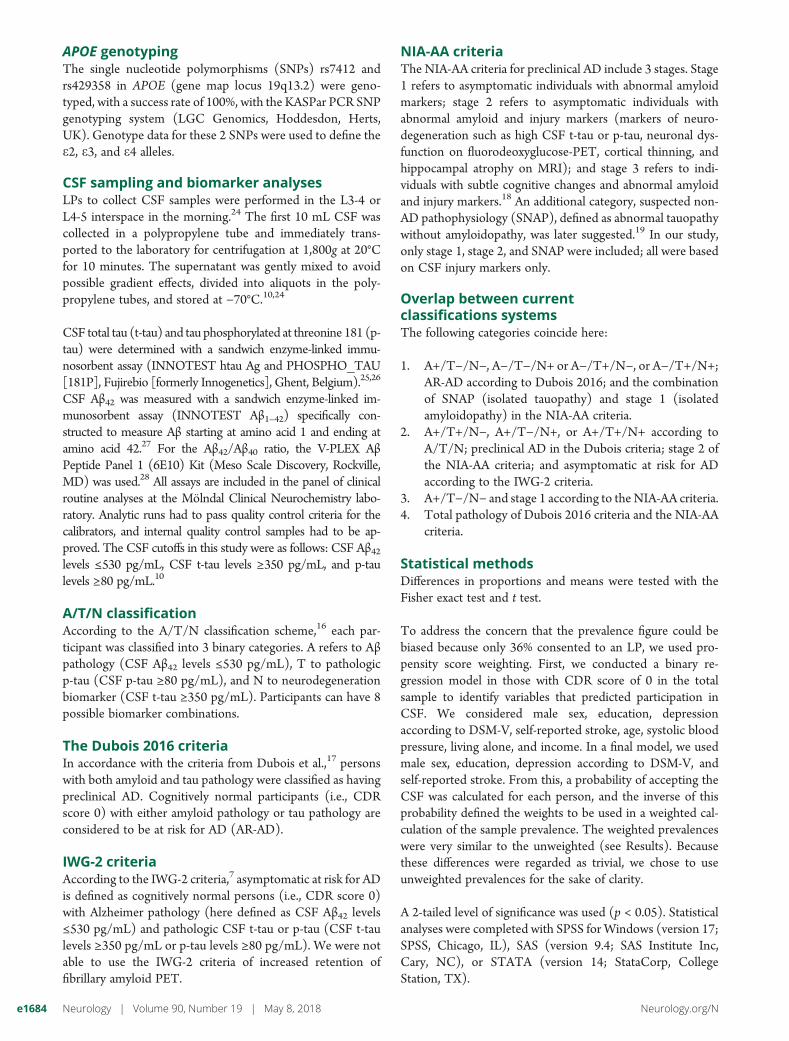
A/T/N systemThe prevalence of A+/T−/N− was 13.1%, of A+/T−/N+ was7.3%, of A+/T+/N+ was 2.3%, of A−/T−/N+ was 18.9%, andof A−/T+/N+ was 4.6%. No participants had the biomarkercombination A+/T+/N− and A−/T+/N− (table 2 anda Venn diagram in the figure).
Dubois 2016 criteriaThe prevalence of AR-AD was 36.7% and the prevalence ofpreclinical AD 9.7%. Thus, in total, 46.4% had AR-AD orpreclinical AD (table 2).
IWG-2 criteriaThe prevalence of asymptomatic at risk for AD according tothe IWG-2 criteria was 9.7% (table 2).
NIA-AA criteriaThe prevalence of NIA-AA stage 1 was 13.1%, of stage 2 was9.7%, and of SNAP was 23.6% (table 2).
The CSF biomarker levels, ranges, and variations in the dif-ferent classification systems are given in table e-3, links.lww.com/WNL/A424.
APOE «4Among persons with a CDR score of 0, APOE e4 allele carrier(n = 86) had lower Aβ42 (606.4 vs 785.3 ng/L, p ≤ 0.0001),lower Aβ42/Aβ40 ratio (0.76 vs 0.94, p < 0.00001), higher t-tau(375.5 vs 311.0 ng/L, p = 0.0005), and higher p-tau (54.6 vs47.1 ng/L, p = 0.0016) levels compared to APOE e4 non-carriers (n = 168) (table e-4, links.lww.com/WNL/A424).
Table 2 Prevalence of amyloid and tau pathology according to the A/T/N classification scheme, Dubois 2016 criteria, IWG-2 criteria, and NIA-AA criteria and in a representative population-based sample of 70-year-olds with a CDR scoreof 0
Men (n = 130) Women (n = 129)
p Valuea
All (n = 259)
n (%) n (%) n (%)
Amyloid pathology 34 (26.2) 25 (19.4) 0.236 59 (22.8)
t-Tau pathology 52 (40.0) 34 (26.4) 0.025 86 (33.2)
p-Tau pathology 9 (6.9) 9 (7.0) 1.00 18 (6.9)
A/T/N classification 2016
A+/T2/N2 15 (11.5) 19 (14.7) 1.0 34 (13.1)
A+/T+/N2 0 (0) 0 (0) 0 (0)
A+/T2/N+ 14 (5.4) 5 (1.9) 0.03 19 (7.3)
A+/T+/N+ 5 (1.9) 1 (0.4) 0.09 6 (2.3)
A2/T+/N2 0 (0) 0 (0) 0 (0)
A2/T2/N+ 29 (11.2) 20 (7.7) 0.10 49 (18.9)
A2/T+/N+ 4 (1.5) 8 (3.1) 0.55 12 (4.6)
Dubois criteria 2016
AR-AD 48 (36.9) 47 (37.4) 0.5 95 (36.7)
Preclinical AD 19 (14.6) 6 (4.7) 0.008 25 (9.7)
IWG-2 criteria 2014b
Asymptomatic at risk for Alzheimer disease 19 (14.6) 6 (4.7) 0.008 25 (9.7)
NIA-AA criteria 2011
Stage 1 15 (11.5) 19 (14.7) 1.0 34 (13.1)
Stage 2c 19 (14.6) 6 (4.7) 0.008 25 (9.7)
SNAPd 33 (25.4) 28 (21.7) 0.28 61 (23.6)
Abbreviations: AD =Alzheimer disease; AR-AD = at risk of Alzheimer disease; CDR =Clinical Dementia Rating; IWG-2 = InternationalWorkingGroup-2; NIA-AA =National Institute on Aging–Alzheimer’s Association; p-tau = phosphorylated tau; SNAP = suspected non–Alzheimer disease pathophysiology; t-tau = total tau.a Fisher exact test was used to test differences in proportions, and a 2-tailed level of significance was used.b According to the IWG-2 criteria, asymptomatic at risk for Alzheimer disease is present when there is absence of specific clinical phenotype (absence of amnesticsyndromeof the hippocampal type and absence of clinical phenotype of atypical AD). The IWG-2 criteria also include increased retention of fibrillary amyloid PET as invivo evidence of Alzheimer pathology. Because amyloid PET was not available in this study, solely CSF data were used as in vivo evidence of Alzheimer pathology.c In the current study, only CSF tauopathy is considered because we lacked data for MRI and fluorodeoxyglucose-PET markers of neurodegeneration.d SNAP was proposed in 2012 by Jack et al.19 after the initial NIA-AA criteria were introduced.
e1686 Neurology | Volume 90, Number 19 | May 8, 2018 Neurology.org/N

There was no difference in Aβ40 levels (6,319.1 vs6,237.9 pg/mL, p = 0.89). All participants with pathologicvalues for all 3 biomarkers (n = 8) were APOE e4 carriers.Among participants with dementia (n = 5), 4 had the APOEe4 allele (p = 0.017).
The APOE e4 allele was more common in participants withA+/T−/N−, A+/T−/N+, and A+/T+/N+; AR-AD andpreclinical AD according to Dubois 2016 criteria;stage1 and stage 2 according to NIA-AA criteria; andasymptomatic at risk for Alzheimer disease according to theIWG-criteria (tables 3–5).
Other characteristicsMenmore often than women had t-tau pathology A+/T−/N+,preclinical AD according to Dubois 2016, asymptomatic at riskfor Alzheimer disease according to the IWG-2 criteria, andNIA-AA stage 2 (tables 3–5). Participants with A+/T+/N+had a lower mean MMSE score (28.5 vs 29.3, p = 0.04) thanother participants. There were no differences between differentcategories and participants with normal CSF values regardingage, living alone, prevalence of depression, stroke, and years ofeducation (tables 3–5).
Analyses of 70-year-olds with good cognitionFinally, we examined the subgroup scoring 30 on the MMSE.The prevalence of the different categories of preclinical ADwas similar in this group compared to the rest of the samplewith a CDR score of 0 (tables 3–5). None of the participantswith A+/T+/N+ had an MMSE score of 30.
DiscussionWe applied CSF data from a population study to determinethe prevalence of preclinical dementia and related conditionsin accordance with 4 commonly used classification systems.AD pathology was observed in almost one-half of the 70-year-olds with a CDR score of 0. Almost one-fourth had amyloidpathology and a third had tau pathology, representingneuronal injury. Our findings show that amyloid and taupathology on CSF is very common in cognitively normalpopulations, as previously shown in neuropathologic seriesand in convenience samples using PET.2,30
Regarding the A/T/N system, we report findings nearlyidentical to those in a recent report from the Mayo Clinic onpersons 50 to 95 years of age for A−/T+/N+ (4% vs 4.6%in our study), A+/T−/N− (10% vs 13.1% in our study), andA+/T−/N+ (8% vs 7.3% in our study).31 The lower preva-lence of A+/T+/N+ in the current study probablyreflects our population-based design. We did not find anycases of A+/T+/N− and A−/T+/N−, suggesting that path-ologic CSF p-tau is highly correlated to pathologic CSF t-tauin a population sample of cognitively intact older people. Inaddition, it is of interest that we found some cases with A−/T+/N+ (4.6%) because T+ is not supposed to occur in theabsence of abnormal brain amyloidosis. However, this mayreflect primary age-related tauopathy,31,32 in which neurofi-brillary tangles in brains without amyloid (Aβ) plaques areindistinguishable from neurofibrillary tangles in those withAD. It is also noteworthy that we found more cases with t-taupathology than with p-tau pathology. These findingsmay reflect a combination of primary age-related tauopathyand other non-AD pathologies such as vascular disease orLewy bodies.
With the use of the Dubois 2016 criteria, slightly more thana third were classified as asymptomatic AR-AD, and another1/10th had preclinical AD. Regarding the NIA-AA criteria,another study, in cognitively normal volunteers (mean age 66years),8 reported that the combined prevalence for stage 1and SNAP (same as Dubois AR-AD) was 31%, a figureslightly lower than in our study (36.7%). That study alsoreported that 12.3% had isolated amyloid pathology(stage 1), a figure almost identical to that in our study(13.1%). The proportion of participants with CSF amyloid ortau pathology in accordance with IWG-2 criteria (46%) inour study parallels findings based on Alzheimer’s DiseaseNeuroimaging Initiative data.33
We found that 23% had CSF amyloid pathology. This figure issimilar to those reported from neuropathologic series of olderpeople2 and from convenience samples using PET scans inwhich 20% to 30% are Pittsburgh compound B PETpositive.30,34 Using CSF, 1 Swedish study, conducted incognitively healthy elderly volunteers (mean age 72 years)recruited through advertisement, reported that 27% hadAβ1–42 levels below the study cutoff,11 thus paralleling our
Figure Venn diagram
Venn diagram of the ATN distribution of amyloid and tau pathologyaccording to the A/T/N classification scheme in a representative population-based sample of 70-year-olds with a Clinical Dementia Rating score of 0. A+refers to Aβ pathology (CSF Aβ42 levels ≤530 pg/mL), T+ to pathologic p-tau(CSF p-tau ≥ 80 pg/mL), and N+ to neurodegeneration biomarker (CSF totaltau ≥350 pg/mL) in 259 cognitively normal elderly all 70 years of age. Aβ =β-amyloid; p-tau = phosphorylated tau.
Neurology.org/N Neurology | Volume 90, Number 19 | May 8, 2018 e1687

Table 3 Characteristics of a representative sample of 70-year-olds by A/T/N category
Normal CSF A+/T2/N2 p Valuea A+/T2/N+ p Valuea A+/T+/N+ p Valuea A2/T2/N+ p Valuea A2/T+/N+ P Valuea
Women, n (%) 76 (54.7) 19 (55.8) 1.0 5 (26.3) 0.03 1 (1.7) 0.10 20 (40.8) 0.10 8 (6.7) 0.55
Living alone, n (%) 50 (36.5) 10 (30.3) 0.55 6 (31.6) 0.8 3 (50) 0.67 16 (32.7) 0.73 3 (25.0) 0.54
Any depression, n (%) 14 (10.1) 2 (5.9) 0.74 0 0.22 21 (8.1) 1.0 4 (8.2) 1.0 1 (8.3) 1.0
Stroke, n (%) 6 (4.4) 2 (5.9) 0.66 0 (0) 1.0 1 (16.7) 0.26 1 (2.0) 0.68 0 (0) 1.0
APOE «4 allele, n (%) 31 (23) 19 (55.9) 0.0005 9 (50.0) 0.02 6 (100.0) 0.0003 15 (30.6) 0.34 6 (50.0) 0.07
CDR SOB = 0, n (%) 133 (95.7) 33 (97.1) 1.0 17 (89.5) 0.25 6 (100.0) 1.0 49 (100.0) 0.34 12 (100.0) 1.0
MMSE score = 30, n (%) 70 (50.4) 18 (52.9) 0.85 9 (47.4) 1.0 0 (0) 0.03 26 (54.2) 0.74 6 (50.0) 1.0
Age, y 70.9 (0.3) 70.9 (0.3) 0.75 71.0 (0.4) 0.20 70.7 (0.3) 0.11 70.9 (0.4) 0.58 70.9 (0.3) 0.93
Education, y 13.0 (3.8) 13.6 (3.4) 0.36 12.5 (3.0) 0.6 11.5 (4.5) 0.37 13.3 (3.7) 0.57 11.7 (2.3) 0.25
MMSE score 29.3 (0.9) 29.4 (0.8) 0.70 29.3 (0.8) 0.91 28.5 (1.2) 0.04 29.3 (1.1) 0.82 29.2 (0.9) 0.66
Abbreviations: CDR = Clinical Dementia Rating; MMSE = Mini-Mental State Examination; SOB = sum of boxes.a Test of differences in means (t test) and proportions (Fisher exact test) between the different groups compared to participants with normal CSF values.
e1688Neu
rology
|Vo
lume90,N
umber
19|
May
8,2018Neurology.org/N

findings. Our figure is also similar (27%) to a US study ofvolunteers.9 The concordance between our findings and thosefrom convenience samples is striking, despite the fact that oursample is representative and selected only on the basis ofbirthdates, while convenience samples are selected on thebasis of, for example, advertisements, relatives of memoryclinic patients, volunteers, or veterans.
Our study is based solely on data for persons 70 years of age. Ahigher figure would be anticipated in older age groups becausethere is strong evidence that amyloid pathology increases withage.30,35 A meta-analysis reported a gradual increase with agein the frequency of amyloid pathology based on PET and CSFdata from 10% at 50 years of age to 44% at 90 years of age incognitively normal participants.35
Table 4 Characteristics of asymptomatic AR-AD and preclinical AD according to the Dubois 2016 criteria ofa representative sample of 70-year-olds
Normal CSF AR-AD p Valuea Preclinical AD p Valueb
Women, n (%) 76 (54.7) 47 (49.5) 0.5 6 (24.0) 0.008
Living alone, n (%) 50 (36.5) 29 (30.9) 0.47 9 (36.0) 1.0
Any depression, n (%) 14 (10.1) 7 (7.4) 0.64 0 (0) 0.22
Stroke, n (%) 6 (4.4) 3 (3.2) 0.73 1 (4.0) 1.0
APOE «4 allele, n (%) 31 (23.0) 40 (42.1) 0.0015 15 (62.5) 0.0001
CDR SOB = 0, n (%) 133 (95.7) 94 (98.9) 0.25 23 (92.0) 0.35
MMSE score = 30, n (%) 70 (50.4) 50 (52.6) 0.69 9 (36.0) 0.19
Age at examination, mean (SD), y 70.9 (0.34) 70.9 (0.38) 0.82 70.9 (0.43) 0.60
Education, mean (SD), y 13.0 (3.8) 13.2 (3.5) 0.62 12.2 (3.3) 0.34
MMSE score, mean (SD) 29.3 (0.9) 29.3 (0.98) 0.92 29.1 (0.95) 0.3
Abbreviations: AD = Alzheimer disease; AR-AD = at risk of Alzheimer disease; CDR = Clinical Dementia Rating; MMSE = Mini-Mental State Examination; SOB =sum of boxes.a Test of differences in means (t test) and proportions (Fisher exact test) between participants with asymptomatic AR-AD (according to the Dubois criteria2016) and participants with normal CSF values.b Test of differences in means (t test) and proportions (Fisher exact test) between participants with preclinical AD (according to the new Dubois criteria) andparticipants with normal CSF values.
Table 5 Characteristics of a representative sample of 70-year-olds by preclinical dementia pathology category
Normal CSF Stage 1 p Valuea Stage 2 and IWG-2 p Valueb SNAP p Valuec
Women, n (%) 76 (54.7) 19 (55.9) 1.0 6 (24.0) 0.008 28 (45.9) 0.28
Living alone, n (%) 50 (36.5) 10 (30.3) 0.55 9 (36.0) 1.0 19 (31.1) 0.52
Any depression, n (%) 14 (10.1) 2 (5.9) 0.74 0 (0) 0.13 5 (8.2) 0.79
Stroke, n (%) 6 (4.4) 2 (5.9) 0.66 1 (4.0) 1.0 1 (1.6) 0.68
APOE «4 allele, n (%) 31 (23.0) 19 (55.9) 0.0006 15 (62.5) 0.0003 21 (34.4) 0.12
CDR SOB 0, n (%) 133 (95.7) 33 (97.1) 1.0 23 (92.0) 0.35 61 (100) 0.18
MMSE score = 30, n (%) 70 (50.4) 18 (52.9) 0.85 9 (36) 0.2 32 (53.3) 0.76
Age at examination, mean (SD), y 70.9 (0.34) 70.8 (0.32) 0.75 70.9 (0.43) 0.6 70.9 (0.41) 0.53
Education, mean (SD), y 13.0 (3.8) 13.6 (3.4) 0.36 12.2 (3.3) 0.38 12.9 (3.5) 0.9
MMSE score, mean (SD) 29.3 (0.9) 29.4 (0.7) 0.69 29.1 (0.95) 0.3 29.3 (1.0) 0.72
Abbreviations: CDR = Clinical Dementia Rating; IWG-2 = International Working Group-2; MMSE = Mini-Mental State Examination; SNAP = suspected non–Alzheimer disease pathophysiology; SOB = sum of boxes.a Test of differences in means and proportions between the participants with stage 1 (according to the National Institute on Aging–Alzheimer’s Association[NIA-AA] criteria 2011) and participants with normal CSF values.b Test of differences in means and proportions between participants with stage 2 (according to the NIA-AA criteria 2011) and participants with normal CSFvalues. Asymptomatic at risk for Alzheimer disease according to the IWG-2 criteria is identical to stage 2 according to NIA-AA 2011.c Test of differences in means and proportions between the participants with SNAP (according to the NIA-AA criteria 2011) and participants with normal CSFvalues.
Neurology.org/N Neurology | Volume 90, Number 19 | May 8, 2018 e1689

We observed associations between APOE e4 carriership andall 3 biomarkers, as well as with the criteria of A+/T−/N−, A+/T−/N+, and A+/T+/N+. A recent study using the A/T/Nsystem showed that participants with A+ were twice as oftenAPOE e4 carriers than participants without A+.31 In line withsome previous studies, carriage ofAPOE e4 was related to AR-AD and preclinical AD according to Dubois, as well as stage 1and stage 2 according to NIA-AA and asymptomatic at risk forAlzheimer disease according to IWG-2 criteria. One studyusing the NIA-AA criteria found that the proportion of pre-clinical AD (NIA-AA stage 1–3) was higher in APOE e4carriers compared to noncarriers.9 Another study found thatAPOE e4 carriers more often had preclinical AD.8 In a studyon cognitively normal persons in the age span of 30 to 90years, APOE e4 carriers more often had amyloid positivity onPET after 70 years of age.36
We also found some sex differences. Pathological t-tau, A+/T−/N+, preclinical AD according to Dubois, asymptomatic atrisk for Alzheimer disease according to IWG-2, and NIA-AAstage 2 were more common inmen. Another study reported nosex differences with the A/T/N system, although it noteda trend for a higher proportion ofmen in the A−/T−/N+ groupand the greatest proportion of women in the A+/T−/N−group.31 Men may have accumulated more nonspecific brainpathology as reflected in t-tau levels as a result of lifestylechoices such as alcohol abuse, head trauma, or vascular riskfactors. The higher prevalence of preclinical AD in men among70-year-olds is also noteworthy because later in life, after 85 to90 years of age, clinical AD ismore common inwomen. It couldbe that men with preclinical AD do not survive to the clinicalstages, thus leading to higher prevalence of clinical AD insurviving women beyond 85 years of age. These questions canbe answered only by longitudinal follow-up. Sex differences inpreclinical AD need to be studied further.
MMSE score did not differ between those with and thosewithout preclinical AD as identified by the different AD pa-thology classification systems, with the exception of the A+/T+/N+ group. Others report lower MMSE scores in pre-clinical AD.9 This disparity may be related in part to thepopulation-based nature of our study. The cases of AR-ADand preclinical AD, stage 1, stage 2, and SNAP identified inour study likely represent an early stage in the disease process.This is further supported by the high mean MMSE scores(≈29) and the observation that the prevalence figures weresimilar in those with an MMSE score of 30. The fact that wefound lowerMMSE levels only in participants with pathologiclevels of all 3 biomarkers suggests that these are probablycloser to conversion to mild cognitive impairment (MCI). Wecould not show this for amyloid positivity and signs of neu-rodegeneration alone, indicating that tauopathy plays a sig-nificant role in the conversion to MCI. Further support forthis comes from a study that found that the progression rate toa CDR score ≥0.5 was 5% for stage 1 and 46% for stage 2+,again showing that the combined pathology of amyloidopathyand neuronal injury is driving the conversion.8
The conversion rate to MCI and dementia in asymptomaticindividuals with amyloid and tau pathology is still unclear.Given the overall low dementia incidence in septuage-narians,37 it is likely that the majority with amyloid or taupathology in our study will not develop dementia during thecoming decade. However, even if development of dementia israre in this age group, cognitively healthy individuals withamyloid pathology on PET or CSF decline faster in cognitivefunction.38
Among the strengths of this study are the representativepopulation-based sample, the relatively high response rate forLP, and the comprehensive examinations conducted bytrained psychiatric nurses. Some limitations need to beaddressed. Even if the number with CSF data in this study wasrelatively large, the overall number is relatively low, yieldinglow statistical power (i.e., subsamples). More than one-thirdconsented to LP, but almost one-quarter was excluded be-cause of contraindications, illustrating the challenges of con-ducting population-based CSF research. Althoughparticipants with CSF data were similar to the rest of thesample regarding several factors, it is possible that participantswere healthier, thus creating selection bias and not trueprevalence figures. However, weighted prevalence figuresusing propensity score modeling were very similar to theunweighted prevalence. We have most likely underestimatedthe true prevalence of pathology. Moreover, it is possible thatthere have been subtle cognitive differences between thebiomarker groups that were not detected with our brief andunspecific cognitive tests. A further limitation is that we didnot use PET scans. However, the correlation between CSFAβ42 and PET has been shown to be high,14 while markers ofneurodegeneration are less concordant.8 Finally, this isa population-based study examining Swedish 70-year-olds;therefore, results cannot be generalized to other groups.
Author contributionsSilke Kern analyzed and interpreted the data, conducted theliterature search, and wrote the paper. Kaj Blennow, UlfAndreasson, and Henrik Zetterberg contributed with acqui-sition of data (CSF analyses) and study supervision. KajBlennow, Henrik Zetterberg, Jurgen Kern, Anna Zettergren,Kina Hoglund, Ulf Andreasson, Hanna Wetterberg, MargdaWaern, and Anne Borjesson-Hanson contributed with theanalysis and interpretation of the data and revised the articlecritically for important intellectual content. Ingmar Skoog wasprincipal investigator, conceived and designed the study, re-fined the study methods, was involved in analysis and in-terpretation of the data, and revised the article critically forimportant intellectual content. The corresponding authorattests that the authors had access to all the study data, takeresponsibility for the accuracy of the analysis, and had au-thority over manuscript preparation and the decision tosubmit the manuscript for publication. All authors gave finalapproval of the version to be published. The correspondingauthor affirms that she has listed everyone who contributedsignificantly to the work.
e1690 Neurology | Volume 90, Number 19 | May 8, 2018 Neurology.org/N

AcknowledgmentValter Sundh, University of Gothenburg, performed thestatistical analysis.
Study fundingThis study was supported by grants from the Swedish Re-search Council (2012-5041, 2013-8717, 2015-02830),Swedish Research Council for Health, Working Life andWelfare (2013-1202, AGECAP 2013-2300, 2013-2496, 2013-0475), Swedish Alzheimerfoundation, Hjarnfonden, StenaFoundation, Sahlgrenska University Hospital (ALF), TorstenSoderbergs Stiftelse at the Royal Swedish Academy of Sciences,the Knut andAliceWallenberg Foundation, the Emil andMariaPalm Foundation, Alma och Anna Ylen’s Foundation, KonungGustaf V:s och Drottning Victorias Frimurarestiftelse, Eivindoch Elsa K:son Sylvans stiftelse, Stiftelsen Soderstrom-Konigska Sjukhemmet, Stiftelsen for Gamla Tjanarinnor,Handlanden Hjalmar Svenssons Forskningsfond, StiftelsenDemensfonden, Stiftelsen Wilhelm and Martina LundgrensVetenskapsfond, Stiftelsen Professor Bror Gadelius’ Min-nesfond, the Goteborg Medical Services and Social ServicesAdministrations, and Fredrik and Rosa von Malborgs Foun-dation for Brain Research.
DisclosureS. Kern reports no disclosures relevant to the manuscript.H. Zetterberg is a cofounder of Brain Biomarker Solutions inGothenburg AB, a GU Ventures–based platform company atthe University of Gothenburg (This company was not in-volved in any aspect of the study). J. Kern, A. Zettergren,M. Waern, K. Hoglund, U. Andreasson, H. Wetterberg, andA. Borjesson-Hanson report no disclosures relevant to themanuscript. K. Blennow is a cofounder of Brain BiomarkerSolutions in Gothenburg AB, a GU Ventures–based platformcompany at the University of Gothenburg. Dr. Blennow hasserved at advisory boards or as a consultant for Alzheon, EliLilly, Fujirebio Europe, IBL International, Pfizer, RocheDiagnostics, Amgen, and Sanofi-Aventis (unrelated to thepresent study) and has received research support from JanssenAlzheimer Immunotherapy and Roche Diagnostics (unrelatedto the present study). I. Skoog reports no disclosures relevantto the manuscript. Go to Neurology.org/N for full disclosures.
Received September 28, 2017. Accepted in final form February 20, 2018.
References1. Blennow K, de Leon MJ, Zetterberg H. Alzheimer’s disease. Lancet 2006;368:
387–403.2. Tomlinson BE, Blessed G, Roth M. Observations on the brains of non-demented old
people. J Neurol Sci 1968;7:331–356.3. NeuropathologyGroup,Medical Research Council Cognitive Function and Aging Study.
Pathological correlates of late-onset dementia in a multicentre, community-based pop-ulation in England and Wales: Neuropathology Group of the Medical Research CouncilCognitive Function and Ageing Study (MRC CFAS). Lancet 2001;357:169–175.
4. Aizenstein HJ, Nebes RD, Saxton JA, et al. Frequent amyloid deposition without sig-nificant cognitive impairment among the elderly. Arch Neurol 2008;65:1509–1517.
5. Jack CR Jr, Lowe VJ, Weigand SD, et al. Serial PIB andMRI in normal, mild cognitiveimpairment and Alzheimer’s disease: implications for sequence of pathological eventsin Alzheimer’s disease. Brain 2009;132:1355–1365.
6. Pike KE, Savage G, Villemagne VL, et al. Beta-amyloid imaging and memory in non-demented individuals: evidence for preclinical Alzheimer’s disease. Brain 2007;130:2837–2844.
7. Dubois B, Feldman HH, Jacova C, et al. Advancing research diagnostic criteria forAlzheimer’s disease: the IWG-2 criteria. Lancet Neurol 2014;13:614–629.
8. Vos SJ, Gordon BA, Su Y, et al. NIA-AA staging of preclinical Alzheimer disease:discordance and concordance of CSF and imaging biomarkers. Neurobiol Aging2016;44:1–8.
9. Vos SJ, Xiong C, Visser PJ, et al. Preclinical Alzheimer’s disease and its outcome:a longitudinal cohort study. Lancet Neurol 2013;12:957–965.
10. Hoglund K, Kern S, Zettergren A, et al. Preclinical amyloid pathology biomarker posi-tivity: effects on tau pathology and neurodegeneration. Transl Psychiatry 2017;7:e995.
11. Stomrud E, Minthon L, Zetterberg H, Blennow K, Hansson O. Longitudinal cere-brospinal fluid biomarker measurements in preclinical sporadic Alzheimer’s disease:a prospective 9-year study. Alzheimers Dement (Amst) 2015;1:403–411.
12. Bateman RJ, Xiong C, Benzinger TL, et al. Clinical and biomarker changes in dom-inantly inherited Alzheimer’s disease. N Engl J Med 2012;367:795–804.
13. Fagan AM, Head D, Shah AR, et al. Decreased cerebrospinal fluid Abeta(42) corre-lates with brain atrophy in cognitively normal elderly. Ann Neurol 2009;65:176–183.
14. Sutphen CL, Jasielec MS, Shah AR, et al. Longitudinal cerebrospinal fluid biomarkerchanges in preclinical Alzheimer disease during middle age. JAMA Neurol 2015;72:1029–1042.
15. Jack CR Jr, Knopman DS, Jagust WJ, et al. Tracking pathophysiological processes inAlzheimer’s disease: an updated hypothetical model of dynamic biomarkers. LancetNeurol 2013;12:207–216.
16. Jack CR Jr, Bennett DA, Blennow K, et al. A/T/N: an unbiased descriptive classi-fication scheme for Alzheimer disease biomarkers. Neurology 2016;87:539–547.
17. Dubois B, Hampel H, Feldman HH, et al. Preclinical Alzheimer’s disease: definition,natural history, and diagnostic criteria. Alzheimers Dement 2016;12:292–323.
18. Sperling RA, Aisen PS, Beckett LA, et al. Toward defining the preclinical stages ofAlzheimer’s disease: recommendations from the National Institute on Aging-Alz-heimer’s Association workgroups on diagnostic guidelines for Alzheimer’s disease.Alzheimers Dement 2011;7:280–292.
19. Jack CR Jr, Knopman DS, Weigand SD, et al. An operational approach to NationalInstitute on Aging-Alzheimer’s Association criteria for preclinical Alzheimer disease.Ann Neurol 2012;71:765–775.
20. Skoog I, Borjesson-Hanson A, Kern S, et al. Decreasing prevalence of dementia in 85-year olds examined 22 years apart: the influence of education and stroke. Sci Rep2017;7:6136.
21. Skoog I, Nilsson L, Palmertz B, Andreasson LA, Svanborg A. A population-basedstudy of dementia in 85-year-olds. N Engl J Med 1993;328:153–158.
22. Kern S, Skoog I, Ostling S, Kern J, Borjesson-Hanson A. Does low-dose acetylsalicylicacid prevent cognitive decline in women with high cardiovascular risk? A 5-yearfollow-up of a non-demented population-based cohort of Swedish elderly women.BMJ Open 2012:2:e001288.
23. Kern J, Kern S, Blennow K, et al. Calcium supplementation and risk of dementia inwomen with cerebrovascular disease. Neurology 2016;87:1674–1680.
24. Bjerke M, Kern S, Blennow K, et al. Cerebrospinal fluid fatty acid-binding protein 3 isrelated to dementia development in a population-based sample of older adult womenfollowed for 8 years. J Alzheimers Dis 2016;49:733–741.
25. Vanmechelen E, Vanderstichele H, Davidsson P, et al. Quantification of tau phos-phorylated at threonine 181 in human cerebrospinal fluid: a sandwich ELISA witha synthetic phosphopeptide for standardization. Neurosci Lett 2000;285:49–52.
26. BlennowK,Wallin A, Agren H, Spenger C, Siegfried J, Vanmechelen E. Tau protein incerebrospinal fluid: a biochemical marker for axonal degeneration in Alzheimer dis-ease? Mol Chem Neuropathol 1995;26:231–245.
27. Andreasen N, Hesse C, Davidsson P, et al. Cerebrospinal fluid beta-amyloid(1-42) inAlzheimer disease: differences between early- and late-onset Alzheimer disease andstability during the course of disease. Arch Neurol 1999;56:673–680.
28. Steen Jensen C, Portelius E, Siersma V, et al. Cerebrospinal fluid amyloid beta and tauconcentrations are not modulated by 16 weeks of moderate- to high-intensity physicalexercise in patients with Alzheimer disease. DemenGeriatr CognDisord 2016;42:146–158.
29. Shaw LM, Vanderstichele H, Knapik-Czajka M, et al. Cerebrospinal fluid biomarkersignature in Alzheimer’s Disease Neuroimaging Initiative subjects. Ann Neurol 2009;65:403–413.
30. Rowe CC, Ellis KA, Rimajova M, et al. Amyloid imaging results from the AustralianImaging, Biomarkers and Lifestyle (AIBL) study of aging. Neurobiol Aging 2010;31:1275–1283.
31. Jack CR Jr, Wiste HJ, Weigand SD, et al. Age-specific and sex-specific prevalence ofcerebral beta-amyloidosis, tauopathy, and neurodegeneration in cognitively unimpairedindividuals aged 50-95 years: a cross-sectional study. Lancet Neurol 2017;16:435–444.
32. Crary JF, Trojanowski JQ, Schneider JA, et al. Primary age-related tauopathy (PART):a common pathology associated with human aging. Acta Neuropathol 2014;128:755–766.
33. Wang HF, Tan L, Cao L, et al. Application of the IWG-2 diagnostic criteria forAlzheimer’s disease to the ADNI. J Alzheimers Dis 2016;51:227–236.
34. Ossenkoppele R, Jansen WJ, Rabinovici GD, et al. Prevalence of amyloid PET posi-tivity in dementia syndromes: a meta-analysis. JAMA 2015;313:1939–1949.
35. JansenWJ, Ossenkoppele R, Knol DL, et al. Prevalence of cerebral amyloid pathologyin persons without dementia: a meta-analysis. JAMA 2015;313:1924–1938.
36. Jack CR Jr, Wiste HJ, Weigand SD, et al. Age, sex, and APOE epsilon4 effects onmemory, brain structure, and beta-amyloid across the adult life span. JAMA Neurol2015;72:511–519.
37. Hebert LE, Scherr PA, Bienias JL, Bennett DA, Evans DA. Alzheimer disease in the USpopulation: prevalence estimates using the 2000 census. ArchNeurol 2003;60:1119–1122.
38. vanHarten AC, Smits LL, TeunissenCE, et al. Preclinical AD predicts decline inmemoryand executive functions in subjective complaints. Neurology 2013;81:1409–1416.
Neurology.org/N Neurology | Volume 90, Number 19 | May 8, 2018 e1691

FULL-LENGTH ARTICLE NPub.org/stk14a
Prevalence of preclinical Alzheimer diseaseComparison of current classification systems
Silke Kern, MD, PhD, Henrik Zetterberg, MD, PhD, Jurgen Kern, MD, PhD, Anna Zettergren, PhD,
Margda Waern, MD, PhD, Kina Hoglund, PhD, Ulf Andreasson, PhD, Hanna Wetterberg, MSc,
Anne Borjesson-Hanson, MD, PhD, Kaj Blennow, MD, PhD, and Ingmar Skoog, MD, PhD
Cite as: Neurology® 2018;90:e1682-e1691. doi:10.1212/WNL.0000000000005476
Correspondence
Dr. S. Kern
Study questionWhat is the prevalence of preclinical Alzheimer disease (AD)in the general population of 70-year-olds according to currentCSF biomarker-based classification systems?
Summary answerAccording to current CSF biomarker-based classificationsystems, almost half of 70-year-olds have preclinical AD ora related condition.
What is known and what this paper addsMany elderly persons without dementia exhibit preclinical ADpathology. This study of a representative population clarifiesthe prevalence of preclinical AD pathology according to thecriteria of 4 classification systems introduced between 2011and 2016.
Participants and settingThis study examined 259 residents (50.2% male) of Gothen-burg, Sweden, who were born in 1944, had no contraindicationsto lumbar puncture, andwere considered cognitively unimpaireddue to having a Clinical Dementia Rating score of 0. Theexaminations occurred at Sahlgrenska University Hospital be-tween 2014 and 2016 as part of the H70 Gothenburg BirthCohort Studies.
Design, size, and durationCSF samples were collected via lumbar puncture. AD bio-markers including total tau, threonine-181–phosphorylatedtau, and β-amyloid 42 (Aβ42) and Aβ42/Aβ40 ratios werequantified with commercially available immunoassays.
Primary outcomesThe primary outcomes were CSF biomarker-based classi-fications of AD pathology according to the A/T/N scheme,the Dubois 2016 criteria, the International Working Group–2(IWG-2) criteria, and the NIA-AA criteria.
Main resultsUnder the A/T/N scheme, 46.2% of participants were posi-tive for ≥1 AD biomarker. Under the Dubois 2016 criteria,36.7% of participants were asymptomatic-at-risk-for AD, and
9.7% of participants had preclinical AD. Under the IWG-2criteria, 9.7% of participants were asymptomatic at risk forAD. Under the NIA-AA criteria, 22.8% of participants hadpreclinical AD.
Bias, confounding, and other reasonsfor cautionThe exclusion of study candidates with contraindications tolumbar puncture might have biased the study sample towardsrelatively healthy participants, so the prevalence of preclinicalAD might have been underestimated. PET data were un-available, so PET criteria in the IWG-2 and NIA-AA schemescould not be applied. There was no pathologic confirmationof AD.
Generalizability to other populationsThe generalizability to populations unlike 70-year-old resi-dents of Sweden may be limited.
Study funding/potential competing interestsThis study was funded by the Swedish government, variousfoundations, and Sahlgrenska UniversityHospital. Dr. Zetterbergand Dr. Blennow cofounded Brain Biomarker Solutions.Dr. Blennow reports receiving funding, advisory boardappointments, and consulting fees from various healthcarecompanies. Go to Neurology.org/N for full disclosures.
Table Participant classifications according to the A/T/Nscheme, based on measures of CSF Aβ, t-tau andp-tau
A/T/N classification No. (%) of participants
A+/T2/N2 34 (13.1)
A+/T2/N+ 19 (7.3)
A+/T+/N+ 6 (2.3)
A2/T2/N+ 49 (18.9)
A2/T+/N+ 12 (4.6)
Abbreviations: Aβ = β-amyloid; p-tau = phosphorylated tau; t-tau = total tau.
A draft of the short-form article was written by M. Dalefield, a writer with Editage, a division of Cactus Communications. The authors of thefull-length article and the journal editors edited and approved the final version.
876 Copyright © 2018 American Academy of Neurology
SHORT-FORM ARTICLE

DOI 10.1212/WNL.00000000000054762018;90;e1682-e1691 Published Online before print April 13, 2018Neurology
Silke Kern, Henrik Zetterberg, Jürgen Kern, et al. systems
Prevalence of preclinical Alzheimer disease: Comparison of current classification
This information is current as of April 13, 2018
ServicesUpdated Information &
http://n.neurology.org/content/90/19/e1682.fullincluding high resolution figures, can be found at:
References http://n.neurology.org/content/90/19/e1682.full#ref-list-1
This article cites 38 articles, 3 of which you can access for free at:
Subspecialty Collections
http://n.neurology.org/cgi/collection/prevalence_studiesPrevalence studies
http://n.neurology.org/cgi/collection/cohort_studiesCohort studies
http://n.neurology.org/cgi/collection/alzheimers_diseaseAlzheimer's diseasefollowing collection(s): This article, along with others on similar topics, appears in the
Permissions & Licensing
http://www.neurology.org/about/about_the_journal#permissionsits entirety can be found online at:Information about reproducing this article in parts (figures,tables) or in
Reprints
http://n.neurology.org/subscribers/advertiseInformation about ordering reprints can be found online:
ISSN: 0028-3878. Online ISSN: 1526-632X.Wolters Kluwer Health, Inc. on behalf of the American Academy of Neurology.. All rights reserved. Print1951, it is now a weekly with 48 issues per year. Copyright Copyright © 2018 The Author(s). Published by
® is the official journal of the American Academy of Neurology. Published continuously sinceNeurology