prevalence of obesity and severe obesity in us children...
TRANSCRIPT

Article
Prevalence of Obesity and Severe Obesity in US Children, 1999–2016Asheley Cockrell Skinner, PhD, a, b Sophie N. Ravanbakht, BA, c, d Joseph A. Skelton, MD, MS, e, f, g Eliana M. Perrin, MD, MPH, c, d Sarah C. Armstrong, MDb, c, d
OBJECTIVES: To provide updated prevalence data on obesity trends among US children and adolescents aged 2 to 19 years from a nationally representative sample.METHODS: We used the NHANES for years 1999 to 2016. Weight status was determined by using measured height and weight from the physical examination component of the NHANES to calculate age- and sex-specific BMI. We report the prevalence estimates of overweight and obesity (class I, class II, and class III) by 2-year NHANES cycles and compared cycles by using adjusted Wald tests and linear trends by using ordinary least squares regression.RESULTS: White and Asian American children have significantly lower rates of obesity than African American children, Hispanic children, or children of other races. We report a positive linear trend for all definitions of overweight and obesity among children 2–19 years old, most prominently among adolescents. Children aged 2 to 5 years showed a sharp increase in obesity prevalence from 2015 to 2016 compared with the previous cycle.CONCLUSIONS: Despite previous reports that obesity in children and adolescents has remained stable or decreased in recent years, we found no evidence of a decline in obesity prevalence at any age. In contrast, we report a significant increase in severe obesity among children aged 2 to 5 years since the 2013–2014 cycle, a trend that continued upward for many subgroups.
abstract
Departments of aPopulation Health Sciences and cPediatrics, and dDuke Center for Childhood Obesity Research, Duke University, Durham, North Carolina; bDuke Clinical Research Institute, Durham, North Carolina; Departments of eDivision of Public Health Sciences, Epidemiology and Prevention and fPediatrics, School of Medicine, Wake Forest University, Winston-Salem, North Carolina; and gBrenner Families In Training Program, Brenner Children’s Hospital, Winston-Salem, North Carolina
Dr Skinner made substantial contributions to the conception and design of the study, acquisition of data, analysis of the data, and interpretation of data, drafted the article, revised it critically for important intellectual content, and ensures that questions related to the accuracy or integrity of any part of the work are appropriately investigated and resolved; Ms Ravanbakht and Dr Armstrong contributed to the interpretation of data, drafted portions of the article, and revised it in its entirety for intellectual content; Dr Skelton contributed to the conception of the study and interpretation of data and drafted and revised the article; Dr Perrin contributed to the interpretation of data and revised the manuscript in its entirety for intellectual content; and all authors approved the final manuscript as submitted and agree to be accountable for all aspects of the work.
DOI: https:// doi. org/ 10. 1542/ peds. 2017- 3459
Accepted for publication Nov 30, 2017
Address correspondence to Asheley Cockrell Skinner, PhD, Department of Population Health Sciences, Duke University, 2200 W Main St, Suite 720-A, Durham, NC 27705. E-mail: [email protected]
PEDIATRICS (ISSN Numbers: Print, 0031-4005; Online, 1098-4275).
PEDIATRICS Volume 141, number 3, March 2018:e20173459
What’s KnOWn On thIs subject: The US prevalence of child and adolescent obesity has been increasing for 4 decades. Some reports reveal stabilization across the population and decreases among young children aged 2 to 5 years, although severe obesity has increased, with adverse health effects.
What thIs stuDy aDDs: We detail the prevalence of obesity and severe obesity by age and race and/or ethnicity, including Asian American youth, in a nationally representative sample. Despite significant public health initiatives, obesity and severe obesity continue to increase, with a sharp increase being noted in preschool-aged children.
to cite: Skinner AC, Ravanbakht SN, Skelton JA, et al. Prevalence of Obesity and Severe Obesity in US Children, 1999–2016. Pediatrics. 2018;141(3):e20173459
by guest on June 23, 2018www.aappublications.org/newsDownloaded from
The prevalence of childhood obesity has increased dramatically among all age groups since 1988.1 Over the past several years, some researchers have reported stabilization in the obesity prevalence overall among youth1 – 3 and decreases in 2- to 5-year-old children.3, 4 However, others report no decrease in any age group since 19995, 6 but rather a sharp increase in the prevalence of severe obesity, particularly among adolescents and non-Hispanic African American children.5
Previously, severe obesity had been defined as having a BMI >99th percentile.7 Recent analyses suggest that BMI SD scores (z scores) poorly reflect adiposity among children and adolescents with severe obesity.8 – 10 The Centers for Disease Control and Prevention (CDC) recommend using a relative BMI measure to describe youth with severe obesity.11 A new classification system recognizes BMI ≥95th percentile as class I obesity, BMI ≥120% of the 95th percentile as class II obesity, and BMI ≥140% of the 95th percentile as class III obesity. Class II and III obesity are strongly associated with greater cardiovascular and metabolic risk.12
Despite intense focus on reducing the US childhood obesity epidemic over the past 2 decades, our progress remains unclear. Ongoing surveillance is critical to gauging population-level prevalence changes that result from overarching policy or public health changes. Our objective is to provide the most up-to-date data on the national prevalence of all obesity classes, including severe obesity, among children and adolescents in the United States. A recent CDC report has provided a summary statement on these recent trends.13 We build on that report here by providing prevalence rates for severe obesity, more specific age subgroups, and adding context to these trends by providing a long-term prevalence report. We report youth obesity and severe obesity
prevalence from the most recent cycle of the NHANES (2015–2016) and provide long-term trends from the NHANES 1999–2016 cycle.
MethODs
We are using methods and analyses that are similar to those of previous studies, 5, 6, 12 which are detailed in brief as follows.
Data
The data source is the NHANES for years 1999–2016. The NHANES is a stratified, multistage probability sample of the civilian, noninstitutionalized US population. Although the NHANES contains multiple components, we used the in-home interview and physical examination here, including measured height and weight. We included all children aged 2 to 19 years. For the present analysis, we used only deidentified secondary data, so it was therefore deemed exempt from further review by the Duke University Health System Institutional Review Board under federal regulation 45CFR§46.101(b).
Measures
Weight status is directly measured by using height and weight measurements gathered from the physical examination component of NHANES to calculate age- and sex-specific BMI. We defined overweight and obesity, hereby referred to as class I obesity, to contrast with class II and class III (more severe forms of obesity) by using CDC criteria, which define overweight as age- and sex-specific BMI ≥85th percentile and class I obesity as BMI ≥95th percentile.14 We defined class II and class III obesity to be consistent with previous reports, 6, 12, 15 with class II obesity defined as a BMI >120% of the 95th percentile for age and sex or a BMI of ≥35 (whichever is lower) and class III obesity defined as a BMI ≥140% of
the 95th percentile for age and sex or a BMI of ≥40 or greater (whichever is lower). These categories were not mutually exclusive; for example, any children or adolescents meeting the criteria for overweight include all the children and adolescents with a BMI ≥85th percentile (even if they are also in the ≥95th percentile).
For years 1999–2010, the NHANES characterized race and ethnicity as non-Hispanic white, non-Hispanic African American, Hispanic, and other race and/or ethnicity. Beginning in 2011, the NHANES included an Asian American oversample, allowing for a more detailed characterization of this group. We include estimates for Asian Americans in years when this information is available. Before 2011, the inclusion of Asian Americans in the other race category made that category different from the other race category of 2011–2016, when Asian Americans were categorized separately. Therefore, we present other race separately for years when Asian Americans were included in the category and present them as their own category from 2011 to 2016, when they were oversampled.
statistical approach
We report the prevalence estimates of overweight and each obesity definition by 2-year NHANES cycles. To test the trends from 1999 to 2016, we report P values from ordinary least squares regression, with the NHANES year as a continuous variable predicting obesity and severe obesity prevalence. To compare the 2 most recent NHANES cycles, we present P values from adjusted Wald tests to compare differences between the most recent cycles, 2013–2014 and 2015–2016. We adjusted all analyses for the complex survey design of the NHANES, including strata, primary sampling units, and probability weights, by using the survey estimation commands in Stata
SkINNER et al2 by guest on June 23, 2018www.aappublications.org/newsDownloaded from
version 15.0 (StataCorp, College Station, TX).
Readers should use the following information as guidance when interpreting our findings. We present results from multiple significance tests but do not make any adjustments for multiple testing, which reduces the chance of a type II error but increases the chance of a type I error. Readers should consider the chance for both type I and type II errors. To reduce the chance of a type II error (indicating as significant a relationship that does not exist), we present all ad hoc data without choosing only those that are significant. We include P values for reference but encourage readers not to focus on P < .05 and instead to consider the body of data. In the supplemental appendices, we present confidence intervals (CIs) to allow readers to draw their own conclusions about more nuanced comparisons. The chance of a type I error (not identifying a relationship that does exist) should be considered, particularly in our comparisons between the 2013–2014 and 2015–2016 cycles. Although the sample size allows for the identification
of relatively small differences in the prevalence of the full sample, subgroup analyses should be considered more carefully. We have provided sample sizes throughout the tables to assist readers in their assessments.
Results
Prevalence
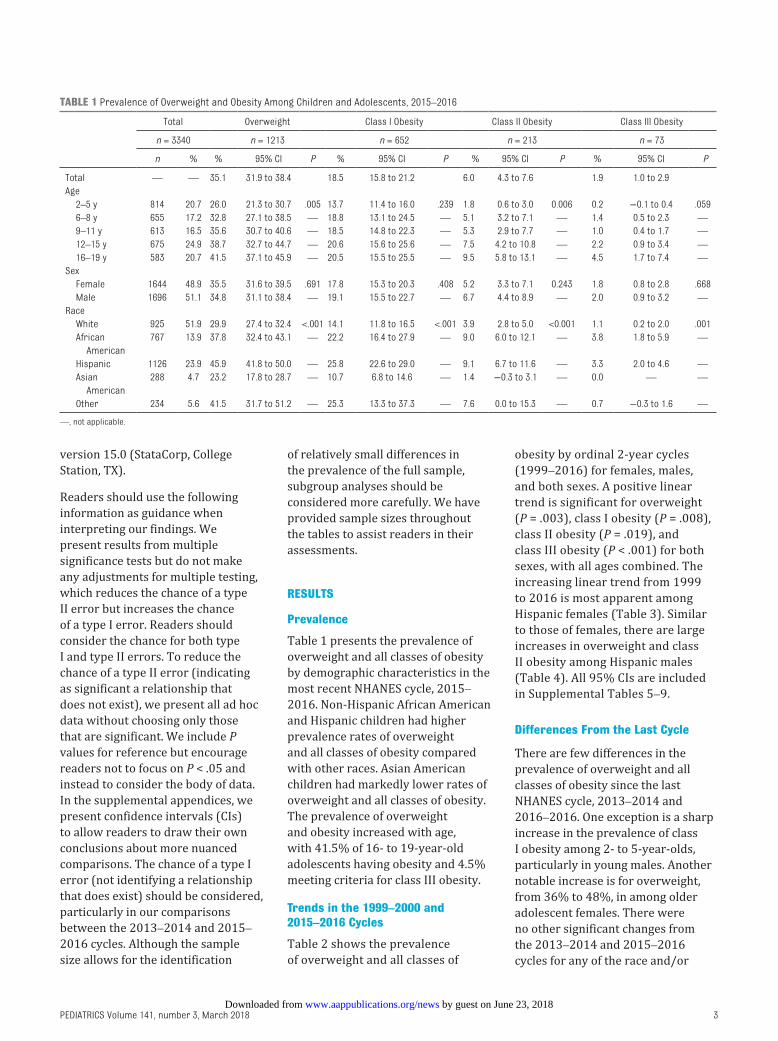
Table 1 presents the prevalence of overweight and all classes of obesity by demographic characteristics in the most recent NHANES cycle, 2015–2016. Non-Hispanic African American and Hispanic children had higher prevalence rates of overweight and all classes of obesity compared with other races. Asian American children had markedly lower rates of overweight and all classes of obesity. The prevalence of overweight and obesity increased with age, with 41.5% of 16- to 19-year-old adolescents having obesity and 4.5% meeting criteria for class III obesity.
trends in the 1999–2000 and 2015–2016 cycles
Table 2 shows the prevalence of overweight and all classes of
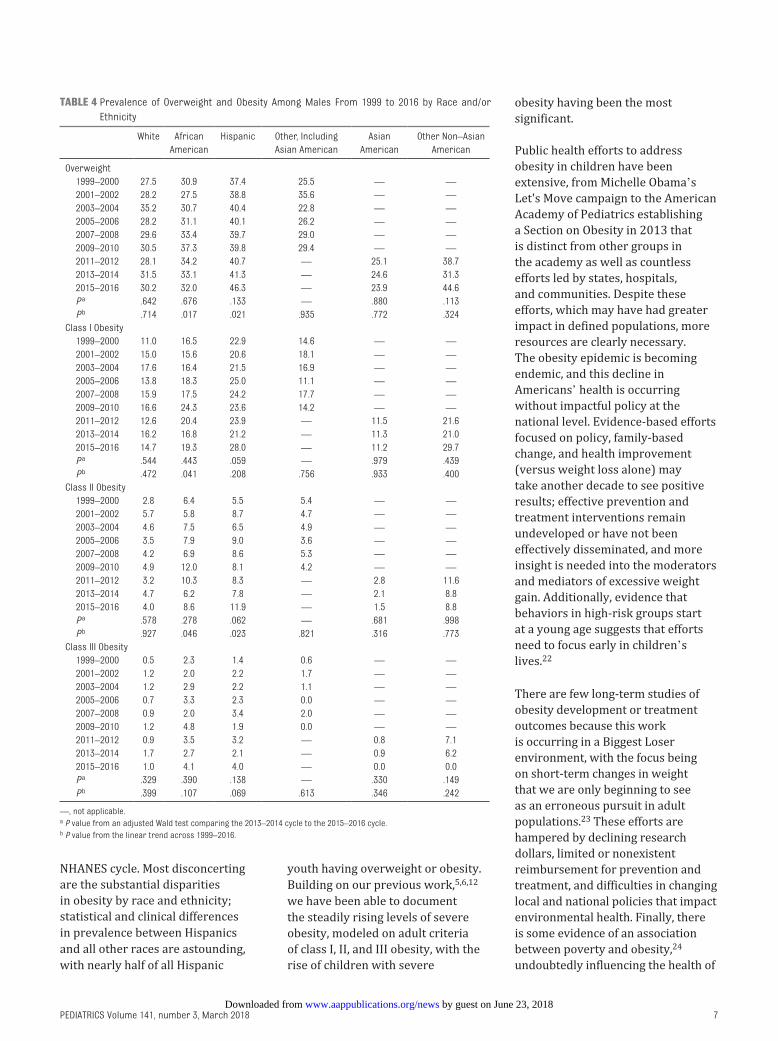
obesity by ordinal 2-year cycles (1999–2016) for females, males, and both sexes. A positive linear trend is significant for overweight (P = .003), class I obesity (P = .008), class II obesity (P = .019), and class III obesity (P < .001) for both sexes, with all ages combined. The increasing linear trend from 1999 to 2016 is most apparent among Hispanic females (Table 3). Similar to those of females, there are large increases in overweight and class II obesity among Hispanic males (Table 4). All 95% CIs are included in Supplemental Tables 5–9.
Differences From the last cycle
There are few differences in the prevalence of overweight and all classes of obesity since the last NHANES cycle, 2013–2014 and 2016–2016. One exception is a sharp increase in the prevalence of class I obesity among 2- to 5-year-olds, particularly in young males. Another notable increase is for overweight, from 36% to 48%, in among older adolescent females. There were no other significant changes from the 2013–2014 and 2015–2016 cycles for any of the race and/or
PEDIATRICS Volume 141, number 3, March 2018 3
table 1 Prevalence of Overweight and Obesity Among Children and Adolescents, 2015–2016
Total Overweight Class I Obesity Class II Obesity Class III Obesity
n = 3340 n = 1213 n = 652 n = 213 n = 73
n % % 95% CI P % 95% CI P % 95% CI P % 95% CI P
Total — — 35.1 31.9 to 38.4 18.5 15.8 to 21.2 6.0 4.3 to 7.6 1.9 1.0 to 2.9Age 2–5 y 814 20.7 26.0 21.3 to 30.7 .005 13.7 11.4 to 16.0 .239 1.8 0.6 to 3.0 0.006 0.2 −0.1 to 0.4 .059 6–8 y 655 17.2 32.8 27.1 to 38.5 — 18.8 13.1 to 24.5 — 5.1 3.2 to 7.1 — 1.4 0.5 to 2.3 — 9–11 y 613 16.5 35.6 30.7 to 40.6 — 18.5 14.8 to 22.3 — 5.3 2.9 to 7.7 — 1.0 0.4 to 1.7 — 12–15 y 675 24.9 38.7 32.7 to 44.7 — 20.6 15.6 to 25.6 — 7.5 4.2 to 10.8 — 2.2 0.9 to 3.4 — 16–19 y 583 20.7 41.5 37.1 to 45.9 — 20.5 15.5 to 25.5 — 9.5 5.8 to 13.1 — 4.5 1.7 to 7.4 —Sex Female 1644 48.9 35.5 31.6 to 39.5 .691 17.8 15.3 to 20.3 .408 5.2 3.3 to 7.1 0.243 1.8 0.8 to 2.8 .668 Male 1696 51.1 34.8 31.1 to 38.4 — 19.1 15.5 to 22.7 — 6.7 4.4 to 8.9 — 2.0 0.9 to 3.2 —Race White 925 51.9 29.9 27.4 to 32.4 <.001 14.1 11.8 to 16.5 <.001 3.9 2.8 to 5.0 <0.001 1.1 0.2 to 2.0 .001 African
American767 13.9 37.8 32.4 to 43.1 — 22.2 16.4 to 27.9 — 9.0 6.0 to 12.1 — 3.8 1.8 to 5.9 —
Hispanic 1126 23.9 45.9 41.8 to 50.0 — 25.8 22.6 to 29.0 — 9.1 6.7 to 11.6 — 3.3 2.0 to 4.6 — Asian
American288 4.7 23.2 17.8 to 28.7 — 10.7 6.8 to 14.6 — 1.4 −0.3 to 3.1 — 0.0 — —
Other 234 5.6 41.5 31.7 to 51.2 — 25.3 13.3 to 37.3 — 7.6 0.0 to 15.3 — 0.7 −0.3 to 1.6 —
—, not applicable.
by guest on June 23, 2018www.aappublications.org/newsDownloaded from

SkINNER et al4
tabl
e 2
Prev
alen
ce o
f Ove
rwei
ght a
nd O
besi
ty F
rom
199
9 to
201
6 by
Sex
and
Age
Both
Sex
esFe
mal
esM
ales
Over
wei
ght
Clas
s I
Obes
ityCl
ass
II Ob
esity
Clas
s III
Ob
esity
Over
wei
ght
Clas
s I
Obes
ityCl
ass
II Ob
esity
Clas
s III
Ob
esity
Over
wei
ght
Clas
s I
Obes
ityCl
ass
II Ob
esity
Clas
s III
Ob
esity
n%
%%
%n
%%
%%
n%
%%
%
All a
ges
19
99–2
000
4063
28.8
14.6
4.0
0.9
1992
27.5
14.6
4.0
0.9
2071
30.1
14.7
4.1
1.0
20
01–2
002
4305
29.9
15.2
5.4
1.2
2179
29.5
14.2
4.6
1.0
2126
30.3
16.2
6.2
1.5
20
03–2
004
4016
33.8
17.1
5.2
1.6
2012
32.9
16.1
5.1
1.6
2004
34.6
18.1
5.4
1.6
20
05–2
006
4252
30.1
15.8
5.1
1.3
2138
29.7
15.3
5.0
1.2
2114
30.6
16.2
5.1
1.3
20
07–2
008
3281
31.7
17.0
5.1
1.6
1556
31.2
15.9
4.6
1.6
1725
32.1
17.9
5.5
1.6
20
09–2
010
3408
31.9
17.0
5.8
1.6
1631
30.4
15.0
5.1
1.5
1777
33.3
19.0
6.5
1.7
20
11–2
012
3355
32.0
16.9
5.8
2.1
1642
31.7
17.2
5.9
2.2
1713
32.2
16.7
5.8
2.0
20
13–2
014
3523
33.5
17.3
6.2
2.3
1729
33.3
17.2
6.7
2.5
1794
33.7
17.5
5.7
2.1
20
15–2
016
3340
35.1
18.5
6.0
1.9
1644
35.5
17.8
5.2
1.8
1696
34.8
19.1
6.7
2.0
Pa
.387
.481
.790
.477
.405
.759
.236
.275
.615
.424
.436
.932
P
b.0
03.0
08.0
19<.
001
.003
.020
.028
.001
.062
.046
.108
.020
Age
2–5
19
99–2
000
726
21.2
10.7
1.8
0.2
352
20.4
11.1
2.2
0.0
374
22.0
10.3
1.4
0.4
20
01–2
002
795
22.4
10.1
2.6
0.6
412
21.7
9.9
2.5
0.3
383
23.2
10.4
2.8
0.9
20
03–2
004
819
25.9
13.4
2.8
0.7
417
25.5
12.1
1.7
0.1
402
26.4
14.6
3.9
1.3
20
05–2
006
952
22.3
10.7
1.5
0.3
479
21.1
11.0
1.4
0.2
473
23.4
10.4
1.6
0.4
20
07–2
008
885
20.9
10.3
1.7
0.8
396
21.1
10.7
2.0
1.2
489
20.6
9.8
1.4
0.4
20
09–2
010
903
26.4
12.1
2.6
0.3
432
23.2
9.6
1.5
0.3
471
29.4
14.3
3.6
0.3
20
11–2
012
871
22.6
8.3
1.6
0.5
432
21.6
7.2
1.5
0.4
439
23.6
9.3
1.8
0.6
20
13–2
014
843
25.1
9.3
1.7
0.2
415
24.8
10.0
2.7
0.1
428
25.5
8.5
0.6
0.2
20
15–2
016
814
26.0
13.7
1.8
0.2
396
25.9
13.2
1.5
0.0
418
26.0
14.2
2.0
0.3
P
a.7
73.0
11.9
28.9
62.7
69.1
40.3
26.3
23.8
63.0
18.0
75.6
24
Pb
.131
.992
.420
.294
.229
.851
.750
.933
.281
.868
.341
.258
Age
6–8
19
99–2
000
534
29.7
14.9
3.1
0.4
241
25.6
14.0
2.9
0.4
293
33.1
15.8
3.2
0.4
20
01–2
002
596
30.8
15.1
6.3
1.2
309
27.9
12.0
4.0
0.6
287
33.8
18.4
8.7
1.9
20
03–2
004
490
30.0
15.8
3.8
1.4
261
26.7
13.6
4.3
1.4
229
33.1
17.8
3.3
1.4
20
05–2
006
553
25.3
13.1
2.8
0.8
274
22.4
12.6
2.0
0.4
279
28.2
13.7
3.6
1.3
20
07–2
008
608
31.4
17.3
5.1
1.1
305
29.9
14.1
3.7
0.9
303
32.9
20.3
6.4
1.3
20
09–2
010
597
30.8
17.6
4.3
1.1
282
32.7
17.5
4.2
1.1
315
29.2
17.6
4.4
1.1
20
11–2
012
654
30.8
16.9
6.0
2.5
304
32.4
19.9
5.4
1.8
350
29.6
14.5
6.5
3.0
20
13–2
014
674
30.5
15.7
3.2
0.5
320
29.4
13.3
3.2
0.4
354
31.5
17.9
3.3
0.6
20
15–2
016
655
32.8
18.8
5.1
1.4
321
34.2
19.4
5.0
1.8
334
31.6
18.2
5.3
1.1
Pa
.503
.344
.101
.055
.364
.110
.312
.024
.987
.941
.155
.461
P
b.3
79.1
35.5
55.2
06.0
41.0
50.3
39.0
91.4
58.7
98.9
90.6
73Ag
e 9–
11
1999
–200
051
431
.716
.43.
80.
626
530
.516
.44.
20.
524
933
.016
.33.
50.
7
2001
–200
256
933
.517
.05.
91.
427
536
.517
.84.
40.
629
430
.816
.27.
32.
1
2003
–200
449
244
.822
.16.
91.
525
849
.622
.16.
61.
323
440
.322
.17.
21.
6
2005
–200
656
133
.518
.25.
40.
529
032
.416
.85.
80.
227
134
.619
.65.
00.
8
2007
–200
858
939
.722
.16.
50.
929
740
.221
.86.
60.
529
239
.122
.46.
31.
3
by guest on June 23, 2018www.aappublications.org/newsDownloaded from

PEDIATRICS Volume 141, number 3, March 2018 5
Both
Sex
esFe
mal
esM
ales
Over
wei
ght
Clas
s I
Obes
ityCl
ass
II Ob
esity
Clas
s III
Ob
esity
Over
wei
ght
Clas
s I
Obes
ityCl
ass
II Ob
esity
Clas
s III
Ob
esity
Over
wei
ght
Clas
s I
Obes
ityCl
ass
II Ob
esity
Clas
s III
Ob
esity
n%
%%
%n
%%
%%
n%
%%
%
2009
–201
061
635
.118
.75.
81.
731
031
.814
.34.
52.
430
638
.423
.37.
21.
1
2011
–201
261
438
.018
.77.
71.
431
438
.118
.67.
41.
530
037
.918
.88.
11.
3
2013
–201
462
036
.120
.25.
91.
830
935
.118
.95.
81.
431
137
.321
.65.
92.
2
2015
–201
661
335
.618
.55.
31.
032
027
.814
.05.
40.
929
343
.823
.35.
21.
2
Pa
.895
.574
.738
.269
.110
.141
.852
.396
.223
.700
.774
.417
P
b.6
54.4
93.4
10.2
40.1
38.4
20.4
64.0
59.0
36.0
68.7
02.7
79Ag
e 12
–15
19
99–2
000
1184
31.8
16.6
5.4
1.4
591
33.0
16.4
5.3
1.2
593
30.7
16.7
5.4
1.5
20
01–2
002
1191
31.4
16.8
5.8
0.8
639
32.3
16.9
5.3
1.0
552
30.6
16.7
6.2
0.6
20
03–2
004
1096
35.7
16.8
5.3
1.5
534
34.0
16.2
5.0
0.7
562
37.2
17.4
5.6
2.2
20
05–2
006
1058
34.6
18.1
6.8
1.3
531
37.0
19.6
7.5
1.1
527
32.5
16.7
6.2
1.5
20
07–2
008
608
37.9
19.5
6.2
2.3
290
39.7
18.2
5.9
2.6
318
36.3
20.8
6.3
1.9
20
09–2
010
645
33.4
17.4
7.3
1.9
321
32.9
16.4
5.4
0.7
324
34.0
18.5
9.3
3.2
20
11–2
012
623
36.7
23.3
7.2
2.5
300
35.0
23.6
7.9
3.1
323
38.3
22.9
6.4
1.9
20
13–2
014
718
38.2
20.1
6.8
3.0
345
40.4
22.1
5.7
2.5
373
36.2
18.3
7.8
3.4
20
15–2
016
675
38.7
20.6
7.5
2.2
313
39.2
20.6
5.1
1.0
362
38.2
20.6
9.7
3.2
Pa
.906
.889
.686
.386
.852
.792
.775
.286
.643
.554
.464
.880
P
b.0
18.0
14.1
00.0
04.0
89.0
49.7
32.1
50.0
52.0
90.0
48.0
20Ag
e 16
–19
19
99–2
000
1105
30.4
15.0
5.8
1.9
543
28.6
15.4
5.0
2.1
562
32.2
14.5
6.6
1.8
20
01–2
002
1154
31.0
16.5
6.1
2.1
544
29.3
14.3
6.2
2.2
610
32.5
18.6
5.9
2.0
20
03–2
004
1119
33.8
18.3
7.3
2.8
542
31.1
17.4
7.8
4.0
577
36.3
19.2
6.9
1.5
20
05–2
006
1128
33.6
18.0
7.8
2.9
564
33.5
15.6
7.4
3.4
564
33.7
20.4
8.3
2.5
20
07–2
008
591
30.8
17.1
6.4
2.6
268
27.0
15.6
5.0
2.2
323
34.2
18.4
7.6
3.1
20
09–2
010
647
34.3
20.0
8.7
3.0
286
32.3
17.8
9.7
3.4
361
36.0
22.0
7.7
2.6
20
11–2
012
593
32.8
17.6
7.0
3.7
292
32.8
17.4
7.4
4.2
301
32.8
17.9
6.7
3.2
20
13–2
014
668
36.7
21.2
12.4
5.4
340
35.6
20.8
15.1
7.5
328
37.8
21.6
10.0
3.6
20
15–2
016
583
41.5
20.5
9.5
4.5
294
47.9
21.1
9.1
5.2
289
34.8
19.9
9.8
3.8
P
a.2
00.8
45.2
10.5
94.0
32.9
44.0
76.3
49.5
99.7
44.9
45.8
73
Pb
.001
.031
.003
.002
<.00
1.0
35.0
07.0
13.4
10.4
10.0
90.0
17
a P
valu
e fr
om a
n ad
just
ed W
ald
test
com
pari
ng th
e 20
13–2
014
cycl
e to
the
2015
–201
6 cy
cle.
b P
valu
e fr
om th
e lin
ear
tren
d ac
ross
199
9–20
16.
tabl
e 2
Cont
inue
d
by guest on June 23, 2018www.aappublications.org/newsDownloaded from

sex subgroups in any of the obesity categories.
DIscussIOn
Despite reports that obesity in children and adolescents in the
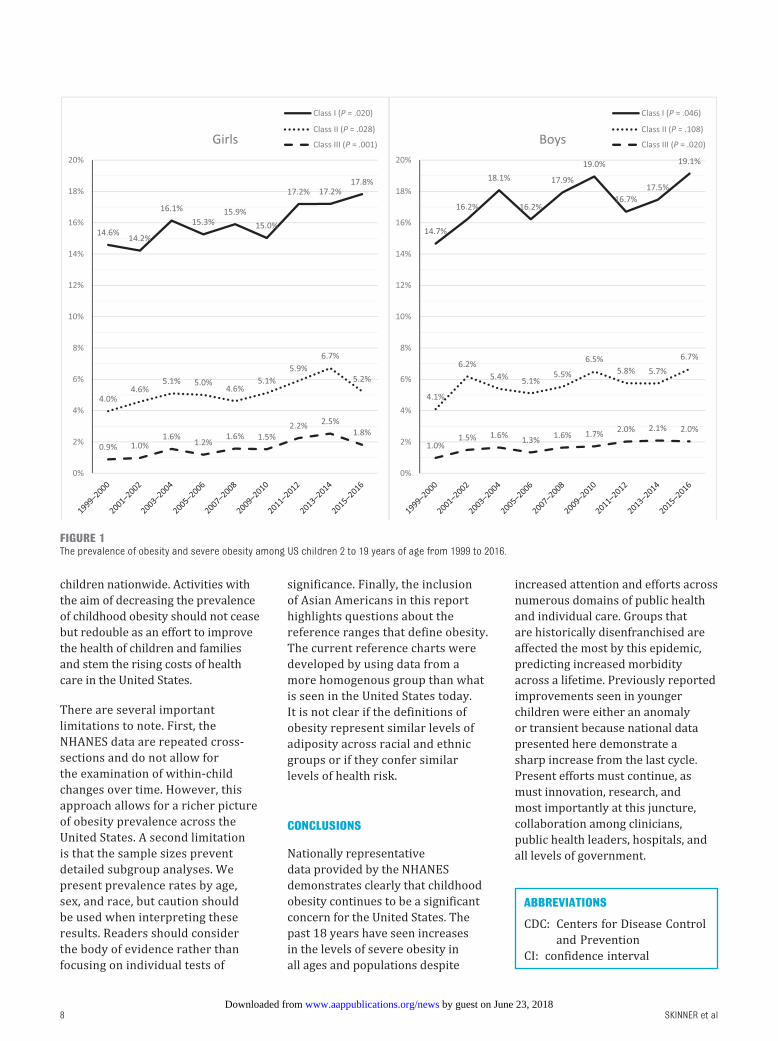
United States has stabilized in recent years, 1 our more nuanced view highlights the continued upward trend for this nationally representative sample (Fig 1). Significant increases in obesity and severe obesity in children aged 2
to 5 years and adolescent females aged 16 to 19 years from 2015 to 2016, compared with previous years, show that obesity is increasing in these subgroups. Whether this year-over-year change represents a trend remains to be seen because shifts per cycle can be large. We recommend that readers consider both the long-term trends as well as changes over 2-year cycles when considering the effects in specific populations.
The prevalence of childhood obesity in the United States remains high, with ∼1 in 5 children having obesity. By applying updated obesity classifications16 to data starting in the 1999–2000 cycle of the NHANES, there continue to be increases in most categories of obesity across all age groups. By age, adolescents have had a significantly increased prevalence across all obesity categories since the 1999–2000 cycle. Substantial racial-ethnic differences remain, with African Americans and Hispanics having a higher prevalence across nearly all classes of obesity and all years between 1999 and 2016. Notably, Asian Americans have a much lower prevalence of obesity in all age and sex categories. There were few differences in obesity prevalence from the previous cycle (2013–2014), with the exception of Hispanic males, who saw significant increases, and boys ages 2 to 5 years, who have had a 40% increase in prevalence since 2011.
Despite intense clinical and public health focus on obesity and weight-related behaviors during the past decade, obesity prevalence remains high, with scant evidence that these efforts are counteracting the personal and environmental forces that contribute to excess weight gain in children, at least on a national scope. These findings are disappointing in light of reported decreases in obesity prevalence in younger children, 2, 4, 17 – 21 which was the only age group as a whole to see a significant increase in prevalence since the 2013–2014
SkINNER et al6
table 3 Prevalence of Overweight and Obesity Among Females From 1999 to 2016 by Race
White African American
Hispanic Other, Including Asian American
Asian American
Other Non–Asian American
Overweight 1999–2000 23.1 37.8 31.7 28.5 — — 2001–2002 26.5 37.0 35.4 23.7 — — 2003–2004 31.9 40.7 34.7 18.4 — — 2005–2006 27.4 38.7 35.6 16.0 — — 2007–2008 29.2 39.1 36.2 16.9 — — 2009–2010 25.6 41.0 38.7 23.7 — — 2011–2012 29.2 36.1 37.5 — 13.7 37.7 2013–2014 27.5 41.1 42.6 — 16.7 39.9 2015–2016 29.5 43.7 45.5 — 22.5 38.4 Pa .575 .601 .284 — .286 .891 Pb .282 .211 <.001 .487 .118 .964Class I Obesity 1999–2000 12.0 21.5 15.4 18.4 — — 2001–2002 12.6 19.7 17.3 8.3 — — 2003–2004 14.8 24.0 17.1 6.2 — — 2005–2006 12.5 24.4 20.8 5.6 — — 2007–2008 14.9 23.1 17.2 4.9 — — 2009–2010 11.7 24.3 19.0 11.6 — — 2011–2012 15.6 20.7 20.6 — 5.6 19.7 2013–2014 14.8 20.9 22.1 — 5.0 19.4 2015–2016 13.6 25.1 23.5 — 10.1 20.9 Pa .690 .349 .600 — .042 .820 Pb .382 .620 <.001 .336 .175 .866Class II Obesity 1999–2000 3.0 7.9 3.5 4.9 — — 2001–2002 3.3 7.7 7.1 1.9 — — 2003–2004 4.1 10.3 5.4 0.9 — — 2005–2006 3.5 10.9 6.6 1.2 — — 2007–2008 3.7 8.2 5.9 0.7 — — 2009–2010 4.4 9.5 5.4 1.9 — — 2011–2012 4.7 10.2 7.0 — 1.0 6.5 2013–2014 6.0 8.6 8.9 — 0.4 4.4 2015–2016 3.8 9.5 6.3 — 1.2 6.5 Pa .200 .754 .142 — .489 .554 Pb .087 .596 .037 .279 .890 .945Class III Obesity 1999–2000 0.4 2.8 1.0 0.6 — — 2001–2002 0.5 2.5 1.9 0.0 — — 2003–2004 1.0 4.7 1.4 0.0 — — 2005–2006 0.4 4.7 1.3 0.0 — — 2007–2008 1.6 2.6 1.4 0.0 — — 2009–2010 1.0 4.5 1.7 0.0 — — 2011–2012 2.5 5.4 0.5 — 0.0 0.0 2013–2014 2.7 3.9 2.0 — 0.0 2.1 2015–2016 1.2 3.6 2.6 — 0.0 1.3 Pa .139 .808 .537 — — .650 Pb .003 .263 .215 .155 — .311
—, not applicable.a P value from an adjusted Wald test comparing the 2013–2014 cycle to the 2015–2016 cycle.b P value from the linear trend across 1999–2016.
by guest on June 23, 2018www.aappublications.org/newsDownloaded from
NHANES cycle. Most disconcerting are the substantial disparities in obesity by race and ethnicity; statistical and clinical differences in prevalence between Hispanics and all other races are astounding, with nearly half of all Hispanic
youth having overweight or obesity. Building on our previous work, 5, 6, 12 we have been able to document the steadily rising levels of severe obesity, modeled on adult criteria of class I, II, and III obesity, with the rise of children with severe
obesity having been the most significant.
Public health efforts to address obesity in children have been extensive, from Michelle Obama’s Let's Move campaign to the American Academy of Pediatrics establishing a Section on Obesity in 2013 that is distinct from other groups in the academy as well as countless efforts led by states, hospitals, and communities. Despite these efforts, which may have had greater impact in defined populations, more resources are clearly necessary. The obesity epidemic is becoming endemic, and this decline in Americans’ health is occurring without impactful policy at the national level. Evidence-based efforts focused on policy, family-based change, and health improvement (versus weight loss alone) may take another decade to see positive results; effective prevention and treatment interventions remain undeveloped or have not been effectively disseminated, and more insight is needed into the moderators and mediators of excessive weight gain. Additionally, evidence that behaviors in high-risk groups start at a young age suggests that efforts need to focus early in children’s lives.22
There are few long-term studies of obesity development or treatment outcomes because this work is occurring in a Biggest Loser environment, with the focus being on short-term changes in weight that we are only beginning to see as an erroneous pursuit in adult populations.23 These efforts are hampered by declining research dollars, limited or nonexistent reimbursement for prevention and treatment, and difficulties in changing local and national policies that impact environmental health. Finally, there is some evidence of an association between poverty and obesity, 24 undoubtedly influencing the health of
PEDIATRICS Volume 141, number 3, March 2018 7
table 4 Prevalence of Overweight and Obesity Among Males From 1999 to 2016 by Race and/or Ethnicity
White African American
Hispanic Other, Including Asian American
Asian American
Other Non–Asian American
Overweight 1999–2000 27.5 30.9 37.4 25.5 — — 2001–2002 28.2 27.5 38.8 35.6 — — 2003–2004 35.2 30.7 40.4 22.8 — — 2005–2006 28.2 31.1 40.1 26.2 — — 2007–2008 29.6 33.4 39.7 29.0 — — 2009–2010 30.5 37.3 39.8 29.4 — — 2011–2012 28.1 34.2 40.7 — 25.1 38.7 2013–2014 31.5 33.1 41.3 — 24.6 31.3 2015–2016 30.2 32.0 46.3 — 23.9 44.6 Pa .642 .676 .133 — .880 .113 Pb .714 .017 .021 .935 .772 .324Class I Obesity 1999–2000 11.0 16.5 22.9 14.6 — — 2001–2002 15.0 15.6 20.6 18.1 — — 2003–2004 17.6 16.4 21.5 16.9 — — 2005–2006 13.8 18.3 25.0 11.1 — — 2007–2008 15.9 17.5 24.2 17.7 — — 2009–2010 16.6 24.3 23.6 14.2 — — 2011–2012 12.6 20.4 23.9 — 11.5 21.6 2013–2014 16.2 16.8 21.2 — 11.3 21.0 2015–2016 14.7 19.3 28.0 — 11.2 29.7 Pa .544 .443 .059 — .979 .439 Pb .472 .041 .208 .756 .933 .400Class II Obesity 1999–2000 2.8 6.4 5.5 5.4 — — 2001–2002 5.7 5.8 8.7 4.7 — — 2003–2004 4.6 7.5 6.5 4.9 — — 2005–2006 3.5 7.9 9.0 3.6 — — 2007–2008 4.2 6.9 8.6 5.3 — — 2009–2010 4.9 12.0 8.1 4.2 — — 2011–2012 3.2 10.3 8.3 — 2.8 11.6 2013–2014 4.7 6.2 7.8 — 2.1 8.8 2015–2016 4.0 8.6 11.9 — 1.5 8.8 Pa .578 .278 .062 — .681 .998 Pb .927 .046 .023 .821 .316 .773Class III Obesity 1999–2000 0.5 2.3 1.4 0.6 — — 2001–2002 1.2 2.0 2.2 1.7 — — 2003–2004 1.2 2.9 2.2 1.1 — — 2005–2006 0.7 3.3 2.3 0.0 — — 2007–2008 0.9 2.0 3.4 2.0 — — 2009–2010 1.2 4.8 1.9 0.0 — — 2011–2012 0.9 3.5 3.2 — 0.8 7.1 2013–2014 1.7 2.7 2.1 — 0.9 6.2 2015–2016 1.0 4.1 4.0 — 0.0 0.0 Pa .329 .390 .138 — .330 .149 Pb .399 .107 .069 .613 .346 .242
—, not applicable.a P value from an adjusted Wald test comparing the 2013–2014 cycle to the 2015–2016 cycle.b P value from the linear trend across 1999–2016.
by guest on June 23, 2018www.aappublications.org/newsDownloaded from
children nationwide. Activities with the aim of decreasing the prevalence of childhood obesity should not cease but redouble as an effort to improve the health of children and families and stem the rising costs of health care in the United States.
There are several important limitations to note. First, the NHANES data are repeated cross-sections and do not allow for the examination of within-child changes over time. However, this approach allows for a richer picture of obesity prevalence across the United States. A second limitation is that the sample sizes prevent detailed subgroup analyses. We present prevalence rates by age, sex, and race, but caution should be used when interpreting these results. Readers should consider the body of evidence rather than focusing on individual tests of
significance. Finally, the inclusion of Asian Americans in this report highlights questions about the reference ranges that define obesity. The current reference charts were developed by using data from a more homogenous group than what is seen in the United States today. It is not clear if the definitions of obesity represent similar levels of adiposity across racial and ethnic groups or if they confer similar levels of health risk.
cOnclusIOns
Nationally representative data provided by the NHANES demonstrates clearly that childhood obesity continues to be a significant concern for the United States. The past 18 years have seen increases in the levels of severe obesity in all ages and populations despite
increased attention and efforts across numerous domains of public health and individual care. Groups that are historically disenfranchised are affected the most by this epidemic, predicting increased morbidity across a lifetime. Previously reported improvements seen in younger children were either an anomaly or transient because national data presented here demonstrate a sharp increase from the last cycle. Present efforts must continue, as must innovation, research, and most importantly at this juncture, collaboration among clinicians, public health leaders, hospitals, and all levels of government.
SkINNER et al8
abbRevIatIOns
CDC: Centers for Disease Control and Prevention
CI: confidence interval
FIGuRe 1The prevalence of obesity and severe obesity among US children 2 to 19 years of age from 1999 to 2016.
by guest on June 23, 2018www.aappublications.org/newsDownloaded from

ReFeRences
1. Ogden CL, Carroll MD, Lawman HG, et al. Trends in obesity prevalence among children and adolescents in the United States, 1988-1994 through 2013-2014. JAMA. 2016;315(21):2292–2299
2. Ogden CL, Carroll MD, kit Bk, Flegal kM. Prevalence of childhood and adult obesity in the United States, 2011-2012. JAMA. 2014;311(8):806–814
3. Ogden CL, Carroll MD, Fryar CD, Flegal kM. Prevalence of obesity among adults and youth: United States, 2011-2014. NCHS Data Brief. 2015;(219):1–8
4. Pan L, Freedman DS, Sharma AJ, et al. Trends in obesity among participants aged 2-4 years in the special supplemental nutrition program for women, infants, and children - United States, 2000-2014. MMWR Morb Mortal Wkly Rep. 2016;65(45):1256–1260
5. Skinner AC, Perrin EM, Skelton JA. Prevalence of obesity and severe obesity in US children, 1999-2014. Obesity (Silver Spring). 2016;24(5):1116–1123
6. Skinner AC, Skelton JA. Prevalence and trends in obesity and severe obesity among children in the United States, 1999-2012. JAMA Pediatr. 2014;168(6):561–566
7. Barlow SE; Expert Committee. Expert committee recommendations regarding the prevention, assessment, and treatment of child and adolescent overweight and obesity: summary report. Pediatrics. 2007;120(suppl 4):S164–S192
8. Freedman DS, Butte NF, Taveras EM, et al. BMI z-scores are a poor indicator of adiposity among 2- to 19-year-olds with very high BMIs, NHANES 1999-2000 to 2013-2014. Obesity (Silver Spring). 2017;25(4):739–746
9. Flegal kM, Wei R, Ogden CL, Freedman DS, Johnson CL, Curtin LR. Characterizing extreme values of
body mass index-for-age by using the 2000 Centers for Disease Control and Prevention growth charts. Am J Clin Nutr. 2009;90(5):1314–1320
10. Vanderwall C, Randall Clark R, Eickhoff J, Carrel AL. BMI is a poor predictor of adiposity in young overweight and obese children. BMC Pediatr. 2017;17(1):135
11. Freedman DS, Berenson GS. Tracking of BMI z scores for severe obesity. Pediatrics. 2017;140(3):e20171072
12. Skinner AC, Perrin EM, Moss LA, Skelton JA. Cardiometabolic risks and severity of obesity in children and young adults. N Engl J Med. 2015;373(14):1307–1317
13. Hales CM, Carroll MD, Fryar CD, Ogden CL. Prevalence of obesity among adults and youth: United States, 2015-2016. NCHS Data Brief. 2017;(288):1–8
14. kuczmarski RJ, Ogden CL, Guo SS, et al. 2000 CDC growth charts for the United States: methods and development. Vital Health Stat 11. 2002;(246):1–190
15. Skinner AC, Perrin EM, Skelton JA. Cardiometabolic risks and obesity in the young. N Engl J Med. 2016;374(6):592–593
16. kelly AS, Barlow SE, Rao G, et al; American Heart Association Atherosclerosis, Hypertension, and Obesity in the Young Committee of the Council on Cardiovascular Disease in the Young; Council on Nutrition, Physical Activity and Metabolism; Council on Clinical Cardiology. Severe obesity in children and adolescents: identification, associated health risks, and treatment approaches: a scientific statement from the American Heart Association. Circulation. 2013;128(15):1689–1712
17. May AL, Pan L, Sherry B, et al; Centers for Disease Control and Prevention. Vital signs: obesity among low-income,
preschool-aged children--United States, 2008-2011. MMWR Morb Mortal Wkly Rep. 2013;62(31):629–634
18. Pan L, Blanck HM, Sherry B, Dalenius k, Grummer-Strawn LM. Trends in the prevalence of extreme obesity among US preschool-aged children living in low-income families, 1998-2010. JAMA. 2012;308(24):2563–2565
19. Wen X, Gillman MW, Rifas-Shiman SL, Sherry B, kleinman k, Taveras EM. Decreasing prevalence of obesity among young children in Massachusetts from 2004 to 2008. Pediatrics. 2012;129(5):823–831
20. Robbins JM, Mallya G, Wagner A, Buehler JW. Prevalence, disparities, and trends in obesity and severe obesity among students in the school district of Philadelphia, Pennsylvania, 2006-2013. Prev Chronic Dis. 2015;12:E134
21. Day SE, konty kJ, Leventer-Roberts M, Nonas C, Harris TG. Severe obesity among children in New York City public elementary and middle schools, school years 2006-07 through 2010-11. Prev Chronic Dis. 2014;11:E118
22. Perrin EM, Rothman RL, Sanders LM, et al. Racial and ethnic differences associated with feeding- and activity-related behaviors in infants. Pediatrics. 2014;133(4). Available at: www. pediatrics. org/ cgi/ content/ full/ 133/ 4/ e857
23. Fothergill E, Guo J, Howard L, et al. Persistent metabolic adaptation 6 years after “the biggest loser” competition. Obesity (Silver Spring). 2016;24(8):1612–1619
24. Lee H, Andrew M, Gebremariam A, Lumeng JC, Lee JM. Longitudinal associations between poverty and obesity from birth through adolescence. Am J Public Health. 2014;104(5):e70–e76
PEDIATRICS Volume 141, number 3, March 2018 9
Copyright © 2018 by the American Academy of Pediatrics
FInancIal DIsclOsuRe: The authors have indicated they have no financial relationships relevant to this article to disclose.
FunDInG: Dr. Skinner, Ms. Ravanbakht, and Dr. Armstrong are supported by an American Heart Association Strategically Focused Research Network Award, 17SFRN33670990.
POtentIal cOnFlIct OF InteRest: The authors have indicated they have no potential conflicts of interest to disclose.
cOMPanIOn PaPeR: A companion to this article can be found online at www.pediatrics.org/cgi/doi/10.1542/peds.2017-4078.
by guest on June 23, 2018www.aappublications.org/newsDownloaded from

originally published online February 26, 2018; Pediatrics and Sarah C. Armstrong
Asheley Cockrell Skinner, Sophie N. Ravanbakht, Joseph A. Skelton, Eliana M. Perrin2016−Prevalence of Obesity and Severe Obesity in US Children, 1999
ServicesUpdated Information &
017-3459http://pediatrics.aappublications.org/content/early/2018/02/22/peds.2including high resolution figures, can be found at:
References
017-3459#BIBLhttp://pediatrics.aappublications.org/content/early/2018/02/22/peds.2This article cites 24 articles, 6 of which you can access for free at:
Subspecialty Collections
http://www.aappublications.org/cgi/collection/obesity_new_subObesityfollowing collection(s): This article, along with others on similar topics, appears in the
Permissions & Licensing
http://www.aappublications.org/site/misc/Permissions.xhtmlin its entirety can be found online at: Information about reproducing this article in parts (figures, tables) or
Reprintshttp://www.aappublications.org/site/misc/reprints.xhtmlInformation about ordering reprints can be found online:
by guest on June 23, 2018www.aappublications.org/newsDownloaded from
originally published online February 26, 2018; Pediatrics and Sarah C. Armstrong
Asheley Cockrell Skinner, Sophie N. Ravanbakht, Joseph A. Skelton, Eliana M. Perrin2016−Prevalence of Obesity and Severe Obesity in US Children, 1999
http://pediatrics.aappublications.org/content/early/2018/02/22/peds.2017-3459located on the World Wide Web at:
The online version of this article, along with updated information and services, is
http://pediatrics.aappublications.org/content/suppl/2018/02/21/peds.2017-3459.DCSupplementalData Supplement at:
1073-0397. ISSN:60007. Copyright © 2018 by the American Academy of Pediatrics. All rights reserved. Print
the American Academy of Pediatrics, 141 Northwest Point Boulevard, Elk Grove Village, Illinois,has been published continuously since 1948. Pediatrics is owned, published, and trademarked by Pediatrics is the official journal of the American Academy of Pediatrics. A monthly publication, it
by guest on June 23, 2018www.aappublications.org/newsDownloaded from