prevalence of legal problems overall - lawfoundation.net.aufile/chapter3.… · prevalence of legal...
TRANSCRIPT
3. Prevalence of legal problems
This chapter describes the prevalence of legal problems in the NSW sample, detailing the number, type and severity of legal problems experienced. It also examines the demographic characteristics of respondents that are associated with experiencing different types of legal problems.
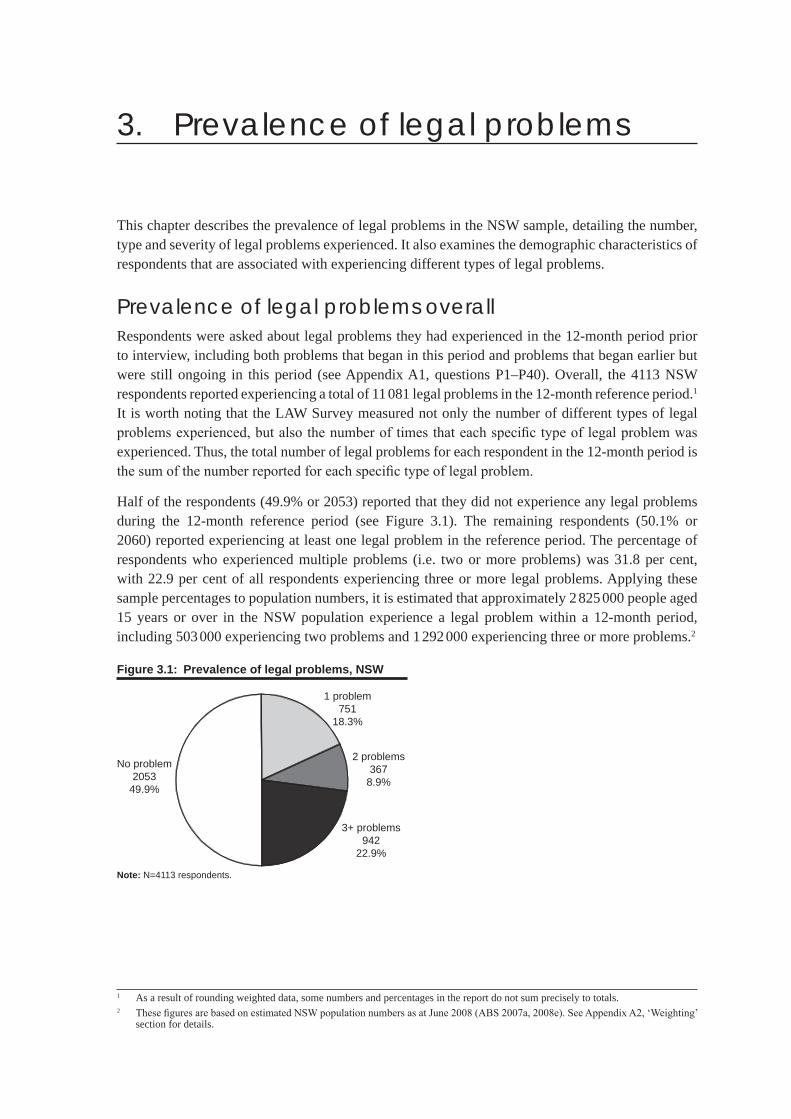
Prevalence of legal problems overall Respondents were asked about legal problems they had experienced in the 12-month period prior to interview, including both problems that began in this period and problems that began earlier but were still ongoing in this period (see Appendix A1, questions P1–P40). Overall, the 4113 NSW respondents reported experiencing a total of 11 081 legal problems in the 12-month reference period.1 It is worth noting that the LAW Survey measured not only the number of different types of legal problems experienced, but also the number of times that each specific type of legal problem was experienced. Thus, the total number of legal problems for each respondent in the 12-month period is the sum of the number reported for each specific type of legal problem.
Half of the respondents (49.9% or 2053) reported that they did not experience any legal problems during the 12-month reference period (see Figure 3.1). The remaining respondents (50.1% or 2060) reported experiencing at least one legal problem in the reference period. The percentage of respondents who experienced multiple problems (i.e. two or more problems) was 31.8 per cent, with 22.9 per cent of all respondents experiencing three or more legal problems. Applying these sample percentages to population numbers, it is estimated that approximately 2 825 000 people aged 15 years or over in the NSW population experience a legal problem within a 12-month period, including 503 000 experiencing two problems and 1 292 000 experiencing three or more problems.2
Figure 3.1: Prevalence of legal problems, NSW
No problem2053
49.9%
1 problem751
18.3%
2 problems367
8.9%
3+ problems942
22.9%
Note: N=4113 respondents.
1 As a result of rounding weighted data, some numbers and percentages in the report do not sum precisely to totals.2 These figures are based on estimated NSW population numbers as at June 2008 (ABS 2007a, 2008e). See Appendix A2, ‘Weighting’
section for details.
58 Legal Australia-Wide Survey: New South Wales
The median number of legal problems for those NSW respondents who experienced at least one legal problem was 2.0,3 while the most commonly reported number of problems (i.e. the mode) for those who experienced legal problems was 1.0.4
Table 3.1 presents a cumulative frequency distribution of legal problems for the NSW respondents.5
It can be seen that a minority of respondents accounted for a disproportionate number of the legal problems experienced. For example, while the respondents who experienced three or more legal problems represented less than one-quarter of the NSW sample (22.9%), they accounted for more than four-fifths of the 11 081 legal problems experienced (86.6%). Almost one-tenth (9.4%) of
3 The median, like the mean or average, is a measure of the central tendency of a frequency distribution. The median provides the midpoint of the frequency distribution and is a more appropriate measure of central tendency than the mean when the distribution is skewed, as it is in the present case. When the distribution is skewed, the mean can be unduly influenced by a minority of extreme scores, resulting in a distorted picture of what constitutes a ‘typical’ score.
4 When respondents were not sure whether they had experienced a specific type of legal problem in the reference period, they were not credited with experiencing that problem type. Furthermore, in a small number of cases, a respondent reported experiencing a problem type but did not specify how many times they had experienced this problem type in the reference period. In these cases, a frequency of one was assigned to such specific problem types, given that the mode for each specific problem type across the Australian sample was 1.0.
5 As for Figure 3.1, the total number of legal problems for each respondent is the sum of the frequency reported for each specific type of legal problem.
Table 3.1: Cumulative frequency distribution of legal problems, NSW
Problemsper respondent
All respondents All problems
N Cumulative%
N Cumulative%
25+ 76 1.9 3 753 33.9
24 2 1.9 37 34.2
23 10 2.1 230 36.3
22 2 2.2 46 36.7
21 1 2.2 23 36.9
20 3 2.3 66 37.5
19 12 2.6 219 39.5
18 8 2.8 135 40.7
17 11 3.0 189 42.4
16 14 3.4 216 44.3
15 11 3.6 167 45.8
14 12 3.9 165 47.3
13 17 4.3 218 49.3
12 15 4.7 174 50.9
11 32 5.4 351 54.0
10 30 6.2 304 56.8
9 35 7.0 312 59.6
8 44 8.1 353 62.8
7 55 9.4 386 66.3
6 85 11.5 512 70.9
5 87 13.6 437 74.8
4 162 17.6 646 80.7
3 219 22.9 657 86.6
2 367 31.8 733 93.2
1 751 50.1 751 100.0
0 2 053 100.0
Total 4 113 11 081
Note: N=4113 respondents.

Prevalence of legal problems 59
the sample accounted for approximately two-thirds of the problems (66.3%), and 4.7 per cent of the sample accounted for about half of the problems (50.9%). It is worth remembering here that the legal problems experienced by some respondents included multiple instances of the same specific type of legal problem in the reference period.6
Prevalence of different types of legal problemsAs noted earlier, the survey measured the prevalence of 129 specific types of legal problems. These 129 problem types were categorised into 12 problem groups and 27 problem subgroups (see Appendix Table A2.1).
Table 3.2 presents the prevalence of legal problems during the 12-month reference period broken down by problem group and problem subgroup. Appendix Table A2.1 details the classification of specific types of legal problems into problem groups and problem subgroups.
As shown in Table 3.2, there was considerable variation in the prevalence of different legal problem groups. The problem groups with the highest prevalence rates were the consumer, crime, housing and government problem groups, which were experienced by 21.0, 14.0, 13.0 and 10.7 per cent of NSW respondents, respectively. In contrast, only 3.6 per cent of NSW respondents experienced legal problems from the health problem group, and only 4.3 per cent of respondents experienced legal problems from the family problem group. Legal problems related to mental health were experienced by only 0.5 per cent of respondents.
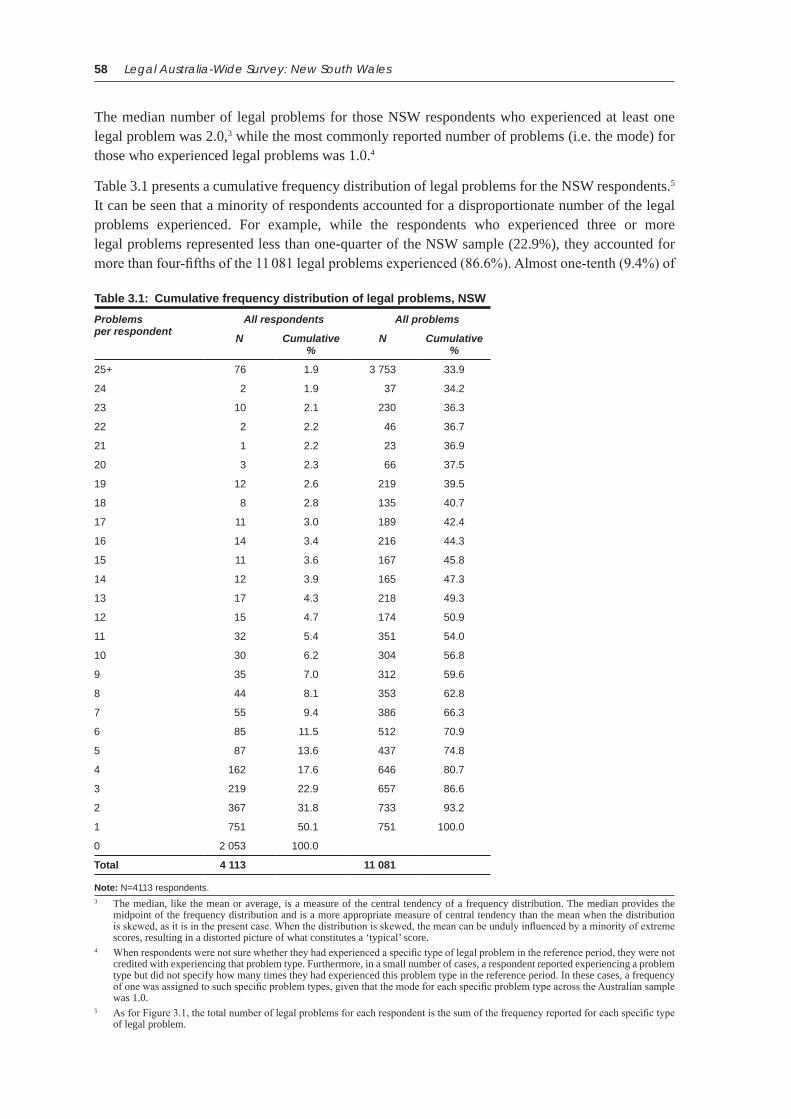
Prevalence of substantial legal problemsFor each specific type of legal problem reported, the respondent rated the problem’s severity in terms of its impact on their everyday life, choosing from ‘none’, ‘slight’, ‘moderate’ and ‘severe’ impact. When the respondent reported two or more instances of the same specific type of problem, they were asked to rate the severity of only the worst of these problems.
For convenience, throughout this report, problems rated as having no impact or only a slight impact on everyday life are referred to as ‘minor problems’, and problems rated as having a moderate or severe impact on everyday life are referred to as ‘substantial problems’.
Figure 3.2 presents the number of respondents who experienced substantial problems. The 2060 NSW respondents who experienced legal problems comprised 1156 respondents who had at least one substantial problem and 904 respondents whose worst (or sole) problem was only minor.7 The 1156 respondents with a substantial legal problem represented 28.1 per cent of the entire sample of 4113 respondents. Translating this number of respondents with a substantial problem into population numbers, it is estimated that 1 586 000 people aged 15 years or over in the NSW population experience a substantial legal problem within a 12-month period.8
6 In a small minority of cases, frequencies of 20 or more for some specific problem types were reported by individual respondents. 7 In a small number of cases, respondents did not provide problem severity ratings for some of their problems. Unless a severity rating
of ‘substantial’ was provided for at least one of a respondent’s problems, the respondent was assigned to the ‘minor problems only’ category.
8 These figures are based on estimated NSW population numbers as at June 2008 (ABS 2007a, 2008e). See Appendix A2, ‘Weighting’ section for details.

60 Legal Australia-Wide Survey: New South Wales
Table 3.2: Prevalence of legal problems by problem group and problem subgroup, NSW
Problem groupProblem subgroup
Respondents with problems
All problems
N % N %
Accidents 307 7.5 343 3.1
Consumer 862 21.0 2 296 20.7
Goods 321 7.8 648 5.8
Services 681 16.6 1 648 14.9
Credit/debt 260 6.3 703 6.3
Crime 575 14.0 1 667 15.0
Crime offender 60 1.5 145 1.3
Crime victim 541 13.2 1 522 13.7
Employment 254 6.2 649 5.9
Family 176 4.3 553 5.0
Childrena 123 3.0 443 4.0
Relationships 70 1.7 111 1.0
Government 439 10.7 916 8.3
Fines 125 3.0 294 2.7
Government payments 89 2.2 163 1.5
Local government 191 4.7 327 2.9
State/federal government 103 2.5 133 1.2
Health 148 3.6 312 2.8
Clinical negligence 103 2.5 158 1.4
Health services 42 1.0 121 1.1
Mental health 19 0.5 33 0.3
Housing 534 13.0 1 570 14.2
Neighbours 344 8.4 1 089 9.8
Owned housing 101 2.4 186 1.7
Rented housing 137 3.3 283 2.6
Other housing 8 0.2 11 0.1
Money 244 5.9 606 5.5
Business/investment 175 4.3 449 4.1
Wills/estates 82 2.0 157 1.4
Personal injury 316 7.7 543 4.9
Rights 257 6.2 920 8.3
Discrimination (outside work) 109 2.7 410 3.7
Education 98 2.4 281 2.5
Unfair treatment by police 70 1.7 224 2.0
Other civil 4 0.1 5 0.0
Unclassifiedb 1 0.0 3 0.0
All problem groups 2 060 50.1 11 081 100.0
a Includes problems related to grandchildren (see Appendix A1, question P28). Some respondents (205) had missing information on whether they had grandchildren (see Appendix A1, question D6) and were not asked about legal problems related to grandchildren. Thus, the prevalence reported for the children problem subgroup may slightly underestimate the true prevalence.
b Comprises problems that were unclearly described by respondents at question P40 (see Appendix A1).
Note: N=4113 respondents. Percentages do not sum to 100, because multiple problems were experienced by some respondents.

Prevalence of legal problems 61
Figure 3.2: Prevalence of substantial legal problems, NSW
Minor problem(s) only904
22.0%
Substantial problem(s)1156
28.1%
No problem2053
49.9%
Note: N=4113 respondents.
Table 3.3 displays the number of NSW respondents with substantial problems broken down by problem group and problem subgroup (see first data column). The number of respondents with a substantial problem of a particular type (i.e. from a particular problem group or problem subgroup) is expressed both as a percentage of the respondents who experienced that problem type (see second data column) and as a percentage of the entire sample (see third data column). For example, 55 respondents indicated that they had experienced an accidents problem that was substantial. These 55 respondents represented 17.8 per cent of the 307 respondents who had experienced an accidents problem and 1.3 per cent of the entire NSW sample of 4113 respondents.
The second data column in Table 3.3 shows that problem groups varied considerably in the proportion of substantial problems they comprised. The family and health problem groups comprised the highest percentages of substantial problems, while the accidents, crime and consumer problem groups comprised the lowest. More specifically, the majority of respondents who experienced family (77.8%) or health (70.9%) problems had at least one substantial problem of this type, whereas less than half of the respondents with accidents (17.8%), crime (42.6%) or consumer (44.4%) problems had at least one substantial problem of this type.
Although the consumer and crime problem groups tended to comprise predominantly minor problems, they were, as previously discussed, the most prevalent problem groups — 21.0 per cent of the entire sample experienced a consumer problem, and 14.0 per cent of the sample experienced a crime problem (see fifth data column).9 The sheer volume of these types of problems means that the prevalence of substantial problems of these types was also high, even though most of these problems were minor. Specifically, 9.3 per cent of the sample experienced a substantial consumer problem, and 6.0 per cent experienced a substantial crime problem (see third data column). Following the consumer and crime problem groups, the housing and government problem groups had the next highest prevalence of substantial problems. A substantial housing problem was experienced by 6.2 per cent of all respondents, and a substantial government problem was experienced by 5.9 per cent of all respondents.
As already noted, the prevalence of family and health problems in the sample was low, at 4.3 and 3.6 per cent, respectively (see fifth data column). As a result, the prevalence of substantial problems of these types in the sample was also low (3.3% and 2.6%, respectively; see third data column), even though most family and health problems were rated as substantial.
9 The fourth and fifth data columns of Table 3.3 are identical to the first two data columns in Table 3.2 and show the prevalence of each problem group and subgroup irrespective of problem severity.

62 Legal Australia-Wide Survey: New South Wales
Table 3.3: Prevalence of substantial legal problems by problem group and problem subgroup, NSW
Problem groupProblem subgroup
Respondents with substantial problems
Respondents with problems
N % of respondents
with this problem type
% of all respondents
N % of all respondents
Accidents 55 17.8 1.3 307 7.5
Consumer 383 44.4 9.3 862 21.0
Goods 88 27.5 2.1 321 7.8
Services 328 48.2 8.0 681 16.6
Credit/debt 144 55.3 3.5 260 6.3
Crime 245 42.6 6.0 575 14.0
Crime offender 40 66.0 1.0 60 1.5
Crime victim 221 40.8 5.4 541 13.2
Employment 159 62.6 3.9 254 6.2
Family 137 77.8 3.3 176 4.3
Childrena 98 79.8 2.4 123 3.0
Relationships 54 78.0 1.3 70 1.7
Government 242 55.0 5.9 439 10.7
Fines 48 38.6 1.2 125 3.0
Government payments 54 60.5 1.3 89 2.2
Local government 105 54.7 2.5 191 4.7
State/federal government 55 53.5 1.3 103 2.5
Health 105 70.9 2.6 148 3.6
Clinical negligence 66 64.2 1.6 103 2.5
Health services 38 89.4 0.9 42 1.0
Mental health 15 79.7 0.4 19 0.5
Housing 256 47.9 6.2 534 13.0
Neighbours 155 44.9 3.8 344 8.4
Owned housing 51 50.7 1.2 101 2.4
Rented housing 73 53.4 1.8 137 3.3
Other housing 5 57.1 0.1 8 0.2
Money 137 56.1 3.3 244 5.9
Business/investment 92 52.7 2.2 175 4.3
Wills/estates 53 64.6 1.3 82 2.0
Personal injury 153 48.5 3.7 316 7.7
Rights 138 53.9 3.4 257 6.2
Discrimination (outside work) 59 53.8 1.4 109 2.7
Education 52 53.5 1.3 98 2.4
Unfair treatment by police 37 52.5 0.9 70 1.7
Other civil 2 50.3 0.1 4 0.1
Unclassifiedb 1 100.0 0.0 1 0.0
All problem groups 1156 56.1 28.1 2060 50.1
a Includes problems related to grandchildren (see Appendix A1, question P28). Some respondents (205) had missing information on whether they had grandchildren (see Appendix A1, question D6) and were not asked about legal problems related to grandchildren. Thus, the prevalence reported for the children problem subgroup may slightly underestimate the true prevalence.
b Comprises problems that were unclearly described by respondents at question P40 (see Appendix A1).
Note: N=4113 respondents. Percentages do not sum to 100, because multiple problems were experienced by some respondents.

Prevalence of legal problems 63
It is noteworthy that the accidents problem group comprised a particularly low proportion of substantial problems (17.8%) relative to all other problem groups (see second data column). This low proportion may reflect the fact that only injury-free motor vehicle accidents were included in this problem group. Motor vehicle accidents that did result in injury were classified under the personal injury problem group.
Table 3.3 also shows that the 1156 respondents with a substantial legal problem represented 28.1 per cent of the entire sample of 4113 respondents and 56.1 per cent of the 2060 respondents who had a legal problem of any type.
Prevalence of multiple legal problemsAs mentioned above, 31.8 per cent of NSW respondents experienced multiple legal problems — that is, two or more legal problems. Multiple legal problems included:
multiple problems across more than one of the 12 problem groups•
multiple problems of different types from the same problem group•
multiple instances of the same specific problem type.•
Figure 3.3 shows the number of respondents who experienced multiple problems across different problem groups. It can be seen that 23.8 per cent of all NSW respondents experienced one or more problems from only one of the 12 problem groups, while 12.2 per cent had problems from two problem groups, and 14.1 per cent had problems from three or more problem groups. Note that Figure 3.1 shows the total number of problems experienced per respondent, regardless of whether or not these problems were from the same problem group or from different problem groups. A comparison of Figures 3.1 and 3.3 reveals that only some of the respondents who experienced multiple legal problems had problems from different problem groups. For example, whereas 31.8 per cent of the sample experienced at least two legal problems (see Figure 3.1), only 26.3 per cent of the sample experienced problems from at least two problem groups (see Figure 3.3).
Table 3.4 presents the number of respondents who experienced multiple legal problems from the same problem group or problem subgroup (see first data column). For example, respondents who had multiple problems from the housing problem group include respondents with different types of housing problems (e.g. both a ‘neighbours’ problem and a ‘mortgage payment’ problem) as well
Figure 3.3: Prevalence of multiple legal problems across problem groups, NSW
1 problem group980
23.8%
2 problem groups501
12.2%
3 problem groups264
6.4%4 problem groups
1433.5%
5+ problem groups172
4.2%
No problem2053
49.9%
Note: N=4113 respondents.

64 Legal Australia-Wide Survey: New South Wales
Table 3.4: Prevalence of multiple legal problems by problem group and problem subgroup, NSW
Problem groupProblem subgroup
Respondents with multiple problems
Respondents with problems
N % of respondents
with this problem type
% of all respondents
N % of all respondents
Accidents 29 9.3 0.7 307 7.5
Consumer 396 45.9 9.6 862 21.0
Goods 122 38.0 3.0 321 7.8
Services 277 40.7 6.7 681 16.6
Credit/debt 108 41.4 2.6 260 6.3
Crime 240 41.7 5.8 575 14.0
Crime offender 21 35.3 0.5 60 1.5
Crime victim 220 40.7 5.3 541 13.2
Employment 103 40.6 2.5 254 6.2
Family 77 43.8 1.9 176 4.3
Childrena 66 53.8 1.6 123 3.0
Relationships 11 16.2 0.3 70 1.7
Government 174 39.6 4.2 439 10.7
Fines 50 40.2 1.2 125 3.0
Government payments 20 22.7 0.5 89 2.2
Local government 58 30.4 1.4 191 4.7
State/federal government 18 17.5 0.4 103 2.5
Health 140 37.2 1.3 148 3.6
Clinical negligence 26 25.0 0.6 103 2.5
Health services 21 50.8 0.5 42 1.0
Mental health 9 45.6 0.2 19 0.5
Housing 214 40.1 5.2 534 13.0
Neighbours 132 38.3 3.2 344 8.4
Owned housing 32 31.9 0.8 101 2.4
Rented housing 48 35.5 1.2 137 3.3
Other housing 3 36.2 0.1 8 0.2
Money 186 32.5 1.9 244 5.9
Business/investment 58 33.1 1.4 175 4.3
Wills/estates 17 20.6 0.4 82 2.0
Personal injury 81 25.7 2.0 316 7.7
Rights 225 46.2 2.9 257 6.2
Discrimination (outside work) 53 48.9 1.3 109 2.7
Education 49 49.6 1.2 98 2.4
Unfair treatment by police 23 33.2 0.6 70 1.7
Other civil 1 24.3 0.0 4 0.1
Unclassifiedb 0 0.0 0.0 1 0.0
All problem groups 1308 63.5 31.8 2060 50.1
a Includes problems related to grandchildren (see Appendix A1, question P28). Some respondents (205) had missing information on whether they had grandchildren (see Appendix A1, question D6) and were not asked about legal problems related to grandchildren. Thus, the prevalence reported for the children problem subgroup may slightly underestimate the true prevalence.
b Comprises problems that were unclearly described by respondents at question P40 (see Appendix A1).
Note: N=4113 respondents. Percentages do not sum to 100, because multiple problems were experienced by some respondents.

Prevalence of legal problems 65
as respondents with multiple instances of the same type of problem (e.g. multiple ‘neighbours’ problems). The number of respondents with multiple problems from a particular problem group or problem subgroup is expressed both as a percentage of the respondents who experienced that type of problem (see second data column) and as a percentage of the entire sample (see third data column). For example, 214 respondents experienced multiple housing problems. These 214 respondents represented 40.1 per cent of the 534 respondents with a housing problem and 5.2 per cent of the entire NSW sample of 4113 respondents.
The second data column of Table 3.4 shows that the problem groups and subgroups varied considerably in the proportion of multiple problems they comprised. For example, almost half of the respondents who experienced rights (46.2%), consumer (45.9%) and family (43.8%) problems experienced multiple problems of these types. In contrast, only 9.3 per cent of the respondents who experienced accidents problems had multiple accidents problems.
The third data column shows that the problem group with the highest prevalence of multiple problems was the consumer problem group, with 9.6 per cent of the NSW sample experiencing multiple consumer problems. The crime, housing and government problem groups had the next highest prevalence of multiple problems, with 5.8, 5.2 and 4.2 per cent of all NSW respondents experiencing multiple problems of these types, respectively.
Although the consumer, family and rights problem groups comprised similarly high proportions of multiple problems (45.9%, 43.8% and 46.2%, respectively; see second data column), the prevalence of multiple consumer problems in the sample was higher than the prevalence of multiple family and multiple rights problems (9.6% versus 1.9% and 2.9%, respectively; see third data column). This finding was largely due to the higher overall prevalence of consumer problems compared to family and rights problems (21.0% versus 4.3% and 6.2%, respectively; see fifth data column).
Predicting prevalence of legal problems overallThis section describes the demographic characteristics that are related to the experience of legal problems.
A binary single-level logistic regression was conducted to examine the influence of a range of demographic characteristics on the likelihood of experiencing legal problems in NSW. The regression compared respondents who experienced one or more legal problems (of any type) to respondents who experienced no problems on the following demographic variables: gender, age, Indigenous status, disability status, education, employment status, family status, housing type, main income, main language and remoteness of residential area. The regression was used to determine the demographic variables that are statistically independent predictors of the prevalence of legal problems overall.10
Table 3.5 provides a summary of the regression results for NSW on the prevalence of legal problems overall, presenting the odds ratios for all of the significant comparisons. Table 3.6 presents the corresponding unprocessed or descriptive statistics.11
10 See Chapter 2, ‘Method: Multivariate analyses’ section, and Appendix Tables A2.8 and A2.9 (model 1a) for further details.11 See Appendix Table A3.1 for the full results of this regression.

66 Legal Australia-Wide Survey: New South Wales
Table 3.5: Regression summary — prevalence of legal problems overall, NSW
SIGNIFICANT VARIABLES
Variable Categories compared Odds ratioa
Gender Female | male 0.8
Age 15–17 | 65+ 2.9
18–24 | 65+ 3.7
25–34 | 65+ 3.4
35–44 | 65+ 3.5
45–54 | 65+ 2.7
55–64 | 65+ 2.6
Disability status Disability | no disability 2.4
Education <Year 12 | post-school 0.6
Year 12 | post-school 0.7
Employment status Unemployed | other 1.5
Family status Single parent | other 2.3
Housing type Disadvantaged | other 1.5
Main language Non-English | English 0.6
NON-SIGNIFICANT VARIABLES Indigenous status, main income, remotenessb
a An odds ratio (OR)>1.0 indicates that the first category had significantly higher odds of experiencing legal problems than the second category. OR<1.0 indicates that the first category had significantly lower odds. The size of the OR indicates the strength of the relationship. E.g. OR=2.0 means that the odds for the first category were twice those for the second category. OR=0.5 means that the odds for the first category were half those for the second category, or, in other words, that the odds for the second category were twice those (i.e. 1/0.5=2.0) for the first category. See Appendix A2, ‘Data analysis: Significance and strength of predictors’ section for further details.
b Due to insufficient numbers in remote areas, the regression compared a combined remote/regional category to the major city (reference) category.
Note: N=4087 respondents. Data were missing for 26 respondents.
As shown by the odds ratios12 in Table 3.5, age, disability status and family status were the strongest significant independent predictors of legal problem prevalence in NSW. In descending order of strength, main language, education, employment status, housing type and gender were also significant predictors. For the significant predictors, the demographic groups with higher odds of experiencing legal problems were:
15–64 year olds (versus those aged 65 years or over)•
people with a disability•
single parents•
people whose main language was English•
people with post-school qualifications (versus those with low education levels)•
people who had been unemployed•
people who had lived in disadvantaged housing•
males.•
12 An odds ratio that is significantly greater than 1.0 indicates that the first category in the comparison had higher odds than the second category, whereas an odds ratio that is significantly less than 1.0 indicates the reverse. Also, the size of the odds ratio indicates the strength of the relationship. For example, an odds ratio of 2.0 means that the odds for the first category were twice those for the second category, whereas an odds ratio of 5.0 means that the odds for the first category were five times those for the second category. An odds ratio of 0.5 means that the odds for the first category were half those for the second category, or, in other words, that the odds for the second category were twice those (i.e. 1/0.5=2.0) for the first category. See Appendix A2, ‘Data analysis: Significance and strength of predictors’ section for details.

Prevalence of legal problems 67
Table 3.6: Prevalence of legal problems by each demographic variable, NSW
Demographicvariable
Category Respondents with problems
Respondents without problems
All respondents
% % % N
Gender Female 47.5 52.5 100.0 2086*
MaleR 52.7 47.3 100.0 2027
Total 50.1 49.9 100.0 4113
Age 15–17 46.5 53.5 100.0 205*
18–24 56.0 44.0 100.0 483*
25–34 56.9 43.1 100.0 700*
35–44 59.0 41.0 100.0 724*
45–54 52.6 47.4 100.0 700*
55–64 51.0 49.0 100.0 580*
65+R 28.4 71.6 100.0 722
Total 50.1 49.9 100.0 4113
Indigenous status Indigenous 55.1 44.9 100.0 67
OtherR 50.0 50.0 100.0 4046
Total 50.1 49.9 100.0 4113
Disability status Disability 61.9 38.1 100.0 829*
No disabilityR 47.1 52.9 100.0 3284
Total 50.1 49.9 100.0 4113
Education <Year 12 43.9 56.1 100.0 1186*
Year 12 46.2 53.8 100.0 747*
Post-schoolR 55.0 45.0 100.0 2155
Total 50.2 49.8 100.0 4087
Employment status Unemployed 64.0 36.0 100.0 458*
OtherR 48.3 51.7 100.0 3655
Total 50.1 49.9 100.0 4113
Family status Single parent 71.8 28.2 100.0 294*
OtherR 48.4 51.6 100.0 3819
Total 50.1 49.9 100.0 4113
Housing type Disadvantaged 61.5 38.5 100.0 252*
OtherR 49.3 50.7 100.0 3861
Total 50.1 49.9 100.0 4113
Main income Government payment 45.6 54.4 100.0 1107
OtherR 51.7 48.3 100.0 3006
Total 50.1 49.9 100.0 4113
Main language Non-English 41.8 58.2 100.0 371*
EnglishR 50.9 49.1 100.0 3742
Total 50.1 49.9 100.0 4113
Remotenessa Remote 61.3 38.7 100.0 21
Regional 48.5 51.5 100.0 1158
Major cityR 50.6 49.4 100.0 2934
Total 50.1 49.9 100.0 4113
R Reference category for this demographic variable in the regression.
* Significant difference (p<0.05) between this category and the reference category for this demographic variable in the regression.
a Due to insufficient numbers in remote areas, the regression compared a combined remote/regional category to the major city (reference) category.
Note: N=4087 respondents for education and N=4113 respondents for other demographic variables. Education was missing for 26 respondents.

68 Legal Australia-Wide Survey: New South Wales
Indigenous status, main income and remoteness of residential area were not significant in the regression on the prevalence of legal problems overall.
The descriptive statistics in Table 3.6 reveal a similar picture to the odds ratios from the regression in Table 3.5. Females had significantly lower odds of experiencing legal problems (0.8), with 47.5 per cent of females experiencing legal problems compared to 52.7 per cent of males.
People aged 15–64 years had odds of experiencing legal problems that were 2.6–3.7 times as high as those for people aged 65 years or over. Only 28.4 per cent of the oldest age group experienced legal problems compared to 46.5–59.0 per cent of the other age groups.
Respondents with a disability had odds of experiencing legal problems that were 2.4 times as high as those for other respondents. The percentage of respondents experiencing legal problems was 61.9 per cent for respondents with a disability compared to 47.1 per cent for other respondents.
Respondents with low education levels had significantly lower odds of experiencing legal problems (0.6–0.7) than those with post-school qualifications. Between 43.9 and 46.2 per cent of respondents with low education levels experienced legal problems compared to 55.0 per cent of respondents with post-school qualifications.
Respondents who had been unemployed had odds of experiencing legal problems that were 1.5 times as high as those for other respondents (64.0% versus 48.3%).
The odds of experiencing legal problems were 2.3 times as high for single parents as for other respondents (71.8% versus 48.4%).
Respondents who had lived in disadvantaged housing during the previous 12 months had odds of experiencing legal problems that were 1.5 times as high as those for other respondents (61.5% versus 49.3%).
Respondents whose main language was not English had significantly lower odds of experiencing legal problems (0.6) than other respondents. The percentage of respondents experiencing legal problems was 41.8 per cent for respondents whose main language was a non-English language compared to 50.9 per cent for respondents whose main language was English.
Predicting prevalence of substantial legal problemsAs previously noted, problems rated by respondents as having no impact or only a slight impact on everyday life were considered to be ‘minor problems’, and problems rated as having a moderate or severe impact on everyday life were considered to be ‘substantial problems’. A second binary single-level logistic regression was conducted to examine the demographic predictors of the prevalence of substantial legal problems in the NSW sample. The regression compared the demographic characteristics of respondents who had experienced at least one substantial legal problem to those of other respondents (who had experienced only minor problems or had not experienced any problems). This regression examined the same set of predictors as the regression on overall prevalence.13
A summary of the results of the NSW regression on the prevalence of substantial legal problems is provided in Table 3.7.14 The pattern of results from this regression was similar to that from the NSW regression on overall prevalence (see Table 3.5), suggesting that the demographic groups that
13 See Chapter 2, ‘Method: Multivariate analyses’ section, and Appendix Tables A2.8 and A2.9 (model 2) for further details.14 See Appendix Table A3.2 for the full results of this regression.

Prevalence of legal problems 69
are vulnerable to experiencing legal problems tend to be the same groups that are vulnerable to experiencing substantial legal problems. In both regressions, age, disability status and family status were the strongest independent predictors, and education, employment status and housing type were also significant predictors. In addition, these results were in the same direction in the two regressions. That is, when compared to their counterparts, people aged 15–64 years, people with a disability, single parents, people with post-school qualifications, people who had been unemployed and people who had lived in disadvantaged housing had significantly higher odds both of experiencing legal problems overall and of experiencing substantial legal problems.
Although gender and main language were significant predictors of the prevalence of legal problems overall, they were not significant predictors of the prevalence of substantial legal problems.
Table 3.7: Regression summary — prevalence of substantial legal problems, NSW
SIGNIFICANT VARIABLES
Variable Categories compared Odds ratioa
Age 15–17 | 65+ 1.8
18–24 | 65+ 3.0
25–34 | 65+ 3.4
35–44 | 65+ 3.5
45–54 | 65+ 3.0
55–64 | 65+ 2.9
Disability status Disability | no disability 2.7
Education <Year 12 | post-school 0.7
Year 12 | post-school 0.6
Employment status Unemployed | other 1.6
Family status Single parent | other 2.0
Housing type Disadvantaged | other 1.4
NON-SIGNIFICANT VARIABLES gender, Indigenous status, main income, main language, remotenessb
a An odds ratio (OR)>1.0 indicates that the first category had significantly higher odds of experiencing substantial legal problems than the second category. OR<1.0 indicates that the first category had significantly lower odds. The size of the OR indicates the strength of the relationship. E.g. OR=2.0 means that the odds for the first category were twice those for the second category. OR=0.5 means that the odds for the first category were half those for the second category, or, in other words, that the odds for the second category were twice those (i.e. 1/0.5=2.0) for the first category. See Appendix A2, ‘Data analysis: Significance and strength of predictors’ section for further details.
b Due to insufficient numbers in remote areas, the regression compared a combined remote/regional category to the major city (reference) category.
Note: N=4087 respondents. Data were missing for 26 respondents.
Predicting prevalence of multiple legal problemsA single-level zero-truncated Poisson regression was conducted on the subgroup of NSW respondents who experienced legal problems. The regression examined whether the demographic characteristics of respondents predicted the number of legal problems experienced among those who experienced at least one legal problem. That is, the regression examined whether certain demographic groups experienced a greater number of legal problems or ‘multiple’ legal problems.15 This regression also used the same set of demographic predictors as the NSW regression on overall prevalence.16
15 For convenience, the term ‘multiple legal problems’ is used instead of ‘a greater number of legal problems’ throughout the report when discussing the results of this regression.
16 See Chapter 2, ‘Method: Multivariate analyses’ section, and Appendix Tables A2.8 and A2.9 (model 3) for further details.

70 Legal Australia-Wide Survey: New South Wales
A summary of the results of this regression on the prevalence of multiple legal problems is provided in Table 3.8.17 Age, housing type and disability status were the strongest significant predictors of the prevalence of multiple legal problems, followed by education, family status and remoteness of residential area. Thus, when compared to their counterparts, people aged 15–64 years, people who had lived in disadvantaged housing, people with a disability, people with post-school qualifications, single parents and people living in remote or regional areas were significantly more likely to experience multiple legal problems.
The results for this regression were also similar to those for overall prevalence (see Table 3.5). In both regressions, age and disability status were among the three strongest significant predictors, and education, family status and housing type were also significant, with the results being in the same direction. Hence, the regressions suggest that many of the demographic groups that are vulnerable to experiencing legal problems tend to be the same groups that, when they do experience legal problems, are vulnerable to experiencing multiple legal problems.
However, there were some differences between the two regression models. Remoteness of residential area was a significant predictor of multiple legal problems, but not of legal problems overall. Gender, employment status and main language were not significant predictors of multiple legal problems but were significant predictors of legal problems overall.18
17 See Appendix Table A3.3 for the full results of this regression.18 The regression on multiple legal problems had less statistical power compared to the regression on overall prevalence, as it was
conducted only on the subgroup of respondents who experienced problems rather than on the entire NSW sample.
Table 3.8: Regression summary — prevalence of multiple legal problems, NSW
SIGNIFICANT VARIABLES
Variable Categories compared Incident rate ratioa
Age 15–17 | 65+ 2.2
18–24 | 65+ 2.5
25–34 | 65+ 2.1
35–44 | 65+ 2.4
45–54 | 65+ 1.9
55–64 | 65+ -
Disability status Disability | no disability 1.7
Education <Year 12 | post-school 0.7
Year 12 | post-school 0.8
Family status Single parent | other 1.4
Housing type Disadvantaged | other 1.8
Remotenessb Remote/regional | major city 1.2
NON-SIGNIFICANT VARIABLES gender, Indigenous status, employment status, main income, main language
a An incident rate ratio (IRR)>1.0 indicates that the first category had a significantly higher rate of experiencing legal problems than the second category. An IRR<1.0 indicates that the first category had a significantly lower rate. The size of the IRR indicates the strength of the relationship. E.g. IRR=2.0 means that the incident rate for the first category was twice that for the second category. IRR=0.5 means that the incident rate for the first category was half that for the second category, or, in other words, that the incident rate for the second category was twice that (i.e. 1/0.5=2.0) for the first category. See Appendix A2, ‘Data analysis: Significance and strength of predictors’ section for further details. ‘-’ indicates that the comparison was not significant.
b Due to insufficient numbers in remote areas, the regression compared a combined remote/regional category to the major city (reference) category.
Note: N=2051 respondents with problems. Data were missing for nine respondents.

Prevalence of legal problems 71
Predicting prevalence of different types of legal problemsTo assess whether the types of problems experienced were related to the demographic characteristics of respondents, 12 binary single-level logistic regressions were performed, one for each legal problem group. The regression for each problem group examined whether demographic characteristics were associated with the experience of one or more problems from that problem group. Again, these regressions used the same set of 11 demographic predictors used in the regression on overall prevalence.19
A summary of these 12 logistic regression models on the prevalence of each problem group is presented in Table 3.9.20 The table shows that age was a significant predictor in each model and was usually one of the strongest predictors. In addition, different types of problems tended to peak at different ages. Of the indicators of disadvantage, disability was significantly related to the greatest number of problem groups. People with a disability had increased odds of problems from 10 of the 12 problem groups. The results of the regressions on the prevalence of each problem group are summarised below, with the significant predictors being listed in descending order of strength in each case.
AccidentsOf the 11 demographic characteristics examined, only age and education were significant independent predictors of whether respondents experienced accidents problems. The odds of experiencing accidents problems were significantly higher for the following groups compared to their counterparts:
15–64 year olds and particularly 15–24 year olds (versus those aged 65 years or over)•
people with post-school qualifications (versus those who had not finished school).•
ConsumerAge and disability status were the strongest significant predictors of the prevalence of consumer problems, and education, main language and housing type were also significant. The odds of experiencing consumer problems were significantly higher for the following groups compared to their counterparts:
18–64 year olds (versus those aged 65 years or over)•
people with a disability•
people with post-school qualifications (versus those with low education levels)•
people whose main language was English•
people who had lived in disadvantaged housing.•
Credit/debtIn descending order of strength, age, main language, housing type, disability status, family status, employment status, education and remoteness of residential area were significant independent predictors of whether credit/debt problems were experienced. The odds of experiencing credit/debt problems were significantly higher for the following respondents compared to their counterparts:
18–64 year olds and particularly 25–34 year olds (versus those aged 65 years or over)•
people whose main language was English•
19 See Chapter 2, ‘Method: Multivariate analyses’ section, and Appendix Tables A2.8 and A2.9 (models 4a–4l) for further details.20 See Appendix Tables A3.4–A3.15 for the full results of these regressions, and Appendix Tables A3.16–A3.27 for the corresponding
descriptive statistics.

72 Legal Australia-Wide Survey: New South Wales
Tab
le 3
.9:
Reg
ress
ion
su
mm
arie
s —
pre
vale
nce
of
each
pro
ble
m g
rou
p, N
SW
Var
iab
leC
ateg
ori
es c
om
par
edO
dd
s ra
tio
s in
mo
del
fo
r ea
ch p
rob
lem
gro
up
a
Acc
iden
tsC
on
sum
erC
red
it/
deb
tC
rim
eE
mp
loym
ent
Fam
ilyG
ove
rnm
ent
Hea
lth
Ho
usi
ng
Mo
ney
Per
son
al
inju
ryR
igh
ts
Gen
der
Fem
ale
| mal
e-
--
0.7
0.7
-0.
8-
-0.
80.
7-
Ag
e15
–17
| 65+
4.3
--
5.5
22.0
--
--
-10
.027
.3
18–2
4 | 6
5+5.
02.
25.
66.
444
.1-
2.5
-2.
9-
11.8
10.1
25–3
4 | 6
5+2.
72.
07.
64.
119
.83.
22.
3-
3.0
-5.
57.
9
35–4
4 | 6
5+2.
32.
34.
93.
025
.64.
32.
12.
13.
02.
15.
79.
3
45–5
4 | 6
5+2.
32.
23.
93.
227
.6-
1.9
-2.
11.
86.
35.
9
55–6
4 | 6
5+2.
21.
93.
73.
413
.42.
41.
82.
31.
72.
35.
13.
2
Ind
igen
ou
s st
atu
sIn
dige
nous
| ot
her
--
--
--
-3.
3-
--
-
Dis
abili
ty s
tatu
sD
isab
ility
| no
dis
abili
ty-
2.1
2.0
1.6
1.6
-1.
67.
81.
81.
63.
42.
5
Ed
uca
tio
n<
Yea
r 12
| po
st-s
choo
l0.
40.
50.
60.
70.
5-
0.7
0.6
-0.
6-
-
Yea
r 12
| po
st-s
choo
l-
0.6
--
0.5
-0.
60.
50.
70.
6-
0.6
Em
plo
ymen
t st
atu
sU
nem
ploy
ed |
othe
r-
-1.
6-
c-
1.8
-1.
4-
-1.
6
Fam
ily s
tatu
sS
ingl
e pa
rent
| ot
her
--
1.9
2.2
2.1
13.3
1.6
--
--
2.5
Ho
usi
ng
typ
eD
isad
vant
aged
| ot
her
-1.
52.
22.
0-
2.0
-2.
42.
1-
-2.
3
Mai
n in
com
eG
over
nmen
t pay
men
t | o
ther
--
--
-1.
71.
5-
-0.
60.
6-
Mai
n la
ng
uag
eN
on-E
nglis
h | E
nglis
h-
0.6
0.4
0.6
--
0.6
--
0.5
--
Rem
ote
nes
sbR
emot
e/re
gion
al |
maj
or c
ity-
-1.
4-
--
--
--
-1.
5
a A
n od
ds r
atio
(O
R)>
1.0
indi
cate
s th
at th
e fir
st c
ateg
ory
had
sign
ifica
ntly
hig
her
odds
of e
xper
ienc
ing
lega
l pro
blem
s fr
om th
e pr
oble
m g
roup
in q
uest
ion
than
the
seco
nd c
ateg
ory.
An
OR
<1.
0 in
dica
tes
that
the
first
ca
tego
ry h
ad s
igni
fican
tly lo
wer
odd
s. T
he s
ize
of th
e O
R in
dica
tes
the
stre
ngth
of t
he r
elat
ions
hip.
E.g
. OR
=2.
0 m
eans
that
the
odds
for
the
first
cat
egor
y w
ere
twic
e th
ose
for
the
seco
nd c
ateg
ory.
OR
=0.
5 m
eans
that
th
e od
ds fo
r th
e fir
st c
ateg
ory
wer
e ha
lf th
ose
for
the
seco
nd c
ateg
ory,
or,
in o
ther
wor
ds, t
hat t
he o
dds
for
the
seco
nd c
ateg
ory
wer
e tw
ice
thos
e (i.
e. 1
/0.5
=2.
0) fo
r th
e fir
st c
ateg
ory.
See
App
endi
x A
2, ‘D
ata
anal
ysis
: S
igni
fican
ce a
nd s
tren
gth
of p
redi
ctor
s’ s
ectio
n fo
r fu
rthe
r de
tails
. ‘-’
indi
cate
s th
at th
e co
mpa
rison
was
not
sig
nific
ant.
b
Due
to in
suffi
cien
t num
bers
in r
emot
e ar
eas,
the
regr
essi
ons
com
pare
d a
com
bine
d re
mot
e/re
gion
al c
ateg
ory
to th
e m
ajor
city
(re
fere
nce)
cat
egor
y.
c D
ue to
co-
depe
nden
ce b
etw
een
the
empl
oym
ent s
tatu
s pr
edic
tor
and
the
empl
oym
ent p
robl
em g
roup
, em
ploy
men
t sta
tus
was
not
use
d as
a p
redi
ctor
in th
e m
odel
for
the
empl
oym
ent p
robl
em g
roup
.
No
te:
N=
4087
res
pond
ents
for
each
mod
el. D
ata
wer
e m
issi
ng fo
r 26
res
pond
ents
for
each
mod
el.

Prevalence of legal problems 73
people who had lived in disadvantaged housing•
people with a disability•
single parents•
people who had been unemployed•
people with post-school qualifications (versus those who had not finished school)•
people living in remote or regional areas.•
CrimeAge, family status and housing type were the strongest significant predictors of the prevalence of crime problems, followed by main language, disability status, education and gender. The odds of experiencing crime problems were significantly higher for the following groups compared to their counterparts:
15–64 year olds and particularly 15–24 year olds (versus those aged 65 years or over)•
single parents•
people who had lived in disadvantaged housing•
people whose main language was English•
people with a disability•
people with post-school qualifications (versus those who had not finished school)•
males.•
EmploymentAge was the strongest significant predictor of whether employment problems were experienced, followed by family status, education, disability status and gender.21 The odds of experiencing employment problems were significantly higher for the following respondent groups compared to their counterparts:
15–64 year olds (versus those aged 65 years or over)• 22
single parents•
people with post-school qualifications (versus those with low education levels)•
people with a disability•
males.•
FamilyIn descending order of strength, family status, age, housing type and main income were significant independent predictors of the prevalence of family problems. The odds of experiencing family problems were significantly higher for the following respondents compared to their counterparts:
single parents•
35–44 year olds in particular and also 25–34 and 55–64 year olds (versus those aged 65 years • or over)
21 The relationship between the employment status variable and the prevalence of employment problems was not examined, due to too much overlap between this variable and the employment problem group. Being sacked or made redundant was included as a legal problem within the employment problem group. This legal problem would also have been likely to result in a period of unemployment and, hence, membership within the unemployment demographic group.
22 The particularly high odds of employment problems for all age groups compared to the oldest age group are likely to largely reflect the high retirement rates for the oldest age group.

74 Legal Australia-Wide Survey: New South Wales
people who had lived in disadvantaged housing•
people whose main source of income was government payments.•
GovernmentAge was the strongest significant independent predictor of the prevalence of government problems, followed by employment status, education, main language, family status, disability status, main income and gender. The odds of experiencing government problems were significantly higher for the following groups compared to their counterparts:
18–64 year olds (versus those aged 65 years or over)•
people who had been unemployed•
people with post-school qualifications (versus those with low education levels)•
people whose main language was English•
single parents•
people with a disability•
people whose main source of income was government payments•
males.•
HealthDisability status and Indigenous status were the strongest significant independent predictors of the prevalence of health problems. Housing type, age and education were also significant predictors. The odds of experiencing health problems were significantly higher for the following respondents compared to their counterparts:
people with a disability•
Indigenous people•
people who had lived in disadvantaged housing•
35–44 and 55–64 year olds (versus those aged 65 years or over)•
people with post-school qualifications (versus those with low education levels).•
HousingAge and housing type were the strongest predictors of whether housing problems were experienced, followed by disability status, employment status and education. The odds of experiencing housing problems were significantly higher for the following respondent groups compared to their counterparts:
18–64 year olds and particularly 18–44 year olds (versus those aged 65 years or over)•
people who had lived in disadvantaged housing•
people with a disability•
people who had been unemployed•
people with post-school qualifications (versus those who had finished only Year 12).•
MoneyIn descending order of strength, age, main language, education, disability status, main income and gender were significant independent predictors of whether respondents experienced money problems. The odds of experiencing money problems were significantly higher for the following groups compared to their counterparts:

Prevalence of legal problems 75
35–64 year olds (versus those aged 65 years or over)•
people whose main language was English•
people with post-school qualifications (versus those with low education levels)•
people with a disability•
people whose main source of income was not government payments•
males.•
Personal injuryAge and disability status were the strongest significant independent predictors of the prevalence of personal injury problems, followed by main income and gender. The odds of experiencing personal injury problems were significantly higher for the following respondents compared to their counterparts:
15–64 year olds and particularly 15–24 year olds (versus those aged 65 years or over)•
people with a disability•
people whose main source of income was not government payments•
males.•
RightsAge was the strongest significant independent predictor of the prevalence of rights problems, followed by family status, disability status, housing type, employment status, education and remoteness of residential area. The odds of experiencing rights problems were significantly higher for the following groups compared to their counterparts:
15–64 year olds and particularly 15–17 year olds (versus those aged 65 years or over)•
single parents•
people with a disability•
people who had lived in disadvantaged housing•
people who had been unemployed•
people with post-school qualifications (versus those who had finished only Year 12)•
people living in remote or regional areas.•
Prevalence of legal problems: nsW summaryIn NSW, legal problems were widespread and often substantial. One-half of NSW respondents (50.1%) reported experiencing one or more legal problems in the 12 months prior to interview. Furthermore, more than one-quarter of all NSW respondents (28.1%) reported experiencing a substantial legal problem — that is, a problem that had a moderate or severe impact on their everyday life. In addition, the experience of multiple legal problems was common, with almost one-quarter of NSW respondents experiencing at least three legal problems.
Some types of legal problems occurred far more frequently than others. The legal problem groups with the highest prevalence rates in NSW were the consumer (21.0% of all respondents), crime (14.0%), housing (13.0%) and government (10.7%) problem groups.
Some respondents were much more likely than others to experience legal problems, with a minority of respondents accounting for the majority of the legal problems experienced. For example,

76 Legal Australia-Wide Survey: New South Wales
respondents with three or more legal problems represented less than one-quarter of the NSW sample but accounted for more than four-fifths of the legal problems experienced.
Regression analyses were used to determine the demographic groups that had increased preva-lence of:
legal problems overall•
substantial legal problems•
multiple legal problems•
problems from each of the 12 problem groups.•
Most notably, these regression analyses showed that age and various indicators of disadvantage were reliably related to the prevalence of legal problems according to a number of measures.
Age was one of the strongest predictors in most regressions, suggesting a robust ‘stages of life’ effect. When compared to one or more of the younger age groups, the oldest age group had low prevalence of legal problems overall, substantial legal problems, multiple legal problems and problems from all 12 legal problem groups. Different types of legal problems also tended to peak at different ages or stages of life. For example:
Accidents, crime, personal injury and rights problems peaked in the younger age groups, either • at 15–17 or at 18–24 years.
Credit/debt problems peaked at 25–34 years.•
Family problems peaked at 35–44 years.•
In contrast to age, gender showed considerably fewer and weaker relationships to prevalence, with males having higher prevalence of legal problems overall and problems from five problem groups. Gender was unrelated to the prevalence of substantial legal problems, multiple legal problems and problems from the other seven problem groups.
The regressions also showed that a number of disadvantaged groups had high prevalence of legal problems. People with a disability were the disadvantaged group with increased prevalence according to the greatest number of measures. In addition, the relationships between disability and increased prevalence were often among the strongest. However, people who had lived in disadvantaged housing, single parents and people who had been unemployed also had increased prevalence according to several measures:
People with a disability had high prevalence of legal problems overall, substantial legal • problems, multiple legal problems and problems from 10 problem groups.
People who had lived in disadvantaged housing had high prevalence of legal problems overall, • substantial legal problems, multiple legal problems and problems from seven problem groups.
Single parents had high prevalence of legal problems overall, substantial legal problems, • multiple legal problems and problems from six problem groups.
People who had been unemployed had high prevalence of legal problems overall, substantial • legal problems and problems from four problem groups.
Unlike most of the indicators of disadvantage, low education levels and non-English main language, when significant, were related to low rather than high prevalence according to several measures. More specifically:

Prevalence of legal problems 77
People with low education levels had low prevalence of legal problems overall, substantial • legal problems, multiple legal problems and problems from 10 problem groups.
People with a non-English main language had low prevalence of legal problems overall and • problems from five problem groups.
The remaining indicators of disadvantage showed only a few significant relationships with prevalence, and these relationships were not always in the direction of higher prevalence for disadvantaged people. That is:
People whose main source of income was government payments had high prevalence of • problems from two problem groups but low prevalence of problems from another two problem groups.
People living in remote or regional areas had high prevalence of multiple legal problems and • problems from two problem groups.
Indigenous people had high prevalence of only health problems.• 23
The LAW Survey results for NSW on the prevalence of legal problems are interpreted further in Chapters 9 and 10. These chapters compare the NSW results to the LAW Survey results for other jurisdictions and to international findings.
23 Methodological factors may have militated against detecting a greater number of significant effects for this demographic group. See Chapter 10, ‘Tailoring services for specific demographic groups: Indigenous background’ section for details.