pressure – temperature phase behaviour of natural
TRANSCRIPT

Soft Matter
Cite this: DOI: 10.1039/c0xx00000x
www.rsc.org/xxxxxx
Dynamic Article Links ►
ARTICLE TYPE
This journal is © The Royal Society of Chemistry [year] [journal], [year], [vol], 00–00 | 1
Pressure – temperature phase behaviour of natural sphingomyelin extracts Karen P. Shaw, Nicholas J. Brooks*, James A. Clarke, Oscar Ces, John M. Seddon* and Robert V. Law*
Received (in XXX, XXX) Xth XXXXXXXXX 20XX, Accepted Xth XXXXXXXXX 20XX DOI: 10.1039/b000000x 5
Sphingomyelin is the only sphingolipid occurring naturally in mammalian cells and can form up to 50% of the total phospholipid content of the myelin sheath which surrounds nerves. Having predominantly long, saturated acyl chains, it has a relatively high chain melting temperature and has been strongly associated with formation of lipid microdomains. Here, the lyotropic phase behaviour of sphingomyelin 10
from three different natural sources (bovine brain, egg yolk and milk) in excess water is studied as a function of temperature and pressure by small- and wide-angle X-ray scattering, and solid state NMR. The different hydrocarbon chain length distributions of the three lipid extracts results in significant differences in their gel phase structure; both the bovine brain and egg yolk sphingomyelins can form a ripple gel phase but milk sphingomyelin forms an interdigitated gel phase due to the high degree of chain 15
mismatch in its longer hydrocarbon chain components.
Introduction Sphingomyelins (SM) are a group of phospholipids based on a sphingosine backbone with an additional hydrocarbon chain 20
attached via an amide linkage (Fig. 1). These lipids play a highly important role in the plasma membrane of many mammalian cells,1 reaching concentrations of 15% of the total phospholipid content in the outer leaflet of the plasma membrane and over 50% in the myelin sheath which surrounds nerves. Sphingomyelin rich 25
lipid rafts have been suggested to act as “hotspots” or platforms which promote or enable trans-membrane proteins to aggregate so they may initiate cell signalling events. In addition to forming a major component of the membrane structural matrix, sphingomyelin and its metabolic products have been proposed as 30
important signalling molecules in several processes including cellular apoptosis.2 Despite its significant biological importance, there is a relative dearth of published physicochemical data for sphingomyelin (SM) when compared to the structurally analogous 35
phosphocholine based phospholipids. In this work, three natural SM extracts with different compositions (Fig. 2) have been studied by X-ray diffraction and solid state 31P NMR. The work aims to investigate their phase behaviour and assess how lipid composition affect this. The 40
sphingomyelin extracts studied are bovine brain SM (BBSM), egg yolk SM (EYSM) and milk SM (MSM). As these are natural extracts, the lipid composition is likely to vary slightly from batch to batch. Various analyses have been published previously1, 3-7 and show some variation in the 45
Fig. 1 Structure of 16:0 sphingomyelin. The sphingosine backbone
usually provides a 16 carbon atom hydrocarbon chain with a trans double bond in position two, although slightly longer chains are possible. The
most common headgroup in natural sphingomyelin is phosphocholine as 50
shown here. The amide linked hydrocarbon chain (shown in grey) can vary significantly in length and degree of unsaturation; chains between 16
and 24 carbon atoms long are found naturally.
Table 1 Sphingomyelin extract main transition temperatures at full hydration8 55
Extract Gel – fluid transition temperature (Tm) / °C
BBSM 35 – 40 EYSM 37 – 40 MSM 29 – 35
proportions of each chain length present. The main fluid to gel transition of these extracts in excess water have been studied previously by differential scanning 60
calorimetry8 and the transition temperatures are summarised in Table 1. It should be noted that as these are mixtures of different chain length lipids, the transition tends to be rather broad and melting occurs over a significant temperature range.

2 | Journal Name, [year], [vol], 00–00 This journal is © The Royal Society of Chemistry [year]
Fig. 2 Amide bonded hydrocarbon chain composition of brain, egg and
milk sphingomyelin as reported by Avanti Polar Lipids
Materials and Methods Materials 5
Bovine brain sphingomyelin (BBSM) and egg yolk sphingomyelin (EYSM) were purchased from Sigma Aldrich (Gillingham, UK). Dipalmitoyl-phosphatidylcholine (DPPC), dipalmitoyl-phosphatidylethanolamine (DPPE), milk sphingomyelin (MSM), and Cholesterol (Chol) were purchased 10
from Avanti Polar Lipids (Alabaster, AL). All reagents were used without further purification but were lyophilised prior to use to remove any atmospheric water absorbed during storage.
Sample preparation
Lipids were dissolved in cyclohexane with a drop of methanol to 15
aid dissolution. The sample was then lyophilised overnight to remove the solvent. Samples were hydrated with 50wt% D2O for NMR experiments or H2O for X-ray experiments and then heat cycled a minimum of three times between 0 and 70 °C. Samples for NMR were transferred to 4 or 2.5mm zirconium 20
MAS rotors and stored at -20°C until used. X-ray diffraction samples were transferred to purpose built Teflon sample holders with Mylar windows and stored at -20°C until used.
Nuclear Magnetic Resonance (NMR) Experiments
Both static and magic angle spinning (MAS) solid state NMR 25
data were acquired using a Bruker DRX 600 MHz spectrometer operating at 14.09 T with a 31P resonance of 242.9 MHz. Standard Bruker pulse programs were used for all data acquisition (parameters summarised in the electronic supplement). Sample temperature control was achieved by 30
passing the spectrometer bearing gas through a liquid nitrogen chiller and then heater unit; NMR data was collected in the range 5 – 60 °C.
X-ray diffraction experiments
Small-angle X-ray diffraction (SAXS) data were primarily 35
acquired using two synchrotron X-ray beamlines: ID02 at the European Synchrotron Radiation Facility (ESRF), Grenoble, France and I22 at Diamond Light Source, Didcot, UK, in both cases using X-rays with a wavelength of 0.73 Å (17 keV). At ESRF, samples were contained in a custom built high pressure 40
cell,9 at Diamond Light Source, samples were contained in the new I22 high pressure sample environment.10 Additionally, wide-angle X-ray diffraction (WAXS) patterns were recorded at I22 simultaneously with the SAXS data. In both pressure cells, temperature control is achieved by water circulation through the 45
periphery of the cell. High pressure SAXS / WAXS data was acquired in the range 0 – 300 MPa and 10 – 62 °C (further details available in the electronic supplementary information). Phase transition temperatures of the lipids at atmospheric pressure were confirmed using an in-house Guinier X-ray camera 50
allowing simultaneous SAXS/WAXS recording. The camera was mounted on a Philips PW1140 generator fitted with a copper X-ray tube and crystal monochromator to give Cu Kα1 radiation with a wavelength of 1.54056 Å. The sample temperature was controlled via circulation of silicone oil through the sample 55
holder block. Atmospheric pressure SAXS / WAXS patterns were measured over the temperature range 5 – 65 °C.
Data analysis
NMR line widths were analysed using macros built into Bruker’s X-WIN NMR. X-ray diffraction data were integrated and 60
analysed using AXcess, an in-house developed IDL based programme11 and data was calibrated against silver docosanoate which has a well-defined layer spacing of 58.380 Å. Automatic peak tracking was used to fit intense, well resolved peaks automatically; however the ripple gel phases observed often 65
showed extremely closely spaced peaks in the SAXS pattern and so these peaks were fitted manually, again within AXcess. Further details of the process used to determine the ripple phase structural parameters are included in the electronic supplement.
Results and Discussion 70
Bovine brain sphingomyelin (BBSM)
Small-angle X-ray diffraction (SAXS) At temperatures above the main chain melting transition, X-ray diffraction patterns from hydrated BBSM show sharp, evenly spaced peaks in the small-angle region (Fig. 3) which indicate a 75
lamellar structure with a layer spacing of around 70 Å. At low temperature and pressure, SAXS patterns show a number of broad peaks which cannot be resolved from each other, and wide-angle diffraction and NMR experiments (see below) indicate that this corresponds to a lamellar gel phase. Interestingly, high 80
pressure SAXS experiments can be used to more clearly resolve the gel phase diffraction pattern. This increase in peak resolution occurs at high temperature and high pressure, when the sample undergoes a pressure induced phase transformation from a fluid lamellar to gel structure. At low temperature, pressure has very 85

This journal is © The Royal Society of Chemistry [year] Journal Name, [year], [vol], 00–00 | 3
Fig. 3 Small-angle diffraction pattern from the fluid lamellar phase of
BBSM at 53 °C and atmospheric pressure
Fig. 4 Small-angle diffraction pattern from the tilted ripple gel phase of 5
BBSM coexisting with a flat gel phase at 62 °C and 100 MPa
Fig. 5 Schematic diagram of the tilted ripple gel phase
Fig. 6 Pressure dependence of a, b and γ lattice parameters for the BBSM 10
ripple gel phase at 58.4 °C
little effect on the resolution of the gel phase diffraction pattern. The pressure resolved diffraction pattern from the BBSM gel phase can be indexed as a tilted ripple phase (Pβ’) as shown in Fig. 4. One peak could not be indexed with the ripple phase but 15
can be attributed to co-existence of a flat lamellar gel phase and this is discussed in greater detail later. The ripple phase structural parameters a, b and γ (Fig. 5) were obtained by fitting to experimental diffraction data (this method is described in the electronic supplement). All three of these 20
parameters change with both pressure and temperature, but interestingly, changing temperature simply introduces a pressure offset in the behaviour of these structural parameters which can be rationalised using the Clapeyron equation.12 The pressure dependence of a, b and γ is shown in Fig. 6 at a reference 25
temperature of 58.4 °C. As the pressure is increased at 58.4 °C, BBSM transforms completely to a Pβ’ tilted ripple gel phase at 100 MPa. The a lattice parameter is initially approximately 89.5 Å and between 110 and 160 MPa, this increases to 92 Å as the conformational 30

Soft Matter
Cite this: DOI: 10.1039/c0xx00000x
www.rsc.org/xxxxxx
Dynamic Article Links ►
ARTICLE TYPE
This journal is © The Royal Society of Chemistry [year] [journal], [year], [vol], 00–00 | 4
Fig. 7 Gradual loss of a ripple gel phase via a stretching mechanism to form a flat bilayer
freedom of the lipid molecules reduces. The a lattice parameter remains fairly constant between 160 and 220 MPa where the gel structure is relatively insensitive to pressure, above 220 MPa, the 5
a lattice parameter decreases, reaching 89.5 Å at 300 MPa. This decrease in spacing at high pressure is relatively small and as such is unlikely to be due to pressure induced chain interdigitation, as reported previously for DPPC, it seems more likely that this effect is due to an increase in the lipid tilt angle 10
and this is supported by wide-angle X-ray scattering results (see below). At 100 MPa, the ripple repeat distance, b, is around 210 Å, this falls quickly to around 126 Å as the pressure is increased to 120 MPa (note that although there appears to be a discontinuity in the 15
ripple period from around 176 to 128 Å, this is actually due to the 01 peak disappearing as it passes through a node in the X-ray form factor envelope and so it cannot be tracked effectively in this region). Above 120 MPa, the ripple repeat distance remains relatively constant at approximately 126 Å. 20
It appears that as the ripple gel phase approaches the gel – fluid phase boundary, the ripple is “stretched out” until it eventually becomes a flat bilayer (Fig. 7). This mechanism for the loss (or reversed mechanism during development) of the ripple phase is observed in transitions brought about by either changes in 25
temperature or pressure. The temperature dependence of the ripple period has been reported previously for the ripple gel phases of 24:0 SM13 and DMPC.14 24:0 SM shows a similar trend to that found here; the ripple period increases with increasing temperature, however the ripple period in DMPC decreases as the 30
temperature is increased towards the chain melting transition temperature. γ (the angle between a and b) is around 102° between 100 and 115 MPa, it changes to 88° above 115 MPa and remains relatively constant up to 300 MPa. This change from 102 – 88° 35
does not appear to be gradual, as with the change in b, but rather shows a sharp jump. Formation of a ripple phase in BBSM has previously been suggested based on freeze-fracture electron microscopy6, 15 and ripple phases have been observed in synthetic sphingomyelins by 40
freeze-fracture microscopy16 and X-ray diffraction.13 The freeze- fracture electron microscopy study showed ripple formation in both synthetic 24:0 and 16:0 sphingomyleins;16 this may suggest that the ripple phase observed here is primarily formed from the saturated components of BBSM, while the coexisting flat Lβ 45
phase is primarily formed from the unsaturated 24:1
sphingomyelins present in the mixture. While 24:1 SM is known to have a significantly lower melting temperature than saturated sphingomyelins,17 it is unlikely that this extra peak is a coexisting fluid phase as it appears at a relatively high layer spacing and is 50
visible at all temperatures and pressures where BBSM adopts a gel structure; a fluid phase would be expected to transform to a gel at low temperatures or high pressures. Wide-angle X-ray diffraction (WAXS) At temperatures above the chain melting transition temperature 55
(Tm), wide-angle X-ray scattering (WAXS) data for BBSM show a broad diffraction peak centred on 4.6 Å characteristic of fluid lamellar (Lα) phase formation. Below the Tm the diffraction peak is significantly sharper and centred around 4.2Å (Fig. 8).
60
Fig. 8 Wide-angle X-ray diffraction patterns from BBMS at atmospheric pressure, BBSM exhibits a typical gel peak at 25 °C and a typical fluid
peak at 63 °C
Fig. 9 Full width – half maximum (FWHM) of the BBSM WAXS gel 65
peak at 55.2 °C

This journal is © The Royal Society of Chemistry [year] Journal Name, [year], [vol], 00–00 | 5
While the low temperature WAXS peak is significantly sharper than that seen above the chain melting temperature, it is broader than would be expected for a flat Lβ gel phase, supporting the formation of a tilted ripple phase as shown by SAXS. The gel peak is also seen to broaden as the pressure is increased (Fig. 9), 5
consistent with either an increased tilt angle of the lipids in the ripple gel or disruption of the chain ordering (although the latter seems less likely). Static-solid state nuclear magnetic resonance (SSNMR) The 31P static NMR data for BBSM show a broad powder pattern 10
at temperatures below the main transition, characteristic of the lamellar gel phase. The main chain melting transition causes a narrowing of the powder pattern, characteristic of the Lα phase. Interestingly, upon melting, an isotropic component is seen to develop as a broadened signal at 0 ppm superimposed on the 15
characteristic chemical shift anisotropy (CSA) powder pattern (Fig. 10). Formation of the isotropic component appears to be fully reversible as this peak disappears on cooling. Similar results have been reported previously for BBSM though the origin of the peak was not suggested.18 20
In addition to the primary 18:0 component, BBSM contains a significant proportion of longer saturated chain sphingomyelins and an unsaturated 24:1 chain component (Fig. 2). We believe that the high chain mismatch in long chain SM results in packing frustration which can be relieved by these lipids leaving the 25
bilayer to form smaller vesicles which then exist in equilibrium with larger multi-lamellar vesicles. Formation of small vesicles would result in a peak at the isotropic chemical shift (0 ppm). The width of this peak depends on the vesicle size as, for a fixed lateral diffusion rate, molecular 30
orientational averaging increases as the vesicle size decreases, so smaller vesicles result in a sharper isotropic linewidth and previously studies have investigated small vesicles of a range of diameters in order to examine the resulting NMR linewidths.19 It is not possible to determine the linewidth of the isotropic 35
component seen here precisely as it is superimposed on the lamellar powder pattern, however it can be crudely estimated as having a full width of 6 – 7 ppm, suggesting a vesicle diameter of around 200 – 250 nm. Electron micrographs from freeze-fracture studies have 40
previously shown small vesicles coexisting with large multi lamellar vesicles (MLVs) in both BBSM 6, 15 and long chain synthetic SM16 samples. In the latter study, small vesicles were observed in pure 24:0 SM samples but not in 16:0 SM. As BBSM contains a high proportion of long chain SM it is likely that these 45
are the components which leave the bilayer and form small vesicles. Magic angle spinning solid-state nuclear magnetic resonance (MAS NMR) 31P MAS NMR data for BBSM show the main melting transition 50
for all lipid extracts studied as a sharp reduction in linewidth (Fig. 11). However, just before the main transition an increase in linewidth is observed, this is observed in all extracts studied and it discussed further below.
Egg yolk sphingomyelin (EYSM) 55
SAXS As with BBSM, at temperatures above the main chain melting transition, X-ray diffraction patterns from hydrated EYSM show
sharp, evenly spaced peaks in the small-angle region characteristic of a fluid lamellar structure with a layer spacing of 60
around 62 Å. The reduction in layer spacing relative to BBSM is consistent with the shorter average chain length in EYSM. At low temperature and pressure, SAXS patterns show a number of broad peaks which cannot be resolved from each other. These peaks fit within the same envelope as the ripple phase peaks of 65
BBSM and so we believe that EYSM also forms a poorly resolved ripple gel phase at low temperature and pressure. In contrast to BBSM, the gel phase diffraction pattern from EYSM does not become sharper at high pressure after inducing a transition from the fluid phase. Instead, the pattern remains rather 70
broad and with increasing pressure, the (01) ripple peak disappears and the pattern changes to indicate a simple flat lamellar structure, NMR results (see below) indicate that this is a gel phase. As it was not possible to resolve the ripple gel diffraction peaks 75
for EYSM, it was not possible to accurately determine the lattice parameters. Instead, the two lattice parameters, a and b were estimated from peak maxima, assuming that γ is close to 90°, as was the case for BBSM. These values are shown in Table 2 with those determined for BBSM. 80
Table 2 Lattice parameters a and b for BBSM and EYSM (estimated) in the ripple phase
Parameter BBSM EYSM
a / Å 92 69 b / Å 125 133
85
The smaller interlamellar gel distance, a, observed for EYSM relative to that for BBSM is again consistent with the smaller average chain length of EYSM. The observation of a ripple phase as an intermediate between the flat Lα and Lβ phases in EYSM is in agreement with freeze-90
fracture microscopy data for synthetic 16:0 SM.16 This is entirely reasonable as EYSM is primarily composed of 16:0 SM, although here the ripple phase is observed over an extended temperature range, presumably due to the remaining 16% longer chain SM (18:0, 20:0, 22:0, 24:0) increasing the stability of the ripple 95
phase. The transition from the rippled gel to flat gel with increasing pressure occurs at around 140 MPa at 62 °C (Fig. 12) and is accompanied by a reduction in the layer spacing to around 67 Å, increasing the pressure further causes a gradual reduction in the 100
layer spacing which reaches around 57 Å at 250 MPa. Surprisingly, this is lower than the spacing of the EYSM fluid lamellar phase (62 Å at atmospheric pressure) which is rather unexpected as the lipid hydrocarbon chains predominantly adopt an all trans configuration in the gel phase which would be 105
expected to give a larger bilayer thickness than the fluid chains of the Lα phase. DPPC is structurally extremely similar to 16:0 SM and shows a sharp reduction in layer spacing of over 25 Å at high pressure due to formation of an interdigitated LβI gel phase.20 However, the gradual reduction in layer spacing of EYSM by 110
around 10 Å is more likely to be due to tilting of the lipid chains.
6 | Journal Name, [year], [vol], 00–00 This journal is © The Royal Society of Chemistry [year]
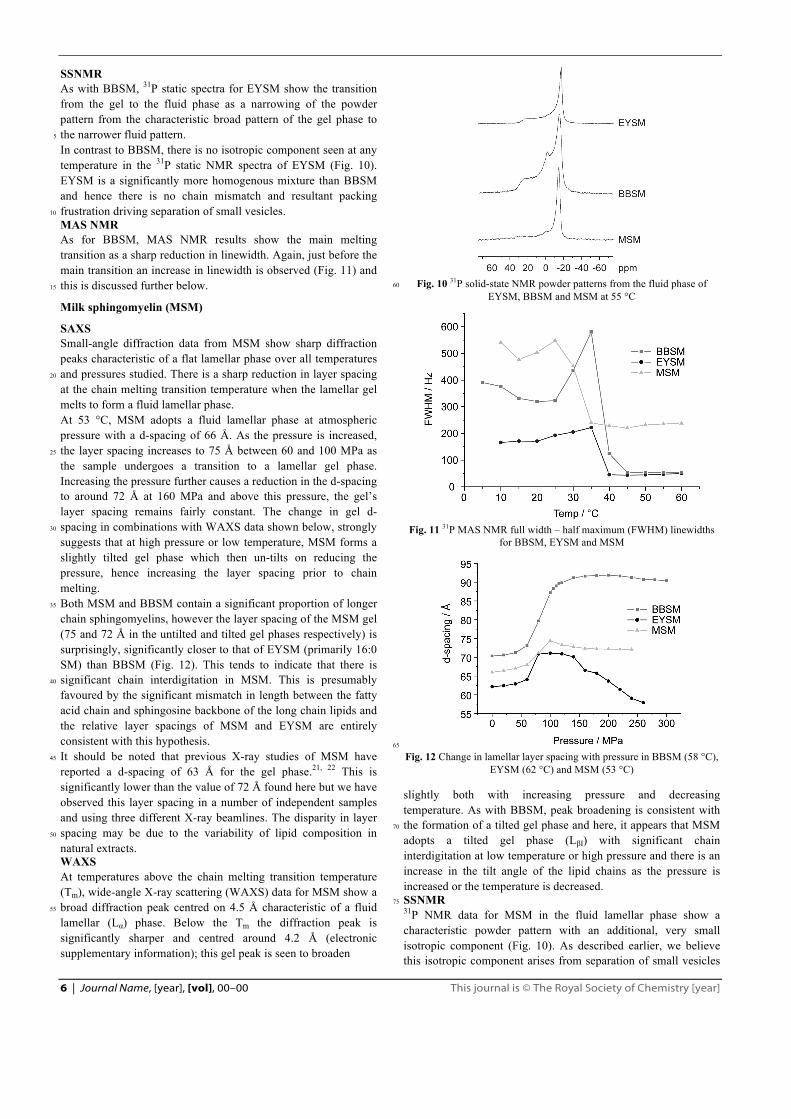
SSNMR As with BBSM, 31P static spectra for EYSM show the transition from the gel to the fluid phase as a narrowing of the powder pattern from the characteristic broad pattern of the gel phase to the narrower fluid pattern. 5
In contrast to BBSM, there is no isotropic component seen at any temperature in the 31P static NMR spectra of EYSM (Fig. 10). EYSM is a significantly more homogenous mixture than BBSM and hence there is no chain mismatch and resultant packing frustration driving separation of small vesicles. 10
MAS NMR As for BBSM, MAS NMR results show the main melting transition as a sharp reduction in linewidth. Again, just before the main transition an increase in linewidth is observed (Fig. 11) and this is discussed further below. 15
Milk sphingomyelin (MSM)
SAXS Small-angle diffraction data from MSM show sharp diffraction peaks characteristic of a flat lamellar phase over all temperatures and pressures studied. There is a sharp reduction in layer spacing 20
at the chain melting transition temperature when the lamellar gel melts to form a fluid lamellar phase. At 53 °C, MSM adopts a fluid lamellar phase at atmospheric pressure with a d-spacing of 66 Å. As the pressure is increased, the layer spacing increases to 75 Å between 60 and 100 MPa as 25
the sample undergoes a transition to a lamellar gel phase. Increasing the pressure further causes a reduction in the d-spacing to around 72 Å at 160 MPa and above this pressure, the gel’s layer spacing remains fairly constant. The change in gel d-spacing in combinations with WAXS data shown below, strongly 30
suggests that at high pressure or low temperature, MSM forms a slightly tilted gel phase which then un-tilts on reducing the pressure, hence increasing the layer spacing prior to chain melting. Both MSM and BBSM contain a significant proportion of longer 35
chain sphingomyelins, however the layer spacing of the MSM gel (75 and 72 Å in the untilted and tilted gel phases respectively) is surprisingly, significantly closer to that of EYSM (primarily 16:0 SM) than BBSM (Fig. 12). This tends to indicate that there is significant chain interdigitation in MSM. This is presumably 40
favoured by the significant mismatch in length between the fatty acid chain and sphingosine backbone of the long chain lipids and the relative layer spacings of MSM and EYSM are entirely consistent with this hypothesis. It should be noted that previous X-ray studies of MSM have 45
reported a d-spacing of 63 Å for the gel phase.21, 22 This is significantly lower than the value of 72 Å found here but we have observed this layer spacing in a number of independent samples and using three different X-ray beamlines. The disparity in layer spacing may be due to the variability of lipid composition in 50
natural extracts. WAXS At temperatures above the chain melting transition temperature (Tm), wide-angle X-ray scattering (WAXS) data for MSM show a broad diffraction peak centred on 4.5 Å characteristic of a fluid 55
lamellar (Lα) phase. Below the Tm the diffraction peak is significantly sharper and centred around 4.2 Å (electronic supplementary information); this gel peak is seen to broaden
Fig. 10 31P solid-state NMR powder patterns from the fluid phase of 60
EYSM, BBSM and MSM at 55 °C
Fig. 11 31P MAS NMR full width – half maximum (FWHM) linewidths
for BBSM, EYSM and MSM
65
Fig. 12 Change in lamellar layer spacing with pressure in BBSM (58 °C), EYSM (62 °C) and MSM (53 °C)
slightly both with increasing pressure and decreasing temperature. As with BBSM, peak broadening is consistent with the formation of a tilted gel phase and here, it appears that MSM 70
adopts a tilted gel phase (LβI) with significant chain interdigitation at low temperature or high pressure and there is an increase in the tilt angle of the lipid chains as the pressure is increased or the temperature is decreased. SSNMR 75 31P NMR data for MSM in the fluid lamellar phase show a characteristic powder pattern with an additional, very small isotropic component (Fig. 10). As described earlier, we believe this isotropic component arises from separation of small vesicles

This journal is © The Royal Society of Chemistry [year] Journal Name, [year], [vol], 00–00 | 7
containing long chain sphingomyelins. The intensity of the isotropic peak suggests that BBSM forms a larger proportion of small vesicles than MSM. This may be due to the fact that MSM has a much greater percentage of SM with mismatched chains, allowing a more uniform chain packing 5
density through the bilayer through a disordered interdigitation. MAS NMR As for the other extracts studied, MAS NMR results from MSM show the main melting transition as a sharp reduction in linewidth (Fig. 11). Again, just before the main transition an increase in 10
linewidth is observed and this is discussed further below.
Table 3 Layer spacings for BBSM, EYSM and MSM measured by SAXS. The two values given for BBSM refer to the Lβ layer spacing and the ripple a parameter respectively. The spacings are measured at 58 °C 15
for BBSM, 62 °C for EYSM and 53 °C MSM, fluid spacings are measured at atmospheric pressure and gel spacings are measured at the lowest pressure for which the fluid – gel transition is complete.
Extract d-spacing / Å Gel Fluid
BBMS 85 / 91 70 EYSM 69 62 MSM 73 66
20
Sphingomyelin melting
The 31P MAS NMR results for all SM extracts studied show some interesting features. Each of the extracts initially show a reduction in 31P MAS NMR linewidth with increasing temperature, followed by an increase approximately 10 °C before 25
the main chain melting transition (Fig. 11). The initial reduction in linewidth upon heating the sample can be understood in terms of increased long axis rotation / headgroup rotation resulting in signal averaging, increases in lateral diffusion can be discounted as the SM remains in the gel phase. The increase in linewidth 30
before melting however seems counterintuitive as increasing temperature generally results in increased motion and hence narrower MAS NMR lineshapes. This can be readily seen in the differences between the gel and Lα isotropic lineshapes due to the different rates of lateral diffusion in the two phases.23 35
This unusual trend has been reported previously for EYSM23 and was attributed to the possible formation of a ripple gel phase (Pβ’) between the non-rippled gel and fluid phases, in which greater restriction of headgroup motion leads to line-broadening. However, this cannot fully explain the linewidth increase as this 40
effect is also seen in BBSM where we have shown that its gel phase is always rippled over the temperatures and pressures studied. Furthermore, this line broadening effect is still present in MSM for which there is no evidence for a ripple phase at any temperatures or pressure measured. 45
We have also acquired variable temperature 31P MAS NMR data for fully hydrated DPPC and DPPE (Fig. 13). DPPC is known to form a ripple gel phase prior to the main transition with increasing temperature24 and DPPE, like MSM, does not form a pre-melting ripple phase.24 MAS NMR line width increases are 50
observed for both of these phospholipids prior to chain melting and a similar trend has also been reported previously in 2H NMR
Fig. 13 31P MAS NMR linewidths (FWHM) of BBSM, DPPC and DPPE
55
Fig. 14 Variation of BBSM gel chain spacing with temperature
studies of perdeuterated DPPC25 and palmitoyl-SM.26 From these experiments, this effect appears to be independent of both headgroup and interfacial structure and we believe that this may be a universal trend related to lipid melting transitions. 60
A study of DMPC 31P T2 (transverse) relaxation measurements27 has also shown a related trend to our data. This study measured T2 relaxation times over a wide range of temperatures and shows a sharp decrease in T2 shortly before the main transition at 23°C. Given that a decrease in T2 results in an increase in linewidth, 65
this T2 trend appears to follow the same pattern as our 31P MAS linewidth data. The T2 decrease was attributed to the onset of restricted whole molecule rotation; a similar effect has been observed in hydrocarbons before melting when a rotator phase is known to form.28 However, lipid headgroup motion is known to 70
be strongly decoupled from that of the chains, 1H NMR spectra of lipids show very sharp peaks for the headgroup even in the gel phase and studies have shown that headgroups begin to exhibit rapid motion 5°C before the acyl chains melt.29 So although there is evidence for a slow/restricted motion occurring in the chains 75
before melting it seems unlikely that this will also be reflected by the headgroup. As the temperature increases and the lipid gel phase comes close to the chain melting temperature, many different processes occur; molecular motion increases, chain order parameter decreases, and 80
there is lateral expansion of the hexagonal lattice. This lattice

8 | Journal Name, [year], [vol], 00–00 This journal is © The Royal Society of Chemistry [year]
expansion can be observed directly in WAXS diffraction data; as the temperature increases the characteristic gel peak moves to larger spacing until it reaches a maximum value of approximately 4.2 Å (Fig. 14). The lateral expansion observed prior to melting must allow more water molecules access to the headgroup region 5
in a fully hydrated system and it has been shown in many studies that headgroups in a liquid crystalline phase are more hydrated than in a gel.30 It is very likely that increased hydration of the lipid headgroup prior to melting results in increased hydrogen bonding to the 10
phosphate group and IR studies also show a change in hydration via the stretching vibration of the carbonyl group.31 A possible explanation for this effect is strong hydrogen bonding interactions between the charged phosphate and the surrounding water molecules although the specific nature of this linebroadening 15
effect is not fully understood.32, 33
Pressure – Temperature phase diagrams
Fig. 15 shows pressure – temperature phase diagrams for BBSM, EYSM and MSM in excess water in the range 25 – 65 °C and 0 – 250 MPa. The grey area in the BBSM phase diagram represents 20
the area where the ripple period changes with pressure. The grey area in the MSM phase diagram indicated the region where the gel tilt angle changes. Pressure – temperature phase diagrams for the three SM extracts were compiled from both X-ray and NMR data. It should be 25
noted that, in the case of BBSM and MSM, NMR data suggests the presence of small vesicles coexisting with the fluid lamellar phase at high temperature, however these have been excluded from the phase diagrams for clarity. All the observed phase boundaries show a linear pressure – 30
temperature dependence as predicted by the Clapeyron equation:
!"!"= !∆!
∆! (1)
Where T and P are the transition temperature and pressure 35
respectively, ΔH is the transition enthalpy, and ΔV is the volume change which accompanies the transition. The gradient of pressure – temperature phase boundaries (dT/dP) are conventionally expressed as °C.kbar-1, where 1 °C.kbar-1 = 10 °C.GPa-1. 40
The BBSM phase diagram shows a fluid Lα phase at high temperature and low pressure, and a ripple gel Pβ’ phase at high pressure or low temperature. There is a region of co-existence between the fluid lamellar and ripple gel phases (this is permitted by the phase rule since the BBSM is a mixture of components) 45
and also a region over which the gel ripple period changes. The phase boundary for the BBSM gel – fluid transition has a gradient of 23 °C.kbar-1, which is in good agreement with values reported for other phospholipids; usually around 22 – 25 °C.kbar-1 for PC headgroup phospholipids.34 50
EYSM forms a fluid Lα phase at high temperature and low pressure and a tilted Lβ’ phase at high pressure. A ripple gel phase forms as an intermediate between the fluid lamellar and the flat gel phases and there is a narrow coexistence region between the fluid lamellar and ripple gel phases. All the EYSM phase 55
boundaries have a gradient of approximately 40 °C.kbar-1.
Fig. 15 Pressure – temperature phase diagrams for BBSM, EYSM and MSM in the range 25 – 65 °C and 0 – 250 MPa. For BBSM and MSM, NMR data suggests that small vesicles coexist with the fluid lamellar 60
phase at high temperature

This journal is © The Royal Society of Chemistry [year] Journal Name, [year], [vol], 00–00 | 9
At high temperature and low pressure MSM adopts a fluid Lα structure, with increasing pressure it moves through a coexistence region to form an interdigitated gel phase which then tilts slightly as the pressure is increased. It should be noted that while we have labelled the first gel phase an untilted phase based on its layer 5
spacing and width of its wide-angle X-ray scattering peak, it may simply be less tilted than the higher pressure fully tilted gel phase. The phase transition temperatures vary linearly with pressure with a gradient of approximately 30 °C.kbar-1. This phase boundary gradients for EYSM and MSM seem rather 10
high when compared to typical phospholipids lipids which show boundary gradients of around 22 – 25 °C.kbar-1,34 however a value of 28.5 °C.kbar-1 has been reported for dimyristoylphosphatidylcholine (DMPC).35
Conclusions 15
Despite their similarities, the pressure – temperature phase behaviour of the three SM extracts studied show significant differences. We have presented the first X-ray diffraction evidence for ripple gel phase formation in BBSM and EYSM. NMR data also shows evidence for the formation of small 20
vesicles in BBSM and MSM at high temperature, probably due to the long chain lipids present in these extracts. The difference in the extracts’ behaviour can be attributed to their different chain compositions. EYSM is predominantly composed of 16:0 SM and behaves in a similar way to its closest related PC 25
based lipid, DPPC, both exhibiting a ripple gel phase as an intermediate phase between the unrippled lamellar gel and the fluid lamellar phase. BBSM is more heterogeneous, containing predominantly two SM chain lengths, 18:0 and 24:1. Below the Tm, this exhibits a ripple 30
gel phase at all temperatures and pressures studied. In the fluid phase, small vesicles are likely to form due to the difficulty in packing 24:1 SM in this structure. MSM is the most heterogeneous mixture of all the extracts, containing a mixture of longer chain SMs. This does not exhibit a 35
ripple gel phase as BBSM does but a tilted gel which undergoes an untilting pretransition before melting. In a similar way to BBSM it also appears to form some small vesicles in the fluid phase, which can again be attributed to the presence of the longer chain SM. 40
Acknowledgments This work was supported by EPSRC Platform Grant EP/G00465X and by an EPSRC DTA studentship awarded to KPS. We thank Diamond Light Source (UK) and the European Synchrotron Radiation Facility (ESRF, Grenoble, France) for the 45
award of synchrotron beamtime.
50
Notes and references Department of Chemistry, Imperial College London, South Kensington Campus, London SW7 2AZ, UK 55
E-mail: [email protected]; [email protected]; [email protected] † Electronic Supplementary Information (ESI) available: Additional small- and wide-angle X-ray diffraction data, further details of the presure 60
and temperature conditions used for high pressure SAXS experiments, experimental parameters for NMR experiments and further details of ripple phase structural analysis. See DOI: 10.1039/b000000x/ 1. B. Ramstedt, P. Leppimaki, M. Axberg and J. P. Slotte, Eur. J. 65
Biochem., 1999, 266, 997-1002. 2. B. J. Pettus, C. E. Chalfant and Y. A. Hannun, Biochimica et
Biophysica Acta - Molecular and Cell Biology of Lipids, 2002, 1585, 114-125.
3. W. I. Calhoun and G. G. Shipley, Biochimica et Biophysica Acta - 70
Biomembranes, 1979, 555, 436-441. 4. S. H. Untrach and G. G. Shipley, J. Biol. Chem., 1977, 252, 4449-
4457. 5. G. G. Shipley, L. S. Avecilla and D. M. Small, J. Lipid Res., 1974,
15, 124-131. 75
6. S. W. Hui, T. P. Stewart and P. L. Yeagle, Biochimica et Biophysica Acta - Biomembranes, 1980, 601, 271-281.
7. J. M. Smaby, H. L. Brockman and R. E. Brown, Biochemistry, 1994, 33, 9135-9142.
8. A. Filippov, G. Oradd and G. Lindblom, Biophys. J., 2006, 90, 2086-80
2092. 9. J. Woenckhaus, R. Kohling, R. Winter, P. Thiyagarajan and S. Finet,
Rev. Sci. Instrum., 2000, 71, 3895-3899. 10. N. J. Brooks, B. L. L. E. Gauthe, N. J. Terrill, S. E. Rogers, R. H.
Templer, O. Ces and J. M. Seddon, Rev. Sci. Instrum., 2010, 85
81, -. 11. J. M. Seddon, A. M. Squires, C. E. Conn, O. Ces, A. J. Heron, X.
Mulet, G. C. Shearman and R. H. Templer, Philosophical Transactions of the Royal Society A, 2006, 364, 2635-2655.
12. N. J. Brooks, O. Ces, R. H. Templer and J. M. Seddon, Chem. Phys. 90
Lipids, 2011, 164, 89-98. 13. H. Takahashi, J. Appl. Crystallogr., 2007, 40, s312. 14. S. Matuoka, S. Kato, M. Akiyama, Y. Amemiya and I. Hatta,
Biochimica et Biophysica Acta - Biomembranes, 1990, 1028, 103-109. 95
15. H. W. Meyer, H. Bunjjes and A. S. Ulrich, Chem. Phys. Lipids, 1999, 99, 111-123.
16. L. K. Bar, Y. Barenholz and T. E. Thompson, Biochemistry, 1997, 36, 2507-2516.
17. Y. J. E. Bjorkqvist, J. Brewer, L. A. Bagatolli, J. P. Slotte and B. 100
Westerlund, Biochimica et Biophysica Acta - Biomembranes, 2009, 1788, 1310-1320.
18. P. R. Cullis and M. J. Hope, Biochimica et Biophysica Acta - Biomembranes, 1980, 597, 533-542.
19. E. E. Burnell, C. P. R and B. De Kruijff, Biochimica et Biophysica 105
Acta - Biomembranes, 1980, 603, 63-69. 20. L. F. Braganza and D. L. Worcester, Biochemistry, 1986, 25, 2591-
2596. 21. M. Malmsten, B. Bergenstahl, L. Nyberg and G. Odham, J. Am. Oil
Chem. Soc., 1994, 71, 1021-1026. 110

10 | Journal Name, [year], [vol], 00–00 This journal is © The Royal Society of Chemistry [year]
22. H. Minami, T. Nylandera, A. Carlsson and K. Larsson, Chem. Phys. Lipids, 1996, 79, 65-70.
23. G. P. Holland, S. K. McIntyre and T. M. Alam, Biophys. J., 2006, 90, 4248-4260.
24. G. Cevc, Chem. Phys. Lipids, 1991, 57, 293-307. 5
25. J. H. Davis, Biophys. J., 1979, 27, 339-358. 26. T. Mehnert, K. Jacob, R. Bittman and K. Beyer, Biophys. J., 2006,
90, 939-946. 27. E. J. Dufourc, C. Mayer, J. Stohrer, G. Althoff and G. Kothe,
Biophys. J., 1992, 61, 42-57. 10
28. M. Möller, H.-J. Cantow, H. Drotloff, D. Emeis, K.-S. Lee and G. Wegner, Die Makromolekulare Chemie, 1986, 187, 1237-1252.
29. A. L. MacKay, Biophys. J., 1981, 35, 301-313. 30. C. Faure, L. Bonakdar and E. J. Dufourc, FEBS Lett., 1997, 405, 263-15
266. 31. A. Blume, W. Huebner and G. Messner, Biochemistry, 1988, 27,
8239-8249. 32. R. Ghosh, Biochemistry, 1988, 27, 7750-7758. 33. M. Kodama, H. Inoue and Y. Tsuchida, Transition Phenomena in 20
Condensed Matter, 1995, 266, 373-384. 34. R. Winter, Current Opinion in Colloid & Interface Science, 2001, 6,
303-312. 35. M. Caffrey, J. Hogan and A. Mencke, Biophys. J., 1991, 60, 456-466. 25