preservation of missouri transportation infrastructures
TRANSCRIPT

Organizational Results Research Report
September 2008 OR09.010
Preservation of Missouri Transportation Infrastructures: Validation of FRP Composite Technology Volume 4 of 5 Non-Destructive Testing of FRP Materials and Installation, Gold Bridge
Prepared by Missouri S&T
and Missouri Department of
Transportation

FINAL REPORT RI02-022
Preservation of Missouri Transportation Infrastructures: Validation of FRP Composite Technology
Volume 4 Non-Destructive Testing of FRP Materials and Installation, Gold Bridge
Prepared for the
Missouri Department of Transportation Organizational Results
In Cooperation with the
National University Transportation Center
by Center for Infrastructure Engineering Studies
Missouri University of Science and Technology Norbert H. Maerz
Greg Galecki
September 2008 The opinions, findings and conclusions expressed in this report are those of the principal investigator and the Missouri Department of Transportation. They are not necessarily those of the U.S. Department of Transportation or the Federal Highway Administration. This report does not constitute a standard, specification or regulation.

TECHNICAL REPORT DOCUMENTATION PAGE
1. Report No. OR09-009
2. Government Accession No.
3. Recipient’s Catalog No.
5. Report Date September 1, 2008
4. Title and Subtitle Preservation of Missouri Transportation Infrastructures: Non-Destructive Testing of FRP Materials and Installation, Gold Bridge 6. Performing Organization Code
Missouri S&T 7. Author/s Norbert H. Maerz and Greg Galecki
8. Performing Organization Report No. RI02-022 10. Work Unit No. (TRAIS)
9. Performing Organization Name and Address Center for Infrastructure Engineering Studies Missouri University of Science & Technology 220 Engineering Research Lab Rolla, MO 65409
11. Contract or Grant No. DTRT06-G-0014
13. Type of report and period covered Final
12. Sponsoring Organization Name and Address U.S. Department of Transportation Research and Special Programs Administration 400 7th Street, SW Washington, DC 20590-0001
14. Sponsoring Agency Code MoDOT
15. Supplementary Notes 16. Abstract
The FRP (Fiber Reinforced Polymer) retrofit of a concrete bridge (Gold Bridge, Bridge P-0962 in Dallas County) in Missouri provided the opportunity to use new and existing technologies to test the FRP materials installations, and performance. Four different parameters were investigated; concrete substrate surface roughness, FRP fiber alignment, FRP delamination, and FRP bond pull-off strength. Results of testing to date are presented, and long term monitoring plans will be given.
Surface substrate roughness measurements of sand blasted surfaces were made, on selected locations of the bridge abutments and bents, as well as the bridge deck, using a newly developed laser profilometer. The roughness measurements are compared to the “idealized surface roughness”, and compared against any potential future delamination, from pull-off tests and natural delamination.
FRP fiber alignment measurements were made using an imaging technique that measures the angle between control lines and special tracers embedded in the FRP materials.
FRP delamination testing was done using a specially modified impact echo tester, on production surfaces and on surfaces with artificially created delaminations. All test sites are referenced with respect to previously determined substrate roughness measurements. Tests were performed periodically for five years.
FRP bond Pull-off strength testing was done using a specially designed pull-off tester. Pull-off plugs were installed on selected locations on the bridge and referenced to roughness measurements; pull-off tests were performed periodically for five years. 17. Key Words Bridge monitoring, FRP, delaminations, impact echo, pull-off, bond strength, surface roughness, fiber alignment
18. Distribution Statement No restrictions. This document is available to the public through the National Technical Information Service, Springfield, Virginia 22161
19. Security Classification (of this report) Unclassified
20. Security Classification (of this page) Unclassified
21. No. of Pages 39
22. Price Free
Form DOT F 1700.7 (8-72) Reproduction of form and completed page is authorized
ii

3
Table of Contents Executive Summary....................................................................................................................................................5
..............................................................................5
..............................................................................7
..............................................................................7
..............................................................................7
............................................................................10
............................................................................10
............................................................................11
............................................................................11
............................................................................11
............................................................................11
............................................................................11
............................................................................13
............................................................................13
............................................................................13
............................................................................15
............................................................................16
............................................................................17
............................................................................17
............................................................................17
............................................................................20
............................................................................24
............................................................................25
............................................................................26
............................................................................27
............................................................................32
............................................................................35
Introduction ..................................................................................1. FRP Substrate Roughness.........................................................
1.1 Purpose ...............................................................................1.2 Methodology.......................................................................1.3 Results ................................................................................1.4 Conclusions ........................................................................
2. FRP Alignment.........................................................................2.1 Purpose ...............................................................................2.2 Methodology.......................................................................2.3 Results ................................................................................2.4 Conclusions ........................................................................
3. Impact Echo Testing of Forced Delaminations in FRP............3.1 Purpose ...............................................................................3.2 Methodology.......................................................................3.3 Results ................................................................................3.4 Conclusions ........................................................................
4. FRP Pull-off Testing.................................................................4.1 Purpose ...............................................................................4.2 Methodology.......................................................................4.3 Results ................................................................................4.4 Conclusions ........................................................................
5. Acknowledgements ..................................................................6. References ...............................................................................Appendix 1: Bridge Deck Roughness Measurements ..................Appendix 2: Results of Impact Echo Testing for Delaminations .Appendix 3: Pull-Off Test locations.............................................

4
List of Tables and Figures Figure 1.1: New laser profilometer. ...........................................................................................................................7 Figure 1.2: Relationship between roughness (Ia in degrees) and stiffness (area under strain curve)..........................7 Figure 1.3: Using the laser profilometer under the gold bridge. ................................................................................8 Figure 1.4: Sample roughness outputs for the profilometer. ......................................................................................8 Figure 1.5: Sandblasting for the test panels on the abutment (left) and one of the bents (right)................................9 Figure 1.6: Location of the test panels on the abutment (top) and the bent (bottom).................................................9 Table 1.1: Average roughness values for bridge deck..............................................................................................10 Table 1.2: Average roughness values for abutment panels ......................................................................................10 Table 1.3: Average roughness values for bent panels ..............................................................................................10 Figure 2.1: Stretching a chord parallel to the correct direction of the embedded fibers. Left: Well aligned, right,
poorly aligned. ...................................................................................................................................................11 Figure 2.2: FRP sheets with yellow tracer and overlain by white chord. .................................................................12 Figure 2.3: Measurement of angle between the tracer and the chord. ......................................................................12 Figure 3.1: Olson Instruments impact echo tester. ...................................................................................................13 Figure 3.2: Impact echo tester modified with air coupled receiver. .........................................................................13 Figure 3.3: Panels for delamination on south abutment. ..........................................................................................14 Figure 3.4: Patch with delaminations shown............................................................................................................14 Figure 3.6: Impact echo measurements ....................................................................................................................14 Figure 3.7: Grid marked for measurement at 1” centers. .........................................................................................14 Figure 3.8: Measurement results on panel 4 (red circles indicate delaminations) superimposed on an image of the
panel...................................................................................................................................................................15 Figure 4.1: Pull-off tester used in a shear mode. ......................................................................................................17 Figure 4.2: The pull-off tester used in a tensile mode ..............................................................................................17 Figure 4.3: Location of pull-off plugs. .....................................................................................................................18 Figure 4.4: Pull-off test plugs are installed over the FRP sheets. First the surface is sanded, and then epoxy is
used to bond the plug to the surface. Where location is critical, a positioning laser is used to precisely locate the position of the plugs. ....................................................................................................................................19
Figure 4.5: Pull-off test on the deck plugs................................................................................................................20 Figure 4.6: Impact echo test on the deck failed plug location. .................................................................................20 Figure 4.7: Pull-off plug failures and dates ..............................................................................................................21 Figure 4.8: Failed pull-off plugs...............................................................................................................................22 Figure 4.9: Example of separation at the plug bond.................................................................................................23 Figure 4.10: Example of separation at the top coat of epoxy. (Note that the texture is the impression of the FRP
fibers, and not the fibers themselves).................................................................................................................23 Figure 4.11: Example of composite separation, starting at the top coat of epoxy and extending into the concrete.23

5
Non-Destructive Testing of FRP Materials and Installation, Gold
Bridge
Executive Summary The FRP (Fiber Reinforced Polymer) retrofit of a concrete bridge (Gold Bridge, Bridge P-0962 in Dallas County) in Missouri provided the opportunity to use new and existing technologies to test the FRP materials installations, and performance. Four different parameters were investigated; concrete substrate surface roughness, FRP fiber alignment, FRP delamination, and FRP bond pull-off strength. Results of testing to date are presented, and long term monitoring plans will be given. Surface substrate roughness measurements of sand blasted surfaces were made, on selected locations of the bridge abutments and bents, as well as the bridge deck, using a newly developed laser profilometer. The roughness measurements are compared to the “idealized surface roughness”, and compared against any potential future delamination, from pull-off tests and natural delamination. FRP fiber alignment measurements were made using an imaging technique that measures the angle between control lines and special tracers embedded in the FRP materials. FRP delamination testing was done using a specially modified impact echo tester, on production surfaces and on surfaces with artificially created delaminations. All test sites are referenced with respect to previously determined substrate roughness measurements. Tests were performed periodically for five years. FRP bond Pull-off strength testing was done using a specially designed pull-off tester. Pull-off plugs were installed on selected locations on the bridge and referenced to roughness measurements; pull-off tests were performed periodically for five years.
Introduction The use of fiber reinforced polymers (FRP) for reinforcement of concrete members has emerged as one of the most promising technologies in materials and structural engineering to repair and strengthen our nation’s infrastructure (1,2,3,4,5,6,7). Current Federal Highway Administration (FHWA) statistics indicate that approximately one-fifth of our nation’s bridges constructed between 1950 and 1960 are structurally deficient (8). Of these, the vast majority are composed of reinforced or pre-stressed concrete. Much of the deterioration is attributed to aggressive environments and durability related issues. In particular, for highway structures where de-icing salts are predominantly used, corrosion related problems associated with mild steel reinforcing or pre-stressing strands has stood out as a major contributor to the deterioration. Fiber reinforced polymers are ideally suited for repair and strengthening of concrete structures in aggressive environments due to their non-corrosive, non-magnetic characteristics. They have high tensile strength to weight ratio and high elastic limit. Externally applied FRP sheets or laminates are bonded directly to a concrete surface with an epoxy providing additional flexural or shear strength capacity depending on the application and fiber alignment. This significantly increases the load carrying ability of a structural component and/or structural system.

6
Although durability-related concerns for new structures can be addressed using modern techniques that include cathodic protection, epoxy-coated reinforcing, and non-corrosive materials, existing deficient structures must be rehabilitated and upgraded in a cost effective way with minimal disruption to service. Research has shown that repair of concrete structures with FRP products including externally applied FRP materials has proved to be a viable and cost effective alternative to traditional repair and strengthening techniques to upgrade deficient structures to meet today’s design standards (3,4,5,6,7,8,9). In 2003 the Missouri Department of Transportation contracted to retrofit five county bridges with FRP materials. This paper deals with non-destructive testing of FRP material performance of the Dallas County Bridge P-0962, codenamed the “Gold Bridge” Bridge P-0962 is located in Dallas County about 10 miles north of exit 113 on Interstate 44. Built in 1956, the bridge carries County Route B across a medium sized creek. The bridge is 127.5’ long and 23.75’ wide. It has three spans, all consisting of three reinforced concrete girders, monolithically cast with a 6” slab.

1. FRP Substrate Roughness
1.1 Purpose The roughness of the concrete pre-FRP-installation substrate has been identified as a critical factor that affects bond behavior between the FRP and the concrete (10,11,12,13). Using a newly developed laser profilometer (14) (Figure 1.1) a preliminary relationship between roughness (defined as Ia or micro average inclination angle of the profile) has been established (12) (Figure 1.2). A preliminary optimum value of Ia has been established.
Figure 1.1: New laser profilometer.
0
100
200
300
400
500
600
700
4 6 8 10 12 14 16 18 20
Ia value
Are
a U
nder
Str
ain
Cur
ve a
t Ser
vice
(με-
in.)
Figure 1.2: Relationship between roughness (Ia in degrees) and stiffness (area under strain curve).
1.2 Methodology The new portable concrete roughness-testing device has been funded by the American Concrete Institute (14). This is an optical /laser based system developed along the principles of the Schmaltz microscope (15), and the Method of Shadow Profilometry (Maerz et al., 1990), but using a laser profiling line rather than a shadow edge. Similar structured lighting techniques are being used in industrial inspection for manufactured parts. The new device is a portable imaging device that can be used to measure roughness in both research and production environments (Figures. 1.1, 1.3), and will simultaneously measure five profiles per image. The device consists of a portable lightweight housing designed to hold a camera and a striping laser. The system uses a 670 nm 20 mW striping laser mounted at 45º to the concrete surface to generate five profile lines (Figure 3). These lines follow the contours of the surface, and get progressively more undulating as the roughness of the surface increases. The device uses a miniature video camera, mounted at 90º to the surface, to image the profiles (Figure 1.4). A 670 nm laser band pass filter is mounted on the lens to admit the laser-illuminated profile, and reject other ambient light. The video signal is transmitted to a laptop computer via coax cable or wireless video. At the computer the signal is digitized by a PCMCI digitizing card or framegrabber. The profiles are analyzed to produce varying roughness measures (Figure 1.4).
7

Figure 1.3: Using the laser profilometer under the gold bridge.
Figure 1.4: Sample roughness outputs for the profilometer.
8

Figure 1.5: Sandblasting for the test panels on the abutment (left) and one of the bents (right).
Figure 1.6: Location of the test panels on the abutment (top) and the bent (bottom). Roughness measurements after sand blasting (Figure 1.5) were made in two different areas, under the bridge deck and on the test panels where test FPR panels with forced delaminations were planned to be installed (Figure 1.6). Under the bridge deck, which was sand blasted with no specific instructions, measurements were made along on a 1’ by 1’ grid that was marked with chalk line (Figure 1.3, Appendix 1). Measurements along nodes were recorded to 1) Determine if optimum roughness has been achieved, 2) Determine a relationship between roughness should future delamination take place, and 3) Selection locations of varying roughnesses for installing
9

10
the pull-off test plugs. Measurement values consisted of Ia values which is the measure of the average angle of the surface. On the bridge abutment and one of the bents, sand blasting instructions were given to the contractors to progressively increase the amount of sandblasting ostensibly to progressively increase the roughness.
1.3 Results The average roughness values (Ia) for the bridge deck were between 7.9º and 8.5º, short of the optimum roughness of about 12º (Table 1.1). The roughness values of the locations for the abutment and bent panels were also measured (Tables 1.2, 1.3). For the abutment patches the sand blasting instructions were not well executed and the roughness measured reflected that. For the bent patches the instructions were executed correctly. The end of the bent around patches c and d later underwent unrelated masonry repair, and so the roughness numbers in Table 1.3 are no longer relevant. Table 1.1: Average roughness values for bridge deck Area Instructions Ia-value º STDEV 1 none 7.9 1.28 2 none 8.5 1.04 3 none 8.0 1.16 4 none 7.6 1.05 Table 1.2: Average roughness values for abutment panels Location Instructions Ia-value º STDEV 1 no sandblast 6.7 0.74 2 light sandblast 10.5 1.63 3 mod. light sandblast 10.4 1.32 4 mod. sandblast 9.0 1.02 5 mod. Heavy sandblast 10.7 1.20 6 heavy sandblast 8.4 0.94 Table 1.3: Average roughness values for bent panels Location Instructions Ia-value º STDEV a light sandblast 6.4 0.71 b mod. sandblast 9.9 1.25 c* heavy sandblast 12.0 0.88 d* no sandblast 6.2 0.33 * These two locations later underwent masonry repair, so roughness values are not relevant.
1.4 Conclusions Roughness was successfully measured in all the required locations. The surface roughness measurements were quick, easy to make and easy to interpret. The surface roughness was found to be below optimal, although the contractor would not have known what optimal was, nor was he given instructions on the amount of sandblasting he should do. Timing of this measurement was important, as the measurements needed to be done after sand blasting and before FRP installation.

2. FRP Alignment
2.1 Purpose The alignment of FRP fibers as installed has also been identified as an indicator of FRP performance. Yang et al. (16) indicated that a misalignment of 5 degrees or more can significantly affect the performance of the repair.
2.2 Methodology A method of measuring the installation alignment of the FRP sheets was developed. FRP sheets were ordered with an embedded tracer woven into the fabric, and were installed using transparent epoxy (Figure 2.1). Then a chord is simply stretched in the correct alignment, and imaged with a digital camera. (Figure 2.2). Using imaging software, the angle between the tracer and the chord is measured to determine if there is greater than 5º misalignment (Figure 2.3).
2.3 Results Fiber alignment measurements (Figure 11) were taken on four sections of the bridge deck. In all 421 measurements were made. The mean alignment error was 3.6º with a maximum error of about 11º. Almost 25% of the measurements indicated alignment errors over 5º. In tests with a broad sheet applied to the center girder, the alignment error in 12 measurements was about 1.2º, with no measurements above 5º
2.4 Conclusions Fiber alignment was successfully measured in all the required locations. For the broad sheet applications, all installations were within 5º of optimum. For the strips the error was higher, above the 5º of optimum. In fairness to the contractor, these thin strips of bi-direction fabric are difficult to keep aligned when installing. Normally for this type of application, a unidirectional fabric would be used.
Figure 2.1: Stretching a chord parallel to the correct direction of the embedded fibers. Left: Well aligned, right, poorly aligned.
11

Figure 2.2: FRP sheets with yellow tracer and overlain by white chord.
Figure 2.3: Measurement of angle between the traceand the chord.
r
12

3. Impact Echo Testing of Forced Delaminations in FRP
3.1 Purpose The use of fiber reinforced polymers (FRP) for reinforcement of concrete members has emerged as one of the most promising technologies in materials and structural engineering to repair and strengthen infrastructure. FRP sheets are ideally suited for repair and strengthening of concrete structures in aggressive environments due to their non-corrosive, non-magnetic characteristics. They have high tensile strength to weight ratio and high elastic limit. Externally applied FRP sheets or laminates are bonded directly to a concrete surface with an epoxy providing additional flexural or shear strength capacity depending on the application and fiber alignment. This significantly increases the load carrying ability of a structural component and/or structural system. Correct bonding of FRP sheets is crucial to the performance of the repair system. Delaminations affect the strength of the material and degrade the performance. Delamination of the FRP materials after installation results in decreased stiffness and decreased load bearing ability (15). A delamination with a surface area of 1 square inch is believed to be the threshold for which repair should be considered. For this study the purpose was to artificially create delaminations, and test them over a period of time to determine if the delaminations grow in size over time
3.2 Methodology A delamination with a surface area of 1 square inch is believed to be the threshold for which repair should be considered. To measure delaminations, an Olson Instruments impact echo tester (Figure 3.1) was specially modified with an air coupled receiver (Figure 3.2), and frequency domain analysis was employed to uniquely identify delaminated areas.
Figure 3.1: Olson Instruments impact echo tester.
Figure 3.2: Impact echo tester modified with air coupled receiver.
Test sections of FRP materials were applied on one abutment and one bent (Figure 1.6, 3.3). These locations were sandblasted to specified differing roughnesses (Figure 1.5), and roughness was characterized prior to FRP sheet installation. FRP sheets were installed (Figure 3.3) and before the epoxy was allowed to cure, delaminations were forced under the sheets installed in these test sections by air injection (Figure 3.4). These delaminations were measured periodically using impact echo testing (Figure 3.5). To make repeat measurements easier a grid of yellow dots on 1” centers was painted over the FRP material (Figure 3.6)
13
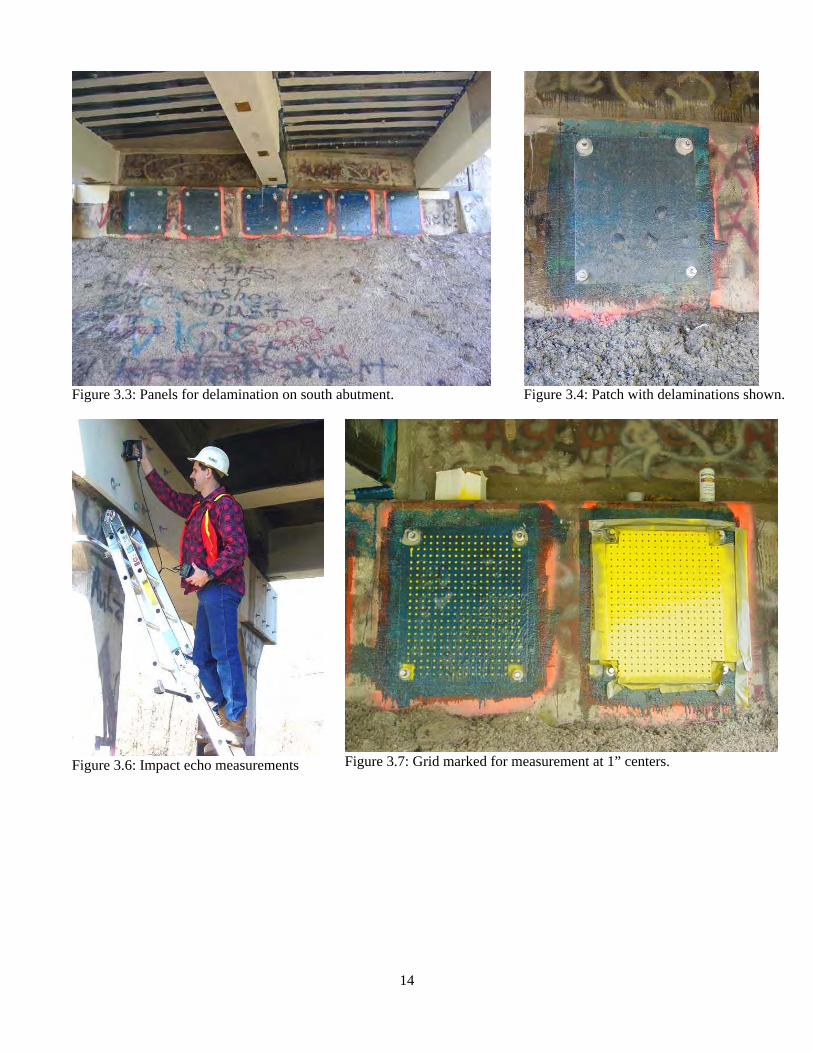
Figure 3.3: Panels for delamination on south abutment.
Figure 3.4: Patch with delaminations shown.
Figure 3.6: Impact echo measurements
Figure 3.7: Grid marked for measurement at 1” centers.
14

3.3 Results The impact echo delamination measurements were successful in identifying the “forced” delaminations. In addition, some small unplanned delaminations were found. Figure 3.8 shows the results of testing on panel number 4. Appendix 2 show the testing results. Delaminations were shown as circles and x’s were used to indicate measurement areas where delaminations were measured one time but subsequently measured as not-delaminated. In general there is no evidence that any of theses delaminations grew over the period of time in which they were monitored. There are clearly areas that were measured as delaminated during one session and not delaminated during another.
Figure 3.8: Measurement results on panel 4 (red circles indicate delaminations) superimposed on an image of the panel. This can be attributed to two factors:
15

16
When testing on the margin of a delamination, the positioning of the tester is critical. A slight movement one way can result in moving off or on to a delamination. There was a learning curve in using the instrument, both in setting the height of the impact hammer and setting the threshold measurement level that distinguishes between delaminated and non-delaminated areas.
3.4 Conclusions Delamination measurements using impact echo testing is somewhat time consuming, taking some 30 minutes to measure a 2.75 square foot section at 1” centers. In addition the sampling points have to be marked in some way before measurements can take place. Resolution is also an issue; at 1” centers a 1” delamination could theoretically be missed. There is no convincing evidence that the any of the delaminations measured in this study grew over the period of time that they were measured.

4. FRP Pull-off Testing
4.1 Purpose The load carrying ability of FRP is related to the bonding characteristic of the epoxy to the concrete substrate, and the bonding characteristic is a function of the surface roughness of the concrete. The purpose of this test was to a) do pull-off tests of plugs glued to the surface at ½ the mean pull-off strength (intended to be a non-destructive test), and b) if the plugs failed along the concrete substrate/epoxy interface, relate the bond strength to the surface roughness.
4.2 Methodology A pull-off tester to identify bond characteristics of FRP in tension or shear mode was developed to cover the needs of this project. The tester is a portable device to measure the peak strength of FRP/Epoxy lamination in a tension or shear mode. The concept is based on a screw jack. With a selective control of moving components a tension or shear stress in bonding between FRP/Epoxy and concrete surfaces can be developed. With slight modification, this device can be used to develop combined tension and shear to test the bonding effect under more complex stresses. In these applications, the calibration curve of the sensor is converted to read the actual sensor load with compensation for friction between moving parts. To simplify the use of a pull-off tester, it was decided to separate the shear and tension modes of operation. The device used in a shear mode is shown in Figure 4.1, and the use of the pull-off tester in a tensile mode is shown in Figure 4.2. Initially the FRP installation around the laminated plug was isolated by cutting through it with a hole saw. The procedure was modified to without the cutout, so that if no bond failure occurred, the integrity of the FRP reinforcement would not be compromised. Tests showed that at least for the pull-off test, this was a feasible solution.
Figure 4.1: Pull-off tester used in a shear mode.
Figure 4.2: The pull-off tester used in a tensile mode.
A total of 45 plugs were installed. Plug plan locations and corresponding concrete surface roughness are shown in Figure 4.3, and in Appendix 3 with corresponding underlying surface roughness. The installation process is shown in Figure 4.4.
17

S
N
1
23
4
5”5”5”5”
7”
7”7”
8”
7”
14”
14”
31”8”
37”
37”
6”28”
1 2 3 4 5 6 7
1 2 3 4 5 6 71 2 3 4 5 6 7
1 2 3 4 5 6 7
Row
Row
1 2
3 4
5 6
7 8
9 10
11 12
13 14
15 16
17
1 2
3 4
5 6
7 8
9 10
11 12
13 14
15 16
1 2
3 4
5 6
7 8
9 10
11 12
13 14
15
1 2
3 4
5 6
7 8
9 10
11 12
13 14
8”
8”8”
8” 7” 7”8”
8”
8”8”
8”
Figure 4.3: Location of pull-off plugs.
18
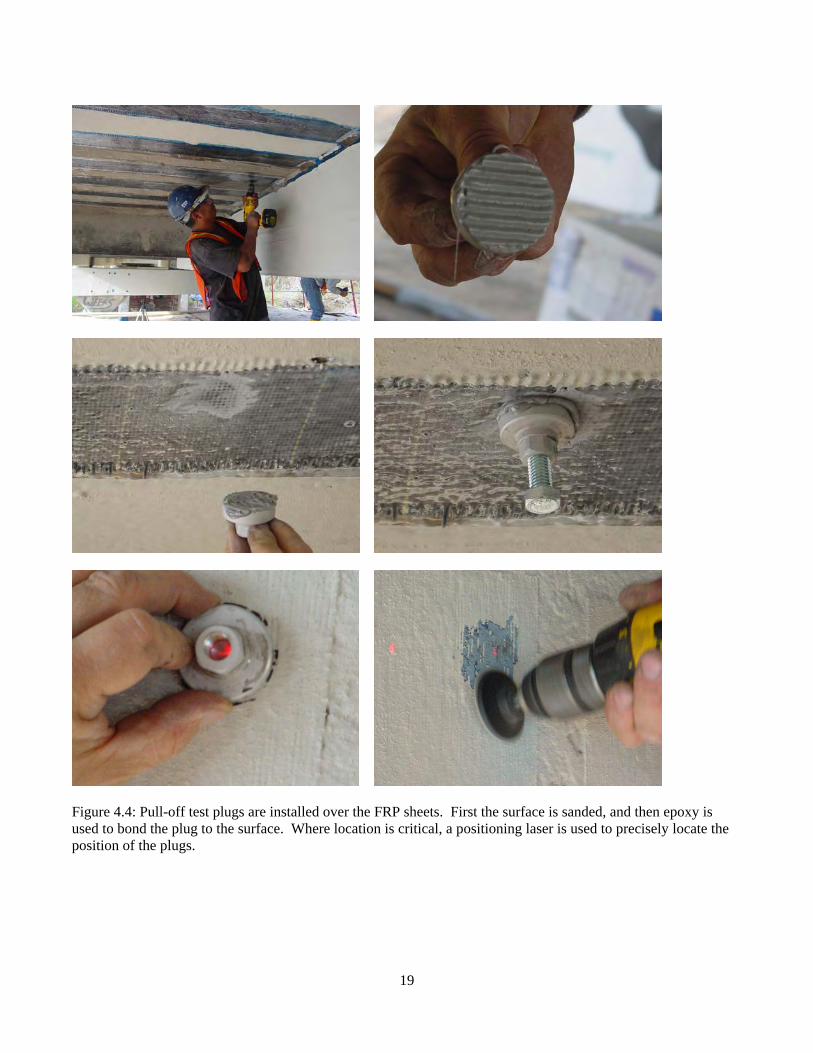
Figure 4.4: Pull-off test plugs are installed over the FRP sheets. First the surface is sanded, and then epoxy is used to bond the plug to the surface. Where location is critical, a positioning laser is used to precisely locate the position of the plugs.
19

To determine an appropriate test load rate about 20 plugs were laminated to FRP test sections in non-critical areas and were pull tested to failure. The average pull-off value was 450 in-lbs of torque on the instrument. For subsequent tests, the maximum pull-off force applied was one-half of that load or up to 225 in-lbs. Figure 4.5 shows a test being conducted. If failure occurred, the failure load was recorded and the failure mechanism. As many of the plugs that did fail did so along the FPR/covering epoxy layers, during early test the failed area was tested using the impact echo tester to determine whether or not delamination between the concrete substrate and FRP also may have occurred (Figure 4.6). In every case checked this did not happen.
Figure 4.5: Pull-off test on the deck plugs.
Figure 4.6: Impact echo test on the deck failed plug location.
4.3 Results The expectations for these tests were that a) Because we were loading at low stress, most of the plugs would not fail, and b) Those that would fail might fail along the concrete substrate/FPR interface. Both expectations proved incorrect, as the majority of the plugs failed over time, and the majority of the plugs failed at the contact between the FPR/overlying epoxy. In reality 38 of the plugs failed during the operation (Figure 4.7). On the first visit 5 of the 14 plugs tested in one section of the bridge failed. Ultimately 12 of the fourteen plugs failed in that section, some as late as 4 years later and as many as 4 tests where the plugs did not fail. Similarly over the entire bridge 38 out of 45 plugs ultimately failed, some only after considerable time and multiple tests.
20

Figure 4.7: Pull-off plug failures and dates
21

The mode (place) of failure was also unexpected. The original expectation was that these plugs would fail either at the concrete FPR interface or at the surface of the plug. In reality neither of these occurred. Figure 4.8 shows the failed plugs. The possible modes of failure are:
Separation at the plug bond Separation at the top coat of epoxy over FRP Middle of FRP FRP/Concrete Substrate interface Concrete failure Composite failure
Of the 35 failed plugs depicted in Fig. 4.8, 2 show separations at the plug bond (Figure 4.9), 20 show separation at the top coat of epoxy over FRP (Figure 4.10), and 13 plugs show composite failure (Figure 4.11) that start either at the plug bond or top coat of epoxy (outside of the plug) and propagate into concrete substrate (in the center of the plug). (During the relocation to the storage room, five of the failed plugs went missing.)
• • • • • •
Figure 4.8: Failed pull-off plugs.
22

Figure 4.9: Example of separation at the plug bond.
Figure 4.10: Example of separation at the top coat of epoxy. (Note that the texture is the impression of the FRP fibers, and not the fibers themselves).
Figure 4.11: Example of composite separation, starting at the top coat of epoxy and extending into the concrete.
23

24
4.4 Conclusions From these tests two important conclusions can be reached: In not one single case was failure initiated along the concrete substrate/FRP interface. This indicates that surface preparation was adequately done, and the epoxies used performed well enough to say that the prepared surface roughness was not a factor in the performance of these. Indeed the evidence shows that in many cases the concrete substrate/FRP interface is stronger than the concrete itself. The surface coating of epoxy may degrade over time. Many plugs failed the second, third, or fourth time they were tested, over a period of up to four years. In each case the plugs were loaded to the same level. The majority of the plugs eventually failed, even though they were loaded only to 50% of the average stress at failure of the 20 original sacrificial test plugs. The epoxy was not exposed to UV, as the materials were installed on the underside of the bridge, and locally the epoxy was protected by the plugs themselves. The only alternative explanation is that repeated loading weakened the strength of the materials. Although this turned out to be destructive testing, the bridge remediation was not compromised because the number of FRP strips applied in this section was double the design requirement.

25
5. Acknowledgements This work has been supported by a grant from the Missouri Department of Transportation and the University Transportation Center at Missouri S&T. The industry members of the NSF I/U CRC also based at Missouri S&T have been responsible for supplying materials and construction. FRP sheets with woven tracer fibers were provided by Sigmatex High Technology Fabrics.

26
6. References (1) Nanni, A. Fiber-Reinforced-Plastic (FRP) Reinforcement for Concrete Structures: Properties and Applications. Developments in Civil Engineering, Vol. 42, 1993, 450 pp. (2) Nanni, A., and Dolan, C. W. FRP Reinforcement for Concrete Structures. In Proc., ACI SP-138, American Concrete Institute, 1993, 977 pp. (3) Nanni, A., Alkhrdaji, T., Chen, G., Barker, M., Yang, X., and Mayo, R., 1999. Testing to Failure Program for a Highway Bridge Strengthened with FRP composites. Selected Presentation Proc., 4th International Symposium on FRP for Reinforcement of Concrete Structures (FRPRCS4), Baltimore, MD, Nov. 1999, pp. 69-80. (4) Tumialan, G., Tinazzi, D., Myers, J., Nanni, A. Field Evaluation of Unreinforced Masonry Walls Strengthened with FRP Composites Subjected to Out-of-Plane Loading, Advanced Technology in Structural Engineering - ASCE 2000 Structures Congress Proceedings, Philadelphia, PA, 2000, PDF40492-046-004, pp. 1-14. (5) Huang, P., Myers, J., Nanni, A. Dapped-End Strengthening in Precast Concrete Double Tee Beams with FRP Composites, Proc., 3rd Inter. Conf. on Advanced Composite Materials in Bridges and Structures, J. Humar and A.G. Razaqpur, Editors, Ottawa, Canada, 15-18 Aug. 2000, pp. 545-552. (6) Raghu, A., Myers, J., Nanni, A. An Assessment of In-Situ FRP Shear and Flexural Strengthening of Reinforced Concrete Joists, Advanced Technology in Structural Engineering - ASCE-2000 Structures Congress Proceedings, Philadelphia, PA, 2000, PDF40492-046-005, pp. 1-14. (7) (7) Schiebel, S., R. Parretti, A. Nanni, and M. Huck, Strengthening and Load Testing of Three Bridges in Boone County, MO,”ASCE Practice Periodical on Structural Design and Construction, Nov. 2002, Vol. 7, No. 4, pp 156-163. (8) Nanni, A., North American Design Guidelines for Concrete Reinforcement and Strengthening Using FRP: Principles, Applications, and Unresolved Issues, Construction and Building Materials, Vol. 17, No. 6-7, Sept.-Oct. 2003, pp. 439-446. (9) Crasto, A., Kim, R. Y., Fowler, C., and Mistretta, J.P. Rehabilitation of Concrete Bridges Beams with Externally Bonded Composite Plates, Part 1. In Proceeding of the 1st International Conference on Composites in Infrastructure (ICCI096), Tucson, Arizona, 1996, pp. 857-869. (10) Miller, B. Bond Between Carbon Fiber Reinforced Polymer Sheets and Concrete. M.Sc. Thesis, Department of Civil Engineering, University of Missouri-Rolla, 1999. (11) Shen, X. Effect of Surface roughness and Putty Thickness on the Bond Performance of FRP Laminates. M.Sc. Thesis, Department of Civil Engineering, University of Missouri-Rolla, 2002. (12) Jeffries, J. Bond Behavior Of Fiber Reinforced Polymer Laminates To Concrete Subjected To Varied Surface Preparation. M.Sc. Thesis, Department of Civil Engineering, University of Missouri-Rolla, 2004. (13) Matana, M., Galecki, G., Maerz, N, and Nanni, A. Concrete substrate preparation and characterization prior to adhesion of externally bonded reinforcement. Proceedings of the International Symposium on Bond Behavior of FRP in structures, 7pp, 2005 (14) Maerz, N. H., Chepur, P, Myers, J., J., and Linz, J. Concrete roughness measurement using laser profilometry for fiber reinforced polymer sheet application. Transportation Research Record, no, 1775, 2001, pp. 132-139, 2000. (15) Schmaltz G., 1936. Technishe Oberflächenkunde. Springer, Berlin, 286 pp (16) Yang, C., A. Nanni, and L. Dharani, "Effect of Fiber Misalignment on FRP Laminates and Strengthened Concrete Beams," 9th Int. Conf., Structural Faults and Repair, London, UK, July 4-6, 2001, M.C. Forde, Ed., Engineering Technics Press, CD_ROM version, 10 pp.

Appendix 1: Bridge Deck Roughness Measurements
S
N
1
23
4
5”5”5”5”
7”
7”7”
8”
7”
14”
14”
31”8”
37”
37”
6”28”
1 2 3 4 5 6 7
1 2 3 4 5 6 71 2 3 4 5 6 7
1 2 3 4 5 6 7
Row
Row
1 2
3 4
5 6
7 8
9 10
11 12
13 14
15 16
17
1 2
3 4
5 6
7 8
9 10
11 12
13 14
15 16
1 2
3 4
5 6
7 8
9 10
11 12
13 14
15
1 2
3 4
5 6
7 8
9 10
11 12
13 14
8”
8”8”
8” 7” 7”8”
8”
8”8”
8”
Grid on bridge deck.
27

5”
7”7”1 2
3 4
5 6
7 8
9 1
0 11
12
13 1
4 15
16
17 8” 7”
31”8”
1 2 3 4 5 6 7
1 2 3 4 5 6 7
7.5 7.3 7.5 9.0 7.9 8.8 8.2
12.2 7.6 7.6 7.9 9.4 8.8 10.2
8.0 7.6 7.5 8.1 7.4 9.3 8.2
7.1 7.0 8.0 7.5 9.3 8.2 9.5
7.6 8.7 8.4 7.1 7.9 7.7 7.0
6.9 7.4 4.6 6.8 9.2 10.7 9.0
6.8 7.3 7.8 7.2 7.1 8.5 8.2
7.7 7.1 7.1 7.2 8.8 8.0 9.1
10.5 9.4 7.8 8.9 7.8 9.6 8.4
9.9 10.6 10.7 10.1 7.3 7.2 7.5
9.1 6.6 8.3 7.9 6.9 8.6 7.7
7.1 7.7 7.4 7.7 7.7 8.8 8.0
7.3 8.0 7.2 8.8 7.3 7.7 6.7
6.9 7.5 7.5 9.7 7.3 7.5 7.0
9.4 7.7 7.9 7.6 7.6 6.9 8.2
7.1 8.1 8.6 7.4 7.3 6.9 8.4
6.7 6.4 8.3 0.4 8.5 7.7 7.2
Deck area 1. Roughness matrix, Ia, (Micro-average inclination angle)
28

5”8”
14”37”
1 2
3 4
5 6
7 8
9 1
0 11
12
13 1
4
8”
8”
1 2 3 4 5 6 7
8.6 9.3 8.5 7.6 8.4 8.1 8.2
8.6 7.8 7.4 7.4 7.4 10.7 8.4
7.7 9.3 7.7 8.1 9.1 8.6 8.4
6.6 8.4 8.2 9.2 11.3 11.6 8.5
7.2 8.6 7.7 7.4 8.0 8.8 7.8
9.1 8.3 8.2 10.0 7.7 8.1 7.7
8.5 9.1 7.7 10.7 8.3 9.8 8.3
9.3 9.9 7.6 10.2 10.0 8.3 6.8
8.7 8.2 5.9 7.9 8.7 8.3 7.7
9.7 8.4 9.0 8.1 9.1 7.4 9.5
8.7 9.2 8.6 8.5 8.8 7.5 7.2
8.2 7.9 10.2 8.5 7.3 7.5 7.9
8.3 8.1 8.6 10.8 11.2 7.7 8.1
8.6 8.0 9.3 9.6 8.0 7.5 6.6
Deck area 2. (Micro-average inclination angle)
29

5”
7”
1 2
3 4
5 6
7 8
9 1
0 11
12
13 1
4 15
16
8”8”
8”
14”37”
1 2 3 4 5 6 7
1 2 3 4 5 6 7
8.6 9.2 8.6 8.9 8.1 8.5 8.3
8.6 9.1 9.6 8.4 9.1 8.9 8.0
8.1 8.1 8.9 8.8 8.1 9.1 9.0
8.7 8.8 8.0 7.7 9.4 8.6 7.5
8.7 8.4 9.0 8.8 8.4 8.7 7.7
8.7 9.1 9.2 8.9 8.2 8.9 6.9
8.3 8.8 11.2 8.1 8.3 8.8 8.1
8.9 9.5 10.8 10.1 6.6 8.3 8.1
6.9 8.8 8.9 8.9 6.9 9.2 7.9
8.9 9.4 6.6 9.1 7.9 9.0 7.4
7.0 6.2 8.0 7.4 10.0 9.0 6.5
6.3 7.2 6.9 7.1 6.7 6.7 5.7
6.3 6.0 6.1 5.8 6.4 6.6 6.7
7.3 6.5 6.4 7.7 7.1 6.8 6.8
9.9 7.8 6.6 6.9 7.1 7.2 7.6
6.1 7.3 7.0 4.8 7.2 6.6 6.8 Deck area 3. (Micro-average inclination angle)
30

5”
7”6”
28”
1 2
3 4
5 6
7 8
9 1
0 11
12
13 1
4 15
7”8”
8”
1 2 3 4 5 6 7
1 2 3 4 5 6 7
6.5 7.5 7.0 8.1 7.2 7.0 6.3
6.7 8.0 8.3 6.3 6.9 7.6 6.9
4.4 7.7 7.9 6.6 8.4 7.0 7.1
7.1 7.3 7.2 8.0 7.4 6.7 6.5
6.4 6.1 6.7 6.5 7.0 5.6 8.3
5.1 7.3 8.2 6.7 7.3 6.9 7.2
7.6 7.0 7.9 6.5 7.0 7.5 5.7
8.5 8.0 8.7 6.4 6.9 9.2 7.3
8.9 9.0 7.4 6.2 8.5 8.0 7.7
7.5 9.3 8.0 6.3 7.6 8.0 7.3
7.1 9.7 8.4 7.0 6.8 9.1 8.0
9.3 8.5 7.9 9.6 8.7 9.1 6.9
8.3 8.1 9.9 7.2 9.0 6.8 8.4
8.1 8.0 9.2 8.2 8.3 10.0 8.4
8.8 8.5 7.9 7.4 7.2 9.8 9.0
Deck area 4. (Micro-average inclination angle)
31

Appendix 2: Results of Impact Echo Testing for Delaminations
Panel 1.
Panel 2.
32

Panel 3.
Panel 4.
Panel 5.
Panel 6.
33

Panel A.
Panel B.
Panel C.
Panel D.
34

Appendix 3: Pull-Off Test locations (plugs installed in locations selected to cover a range of substrate roughnesses)
5”
7”7”
31”8”
1 2
3 4
5 6
7 8
9 1
0 11
12
13 1
4 15
16
17 8” 7”
1 2 3 4 5 6 7
7.5 7.3 7.5 9.0 7.9 8.8 8.2
12.2 7.6 7.6 7.9 9.4 8.8 10.2
8.0 7.6 7.5 8.1 7.4 9.3 8.2
7.1 7.0 8.0 7.5 9.3 8.2 9.5
7.6 8.7 8.4 7.1 7.9 7.7 7.0
6.9 7.4 4.6 6.8 9.2 10.7 9.0
6.8 7.3 7.8 7.2 7.1 8.5 8.2
7.7 7.1 7.1 7.2 8.8 8.0 9.1
10.5 9.4 7.8 8.9 7.8 9.6 8.4
9.9 10.6 10.7 10.1 7.3 7.2 7.5
9.1 6.6 8.3 7.9 6.9 8.6 7.7
7.1 7.7 7.4 7.7 7.7 8.8 8.0
7.3 8.0 7.2 8.8 7.3 7.7 6.7
6.9 7.5 7.5 9.7 7.3 7.5 7.0
9.4 7.7 7.9 7.6 7.6 6.9 8.2
7.1 8.1 8.6 7.4 7.3 6.9 8.4
6.7 6.4 8.3 0.4 8.5 7.7 7.2
Deck area 1. Location of pull-off plugs, with corresponding underlying roughness, Ia, (Micro-average inclination angle).
35

5”8”
14”37”
1 2
3 4
5 6
7 8
9 1
0 11
12
13 1
4
8”
8”8”
1 2 3 4 5 6 7
8.6 9.3 8.5 7.6 8.4 8.1 8.2
8.6 7.8 7.4 7.4 7.4 10.7 8.4
7.7 9.3 7.7 8.1 9.1 8.6 8.4
6.6 8.4 8.2 9.2 11.3 11.6 8.5
7.2 8.6 7.7 7.4 8.0 8.8 7.8
9.1 8.3 8.2 10.0 7.7 8.1 7.7
8.5 9.1 7.7 10.7 8.3 9.8 8.3
9.3 9.9 7.6 10.2 10.0 8.3 6.8
8.7 8.2 5.9 7.9 8.7 8.3 7.7
9.7 8.4 9.0 8.1 9.1 7.4 9.5
8.7 9.2 8.6 8.5 8.8 7.5 7.2
8.2 7.9 10.2 8.5 7.3 7.5 7.9
8.3 8.1 8.6 10.8 11.2 7.7 8.1
8.6 8.0 9.3 9.6 8.0 7.5 6.6
Deck area 2. Location of pull-off plugs, with corresponding underlying roughness, Ia, (Micro-average inclination angle).
36

5”
7”
14”37”
1 2
3 4
5 6
7 8
9 1
0 11
12
13 1
4 15
16
8”8”
8”
1 2 3 4 5 6 7
8.6 9.2 8.6 8.9 8.1 8.5 8.3
8.6 9.1 9.6 8.4 9.1 8.9 8.0
8.1 8.1 8.9 8.8 8.1 9.1 9.0
8.7 8.8 8.0 7.7 9.4 8.6 7.5
8.7 8.4 9.0 8.8 8.4 8.7 7.7
8.7 9.1 9.2 8.9 8.2 8.9 6.9
8.3 8.8 11.2 8.1 8.3 8.8 8.1
8.9 9.5 10.8 10.1 6.6 8.3 8.1
6.9 8.8 8.9 8.9 6.9 9.2 7.9
8.9 9.4 6.6 9.1 7.9 9.0 7.4
7.0 6.2 8.0 7.4 10.0 9.0 6.5
6.3 7.2 6.9 7.1 6.7 6.7 5.7
6.3 6.0 6.1 5.8 6.4 6.6 6.7
7.3 6.5 6.4 7.7 7.1 6.8 6.8
9.9 7.8 6.6 6.9 7.1 7.2 7.6
6.1 7.3 7.0 4.8 7.2 6.6 6.8
Deck area 3. Location of pull-off plugs, with corresponding underlying roughness, Ia, (Micro-average inclination angle).
37

5”
7”6”
28”
1 2
3 4
5 6
7 8
9 1
0 11
12
13 1
4 15
7”8”
8”
1 2 3 4 5 6 7
6.5 7.5 7.0 8.1 7.2 7.0 6.3
6.7 8.0 8.3 6.3 6.9 7.6 6.9
4.4 7.7 7.9 6.6 8.4 7.0 7.1
7.1 7.3 7.2 8.0 7.4 6.7 6.5
6.4 6.1 6.7 6.5 7.0 5.6 8.3
5.1 7.3 8.2 6.7 7.3 6.9 7.2
7.6 7.0 7.9 6.5 7.0 7.5 5.7
8.5 8.0 8.7 6.4 6.9 9.2 7.3
8.9 9.0 7.4 6.2 8.5 8.0 7.7
7.5 9.3 8.0 6.3 7.6 8.0 7.3
7.1 9.7 8.4 7.0 6.8 9.1 8.0
9.3 8.5 7.9 9.6 8.7 9.1 6.9
8.3 8.1 9.9 7.2 9.0 6.8 8.4
8.1 8.0 9.2 8.2 8.3 10.0 8.4
8.8 8.5 7.9 7.4 7.2 9.8 9.0
Deck area 4. Location of pull-off plugs, with corresponding underlying roughness, Ia, (Micro-average inclination angle).
38

Missouri Department of Transportation Organizational Results P. O. Box 270 Jefferson City, MO 65102
573.526.4335 1 888 ASK MODOT [email protected]