presented by: jamie nicol, chief investment officer november 2013 the advice exchange market review
TRANSCRIPT

Presented By: Jamie Nicol, Chief Investment Officer
November 2013
The Advice Exchange Market Review

Market Overview
2
Review of potential major risks
Valuations
Review of major opportunities
Portfolio positioning
Major new purchases
Active share
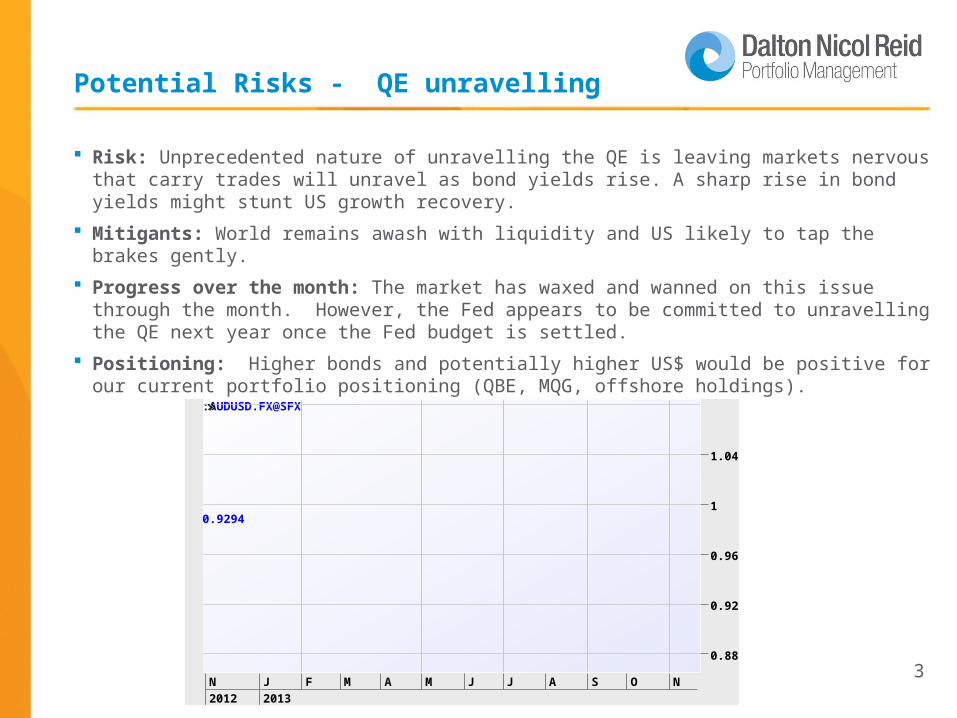
Potential Risks - QE unravelling
3
Risk: Unprecedented nature of unravelling the QE is leaving markets nervous that carry trades will unravel as bond yields rise. A sharp rise in bond yields might stunt US growth recovery.
Mitigants: World remains awash with liquidity and US likely to tap the brakes gently.
Progress over the month: The market has waxed and wanned on this issue through the month. However, the Fed appears to be committed to unravelling the QE next year once the Fed budget is settled.
Positioning: Higher bonds and potentially higher US$ would be positive for our current portfolio positioning (QBE, MQG, offshore holdings).
N2012
J2013
F M A M J J A S O N
:AUDUSD.FX@SFX
0.9294
0.88
0.92
0.96
1
1.04

Potential Risks - US Budget Resolution
4
Risk: US Government remains in gridlock regarding the appropriate response to reign in their fiscal deficit. Threats of Government shutdown undermines confidence.
Mitigants: Surely a practical solution will be reached?
Progress over the month: No further progress on this issue and unlikely to be so until January.
Positioning: Short term volatility around this issue could cause difficulties for markets and some of our holdings but ultimately we expect a solution to be found.

Potential Risks - Chinese Growth
5
Risk: A range of issues threaten Chinese growth rates – housing bubble, excess debt, ageing population, corruption.
Mitigants: Government working through solutions to these issues.
Progress over the month: Reforms announced including adjustments to the One Child policy, land rights for farmers and Local Governments to sell bonds to drive greater transparency over their debt.
Positioning: Mild overweight to the major resource companies on expectations cost cutting will improve returns for shareholders.

Valuations
6
Slight pullback in the market this month of 2.5% is a healthy correction following the strong year.
Bank dividends to be paid in December will provide further liquidity.
Market is now trading at 15.1x remains fair to full.
But remains cheap relative to low interest rates.
Future growth to be driven by earnings

Growth drivers: Australian Housing
7
Opportunity: Housing activity is accelerating. Affordability has improved thanks to low interest rates and smaller lot sizes. Reduced Government regulation is accelerating development.
Progress through the month: Lend Lease announced a 20% increase in house sales. Stocklands saw largest uptick in sales for three years in the September quarter. Dulux noted a pick up in trade sales.
Portfolio Positioning: High quality companies with exposure to improvement in house sales – Dulux, Stocklands and Lend Lease.
RP Data Month on Month City Home Values

8
Growth drivers: Funds Flow and Equity
Market Activity
Opportunity: An increase in equity flows has coincided with improvement in global growth, an increased risk appetite and an increased likelihood of QE ending.
Progress through the month: Henderson’s noted they received GBP1.2b in net retail inflows in the first quarter compared to broker expectations of around GBP200m and activity levels are clearly picking up. Numerous new IPO’s is positive for Macquarie.
Portfolio Positioning: Henderson’s and Macquarie Bank.

9
Growth drivers: Global Growth
Opportunity: Global growth is showing signs of improvement and earnings will benefit from any potential pullback in the currency.
Progress through the month: Mixed month – confidence following US shut down took a hit but US ISM continues to expand, US non farm payrolls were strong,
Portfolio Positioning: High quality companies with exposure to offshore growth – Brambles, Amcor, Fox
US ISM

Broad Portfolio Positioning
10
Offshore plays (AMC, BXB, FOX, TWE, QBE).
Rotation out of bonds into equities (HGG, MQG, QBE).
Underweight defensive companies (WOW, TLS, Utilities, banks).
Domestic housing related stocks (LLC, SGP, DLX).
Sustainable growth stocks (TME, SEK, CWN, SHL, AZJ, AIO).
Data has been more supportive for resources (RIO, BHP, WPL).

Treasury Wines
11
Thesis: Signs the grape glut may be on the verge of easing as uneconomic producers exit the market and demand picks up. Brands continue to gain in market strength especially in Australia and worst behind it in the US. Further it is one of the best plays on the growing strength of the Chinese consumer.
Valuation: USA business may be sold and may be worth more from selling the assets then operating them. Intrinsic value of inventory as higher quality vintages are held on to longer.
0
1
2
3
4
5
IndustryStructure
Balance SheetStrength
EarningsStrength
ESG Score
ManagementScore
TWE ASX 200
Cumulative Present Value of Cash Flows 3,474
Add : Market Value of I nvestments 0 Less : Net debt/ (net cash) including options in the money 36 Equity Value 3,438 Number of ordinary shares outstanding 647 Intrinsic per Share Value (pre Imputation Credits) 5.31 Value of I mputation Credits per Share 0.48 Base case valuation 5.80 Risk adjusted option value 0.00 INTRINSIC PER SHARE VALUE $5.80
Industry Structure

12
Origin Energy
Thesis: Market concerned around capital expenditure blowouts on its APLNG project well reflected in the current share price. Costs pressures easing and project economics strong. Competitive dynamics in retail improving.
Quality: Vertically integrated retailer with leading LNG project supported by strong gas reserves and management. Entered stock once debt refinanced reducing capital raising risk.
Valuation: DCF of APLNG Project, stress testing for project delays and capex blowouts. Factoring 20% capex blowout still showed strong project metrics
Enterprise Value 30,168 Project Debt 8,500 Equity Value 21,668 ORG 37.5% Interest 8,125
Shares Outstanding 1,090
Value per share $ 7.45
Train 1 Startup 1/07/2015
Train 2 Startup 1/07/2016
Train 1 Capacity (mtpa) 4.5
Train 2 Capacity (mtpa) 4.5
Train 1 Project Life 20.0
Train 2 Project Life 20.0
Capex
Total Project Capex ($A Million) $ 24,700
Spend to 30 June 13 $ 12,497
Remaining Capex $ 12,203
Capex Blowout 20.0%
Updated Capex for blowout $ 14,644
APLNG Key Assumptions: Origin Sum of Parts: ORGPE Utility business 12.0xFY14 EPS 0.746Underlying value $9.0Valuation of APLNG $7.5Target Price $16.5 Current Share Price $14.4
Upside/(Downside) 14.6%
Industry Structure
Balance Sheet Strength
Earnings StrengthESG Score
Management Score
0
5
Origin ASX 200 Average

Wesfarmers
Thesis. Purchases for the Income portfolio on the basis that it has a sustainable growing dividend. Furthermore the wealth effect from improved housing values and share portfolios should result in solid improvements for the retail businesses – Bunnings, Coles, Target, Kmart.
Valuation. Strong sustainable dividend yield of 5.1% fully franked.
Industry Structure
Balance Sheet Strenght
Earnings StrengthESG Score
Management Score
0
5
TME ASX 200
13
Balance Sheet Strength

14
Active Share
Active Share 66% - top 5-10% of concentrated managers.
But tracking error of 4% is below average suggesting we are a diversified stock picker with good ability to deliver excess return on a consistent basis

15
Australian Equities High Conviction portfolioAnnualised Performance as at 31 October 2013
Please note: Past performance is not an indication of future performance. No allowance has been made for taxation and fees are not taken into account
1 Yr 2 Yrs 3 Yrs 4 Yrs 5 Yrs 6 Yrs 7 Yrs 8 Yrs 9 Yrs 10 Yrs% % p.a. % p.a. % p.a. % p.a. % p.a. % p.a. % p.a. % p.a. % p.a.
Dalton Nicol Reid 35.7% 22.5% 15.8% 12.4% 15.4% 5.8% 8.8% 11.2% 12.6% 13.9%Benchmark 25.5% 17.6% 10.1% 8.7% 11.1% 0.9% 4.6% 7.1% 8.8% 9.9%Outperformance 10.2% 4.9% 5.7% 3.7% 4.3% 4.9% 4.2% 4.1% 3.8% 4.0%
Tracking Error 4.5 4.4 3.9 3.8 3.9 4.8 4.7 5.1 5.0 4.9Information Ratio 2.3 1.1 1.5 1.0 1.1 1.0 0.9 0.8 0.8 0.8
Since Inception date October 2002
Blue data shows Positive Out-Performance
Benchmark: S&P /ASX 200 Accumulation Index

16
Australian Equities Socially Responsible portfolioAnnualised Performance as at 31 October 2013
Please note: Past performance is not an indication of future performance. No allowance has been made for taxation and fees are not taken into account
1 Yr 2 Yrs 3 Yrs 4 Yrs 5 Yrs 6 Yrs 7 Yrs% % p.a. % p.a. % p.a. % p.a. % p.a. % p.a.
Dalton Nicol Reid 34.5% 23.0% 15.9% 11.4% 14.6% 5.7% 9.4%Benchmark 25.5% 17.6% 10.1% 8.7% 11.1% 0.9% 4.6%Outperformance 9.0% 5.4% 5.8% 2.7% 3.5% 4.8% 4.8%
Tracking Error 4.4 4.3 4.0 4.0 4.1 5.0 5.2Information Ratio 2.1 1.2 1.5 0.7 0.9 1.0 0.9
Since Inception date J une 2006
Benchmark: S&P /ASX 200 Accumulation Index
Blue data shows Positive Out-Performance

17
Australian Equities Income portfolioAnnualised Performance as at 31 October 2013
Please note: Past performance is not an indication of future performance. No allowance has been made for taxation and fees are not taken into account
1 Yr 2 Yrs 3 Yrs 4 Yr 5 Yr% % p.a. % p.a. % %
Dalton Nicol Reid 39.3% 29.3% 20.3% 13.8% 15.1%Benchmark 32.8% 26.3% 16.5% 12.3% 13.4%Outperformance 6.5% 3.0% 3.8% 1.5% 1.7%
Tracking Error 4.8 4.5 4.0 4.0 4.1Information Ratio 1.4 0.7 1.0 0.4 0.4Benchmark: S&P /ASX 200 Industial Index
Since Inception date December 2007
Blue data shows Positive Out-Performance

18
Disclaimer
SOURCES:GoldmanSachsMacquarie BankDeutsche BankMorgan StanleyUBSIRESSBloomberg
DISCLAIMERIMPORTANT NOTE: While every care has been taken in the preparation of this material, DNR AFSL Pty Ltd (ABN 39 118 946 400, an Australian Financial Services Licensee, License Number 301658), makes no representation or warranty as to the accuracy or completeness of any statement in it including, without limitation, any forecasts.
This material has been prepared for the purpose of providing general information without taking account of any particular investor’s objectives, financial situation or needs. An investor should, before making any investment decisions, consider the appropriateness of the information in this material, and seek professional advice, having regard to the investor’s objectives, financial situation and needs.
Dalton Nicol Reid expressly disclaims any responsibility or liability to anyone who acts or relies upon anything contained in, or omitted from, this material.
Past performance is not indicative of future performance.