presented at montana state university february 10, 2012 health disparities and the stress hypothesis...
TRANSCRIPT
Presented at Presented at Montana State Montana State
UniversityUniversity
February 10, 2012 February 10, 2012
Health Disparities and the Stress Hypothesis
R. Jay Turner, Ph.DVanderbilt University

Stress Process Model

Retrospective self-report, computer assisted personal interviews
DSM-IV CIDI diagnoses: major depression,
dysthymia, GAD, social phobia, panic disorder, alcohol abuse and dependence, drug abuse and dependence, PTSD, and antisocial personality disorder.
PLUS attention deficit and hyperactive disorder and Childhood conduct disorder from the Diagnostic Interview schedule.

.00
.01
.02
.03
.04
.05
.06
0 1 2 3 4 5 6 7 8 9 10
Co
nd
itio
nal
Pro
bab
ilit
y o
f D
epen
den
ce
Cumulative Adversities
Cumulative Adversity and Drug Dependence at Age 18
Non-Hispanic White Cuban Non-Cuban Hispanic African American

.0000
.0100
.0200
.0300
.0400
.0500
.0600
.0700
1 2 3 4 5 6 7 8 9 10 11 12 13
Cond
ition
al P
roba
bilit
y of
Dep
ende
nce
Cumulative Adversity Count
Cumulative Adversity and Alcohol Dependence at age 18
Series1 Series2 Series3 Series4

FIGURE 3 - DSM-IV Disorder Conditional Onset Risk by Cumulative Exposureto Adversities among Community-dwelling Young Adults
.00
.01
.02
.03
.04
.05
.06
0 1 2 3 4 5 6 7 8 9 10 11 12 13 14 15
Cumulative Adversities
Est
imate
d P
rob
ab
ility
of
on
set
Drug Dependence: Whites Drug Dependence: African Americans
Psychiatric Disorder: Whites Psychiatric Disorder: African Americans

TABLE 1. Mean Standardized Scores on Stress Measures by Gender, Race/Ethnicity and Socioeconomic Level Recent Life Events Total Stress Exposure Gender Male –.075*
(.967) .063* (1.013)
Female .092 (1.033)
–.077 (.980)
Race/Ethnicity White –.092**
(.945) –.236*** (.920)
African American .112 (1.053)
.286 (1.019)
Difference = .204 Difference = .522 Socioeconomic Level Upper –.115+
(.938) –.277*** (.894)
Middle .053 (.986)
.051 (.950)
Lower .063 (1.065)
.227 (1.083)
* p<.05; ** p<.01; *** p<.001 U-L difference = .178 U-L difference = .504 Note: Numbers in parentheses are standard errors.

Gender (Female=1) 1.570 *** 1.372 *** 1.613 *** 1.241 *** 1.533 *** 1.731 *** 1.533 ***(.285) (.277) (.277) (.261) (.282) (.272) (.265)
Race/Ethnicity (African-American=1) 1.020 ** .810 ** .559 ** .337 .751 * .626 * .171(.321) (.312) (.311) (.296) (.311) (.303) (.294)
SES -.579 *** -.546 *** -.407 *** -.394 * -.494 ** -.465 ** -.312 *(.163) (.158) (.158) (.149) (.158) (.153) (.148)
Recent Life Events (past 12 months) 1.075 *** .625 *** .502 *** .927 *** .744 *** .210(.138) (.162) (.140) (.147) (.139) (.157)
Lifetime Major Events .871 *** .583 **(.172) (.195)
Chronic Stressors 1.594 *** 1.339 ***(.146) (.151)
Lifetime Major Discrimination 1.158 *** -.852(.402) (.461)
Daily Discrimination 1.231 *** .783 ***(.159) (.167)
2.456 2.637 2.653 2.934 2.624 2.582 2.872
R2 .072 *** .131 *** .155 *** .223 *** .139 *** .185 *** .262 ***Adjusted R2 .069 .127 .150 .229 .134 .181 .255
I III
Table 3. Depressive Symptoms Regressed on Status Characteristics and Five Dimensions of Stress Exposure (N = 899; 493 non-Hispanic whites and 406 African-Americans)
VIIIV V VI
Table entities represent unstandardized regression coefficient (standard errors).
Numbers of subjects prior to weighting are 466 non-Hispanic whites and 433 African-Americans.*, **, ***: p < .05, .01, .001, respectively.
II
Constant
Life Stressors
Status Characteristics


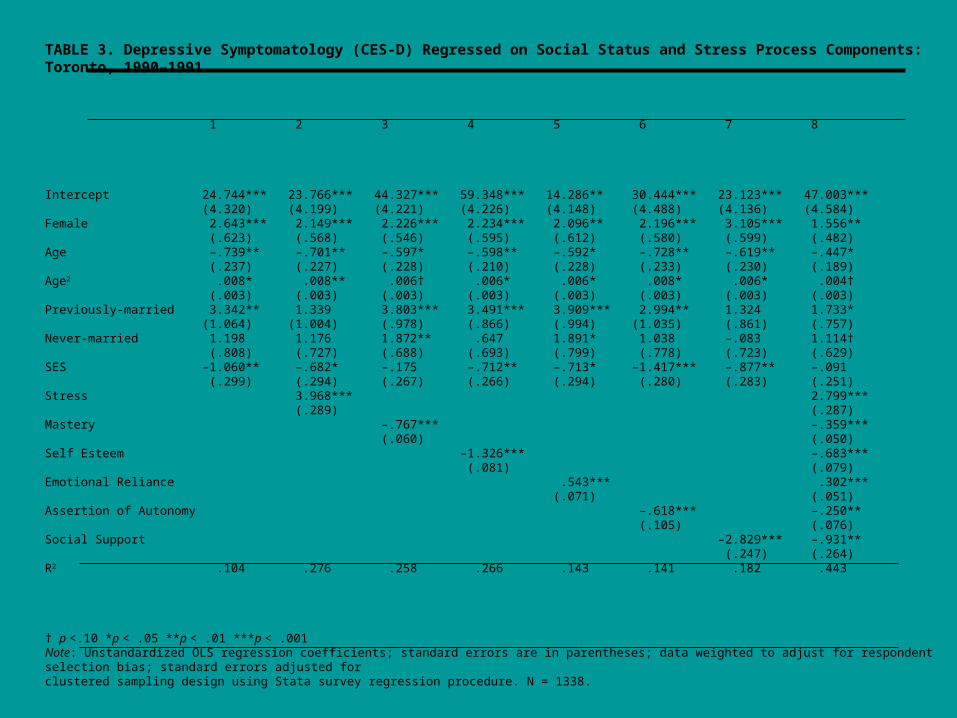
TABLE 3. Depressive Symptomatology (CES-D) Regressed on Social Status and Stress Process Components: Toronto, 1990–1991
1 2 3 4 5 6 7 8
Intercept 24.744*** 23.766*** 44.327*** 59.348*** 14.286** 30.444*** 23.123*** 47.003***(4.320) (4.199) (4.221) (4.226) (4.148) (4.488) (4.136) (4.584)
Female 2.643*** 2.149*** 2.226*** 2.234*** 2.096** 2.196*** 3.105*** 1.556**(.623) (.568) (.546) (.595) (.612) (.580) (.599) (.482)
Age –.739** –.701** –.597* –.598** –.592* –.728** –.619** –.447*(.237) (.227) (.228) (.210) (.228) (.233) (.230) (.189)
Age2 .008* .008** .006† .006* .006* .008* .006* .004†(.003) (.003) (.003) (.003) (.003) (.003) (.003) (.003)
Previously-married 3.342** 1.339 3.803*** 3.491*** 3.909*** 2.994** 1.324 1.733*(1.064) (1.004) (.978) (.866) (.994) (1.035) (.861) (.757)
Never-married 1.198 1.176 1.872** .647 1.891* 1.038 –.083 1.114†(.808) (.727) (.688) (.693) (.799) (.778) (.723) (.629)
SES –1.060** –.682* –.175 –.712** –.713* –1.417*** –.877** –.091(.299) (.294) (.267) (.266) (.294) (.280) (.283) (.251)
Stress 3.968*** 2.799***(.289) (.287)
Mastery –.767*** –.359***(.060) (.050)
Self Esteem –1.326*** –.683***(.081) (.079)
Emotional Reliance .543*** .302***(.071) (.051)
Assertion of Autonomy –.618*** –.250**(.105) (.076)
Social Support –2.829*** –.931**(.247) (.264)
R2 .104 .276 .258 .266 .143 .141 .182 .443
† p <.10 *p < .05 **p < .01 ***p < .001Note: Unstandardized OLS regression coefficients; standard errors are in parentheses; data weighted to adjust for respondent selection bias; standard errors adjusted forclustered sampling design using Stata survey regression procedure. N = 1338.


• 1. To evaluate the stress hypothesis and assess the utility of an elaborated “stress process” model for explaining race and socioeconomic position (SES) differences in health and changes in health over time, where:
• a) health status is estimated in multiple ways that address the problem of misclassification.
• b) variations in stress exposure are estimated more comprehensively than in prior research.
• c) the direct, mediating and moderation effects of an extended array of social and personal coping resources and of contextual and cultural factors are examined in the context of a) and b) above.
•

• 2. To confirm and extend epidemiological estimates of race and SEP differences in the prevalence of health problems, variously and collectively defined, while addressing the misclassification problem.
• 3. To evaluate the interrelationships of differing dimensions of health, variously estimated, and their risk significance for one another, in cross section and over time.
• 4. To describe the distribution of each risk factor identified across race, SEP, age and gender while examining antecedent factors that put individuals and groups at differential risk for acquiring such risk factors.
• 5. To obtain and preserve samples to support subsequent studies (not here proposed) on gene-environment interactions relating to factors hypothesized to be of risk or protective significance.
•

Table 1. Co-occurrence of Lifetime DSM-IV Psychiatric and Substance Dependence Disorders (No Temporal Ordering)
Substance Dependence c
N % OR e 95% CI
Comorbid Depression (Across and/or Within Category)Pure Depression
185130
47.218.5
6.8*** 1.8*
4.7 - 10.01.1 - 3.0
Comorbid PTSD (Across and/or Within Category)Pure PTSD
14065
45.020.8
7.0***2.8**
4.6 - 10.7 1.4 - 5.5
Comorbid Anxiety Disorder a 75 41.5 5.0*** 2.9 - 8.5
Pure Anxiety Disorder 22 15.0 1.3 0.4 - 3.9
Comorbid Personality Disorder b 287 43.4 6.3*** 4.5 - 8.7
Pure Personality Disorder 179 16.4 1.5†
0.9 - 2.4

Table 2. Temporally Ordered Associations between Lifetime DSM-IV Psychiatric and Substance Dependence Disorders
Substance Dependence b
N % OR d 95% CI
Comorbid Depression 162
121
39.7 5.0*** 3.3 - 7.4
Pure Depression 12.6 1.1 0.6 - 2.0
Comorbid PTSD 76 44.0 6.7*** 3.9 - 11.3
Pure PTSD 43 20.0 3.0** 1.3 - 6.9
Comorbid Anxiety Disorder a 70 37.5 4.2*** 2.4 - 7.4
Pure Anxiety Disorder 20 10.5 0.6 0.1 - 2.9

Table 4. Effects of Stress Exposure on Associations between Lifetime DSM-IV Psychiatric and Substance Dependence Disorders
Substance Dependence b
Not Ordered Ordered
OR
Comorbid Depression 2.4*** 1.5 - 3.8 1.5† 0.9 - 2.6
Pure Depression 1.2 0.6 - 2.2 0.7 0.3 - 1.4
Comorbid PTSD 1.7* 1.0 - 3.1 1.5 0.7 - 3.1
Pure PTSD 1.1 0.4 - 2.7 1.7 0.6 - 4.5
Comorbid Anxiety Disorder a 1.7 0.8 - 3.4 1.3 0.8 - 2.1
Pure Anxiety Disorder 1.3 0.4 - 4.1 0.8 0.1 - 3.6
OR d 95% CI d 95% CI