presented at asa business valuation seminar...
TRANSCRIPT

Ashok Bhardwaj Abbott
Presented at
ASA Business Valuation Seminar Philadelphia
April 20, 2012

Ashok B. Abbott is an Associate Professor of Finance at
West Virginia University in Morgantown, West Virginia.
Professor Abbott received his MBA in Finance at Virginia
Polytechnic Institute and State University (VPI&SU) in
1984, followed by a Ph.D. in finance also at VPI&SU, in
1987. His Ph.D. dissertation title was "The valuation
effects of tax legislation in corporate sell-offs".
He has published extensively in scholarly research journals
and made presentations at national and international
conferences. He serves on the editorial boards of The
Business Valuation Review and The Value examiner. The
Small Business administration recognized Professor
Abbott as the Small Business Advocate-Journalist for the
year 2002.
His focus area of research and consulting in valuation is the
level of price adjustments (discounts/premiums)
appropriate for liquidity, marketability, and control
attributes of the interests being appraised.
Professor Abbott consults for valuation divisions of well-
known firms, such as Standard & Poor's, Duff & Phelps,
Willamette Management Associates, Houlihan Valuation
Advisors, among others. He has served as an expert
witness in the business valuation arena for 15 years. You
can see his full CV at
www.be.wvu.edu/faculty_staff/cv/ashok_abbott_cv.pdf.
Size Effect Size effect, initially reported by Banz (1981) and
Reinganum (1981) has been researched extensively.
Research Indicates that smaller (measured by market value) ( Check with Roger on other measures of size)firms tend to exhibit higher returns than the levels predicted by the Sharpe Lintner capital asset-pricing model (CAPM).

Original Question by Banz
“It is not known whether size per se is responsible for the effect or whether size is just a proxy for one or more true unknown factors”.
Intersection of Size and Liquidity
Is size is just a proxy for the true unknown factor- Liquidity?

Research Questions Q1. Is there a difference in returns among smaller and
larger firms?
Q2. Is there a difference in returns among low and high liquidity firms?
Q3. Is there a difference in returns among low and high liquidity firms within each size category?

Why do we care about liquidity Recent events in the financial markets have pointed
out how much the financial system depends on the ability to trade assets continuously.
The current failures in the Auction Rate Market demonstrate what happens when the market for an asset disappears. Even in the event of no underlying default securities become non-tradable.
7

Publicly Traded Equivalent Value
Capital Asset Pricing Model (CAPM),
Ibbottson premiums, or build-up rates
using capital market proxies provide
an estimate of the publicly traded
equivalent value (“PTEV”) of a
privately held company.

Liquidity Assumptions of the Publicly Traded Equivalent Value
Finance literature recognizes four dimensions of liquidity:
Width (availability of a large number of buyers) Depth (ability to absorb large volume) Immediacy (ability to complete the transaction
quickly) Resiliency (absorbing large volume of trades without
moving the price)
Time Varying Liquidity Liquidity conditions change rapidly.
Cost of Liquidity is a function of liquidity and volatility.
Low Liquidity and high volatility combine to increase the cost of liquidity.
10
11
Characterized by infrequent shocks in which the bottom drops out of previously well functioning market.
No bids, no asks. Fire-sale pricing.
Securities suddenly become “toxic waste”.
Episodic Illiquidity
Core Issue in Liquidity :Immediacy
Assumption: Market orders have immediate execution.
Reality: Small at -the -market transactions of high trading volume public securities approach immediate execution.
Large block transactions of thinly traded public securities are likely to occur off the floor or may need to dribble out.
Substantial execution delay and Liquidity discount are relevant to asset pricing.
Liquidity and Returns in Public markets
Research shows significant difference between returns on liquid and illiquid publicly traded securities.
Brennan and Subrahmanyam (1996) show the return difference of the most liquid and least liquid shares on the New York Stock Exchange is 6.62% per year.
This difference roughly translates to a discount for lack of liquidity (DLOL) of 35.5%.

Liquidity and Asset Prices
Liquidity is Priced
Liquidity is Systemic
Liquidity varies over time
Liquidity Premium is a major factor in Asset Pricing
Measures of Liquidity Half Life
(Average Liquidation period)
Bid Ask Spread
(Ask-Bid)/Ask
Trading Cost
(Holding Return-Trading Return)
Price Impact of Trading
(Amivest ratio)

Measuring Liquidity
Liquidity Measure (l) takes in to account both the trading volume and shares outstanding. It is a natural log transformation on Turnover measure.
Given
The stock issued and outstanding at Day 1 is S1
Trading Volume for one day is V1
The stock still in hands of original owners at beginning of Day 2 is S2 = S1- V1
Assuming that the rate of deal flow is constant (l) at day 1
S2 = S1 e- l
Or l = Logn (S1) - Logn (S2)
Empirical Questions need Empirical Analysis
Data Sample Used
Centre for Research in Security Prices (CRSP) equities
Data provides
Daily Price ( High Low Close Bid Ask), Return, Volume, and Shares Outstanding among other data
Sample period 1926-2011
Covers periods of panic and Euphoria
80 Million Plus daily Observations
Three Million Plus monthly observations

Migration Issue Addressed Fama and French suggest that ‘Migration’ is a significant
issue in size based studies. Firms tend to migrate to higher size deciles following positive returns or lower deciles/ get delisted following negative returns.
We form Portfolios based on MONTHLY levels of market value and liquidity. Firms with IPO or delisting during the month are excluded from the sample. This results in reassigned monthly portfolios.

Removing Outlier Effect
The data used in this analysis are winsorized at 1% level.
Values above the 99th percentile value are set to the 99th percentile value.
Values below the 1st percentile value are set to the 1st percentile value.

Markets are Self Synchronizing
Observed synchronization between the measures of
Liquidity
Volatility
Market Returns

Mean Half Life Months Index : 1926 January = 100
0
100
200
300
400
500
600
700
800
900
1
22 43
64 85
106
127
148
169
190
211
232
253
274
295
316
337
358
379
40
0
421
44
2
46
3
48
4
505
526
547
568
589
610 631
652
673
69
4
715
736
757
778
799
820 84
1
86
2
88
3
90
4
925
94
6
96
7
98
8
100
9
Mean half Life Index
HLFMeanIndex
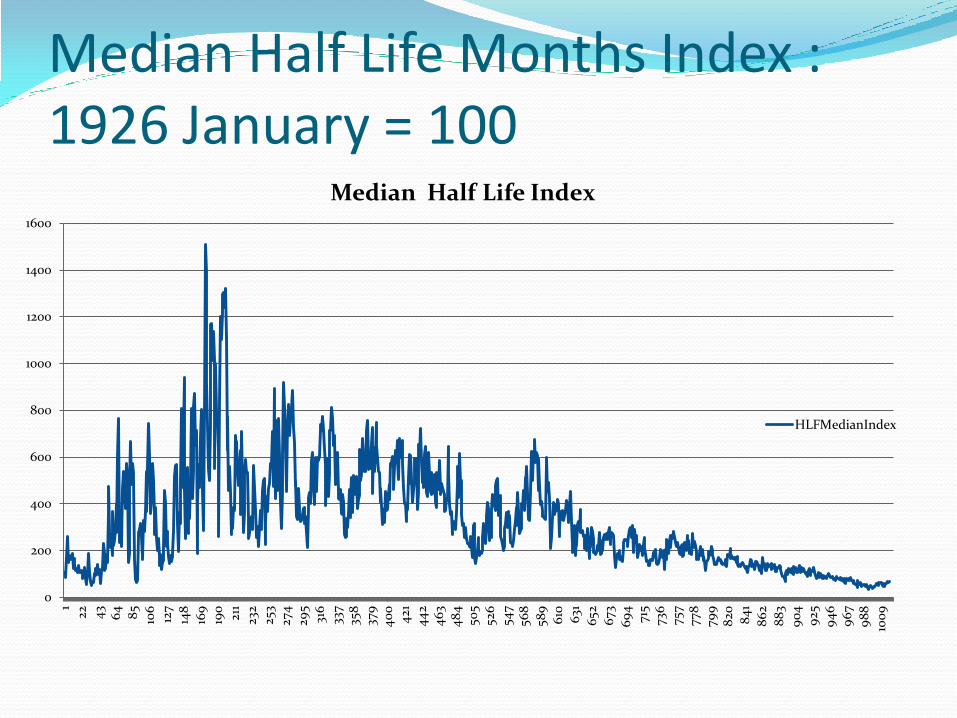
Median Half Life Months Index : 1926 January = 100
0
200
400
600
800
1000
1200
1400
1600
1
22 43
64 85
106
127
148
169
190
211
232
253
274
295
316
337
358
379
40
0
421
44
2
46
3
48
4
505
526
547
568
589
610 631
652
673
69
4
715
736
757
778
799
820 84
1
86
2
88
3
90
4
925
94
6
96
7
98
8
100
9
Median Half Life Index
HLFMedianIndex

Bid Ask Spread 1926-2011 : Response to Market Liquidity
0
0.05
0.1
0.15
0.2
0.25
1 21 41
61
81
101
121
141
161
181
201
221
241
261
281
301
321
341
361
381
40
1
421
44
1
46
1
48
1
501
521
541
561
581
60
1
621
64
1
66
1
68
1
701
721
741
761
781
80
1
821
84
1
86
1
88
1
90
1
921
94
1
96
1
98
1
100
1
1021
sprd_Mean

Trading Cost ( 1926-2011)
0
0.05
0.1
0.15
0.2
0.25
0.3
1
22 43
64 85
106
127
148
169
190
211
232
253
274
295
316
337
358
379
40
0
421
44
2
46
3
48
4
505
526
547
568
589
610 631
652
673
69
4
715
736
757
778
799
820 84
1
86
2
88
3
90
4
925
94
6
96
7
98
8
100
9
1030
Trading Cost
ltcost_Mean
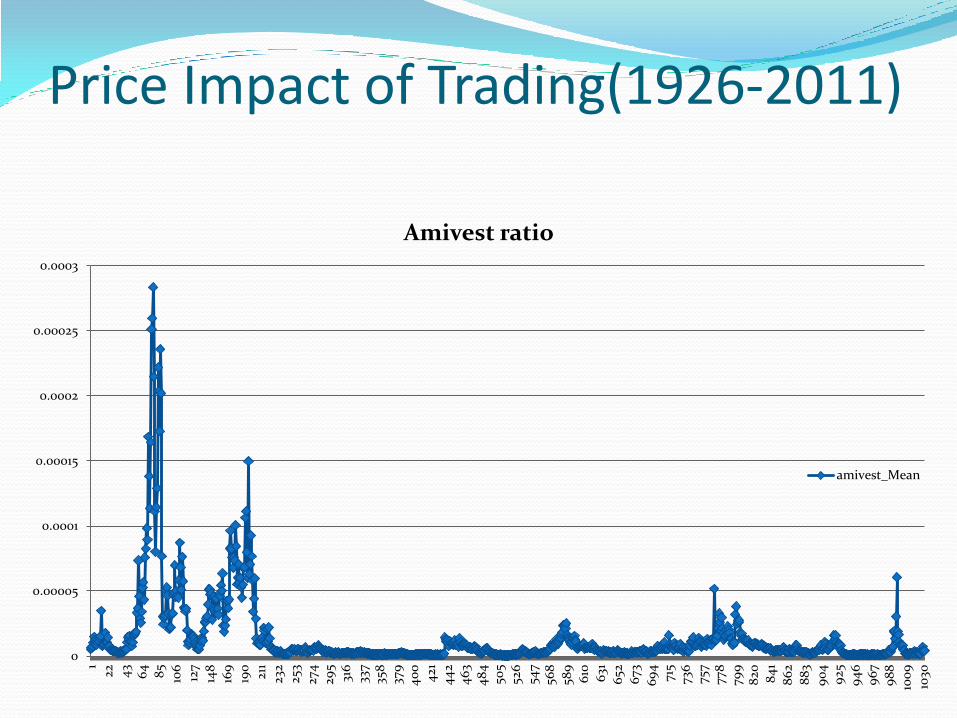
Price Impact of Trading(1926-2011)
0
0.00005
0.0001
0.00015
0.0002
0.00025
0.0003
1
22 43
64 85
106
127
148
169
190
211
232
253
274
295
316
337
358
379
40
0
421
44
2
46
3
48
4
505
526
547
568
589
610 631
652
673
69
4
715
736
757
778
799
820 84
1
86
2
88
3
90
4
925
94
6
96
7
98
8
100
9
1030
Amivest ratio
amivest_Mean

Market Returns Volatility (1926-2010)
0
0.001
0.002
0.003
0.004
0.005
0.006
1 21 41
61
81
101
121
141
161
181
201
221
241
261
281
301
321
341
361
381
40
14
214
41
46
14
81
501
521
541
561
581
60
16
216
41
66
16
81
701
721
741
761
781
80
18
218
41
86
18
81
90
19
219
41
96
19
81
100
1
Market Volatility
lpretw_Var_Mean

Liquidity and Returns ( 1926-2010)
Liquidity Annual
returns Compares
95%
Confidence
Mean equal to Interval
Liquid 0.1193 None ( 0.118: 0.120)
Illiquid 0.1455 None ( 0.145: 0.146)
Liquidity
Premium 0.0262
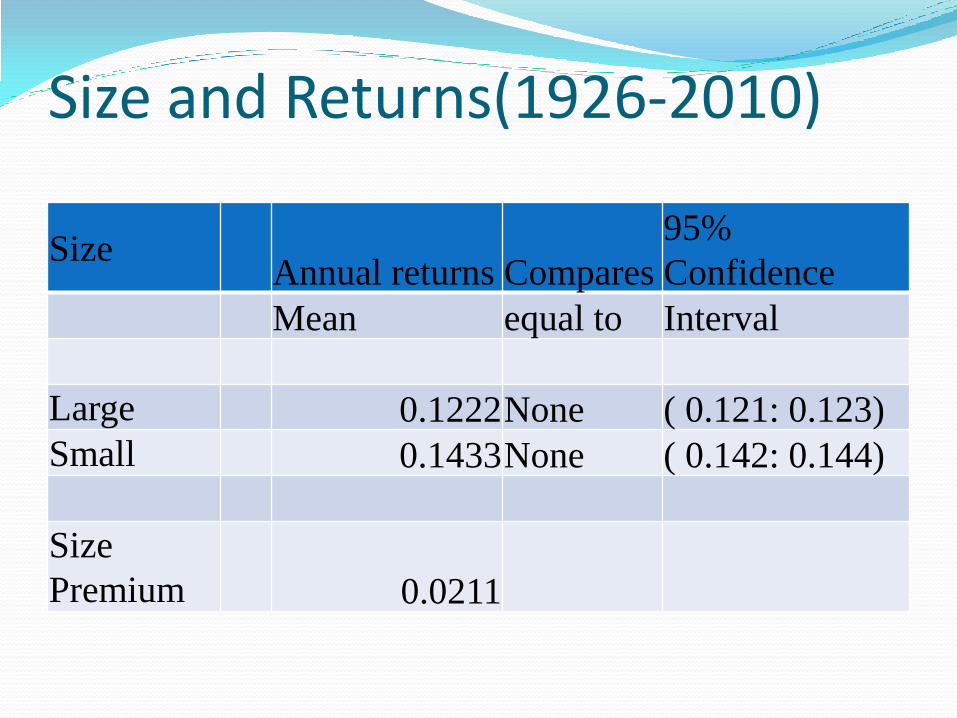
Size and Returns(1926-2010)
Size Annual returns Compares
95%
Confidence
Mean equal to Interval
Large 0.1222 None ( 0.121: 0.123)
Small 0.1433 None ( 0.142: 0.144)
Size
Premium 0.0211

Liquidity and Size Impact ( 1926-2010)
Liquidity sorted
by size
Annual
Return Compares 95% Confidence
Mean equal to Interval
Liquid and Large 0.1179 None ( 0.117: 0.119)
Liquid and Small 0.1208 None ( 0.119: 0.122)
Illiquid and
Large 0.1241 None ( 0.123: 0.125)
Illiquid and
Small 0.1669 None ( 0.166: 0.168)
Aggregate
Difference
0.049
Size premium Adjusted for Liquidity 0.02285

Size and Liquidity Impact (1926-2010)
Size sorted by
Liquidity
Annual
returns Compares 95% Confidence
Mean equal to Interval
Large and Liquid 0.1191 None ( 0.118: 0.120)
Large and
Illiquid 0.1254 None ( 0.124: 0.127)
Small and Liquid 0.1281 None ( 0.127: 0.129)
Small and
Illiquid 0.1586 None ( 0.157: 0.160)
Aggregate
Difference
0.0395
Liquidity premium Adjusted for Size 0.0184
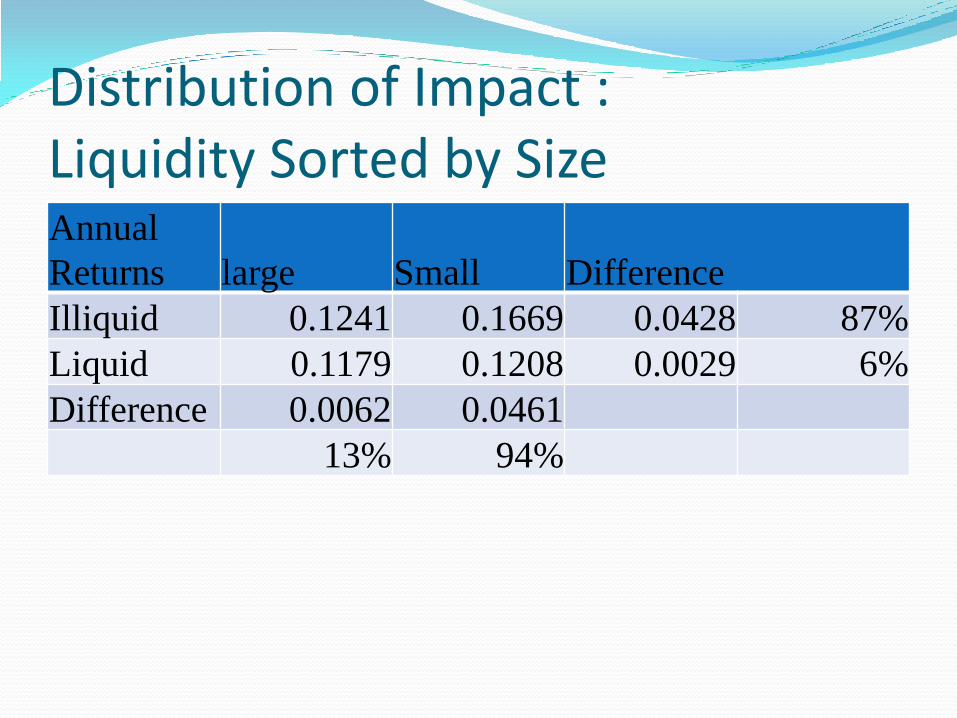
Distribution of Impact : Liquidity Sorted by Size Annual
Returns large Small Difference
Illiquid 0.1241 0.1669 0.0428 87%
Liquid 0.1179 0.1208 0.0029 6%
Difference 0.0062 0.0461
13% 94%
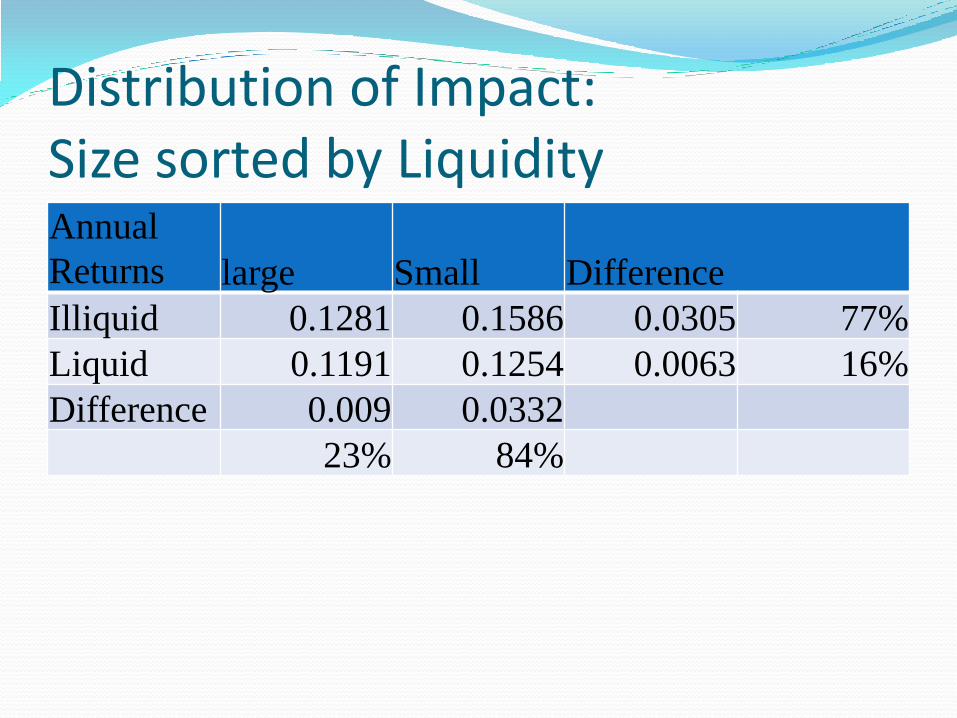
Distribution of Impact: Size sorted by Liquidity Annual
Returns large Small Difference
Illiquid 0.1281 0.1586 0.0305 77%
Liquid 0.1191 0.1254 0.0063 16%
Difference 0.009 0.0332
23% 84%

Liquidity and Trading Cost
Group
Mean Winsorized Difference Proportion Trading Cost
Illiquid
and Small 7.79%
Liquid
and Small 2.31% 5.48% 89.66%
Liquid
and large 1.68% 0.63% 10.34% 6.11%
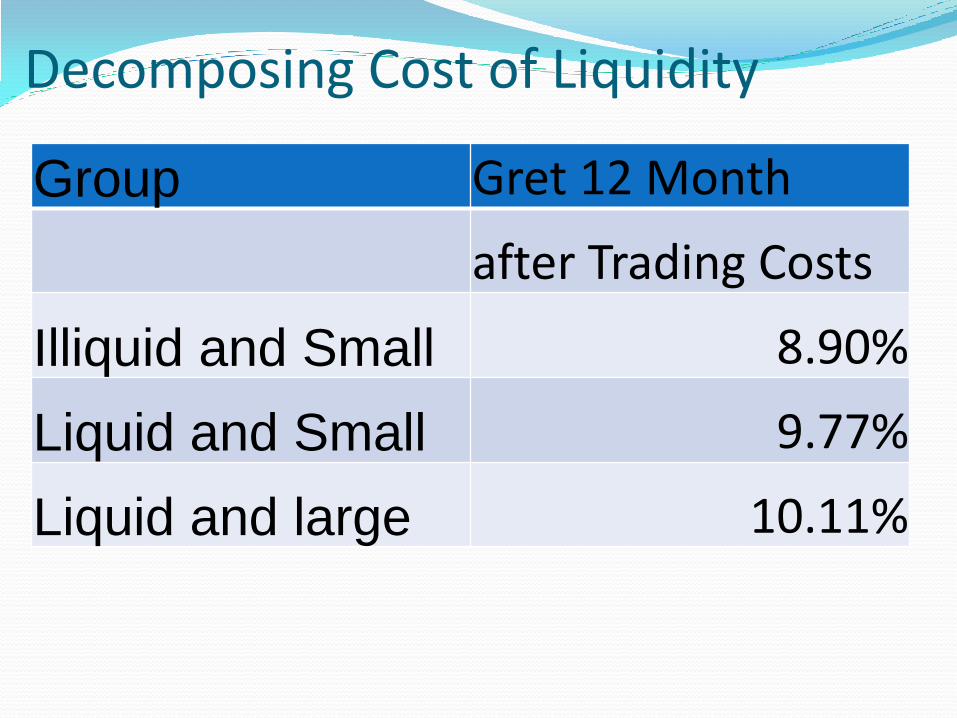
Decomposing Cost of Liquidity
Group Gret 12 Month
after Trading Costs
Illiquid and Small 8.90%
Liquid and Small 9.77%
Liquid and large 10.11%

Liquidity Costs are not trivial Liquidity Costs significantly reduce any gains
associated with small stock premium and need to be accounted for.
Small stock premium may be a statistical artifact for annual holding periods in view of the substantial illiquidity observed.

Conclusion: Size and Liquidity are both important in explaining asset returns.
We have illustrated the role of liquidity in explaining the returns on assets across time.
Liquidity differences can explain a very substantial part of the differences in returns between small and large as well as liquid and illiquid assets.
Size and liquidity premiums are not mutually exclusive.

Questions? Please do not hesitate to contact us for any clarifications.
Ashok Bhardwaj Abbott Ph.D. MBA
Email [email protected]
Phone 304 692 1385