presentation to:presentation to: 2010 michigan mwea ... 3 prime mover blowers op..pdf ·...
TRANSCRIPT
Presentation to:Presentation to:Presentation to:Presentation to:2010 Michigan MWEA Process Seminar 2010 Michigan MWEA Process Seminar O ti Effi iO ti Effi i D i M ith LD i M ith LOperation Efficiency Operation Efficiency –– Doing More with LessDoing More with Less
On:
Effective Turndown of Aeration Air Blowers for
On:
Effective Turndown of Aeration Air Blowers forEffective Turndown of Aeration Air Blowers for Electricity Cost SavingsEffective Turndown of Aeration Air Blowers for Electricity Cost Savings
December 8, 2010December 8, 2010

Representing 40 to 60% of a Typical Wastewater Representing 40 to 60% of a Typical Wastewater p g ypp g ypTreatment Plant’s Electrical Energy Use, Diffused Treatment Plant’s Electrical Energy Use, Diffused Aeration Air Blowers (and Turndown Thereof) Aeration Air Blowers (and Turndown Thereof) P id P i F f E S iP id P i F f E S iProvide a Primary Focus for Energy SavingsProvide a Primary Focus for Energy Savings
Misc. Electricity
Uses
Misc. Electricity Uses
Diffused A tiRAS/WAS
Solids Handling/
Processing
Uses
RAS/WAS
Solids Handling/Processing
Aeration
Channel Aeration
RAS/WAS PumpingDiffused
AerationChannel Aeration and/or
Mixing
Pumping
and/or MixingRaw Sewage/Effluent
Pumping
Plants with Raw Sewage/Effluent Pumping
Plants without Raw Sewage/Effluent Pumping

The Diurnal Dry Weather Flow Pattern of MostThe Diurnal Dry Weather Flow Pattern of MostThe Diurnal Dry Weather Flow Pattern of Most The Diurnal Dry Weather Flow Pattern of Most WWTPs Presents the Opportunity for TurndownWWTPs Presents the Opportunity for Turndown
2,650 hp of BlowerCapacity in UseCapacity in UseUnder Both Flow
Conditions
Diurnal Min to Max Ratio = 42/77=55%
If 2,650 hp Can Handle 77 mgd
Then (0.55)(2650) hp or 1,458 hpShould Handle 42 mgd
Historical Dry Weather Diurnal Flow PatternFor the San Antonio Water Systems Dos Rios WRF

Diffused Aeration System Energy Use is HighlyDiffused Aeration System Energy Use is HighlyDiffused Aeration System Energy Use is Highly Diffused Aeration System Energy Use is Highly Influenced by Blower TypeInfluenced by Blower Type
Silencer
To Other A ti To Other A ti
M
PIT
Aeration BasinsAeration Basins
Aeration BasinAeration BasinRunningStartingStopped
RunningStartingStopped
FIT M AIT
Single-Stage Centrifugal Single-Stage Centrifugal
StoppedStartStop
StoppedStartStop
Start/Stop Start/Stop M M BlowerBlowerStart/Stop
StationStart/Stop
StationM M
Multi-Stage Centrifugal Blower
Positive Displacement Blower
High-SpeedTurbo Blower

Turndown of MultiTurndown of Multi--Stage Centrifugal BlowersStage Centrifugal Blowers
Inlet (Suction) Valve( )Throttling
Speed ControlVia Variable Frequency Drive
Images Courtesy of HSI

Comparison of Blower Turndown Techniques: InletComparison of Blower Turndown Techniques: InletComparison of Blower Turndown Techniques: Inlet Comparison of Blower Turndown Techniques: Inlet Valve Throttling Valve Throttling versusversus VFD ThrottlingVFD Throttling
3560 (RPM)3560 (RPM)
Design Condition8000 ICFM @ 8.5psig
(63% Open)
3480 (RPM)3480 (RPM)
3190 (RPM)3190 (RPM)
3030 (RPM)3030 (RPM) (63% Open)
(42% Open)(32% Open)
( )( )
10HP
Legend73HP
75HP
Full Speed/Un-throttledCharacteristicsInlet Valve ThrottledThrottled Characteristics
VFD ThrottledCharacteristics
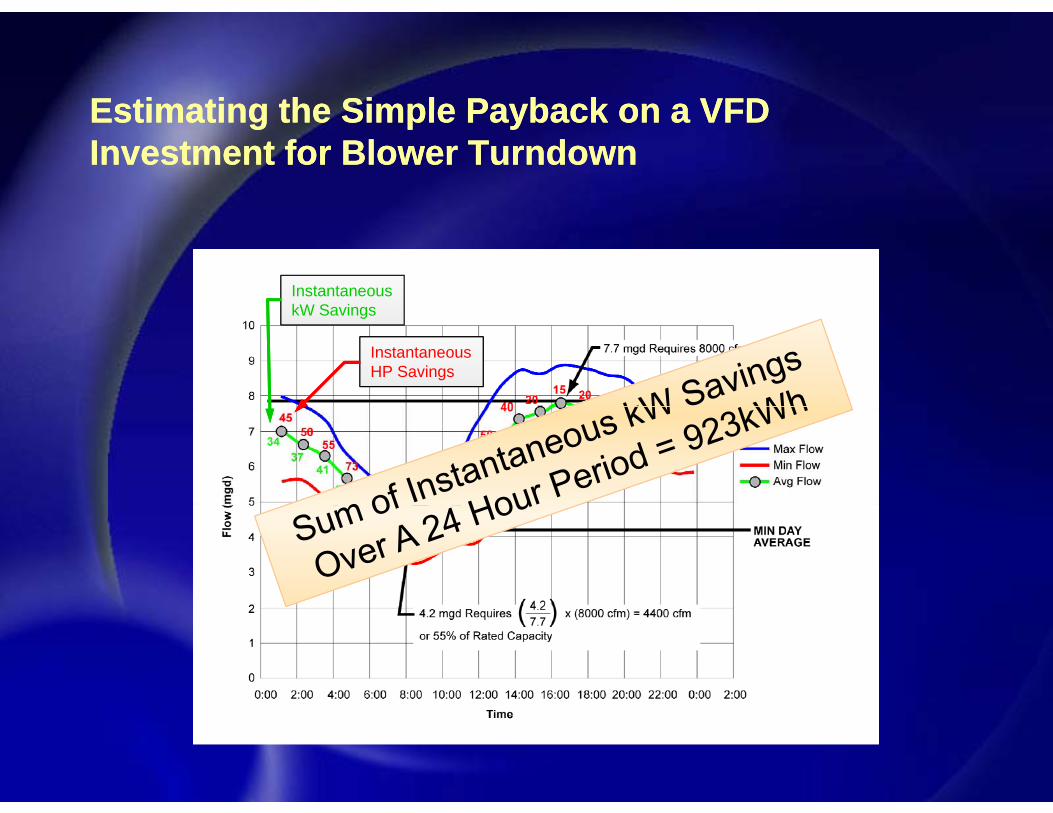
Estimating the Simple Payback on a VFDEstimating the Simple Payback on a VFDEstimating the Simple Payback on a VFD Estimating the Simple Payback on a VFD Investment for Blower TurndownInvestment for Blower Turndown
InstantaneouskW Savings
InstantaneousHP Savings
kW Savings

Estimating the Simple Payback on a VFDEstimating the Simple Payback on a VFDEstimating the Simple Payback on a VFD Estimating the Simple Payback on a VFD Investment for Blower TurndownInvestment for Blower Turndown
Daily Energy Savings Over and y gy g
Above Inlet Value Throttling …… 923 kWh
Annual Energy Savings ………….. 337,000 kWh
Annual Electricity CostAnnual Electricity Cost
Savings @ $0.09/kWh …………… $30,300
Cost of 400-HP VFD (Installed)……$50,000
S 1 65 Y$50,000( )Simple Payback …… 1.65 Years$30,300( )

Turndown of SingleTurndown of Single--Stage Centrifugal BlowerStage Centrifugal BlowerEfficient Turndown when Used Aloneas Long as Inlet Temperature and Pressures Remain Relatively Constant
Discharge Diffuser Vanes
All T d h U d AlAllows Turndown when Used AloneUnder Varying Inlet Temperatureand Pressure Conditions Images Courtesy of Turblex Inc.
A Siemens CompanyInlet Guide Vanes

Comparison of Comparison of Blower TurndownBlower TurndownBlower Turndown Blower Turndown Techniques: Single Techniques: Single Vane Throttling Vane Throttling VersusVersus Dual Vane Dual Vane ThrottlingThrottling
100 to 40% Turndown
125 HPDesign Condition35,000 ACFM @ 10psig
140 HP
Legend
Single VaneThrottledCh t i tiCharacteristicsDual Vane Throttled Characteristics

Estimating the Simple Payback on a Dual VaneEstimating the Simple Payback on a Dual VaneEstimating the Simple Payback on a Dual Vane Estimating the Simple Payback on a Dual Vane Investment for Blower TurndownInvestment for Blower Turndown
InstantaneouskW Savings
InstantaneousHP Savings
kW Savings

Estimating the Simple Payback on a Dual VaneEstimating the Simple Payback on a Dual VaneEstimating the Simple Payback on a Dual Vane Estimating the Simple Payback on a Dual Vane Investment for Blower TurndownInvestment for Blower Turndown
Daily Energy Savings Over and AboveDaily Energy Savings Over and Above Single Vane Throttling …………………………….2,371 kWh
Annual Energy Savings…………………………865,000 kWh
Annual Electricity Cost Savings @ $0.09/kWh ……………………………….…………$77,900@ ,
Incremental cost of dual vane 35,000/10-psig/2,000-HP single-stage centrifugal blower …………$100,000
Simple Payback …………………… 1.28 Years$100,000$77,900( )
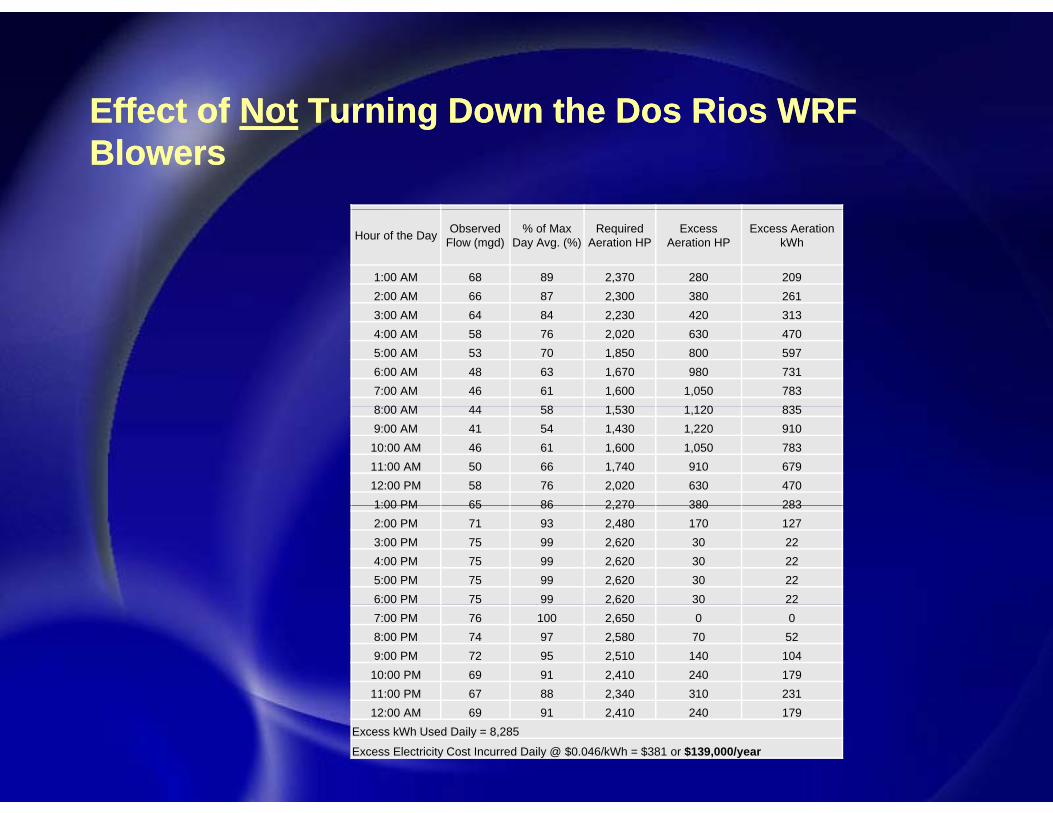
Effect ofEffect of NotNot Turning Down the Dos Rios WRFTurning Down the Dos Rios WRFEffect of Effect of NotNot Turning Down the Dos Rios WRF Turning Down the Dos Rios WRF BlowersBlowers
Hour of the Day Observed Flow (mgd)
% of Max Day Avg. (%)
Required Aeration HP
Excess Aeration HP
Excess Aeration kWh
1:00 AM 68 89 2,370 280 2092:00 AM 66 87 2,300 380 2613:00 AM 64 84 2,230 420 3134:00 AM 58 76 2,020 630 4705:00 AM 53 70 1,850 800 5976:00 AM 48 63 1,670 980 7317:00 AM 46 61 1,600 1,050 7838 00 AM 44 58 1 530 1 120 8358:00 AM 44 58 1,530 1,120 8359:00 AM 41 54 1,430 1,220 910
10:00 AM 46 61 1,600 1,050 78311:00 AM 50 66 1,740 910 67912:00 PM 58 76 2,020 630 4701:00 PM 65 86 2 270 380 2831:00 PM 65 86 2,270 380 2832:00 PM 71 93 2,480 170 1273:00 PM 75 99 2,620 30 224:00 PM 75 99 2,620 30 225:00 PM 75 99 2,620 30 226:00 PM 75 99 2,620 30 22,7:00 PM 76 100 2,650 0 08:00 PM 74 97 2,580 70 529:00 PM 72 95 2,510 140 104
10:00 PM 69 91 2,410 240 17911:00 PM 67 88 2,340 310 23112:00 AM 69 91 2,410 240 179
Excess kWh Used Daily = 8,285
Excess Electricity Cost Incurred Daily @ $0.046/kWh = $381 or $139,000/year
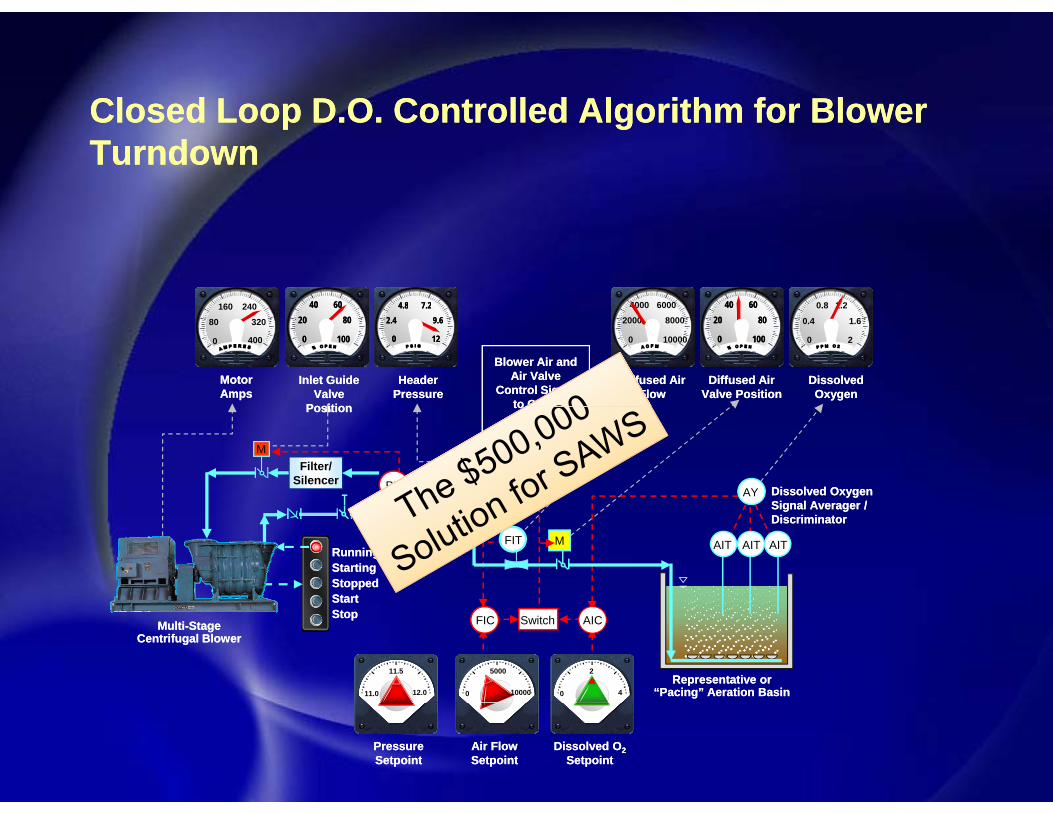
Closed Loop D O Controlled Algorithm for BlowerClosed Loop D O Controlled Algorithm for BlowerClosed Loop D.O. Controlled Algorithm for Blower Closed Loop D.O. Controlled Algorithm for Blower TurndownTurndown
4.8 7.24.8 7.2160 240 40 6040 604000 6000 0.8 1.240 6040 60 4.8 7.29.6
120
2.44.8 7.2
9.6
120
2.4
0
80
160 240
320
400
Blower Air and Air Valve
Control Signal to Other
Blower Air and Air Valve
Control Signal to Other
Diffused Air Flow
Diffused Air Flow
Dissolved Oxygen
Dissolved Oxygen
Diffused Air Valve Position
Diffused Air Valve Position
0
20 80
1000
20 80
1000
2000
000 6000
8000
10000 20
0.4
0.8 1.2
1.6
Motor AmpsMotor Amps
Header PressureHeader
PressureInlet Guide
Valve Position
Inlet Guide Valve
Position
0
20 80
1000
20 80
100
to Other Basins
to Other Basins
Filter/ Silencer
PositionPosition
Dissolved Oxygen Signal Averager /Dissolved Oxygen Signal Averager /
AY
M
PIC PIT AY
MFITRunningStartingStoppedStart
RunningStartingStoppedStart
Signal Averager / DiscriminatorSignal Averager / Discriminator
AIT AIT AITFIT AIT AIT AIT
Multi-Stage Centrifugal Blower
Multi-Stage Centrifugal Blower
11.0 12.0
11.5
0 10000
5000
0 4
2
AICFIC SwitchStopStop FIC Switch AIC
11.0
11.5
12.0 0
5000
10000 0
2
4Representative or
“Pacing” Aeration BasinRepresentative or
“Pacing” Aeration Basin0
Dissolved O2Setpoint
Dissolved O2Setpoint
Air Flow SetpointAir Flow Setpoint
Pressure SetpointPressure Setpoint

The Reliability of the D.O. Process Variable Can BeThe Reliability of the D.O. Process Variable Can BeThe Reliability of the D.O. Process Variable Can Be The Reliability of the D.O. Process Variable Can Be Enhanced Through the Use of Redundant Enhanced Through the Use of Redundant Instrumentation and Output Signal Discrimination Instrumentation and Output Signal Discrimination FiltersFilters

Raw Sewage Flow Controlled Algorithm for BlowerRaw Sewage Flow Controlled Algorithm for BlowerRaw Sewage Flow Controlled Algorithm for Blower Raw Sewage Flow Controlled Algorithm for Blower TurndownTurndown
ZIZIHCHC
Inlet Guide Vane Position Indicator (36
to 100% Open)Ratio Station
ZIZIHCHC
Existing Inlet Guide Vane Position Controller Located on Blo er
SV1 PV2
RatioRatio
PV3(4-20 mA, Where 4
A 36% O )
Located on Blower Control Panel
( PV1) ( X.X) = PV2Where X.X = 0.5 to 2.0
PV1
PV2 = SV2(4-20 mA)
HCHC
FITFITZCZC ZITZIT
mA= 36% Open)
Ambient Air
MM 1200 t 3000 HP
PV1(4-20 mA, Where 4 mA = 0 mgd and 20 mA =
Span)
MV(4-20 mA, Where 4 mA= 36% Open)
Raw Sewage
FEFE MMMM
Aeration Inlet Guide
Vanes
≈1200 to 3000 HP
To Blower Discharge Header
FEFEAeration Blower
Vanes
108” Influent Flow Meter

A Simple Relationship Table for Blower TurndownA Simple Relationship Table for Blower Turndown
Hour of the Day Observed Flow (mgd)
Blower Guide Vane Position (%)
1:00 AM 68 602:00 AM 66 603 00 AM 64 83:00 AM 64 584:00 AM 58 585:00 AM 53 506:00 AM 48 507:00 AM 46 508:00 AM 44 458:00 AM 44 459:00 AM 41 4510:00 AM 46 5011:00 AM 50 5012:00 PM 58 581:00 PM 65 581:00 PM 65 582:00 PM 71 653:00 PM 75 804:00 PM 75 805:00 PM 75 806:00 PM 75 807:00 PM 76 808:00 PM 74 709:00 PM 72 7010:00 PM 69 6511:00 PM 67 6012:00 AM 69 65

Closed Loop D.O. Control Optimizes Energy UseClosed Loop D.O. Control Optimizes Energy Use
0
20004000 6000
8000
10000 20
0.4
0.8 1.2
1.64.8 7.2
9.6
120
2.44.8 7.2
9.6
120
2.4
0
2040 60
80
1000
2040 60
80
1000
2040 60
80
1000
2040 60
80
1000
60120 180
240
3000
60120 180
240
3000
2040 60
80
1000
2040 60
80
1000
16003200 4800
6400
80000
16003200 4800
6400
80000
2040 60
80
1000
2040 60
80
100
Inlet Guide Inlet Guide Vane PositionVane Position
Blower Blower SpeedSpeed
Diffuser Vane Diffuser Vane PositionPosition
Motor Motor AMPsAMPs
Header Header PressurePressure
BlowBlow--Off Off Valve Valve
PositionPosition
Diffused Air Diffused Air FlowFlow
Dissolved Dissolved OxygenOxygen
Diffused Air Diffused Air Valve Valve
PositionPosition
SilencerSilencerPIT To Other To Other
M
MFITRunningRunningStartingStarting
To Other To Other Aeration Aeration BasinsBasins
AIT
Aeration BasinAeration Basin
SingleSingle--Stage Stage Centrifugal Centrifugal
AICFIC
StoppedStoppedStartStartStopStop
PIC
8 12
10
0 10000
5000
0 2
1
Centrifugal Centrifugal BlowerBlowerM
PICMM
Dissolved Dissolved OO22 SetpointSetpoint
Air Flow Air Flow SetpointSetpoint
Pressure Pressure SetpointSetpoint
Increasing D.O. Demand
EquilibriumReached

Closed Loop D.O. Control Optimizes Energy UseClosed Loop D.O. Control Optimizes Energy Use
0
20004000 6000
8000
10000 20
0.4
0.8 1.2
1.6
0
2040 60
80
1000
2040 60
80
100 0
16003200 4800
6400
80000
16003200 4800
6400
8000 0
2040 60
80
1000
2040 60
80
100 0
60120 180
240
3000
60120 180
240
300 0
2040 60
80
1000
2040 60
80
100
4.8 7.29.6
120
2.44.8 7.2
9.6
120
2.4
0
2040 60
80
1000
2040 60
80
100
Inlet Guide Inlet Guide Vane PositionVane Position
Blower Blower SpeedSpeed
Diffuser Vane Diffuser Vane PositionPosition
Motor Motor AMPsAMPs
Header Header PressurePressure
BlowBlow--Off Off Valve Valve
PositionPosition
Diffused Air Diffused Air FlowFlow
Dissolved Dissolved OxygenOxygen
Diffused Air Diffused Air Valve Valve
PositionPosition
SilencerSilencerPIT To Other To Other
M
MFITRunningRunningStartingStarting
To Other To Other Aeration Aeration BasinsBasins
AIT
Aeration BasinAeration Basin
SingleSingle--Stage Stage Centrifugal Centrifugal
AICFIC
StoppedStoppedStartStartStopStop
PIC
8 12
10
0 10000
5000
0 2
1
Centrifugal Centrifugal BlowerBlowerM
PICMM
Dissolved Dissolved OO22 SetpointSetpoint
Air Flow Air Flow SetpointSetpoint
Pressure Pressure SetpointSetpoint
Decreasing D.O. Demand
EquilibriumReached

You Can’t Change the Laws of PhysicsYou Can’t Change the Laws of Physics
Blower ShaftHorsepower ~
Mass FlowProduced
Pressure BuildAcross the Blower( )
( )( )( )Horsepower Efficiency of the
Blower
( ) ( )Bl S l i dBlower Selection and Turndown Mechanism
Dependent
Optimized UsingClosed-Loop Dissolved
O C t l
Optimized Using Most O V l H d
Oxygen Controls
Open Valve Header Pressure Controls
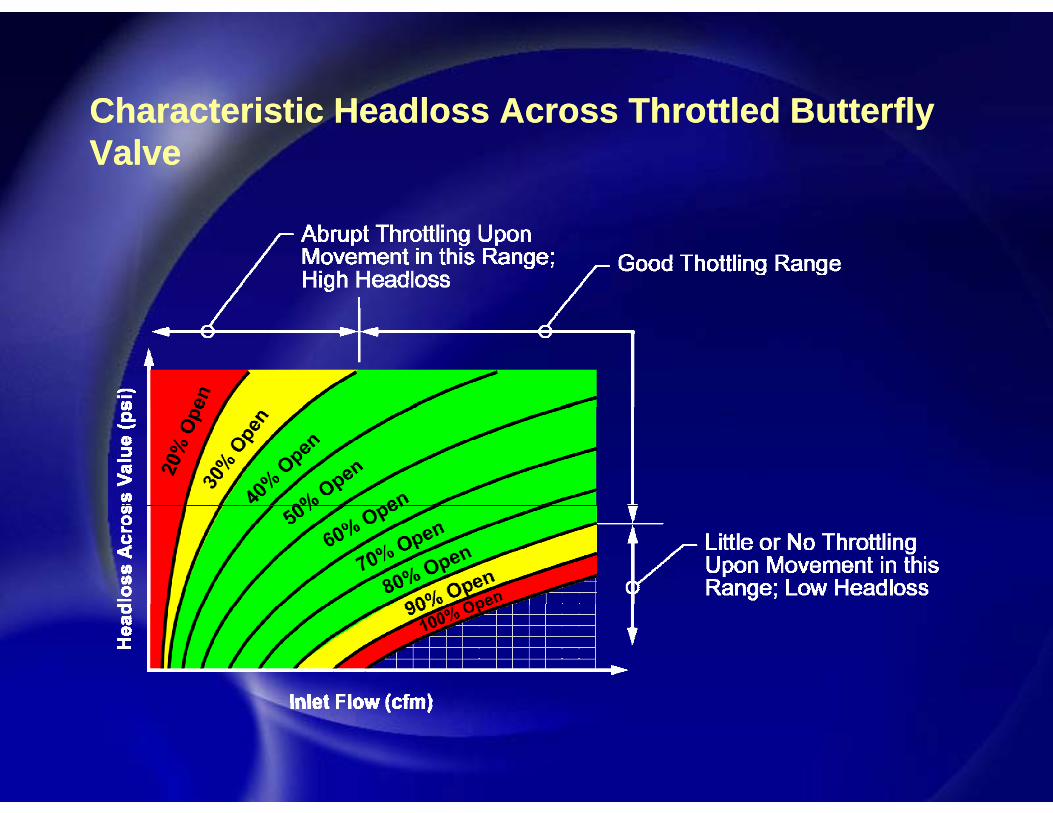
CharacteristicCharacteristic HeadlossHeadloss Across Throttled ButterflyAcross Throttled ButterflyCharacteristic Characteristic HeadlossHeadloss Across Throttled Butterfly Across Throttled Butterfly ValveValve

Most Open Valve Header Pressure Control Also Optimizes Most Open Valve Header Pressure Control Also Optimizes Energy UseEnergy Usegygy
0
16003200 4800
6400
80000
16003200 4800
6400
80000
2040 60
80
1000
2040 60
80
100 0
2040 60
80
1000
2040 60
80
100 0
60120 180
240
3000
60120 180
240
300 0
2040 60
80
1000
2040 60
80
100
4.8 7.29.6
120
2.44.8 7.2
9.6
120
2.4
0
2040 60
80
1000
2040 60
80
100 0
2040 60
80
1000
2040 60
80
100
Inlet Guide Inlet Guide Vane PositionVane Position
Blower Blower SpeedSpeed
Diffuser Vane Diffuser Vane PositionPosition
Motor Motor AMPsAMPs
Header Header PressurePressure
BlowBlow--Off Off Valve Valve
PositionPosition
Diffused Air Diffused Air Valve Valve
PositionPosition
Diffused Air Diffused Air Valve Valve
PositionPosition
SilencerSilencerMFITPIT AIT
MSTEP 1: Find Most Open Valve UsingDiffused Air Valve Position SignalsSTEP 2: If Any Valve is Greater ThanLimit Setpoint; Increase Header PressureSTEP 3: If Any Valve is Less ThanLimit Setpoint; Decrease Header Pressure
RunningRunningStartingStarting
Aeration BasinAeration Basin
SingleSingle--Stage Stage Centrifugal Centrifugal
StoppedStoppedStartStartStopStop
PIC
FIND
IF MFIT AIT
8 12
10
0 100
50
Centrifugal Centrifugal BlowerBlowerM
PICMM
IF MFIT AIT
Aeration BasinAeration Basin
Most Open Valve Most Open Valve Limit Limit SetpointSetpoint
Pressure Pressure SetpointSetpoint

Most Open Valve Header Pressure Control Also Optimizes Most Open Valve Header Pressure Control Also Optimizes Energy UseEnergy Usegygy
0
2040 60
80
1000
2040 60
80
100 0
16003200 4800
6400
80000
16003200 4800
6400
8000 0
2040 60
80
1000
2040 60
80
100 0
60120 180
240
3000
60120 180
240
300 0
2040 60
80
1000
2040 60
80
100
4.8 7.29.6
120
2.44.8 7.2
9.6
120
2.4
0
2040 60
80
1000
2040 60
80
100 0
2040 60
80
1000
2040 60
80
100
Inlet Guide Inlet Guide Vane PositionVane Position
Blower Blower SpeedSpeed
Diffuser Vane Diffuser Vane PositionPosition
Motor Motor AMPsAMPs
Header Header PressurePressure
BlowBlow--Off Off Valve Valve
PositionPosition
Diffused Air Diffused Air Valve Valve
PositionPosition
Diffused Air Diffused Air Valve Valve
PositionPosition
SilencerSilencerMFITPIT AIT
M
RunningRunningStartingStarting
Aeration BasinAeration Basin
SingleSingle--Stage Stage Centrifugal Centrifugal
StoppedStoppedStartStartStopStop
PIC
FIND
IF MFIT AIT
8 12
10
0 100
50
Centrifugal Centrifugal BlowerBlowerM
PICMM
IF MFIT AIT
Aeration BasinAeration Basin
Decreasing
Most Open Valve Most Open Valve Limit Limit SetpointSetpoint
Pressure Pressure SetpointSetpoint
HeaderPressure

Case Study: Jacksonville, IL WWTPCase Study: Jacksonville, IL WWTP• Current condition: Continuous operation of 1 out of 4 multistage centrifugal blowers (four @ 300 HP)
No VFDs Inlet valve throttled at 50% 44% of total WWTP• No VFDs, Inlet valve throttled at 50%, 44% of total WWTP electricity use
• Energy use evaluation provided two recommendations toEnergy use evaluation provided two recommendations to improve efficiency:
• Automated control of inlet valve throttling by either a dissolved oxygen or raw sewage flow control loop
• Installation of a high speed turbo-type centrifugal blower
Condition
Average Daily
Electricity Use (kWh)
% Daily Energy Savings
Energy Savings per Year (kWh)
Energy Cost
Savings per Year
Estimated Installation Cost / Calculated Simple
Payback Period (years)
Existing Blowers 4,300 - - - -
Existing Blowers with Increased Levels of Inlet
Valve Throttling3,400 21% 329,000 $26,000 $40,000 / 1.6
Valve Throttling
New High Speed Turbo-type Blower with
Onboard VFD2,200 49 % 767,000 $61,000 $250,000 / 4.1

Case Study: Valparaiso, IN WWTPCase Study: Valparaiso, IN WWTP• Current condition: Continuous operation of 1 out 4 multistage centrifugal blowers (two @ 200HP & two @ 400HP)
No VFDs Inlet valve throttled at 50% 40% of total WWTP• No VFDs, Inlet valve throttled at 50%, 40% of total WWTP electricity use
• Energy use evaluation provided recommendations to improveEnergy use evaluation provided recommendations to improve efficiency:
• Add VFDs on existing two 200-HP blowers
• Modify blower impellers to allow for maximum turndown
Average % Daily Energy Energy Estimated Installation CostCondition Daily
Electricity Use (kWh)
% Daily Energy Savings
Energy Savings per Year (kWh)
Cost Savings per
Year
Estimated Installation Cost / Calculated Simple
Payback Period (years)
Existing Blowers 3,600 - - - -
Existing Blowers modified w/new
impellers and VFDs 2,500 31 % 402,000 $32,000 $200,000/6.25

Case Study: Marion, IN WWTPCase Study: Marion, IN WWTP• Current condition:
•Three 300HP PD blowers operating with VFDs (blowers are 30 to 40 years old)
•One blower is typically operated at 60% speed (3000 SCFM)
• Recommendation: • Based on energy use analysis of existing blowers, a high speed turbo-type centrifugal blower was recommendedyp g
Average % Daily Energy Energy Estimated Installation CostCondition Daily
Electricity Use (kWh)
% Daily Energy Savings
Energy Savings per Year (kWh)
Cost Savings per
Year
Estimated Installation Cost / Calculated Simple
Payback Period (years)
Existing Blowers 3,200 - - - -
New High Speed Turbo-type Blower with
Onboard VFD2,100 34 % 402,000 $32,000 $250,000/7.8

ConclusionConclusionTurndown of aeration air blowers yields real cost savings:
SAWS/Dos Rios WRF realized > $125,000/yearDallas/Southside WWTP realized > $880,000/year
Effective turndown requires:
Appropriate selection of turndown mechanismturndown mechanism
Optimized use of oxygen
Optimized use of
pressure
$$ Saved

Thank YouThank YouThank YouThank You
Questions &Questions &AnswersAnswers