presentation to rhode island state investment …
TRANSCRIPT
PRESENTATION TO RHODE ISLAND STATE INVESTMENT COMMISSION
FOR QUALIFIED INVESTOR USE ONLY.
June 24, 2020

FOR QUALIFIED INVESTOR USE ONLY.
TABLE OF CONTENTS
2
I. Owl Rock Platform
II. ORCC III Opportunity
III. Team Overview
IV. Track Record
V. ORCC III Terms
VI. Seed Opportunity Overview

FOR QUALIFIED INVESTOR USE ONLY.
OWL ROCK PLATFORM
FOR QUALIFIED INVESTOR USE ONLY.
ABOUT OWL ROCK
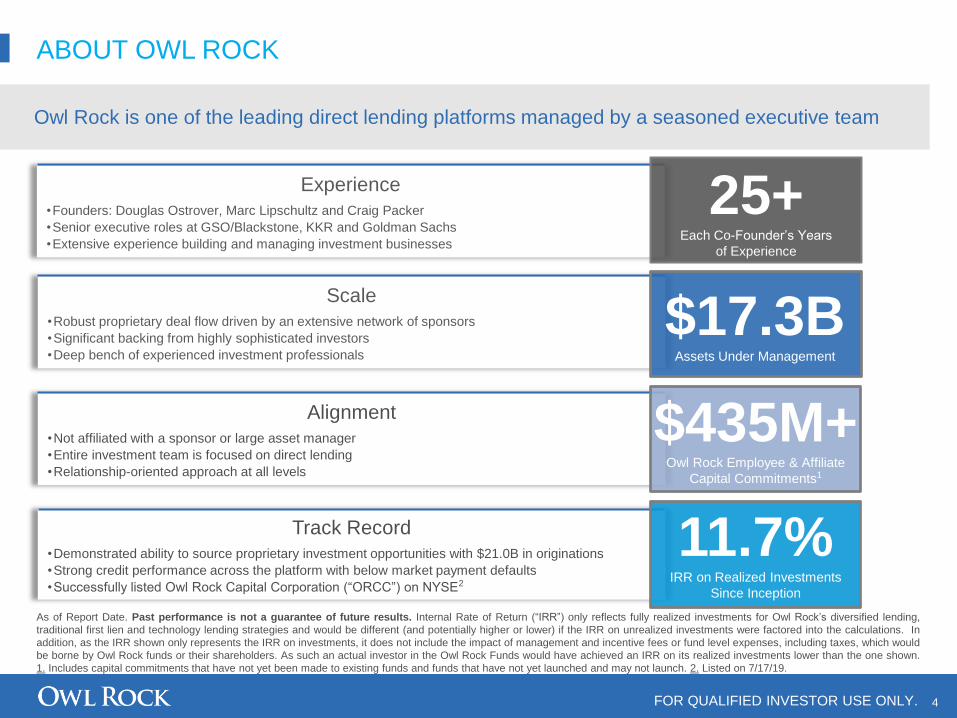
Owl Rock is one of the leading direct lending platforms managed by a seasoned executive team
Experience
•Founders: Douglas Ostrover, Marc Lipschultz and Craig Packer
•Senior executive roles at GSO/Blackstone, KKR and Goldman Sachs
•Extensive experience building and managing investment businesses
25+Each Co-Founder’s Years
of Experience
Alignment
•Not affiliated with a sponsor or large asset manager
•Entire investment team is focused on direct lending
•Relationship-oriented approach at all levels
$435M+Owl Rock Employee & Affiliate
Capital Commitments1
Scale
•Robust proprietary deal flow driven by an extensive network of sponsors
•Significant backing from highly sophisticated investors
•Deep bench of experienced investment professionals
$17.3BAssets Under Management
Track Record
•Demonstrated ability to source proprietary investment opportunities with $21.0B in originations
•Strong credit performance across the platform with below market payment defaults
•Successfully listed Owl Rock Capital Corporation (“ORCC”) on NYSE2
11.7%IRR on Realized Investments
Since Inception
4
As of Report Date. Past performance is not a guarantee of future results. Internal Rate of Return (“IRR”) only reflects fully realized investments for Owl Rock’s diversified lending,
traditional first lien and technology lending strategies and would be different (and potentially higher or lower) if the IRR on unrealized investments were factored into the calculations. In
addition, as the IRR shown only represents the IRR on investments, it does not include the impact of management and incentive fees or fund level expenses, including taxes, which would
be borne by Owl Rock funds or their shareholders. As such an actual investor in the Owl Rock Funds would have achieved an IRR on its realized investments lower than the one shown.
1. Includes capital commitments that have not yet been made to existing funds and funds that have not yet launched and may not launch. 2. Listed on 7/17/19.

FOR QUALIFIED INVESTOR USE ONLY.
Complementary verticals that leverage existing origination and underwriting functions
As of Report Date. Past performance is not a guarantee of future results. 1. Assets Under Management (“AUM”) is calculated as total assets (equity plus leverage) plus unfundedcommitments of investors, where applicable. AUM and equity raised may include assets invested through SMAs.
$17.3B ASSETS UNDER MANAGEMENT
DIVERSIFIED DIRECT LENDINGTRADITIONAL FIRST LIEN
LENDING STRATEGY
TECHNOLOGY FINANCE
LENDING
AUM1 $11.1 billion $2.5 billion $3.7 billion
STRATEGY
COMMENCEDMarch 2016 July 2018 August 2018
EQUITY
RAISED1 $7.1 billion $1.7 billion $2.7 billion
FOCUS • Private equity sponsored companies
and other corporate situations
• Directly originated senior secured,
floating rate loans (first lien, second
lien, unitranche)
• Private equity sponsored companies
and other corporate situations
• Directly originated senior secured,
floating rate first lien loans
• Private equity and late stage venture
capital sponsored companies and
other corporate situations
• Directly originated debt and equity
investments in U.S. companies in
the technology sector
PLATFORM BREAKDOWN
5

FOR QUALIFIED INVESTOR USE ONLY.
▪ Singularly focused on direct lending with a unified approach – all deals go through one funnel
▪ Investments are sourced directly through Owl Rock’s origination engine
▪ Direct origination coupled with scale allows Owl Rock to drive loan structuring and be highly
selective
▪ Invest in stable, upper-middle market companies with significant operating history and familiarity
operating with leverage
▪ Highly focused on intensive due diligence, credit structuring, and investment monitoring
▪ Underwriting is focused on top-line stability and downside protection
▪ Private equity-style due diligence with full access to management teams and company owners
▪ Heavily focused on structuring loans with protections for lenders
▪ Detailed, frequent financial reporting of portfolio companies allows for close monitoring and
proactive engagement with borrowers
▪ An investment approach that allows for a full suite of financing solutions
6
OWL ROCK’S FOCUS ON DIRECT LENDING

FOR QUALIFIED INVESTOR USE ONLY.
Being a total solution provider allows for a broader view of market opportunities
7
Team Scale
▪ Deeply experienced team of 50+
investment professionals
dedicated to direct lending
▪ Team of senior originators
responsible for consistent day-
to-day sponsor coverage efforts
▪ Extensive senior-level
relationships with sponsors and
other direct lenders creates
enhanced sourcing through
multiple touchpoints
▪ Significant dry powder allows
Owl Rock to provide scaled
financing solutions, commit to
full capital structures, and
support future capital needs of
borrowers
▪ Large deal funnel allows for
higher degree of selectivity
when considering investment
opportunities
▪ An investment approach that
allows Owl Rock to provide
flexible, customized solutions to
borrowers
▪ Relationship-oriented approach
with significant involvement
from founders through the
investment process
▪ Single investment strategy
creates operational synergies
▪ Ability to move quickly and with
transparency provides certainty
of execution to sponsors
Approach
As of Report Date.
WHAT DIFFERENTIATES OWL ROCK

FOR QUALIFIED INVESTOR USE ONLY.
Select Sponsors With Whom We’ve Transacted
8
As of Report Date.
DEEP SPONSOR RELATIONSHIPS DRIVE DEAL FLOW
Owl Rock has generated deal flow from over 470 sponsors

FOR QUALIFIED INVESTOR USE ONLY.
STRONG ORIGINATION ACTIVITY AND DISCIPLINED UNDERWRITING
Owl Rock has sourced nearly 4,500 investment opportunities since inception
Past performance is not a guarantee of future results. Closed deals represent the number of new portfolio companies in which Owl Rock invested in the quarter
Rigorous
screening of
investments
ensures time
is spent on
the most
actionable
opportunities
9
Q1'20 Q4'19 Q3'19 Q2'19
No. of
Deals
% of
Deals
No. of
Deals
% of
Deals
No. of
Deals
% of
Deals
276 100% 297 100% 354 100%
198 72% 214 72% 256 72%
49 18% 31 10% 47 13%
21 8% 14 5% 24 7%
18 7% 8 3% 20 6%
Total Deals
Heads Up Memo to I.C.
Full Memo to I.C.
Closed
Deals Pursued

DEMONSTRATED ABILITY TO ORIGINATE LARGE DEALS THAT BENEFIT THE OWL ROCK PLATFORM
Select deals based on facility size as of 3/31/20; percent held by Owl Rock as of closing date. Deals not listed may have performed better or worse than those shown.
1. Reflects deal size and Owl Rock position pro forma for Oct-19 Incremental Facilities. ORCC III investors will not have exposure to these portfolio investments.
Portfolio Company Sponsor
Facility Size
($MM)
% Committed by
Owl Rock
% Held by Owl
Rock
Close
Date
Realization
Date
ConnectWise Thoma Bravo $1,130 43% 34% Oct-191 −
Integrity Harvest Partners $945 50% 35% Aug-19 −
GLG SFW Capital Partners $615 100% 95% Dec-18 −
Associa Privately Held $520 100% 63% Jul-18 −
Definitive Advent $575 83% 83% Jul-19 −
Transperfect Privately Held $445 100% 59% May-18 Jun-19
Impark SoftBank $385 100% 100% Nov-18 −
Trader Interactive Goldman Sachs $374 100% 41% Jun-17 −
Galls Charlesbank $370 100% 48% Jan-18 −
Kelsye Sebold TPG (minority) $345 100% 100% Jan-20 −
Beeline New Mountain Capital $335 100% 72% Aug-18 −
GoHealth Centerbirdge $330 50% 50% Sep-19 −
Lazer Spot Harvest Partners $325 68% 68% Dec-19
Endries MSD $300 100% 100% Dec-18 −
City Brewing Privately Held $295 100% 92% Nov-19
Vector Solutions Golden Gate Capital $290 100% 100% Nov-18 −
Individual Food Service Kelso $250 100% 100% Nov-19
2U Public $250 100% 100% May-19 −
Corepoint Health HgCapital $223 100% 100% Jun-19 −
Troon LGP $210 100% 100% Sep-17 −
Brigham Minerals Warburg / Pinebrook / Yorktown $210 100% 100% Jul-18 May-19
(Minority
Investor)
Pinebrook / Yorktown
10FOR QUALIFIED INVESTOR USE ONLY.

FOR QUALIFIED INVESTOR USE ONLY.
Owl Rock takes key ESG considerations into account for every investment made across the platform
✓ Owl Rock deal teams leverage materials provided by the Sustainability Accounting Standards Board (“SASB”)
to identify and evaluate ESG-related risks.
✓ Deal teams are asked to review:
▪ The SASB Materiality Map - details specific areas of potential risk and focus by industry.
▪ The SASB Engagement Guide - provides a list of sample questions to delve further into those areas of
focus.
✓ Deal teams tailor their diligence road map and plan to the unique characteristics of each transaction.
▪ Each deal team reports on their diligence plan, including key questions on which they will focus, in each
deal preview memo.
✓ As part of the final investment committee memo and discussion, the deal team is responsible for reporting
their findings to the investment committee.
TRANSACTIONS MAY BE DECLINED IF KEY ESG CONSIDERATIONS ARE NOT
SATISFACTORILY ADDRESSED AND/OR PRESENT MATERIAL DOWNSIDE RISK
Source: SASB, https://www.sasb.org/
11
ENVIRONMENTAL, SOCIAL, AND GOVERNANCE (ESG)

FOR QUALIFIED INVESTOR USE ONLY.
ORCC III OPPORTUNITY
FOR QUALIFIED INVESTOR USE ONLY.
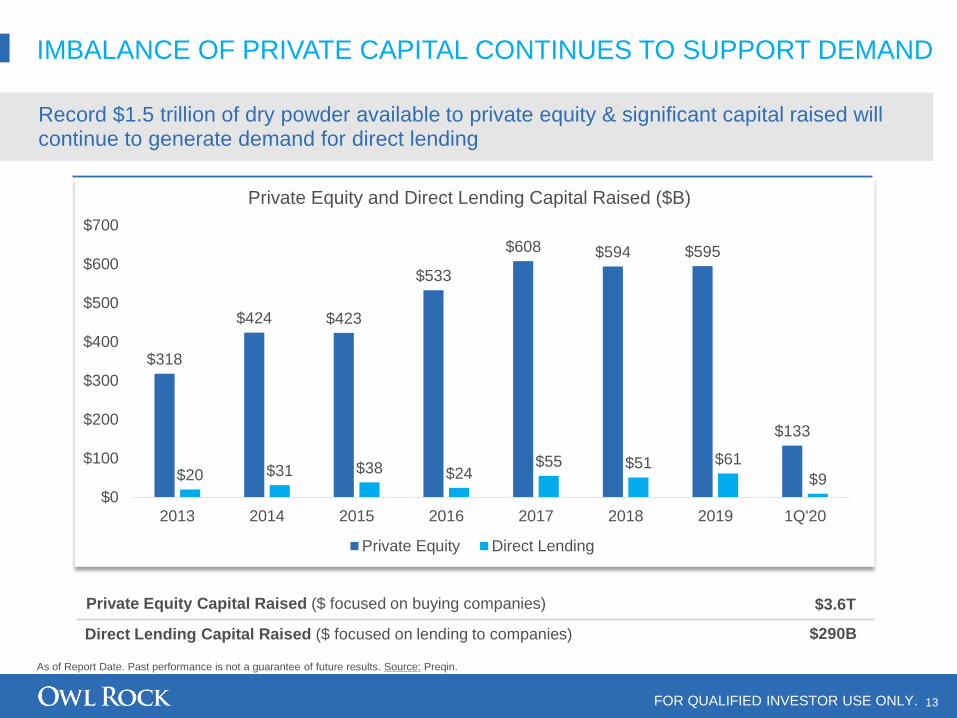
As of Report Date. Past performance is not a guarantee of future results. Source: Preqin.
Private Equity Capital Raised ($ focused on buying companies)
Direct Lending Capital Raised ($ focused on lending to companies)
$3.6T
$290B
Record $1.5 trillion of dry powder available to private equity & significant capital raised will continue to generate demand for direct lending
$318
$424 $423
$533
$608 $594 $595
$133
$20 $31 $38 $24$55 $51 $61
$9$0
$100
$200
$300
$400
$500
$600
$700
2013 2014 2015 2016 2017 2018 2019 1Q'20
Private Equity and Direct Lending Capital Raised ($B)
Private Equity Direct Lending
IMBALANCE OF PRIVATE CAPITAL CONTINUES TO SUPPORT DEMAND
13

FOR QUALIFIED INVESTOR USE ONLY.
Owl Rock Capital Corporation III (“ORCC III”)
▪ Modeled as a successor to Owl Rock Capital Corporation (“ORCC”)
▪ Seek to leverage Owl Rock’s leading direct lending platform to build a portfolio of senior
secured loans to upper middle market companies
▪ Focus on downside protection with LTV of 50% or less
▪ Emphasize diversification, targeting 1-2% position sizes
14
Past performance is not a guarantee of future results. The performance history of ORCC is not necessarily indicative of future results of ORCC III or any other funds advised by
Owl Rock or any of its affiliates, including with respect to potential liquidity events. No assurance can be given that ORCC III will perform in a manner similar to ORCC or that
objectives will be achieved.
ORCC III HIGHLIGHTS
FOR QUALIFIED INVESTOR USE ONLY.
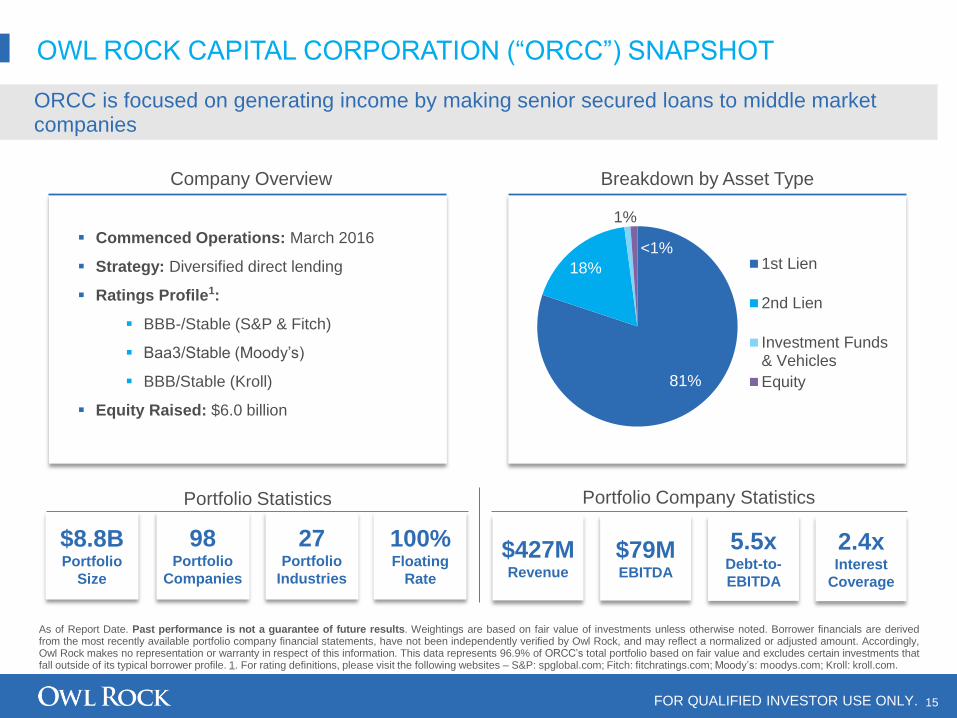
ORCC is focused on generating income by making senior secured loans to middle market companies
▪ Commenced Operations: March 2016
▪ Strategy: Diversified direct lending
▪ Ratings Profile1:
▪ BBB-/Stable (S&P & Fitch)
▪ Baa3/Stable (Moody’s)
▪ BBB/Stable (Kroll)
▪ Equity Raised: $6.0 billion
Company Overview Breakdown by Asset Type
81%
18%
<1%1st Lien
2nd Lien
Investment Funds& Vehicles
Equity
1%
As of Report Date. Past performance is not a guarantee of future results. Weightings are based on fair value of investments unless otherwise noted. Borrower financials are derivedfrom the most recently available portfolio company financial statements, have not been independently verified by Owl Rock, and may reflect a normalized or adjusted amount. Accordingly,Owl Rock makes no representation or warranty in respect of this information. This data represents 96.9% of ORCC’s total portfolio based on fair value and excludes certain investments thatfall outside of its typical borrower profile. 1. For rating definitions, please visit the following websites – S&P: spglobal.com; Fitch: fitchratings.com; Moody’s: moodys.com; Kroll: kroll.com.
Portfolio Statistics
$8.8BPortfolio
Size
100%Floating
Rate
98Portfolio
Companies
27Portfolio
Industries
2.4xInterest
Coverage
Portfolio Company Statistics
5.5xDebt-to-
EBITDA
$79MEBITDA
$427MRevenue
15
OWL ROCK CAPITAL CORPORATION (“ORCC”) SNAPSHOT
FOR QUALIFIED INVESTOR USE ONLY.
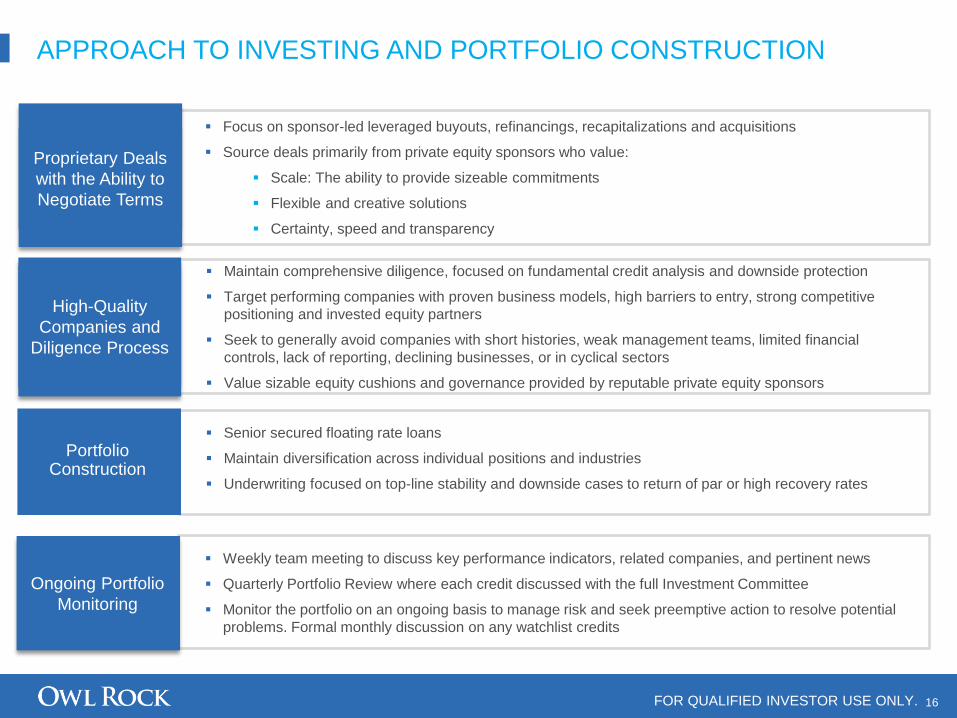
▪ Maintain comprehensive diligence, focused on fundamental credit analysis and downside protection
▪ Target performing companies with proven business models, high barriers to entry, strong competitive
positioning and invested equity partners
▪ Seek to generally avoid companies with short histories, weak management teams, limited financial
controls, lack of reporting, declining businesses, or in cyclical sectors
▪ Value sizable equity cushions and governance provided by reputable private equity sponsors
▪ Senior secured floating rate loans
▪ Maintain diversification across individual positions and industries
▪ Underwriting focused on top-line stability and downside cases to return of par or high recovery rates
▪ Weekly team meeting to discuss key performance indicators, related companies, and pertinent news
▪ Quarterly Portfolio Review where each credit discussed with the full Investment Committee
▪ Monitor the portfolio on an ongoing basis to manage risk and seek preemptive action to resolve potential
problems. Formal monthly discussion on any watchlist credits
▪ Focus on sponsor-led leveraged buyouts, refinancings, recapitalizations and acquisitions
▪ Source deals primarily from private equity sponsors who value:
▪ Scale: The ability to provide sizeable commitments
▪ Flexible and creative solutions
▪ Certainty, speed and transparency
APPROACH TO INVESTING AND PORTFOLIO CONSTRUCTION
Portfolio Construction
Proprietary Deals
with the Ability to
Negotiate Terms
High-Quality
Companies and
Diligence Process
Ongoing Portfolio
Monitoring
16

FOR QUALIFIED INVESTOR USE ONLY.
TEAM OVERVIEW
FOR QUALIFIED INVESTOR USE ONLY.
As of 4/20/2020.
Doug Ostrover Marc Lipschultz Craig Packer
Arthur
Martini
Mark
Marino
Nicole
Drapkin
Adam
Forchheimer
Patrick
Linnemann
Alexis
Maged
Erik
Bissonnette
Jean
Joseph
Prashant
Mupparapu
Dhruv
Narain
Lukas
SpissJon
ten Oever
David
Jar
Andrew
Kim
John
McAneny
Darragh
O’Flaherty
Matt
Tier
Derek
Liu
Scott
Clifford
Dan
Hong
Luna
McKeon
Pete
Andreucetti
Adam
Casella
Timothy
DeGrange
Jennie
Mazzucco
Joe
Benus
Nathan
Bram
Max
Chou
Felix
Zhang
Kendall
Kyritz
Chris
Park
Ilan
Aharoni
Matt
Circle
Dan
Clarke
Ben
Kupferberg
Chandler
Hillin
Griffin
Carroll
Samuel
Kushner
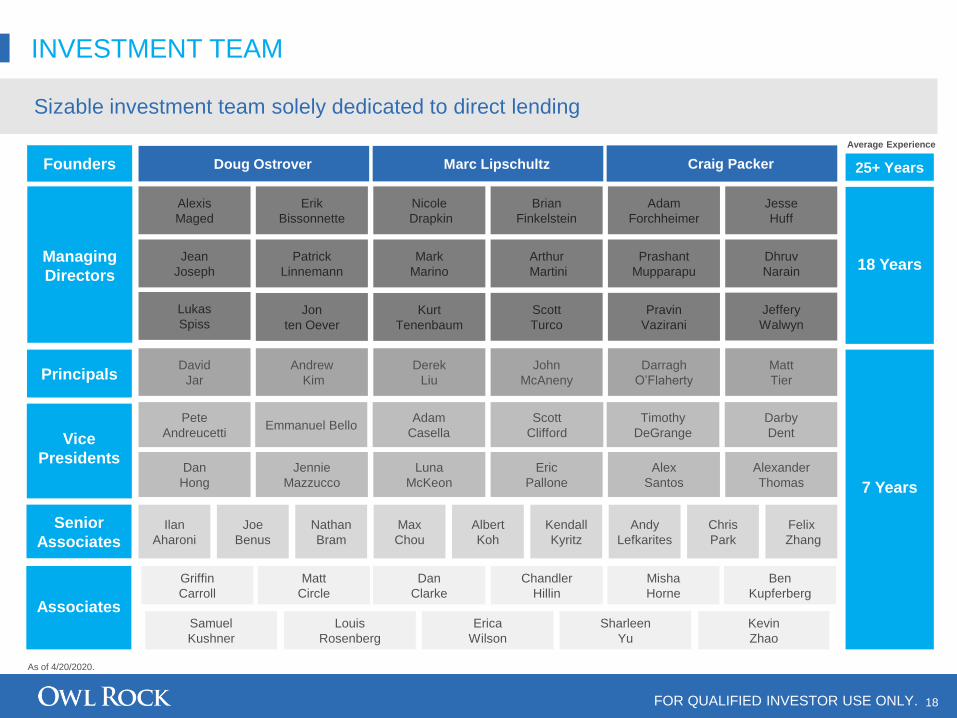
INVESTMENT TEAM
Eric
Pallone
Alex
Santos
Alexander
Thomas
Louis
Rosenberg
Erica
Wilson
Kevin
Zhao
Average Experience
18 Years
25+ Years
7 Years
Founders
Managing
Directors
Principals
Vice
Presidents
Senior
Associates
Associates
Pravin
Vazirani
Jeffery
Walwyn
Scott
Turco
Brian
Finkelstein
Kurt
Tenenbaum
Sizable investment team solely dedicated to direct lending
Andy
Lefkarites
Darby
Dent
Misha
Horne
Jesse
Huff
Emmanuel Bello
Albert
Koh
Sharleen
Yu
18

FOR QUALIFIED INVESTOR USE ONLY.
▪ Average of more than +25 years of experience in private lending
▪ Diverse backgrounds with experience at all levels of a company’s capital structure through multiple business and credit cycles
▪ All of ORCC III’s investment-related decisions require unanimous approval of the investment committee
ORCC III INVESTMENT COMMITTEE
19
▪ Co-Founder, Co-CIO, CEO
▪ Joined Owl Rock: 2016
▪ Co-Founder of GSO Capital Partners
▪ Chairman and Global Co-Head of
Leveraged Finance at CSFB
▪ Co-Founder, Co-CIO
▪ Joined Owl Rock: 2016
▪ Member of KKR’s Management
Committee, Global Head of Energy and
Infrastructure
▪ M&A and Principal Investment Activities at
Goldman Sachs
▪ Co-Founder, Co-CIO
▪ Joined Owl Rock: 2016
▪ Partner and Co-Head of Leveraged Finance in
the Americas at Goldman Sachs
▪ Firmwide Capital Committee, IBD Operating
Committee, Business Standards Committee
and IBD Risk Committee
▪ Head of Underwriting, Portfolio Management
▪ Joined Owl Rock: 2016
▪ Chief Operating Officer of IBD’s Global Credit
Finance Business at Goldman Sachs
▪ Co-Chair of the Credit Markets Capital
Committee and member of the Firmwide Capital
Committee
Doug
Ostrover
Marc
Lipschultz
Craig
Packer
Alexis
Maged

FOR QUALIFIED INVESTOR USE ONLY.
TRACK RECORD

FOR QUALIFIED INVESTOR USE ONLY.
CURRENT PLATFORM OVERVIEW
Owl Rock Capital
Corporation (“ORCC”)
Owl Rock Technology
Finance Corp.Owl Rock First Lien Fund
Current Investments$8.9bn across
101 portfolio companies
$1.8bn across
34 portfolio companies
$1.3bn across
34 portfolio companies
Current Leverage 0.60x 0.94x 1.6x
Average Position Size $88.5mm $53.9mm $42.4mm
Top Five Sectors
Internet Software & Service
Professional Services
Insurance
Healthcare Services
Distribution
Business Services
Education
Healthcare Services
Data & Information Services
Internet & Digital Media
Healthcare Services
Buildings & Real Estate
Professional Services
Consumer Services
Business Services
Annual Average Defaults 0.0% 0.0% 0.0%
Available Undrawn Capital ~$2.0bn ~$1.9bn ~$575mm
As of 3/31/20. Past performance is not a guarantee of future results.
21

FOR QUALIFIED INVESTOR USE ONLY.
ORCC PERFORMANCE
Past performance is not a guarantee of future results. This material is not complete without the attached endnotes and important information pages, which include disclosures on
risk and performance. As of Report Date. Returns are being provided for informational purposes only; investors’ returns may vary and can be higher or lower than what is reflected above. BDC
returns reflect reinvestment of distributions and all returns reflect the deduction of ongoing expenses that are borne by investors, such as management fees, incentive fees, interest expense,
offering costs, professional fees, director fees and other general and administrative expenses. The performance history of ORCC is not necessarily indicative of future results of ORCC III or any
other funds advised by Owl Rock or any of its affiliates, including with respect to potential liquidity events. No assurance can be given that ORCC III will perform in a manner similar to ORCC or
that objectives will be achieved.
As of December 31, 2019 Net IRR Based on Net Asset Value (“NAV”)
1-Year 3-YearSince
Inception
Owl Rock Capital Corporation 11.1% 10.0% 9.9%
22

FOR QUALIFIED INVESTOR USE ONLY.
1Q’20 RECAP
Past performance is not a guarantee of future results. This material is not complete without the attached endnotes and important information pages, which include
disclosures on risk and performance. As of Report Date. 1. The performance shown is index performance and not representative of any investment’s performance. Investors cannot
invest directly in an index. Investments in Owl Rock’s managed funds are subject to certain fees and expenses that are not contemplated above, which would further reduce returns. 2.
Total return is calculated as the rate of return for the quarter ended on the Report Date and is inclusive of appreciation and, where applicable, distributions. This information is not
complete without the performance information and index definitions page following this presentation.
▪ In 1Q’20 global markets were down markedly from highs, attributable to the COVID-19 pandemic and
corresponding shutdown of the global economy
▪ Each of Owl Rock’s managed funds experienced a drop in their net asset value (“NAV”), the majority of which
was attributable to credit spread widening
▪ Owl Rock’s managed funds are valued by an independent, third party valuation firm
▪ Owl Rock has not had any non-accruals or defaults since inception
1Q’20 Performance Discussion
1Q’20 ORCC Performance Breakdown
Leveraged Credit Indices1 1Q’20 Total Return2
S&P LSTA Leveraged Loan Index -13.0%
Credit Suisse High Yield Index -13.9%
Owl Rock Managed Funds Commenced Operations 1Q’20 Total Return2
Owl Rock Capital Corporation (“ORCC”) Mar-16 -5.0%
23
FOR QUALIFIED INVESTOR USE ONLY.
CASE STUDY: CHECKMARX
Source: 1. Businesswire, “Hellman & Friedman Completes Acquisition of Checkmarx” 4/16/20. 2. Reuters, “Direct lenders support existing investments but open for opportunities” 4/2/20. Past
performance is not indicative for future results. All investments are subject to risk, including the loss of the principal amount invested. This is being provided for informational
purposes only. Important limitations to consider when reviewing case studies are that they typically identify only instances in which the investment thesis was successful and do so with the
benefit of hindsight. As such, it should not be assumed that future investments made on behalf of any Owl Rock Fund will be comparable in quality or performance to the investments
described herein.
▪ Checkmarx is a global leader in software security solutions for DevOps, enabling
organizations to deliver secure software faster by making security excellence
intrinsic to software development1
▪ In April 2020 Hellman & Friedman (“H&F”) completed the acquisition of Checkmarx
from Insight Partners in an all cash transaction valued at $1.15 billion1
▪ TPG partnered with H&F and now holds a minority interest in the company together
with Insight Partners1
▪ The deal represents the largest acquisition of an application security company to
date1
▪ Owl Rock provided a first-lien credit facility to support Hellman & Friedman’s buyout
of Checkmarx2
24

FOR QUALIFIED INVESTOR USE ONLY.
ORCC III TERMS

FOR QUALIFIED INVESTOR USE ONLY. 26
This information is summary in nature and is in no way complete, and these terms have been simplified for illustrative purposes and may change materially at any time without notice. Inparticular, this information omits certain important details about the stated terms, and does not address certain other key Fund terms or risks or represent a complete list of all proposed Fundterms. If you express an interest in investing in either of the proposed funds, you will be provided with a private placement memorandum, subscription agreement, and other documents ("FundDocuments"), which shall govern in the event of any conflict with the general terms listed herein. You must rely only on the information contained in the Fund Documents in making anydecision to invest. Please see PPM for corresponding terms.
▪ $100 million between ORCC III and Owl Rock Diversified Lending (“ORDL”)Owl Rock
Commitment
Management
Fee
Fund
Leverage▪ Target 0.9x – 1.25x debt-to-equity with regulatory cap at 2.0x
▪ If ORCC III has not consummated an Exchange Listing by the earlier of the five year anniversary of the Final Closing or
the seven year anniversary of the Initial Closing, subject to two additional one-year extensions in the sole discretion of
the Board of Directors, the Board of Directors will wind down and/or liquidate and dissolve ORCC III in an orderly
manner.
Term
▪ Through the earlier of the five year anniversary of the Final Closing or the seven year anniversary of the Initial Closing.Commitment Period
Incentive
Fee
▪ Quarterly Distributions
▪ $5 millionInvestor Minimum
Pre-Liquidity Event
▪ 0.50% of gross assets
▪ No management fee on undrawn capital
commitments
Post-Liquidity Event
▪ 1.5% gross assets up to 1.0x debt-to-equity
▪ 1.0% gross assets above 1.0x debt-to-equity
Pre-Liquidity Event
▪ None
Post-Liquidity Event
▪ 17.5% of net investment income; 6% hurdle
rate with catch-up
▪ 17.5% of realized capital gains
ORCC III SUMMARY OF KEY TERMS
FOR QUALIFIED INVESTOR USE ONLY.
SEED OPPORTUNITY OVERVIEW

FOR QUALIFIED INVESTOR USE ONLY.
▪ In order to build strong, highly aligned relationships with our key institutional investor partners,
Owl Rock has offered seed economics in its various strategies
▪ The opportunity to participate in the economics of the management company of our
BDC’s, in conjunction with an investment in the related underlying BDC
▪ Allows for profit participation in each respective business in perpetuity
Past performance is not a guarantee of future results. Information on investments in ORCC and the management company (Owl Rock Capital Holdings, or ORCH) are provided for illustrative purposes only and
are not indicative of how an investment in Owl Rock’s technology business will perform. All investments are subject to risk, including the loss of the principal amount invested. Seed round IRRs are through
12/31/19. This presentation is for informational purposes only and is not an offer or a solicitation to sell or subscribe for any fund and does not constitute investment, legal, regulatory, business,
tax, financial, accounting or other advice or a recommendation regarding any securities of Owl Rock, of any fund or vehicle managed by Owl Rock, or of any other issuer of securities.
28
A uniquely structured investment opportunity for seed investors to participate in
the continued growth and profitability of Owl Rock’s business
OWL ROCK’S APPROACH TO SEED ECONOMICS

PERFORMANCE INFORMATION
Performance Information
▪ Investor Net IRRs based on Net Asset Value ("NAV") represent the annual return rate and are based on cash flows for distributions, capital calls and equity raised, and net asset value(“NAV”) as of the end of the period presented. The calculations include the impact of management fees, performance fees (where applicable) and expenses incurred by the fund.
Index Definitions
▪ S&P LSTA Leveraged Loan Index: The S&P/LSTA Leveraged Loan Index is a market value-weighted index designed to measure the performance of the U.S. leveraged loan marketbased upon market weightings, spreads and interest payments. The Index was rolled out in 2000; it was back-loaded with four years of data dating to 1997.
▪ Credit Suisse High Yield Index: The Credit Suisse High Yield Index (USHY) is a market cap weighted benchmark index designed to mirror the investable universe of the $U.S.-denominated high yield debt market. The index aims to capture the liquid universe of high yield debt denominated in U.S. Dollars and issued by the most actively traded names in U.S.credit market. With inception date available as far back as January 1986, the Credit Suisse High Yield Index provides a comprehensive picture of the high yield debt market performance.As of 20th February 2018, the USHY index has 1,323 bonds and $881 billion in total outstanding.
29FOR QUALIFIED INVESTOR USE ONLY.

FOR QUALIFIED INVESTOR USE ONLY.
Unless otherwise indicated, the Report Date reference is 3/31/2020.
Past performance is not a guide to future results and is not indicative of expected realized returns.
This presentation contains proprietary information regarding Owl Rock Capital Partners LP (“Owl Rock”), its affiliates and investment program, funds sponsored by Owl Rock (collectively the “Owl Rock
Funds”) as well as investment held by the Owl Rocks Funds. This presentation and the information contained in this presentation is for RIC SIC purposes and may not be further reproduced or distributed
without prior written permission from Owl Rock.
The views expressed and, except as otherwise indicated, the information provided are as of the report date and are subject to change, update, revision, verification and amendment, materially or otherwise,
without notice, as market or other conditions change. Since these conditions can change frequently, there can be no assurance that the trends described herein will continue or that any forecasts are accurate.
In addition, certain of the statements contained in this presentation may be statements of future expectations and other forward-looking statements that are based on the current views and assumptions of Owl
Rock and involve known and unknown risks and uncertainties (including those discussed below) that could cause actual results, performance or events to differ materially from those expressed or implied in
such statements. These statements may be forward-looking by reason of context or identified by words such as “may, will, should, expects, plans, intends, anticipates, believes, estimates, predicts, potential or
continue” and other similar expressions. Neither Owl Rock, its affiliates, nor any of Owl Rock’s or its affiliates' respective advisers, members, directors, officers, partners, agents, representatives or employees
or any other person (collectively the “Owl Rock Entities”) is under any obligation to update or keep current the information contained in this document.
This presentation contains information from third party sources which Owl Rock has not verified. No representation or warranty, express or implied, is given by or on behalf of the Owl Rock Entities as to the
accuracy, fairness, correctness or completeness of the information or opinions contained in this presentation and no liability whatsoever (in negligence or otherwise) is accepted by the Owl Rock Entities for
any loss howsoever arising, directly or indirectly, from any use of this presentation or its contents, or otherwise arising in connection therewith.
This presentation contains case studies and other discussions of selected investments made by the Owl Rock Funds. These discussions provide descriptions and certain key aspects of such investments and
are presented for informational purposes only and are intended to illustrate Owl Rock’s sourcing experience and the profile and types of investments and investment strategies which may be pursued by Owl
Rock. The types and performance of these investments (i) are not representative of the types and performance of all investments or investment strategies that have been made or recommended by Owl Rock
and (ii) are not necessarily indicative of the types and performance of investments that Owl Rock may seek to make, or be able to make, in the future. Any future investment vehicle that Owl Rock may sponsor
or advise in the future, may pursue and consummate different types of investments in different concentrations, than those selected for illustrative purposes in this presentation. Further, references to
investments included in illustrative case studies are presented to illustrate Owl Rock’s investment processes only and should not be construed as a recommendation of any particular investment. Past
performance of any investment described in these illustrative case studies is not indicative of future results that may be obtained by any Owl Rock fund, and there can be no assurance that any such fund or
other vehicle will achieve comparable results.
Performance Information: Where performance returns have been included in this presentation, Owl Rock has included herein important information relating to the calculation of these returns as well as other
pertinent performance related definitions.
All investments are subject to risk, including the loss of the principal amount invested. These risks may include limited operating history, uncertain distributions, inconsistent valuation of the portfolio,
changing interest rates, leveraging of assets, reliance on the investment advisor, potential conflicts of interest, payment of substantial fees to the investment advisor and the dealer manager, potential illiquidity
and liquidation at more or less than the original amount invested. Diversification will not guarantee profitability or protection against loss. Performance may be volatile, and the NAV may fluctuate. There are
no guarantees investment objectives will be achieved.
This presentation is for informational purposes only and is not an offer or a solicitation to sell or subscribe for any fund and does not constitute investment, legal, regulatory, business, tax,
financial, accounting or other advice or a recommendation regarding any securities of Owl Rock, of any fund or vehicle managed by Owl Rock, or of any other issuer of securities. Only a Private
Placement Memorandum for the relevant Owl Rock Fund can make such an offer. Neither the Securities and Exchange Commission, the Attorney General of the State of New York nor any state securities
commission has approved or disapproved of these securities or determined if the Private Placement Memorandum is truthful or complete. Any representation to the contrary is a criminal offense. Capital
commitments may be solicited through Owl Rock Capital Securities LLC, member of FINRA/SIPC, as Dealer Manager.
Copyright© Owl Rock Capital Partners LP 2020. All rights reserved. This presentation and the information contained in this presentation is for RIC SIC purposes and may not be further reproduced ordistributed without prior written permission from Owl Rock. It is delivered on an “as is” basis without warranty or liability. All individual charts, graphs and other elements contained within the information arealso copyrighted works and may be owned by a party other than Owl Rock. By accepting the information, you agree to abide by all applicable copyright and other laws, as well as any additional copyrightnotices or restrictions contained in the information.
30
IMPORTANT INFORMATION