presentation to credit investors - homepage - fresenius · 2020. 1. 15. · this presentation...
TRANSCRIPT

Presentation to Credit Investors
November 2019
Frankfurt stock exchange FRE US ADR program FSNUY wwwfreseniuscominvestors
Safe Harbor Statement
This presentation contains forward-looking statements that are subject to various risks and uncertainties Future results could differ materially from those described in these forward-looking statements due to certain factors eg changes in business economic and competitive conditions regulatory reforms results of clinical trials foreign exchange rate fluctuations uncertainties in litigation or investigative proceedings and the availability of financing Fresenius does not undertake any responsibility to update the forward-looking statements contained in this presentation
2General Credit Presentation November 2019 copy Fresenius SE amp Co KGaA Investor Relations
A Global Leader in Health Care Products and Services
~euro335 bn in Saleseuro31 bn net income1
(as of Dec 31 2018)
Global presence in 100+ countries
Long-term opportunities in growing non-cyclical markets
Strong financial performance and cash flow generation
1 Net income incl attributable to non-controlling interest
Leading market positions
Diversified revenue base with four strong business segments
General Credit Presentation November 2019 copy Fresenius SE amp Co KGaA Investor Relations 3
Strong and Balanced Health Care Portfolio
General Credit Presentation November 2019 copy Fresenius SE amp Co KGaA Investor Relations
Ownership ~31 Ownership 100 Ownership 100 Ownership 77
Dialysis ProductsHealth Care Services
Hospital Supplies Hospital Operation Projects and Services for Hospitals
bull Dialysis servicesbull Hemodialysis productsbull Peritoneal dialysis productsbull Care coordination
Sales 2018 euro165 bn
bull IV drugsbull Biosimilarsbull Clinical nutritionbull Infusion therapybull Medical devices
Transfusion technology
Sales 2018 euro65 bn
bull Acute carebull Outpatient services
Sales 2018 euro90 bn1
bull Post-acute carebull Project development amp
Planningbull Turnkey constructionbull Maintenance amp Technical
and total operational management
Sales 2018 euro17 bn1
4
1 Reflects the transfer of German post-acute care business from Fresenius Helios to Fresenius Vamed as of July 1 2018
Fresenius Group Global Sales Base in Growing Non-Cyclical Markets
General Credit Presentation November 2019 copy Fresenius SE amp Co KGaA Investor Relations 5
euro335 bn
2018 Sales by Region Sales in euro bn
Europe 43
North America 42
Asia-Pacific 10
Latin America 4
Africa 1 9
CAGR
195 205
235
280295
339 335
2012 2013 2014 2015 2016 2017 2018
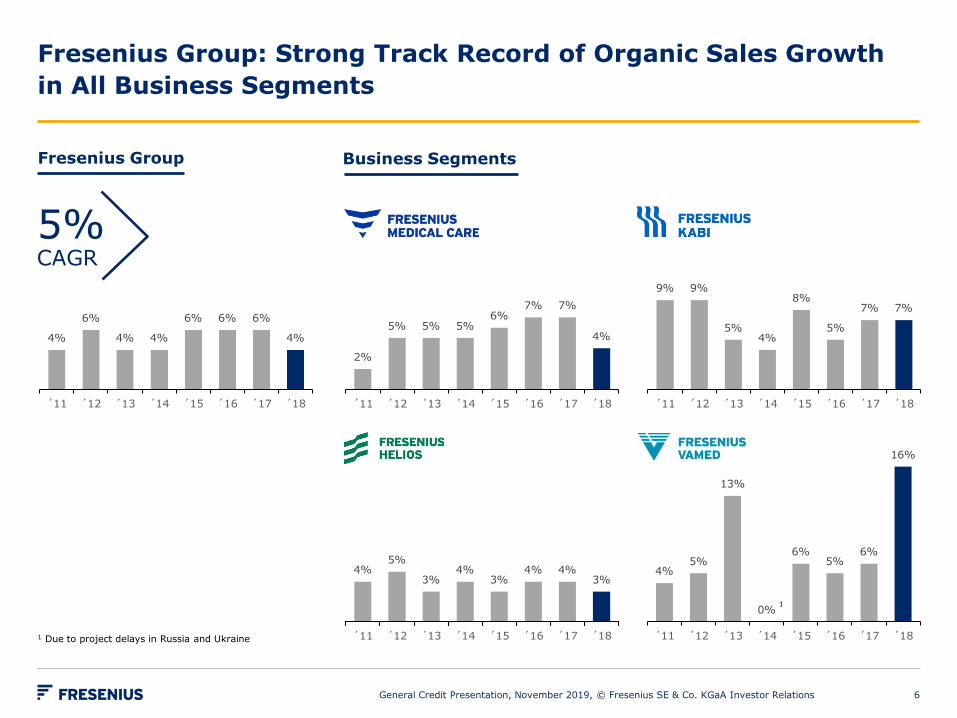
Diagramm1
Tabelle1
45
13
0
65
6
16
acute11 acute12 acute13 acute14 acute15 acute16 acute17 acute18
Fresenius Group Strong Track Record of Organic Sales Growth in All Business Segments
General Credit Presentation November 2019 copy Fresenius SE amp Co KGaA Investor Relations 6
1 Due to project delays in Russia and Ukraine
Fresenius Group Business Segments
5CAGR
1
4
6
4 4
6 6 6
4
acute11 acute12 acute13 acute14 acute15 acute16 acute17 acute18
2
5 5 56
7 7
4
acute11 acute12 acute13 acute14 acute15 acute16 acute17 acute18
9 9
54
8
5
7 7
acute11 acute12 acute13 acute14 acute15 acute16 acute17 acute18
45
34
34 4
3
acute11 acute12 acute13 acute14 acute15 acute16 acute17 acute18
39 39 41
5155
6360
2012 2013 2014 2015 2016 2017 2018
Fresenius Group Strong Track Record of EBITDA Generation
General Credit Presentation November 2019 copy Fresenius SE amp Co KGaA Investor Relations 7
50
24
224
2018 EBITDA by Business Segment EBITDA1 in euro bn
euro60 bn
7CAGR
1 Before special items
| Sales | |||
| 2012 | 195 | ||
| 2013 | 205 | ||
| 2014 | 235 | ||
| 2015 | 280 | ||
| 2016 | 295 | ||
| 2017 | 339 | ||
| 2018 | 335 | ||
| CAGR | |||
| 172 | |||
| 94 |
| 2012 | |
| 2013 | |
| 2014 | |
| 2015 | |
| 2016 | |
| 2017 | |
| 2018 |

Tabelle1
45
13
0
65
6
16
acute11 acute12 acute13 acute14 acute15 acute16 acute17 acute18
Fresenius Group Strong Track Record of Organic Sales Growth in All Business Segments
General Credit Presentation November 2019 copy Fresenius SE amp Co KGaA Investor Relations 6
1 Due to project delays in Russia and Ukraine
Fresenius Group Business Segments
5CAGR
1
4
6
4 4
6 6 6
4
acute11 acute12 acute13 acute14 acute15 acute16 acute17 acute18
2
5 5 56
7 7
4
acute11 acute12 acute13 acute14 acute15 acute16 acute17 acute18
9 9
54
8
5
7 7
acute11 acute12 acute13 acute14 acute15 acute16 acute17 acute18
45
34
34 4
3
acute11 acute12 acute13 acute14 acute15 acute16 acute17 acute18
39 39 41
5155
6360
2012 2013 2014 2015 2016 2017 2018
Fresenius Group Strong Track Record of EBITDA Generation
General Credit Presentation November 2019 copy Fresenius SE amp Co KGaA Investor Relations 7
50
24
224
2018 EBITDA by Business Segment EBITDA1 in euro bn
euro60 bn
7CAGR
1 Before special items
| Sales | |||
| 2012 | 195 | ||
| 2013 | 205 | ||
| 2014 | 235 | ||
| 2015 | 280 | ||
| 2016 | 295 | ||
| 2017 | 339 | ||
| 2018 | 335 | ||
| CAGR | |||
| 172 | |||
| 94 |

45
13
0
65
6
16
acute11 acute12 acute13 acute14 acute15 acute16 acute17 acute18
Fresenius Group Strong Track Record of Organic Sales Growth in All Business Segments
General Credit Presentation November 2019 copy Fresenius SE amp Co KGaA Investor Relations 6
1 Due to project delays in Russia and Ukraine
Fresenius Group Business Segments
5CAGR
1
4
6
4 4
6 6 6
4
acute11 acute12 acute13 acute14 acute15 acute16 acute17 acute18
2
5 5 56
7 7
4
acute11 acute12 acute13 acute14 acute15 acute16 acute17 acute18
9 9
54
8
5
7 7
acute11 acute12 acute13 acute14 acute15 acute16 acute17 acute18
45
34
34 4
3
acute11 acute12 acute13 acute14 acute15 acute16 acute17 acute18
39 39 41
5155
6360
2012 2013 2014 2015 2016 2017 2018
Fresenius Group Strong Track Record of EBITDA Generation
General Credit Presentation November 2019 copy Fresenius SE amp Co KGaA Investor Relations 7
50
24
224
2018 EBITDA by Business Segment EBITDA1 in euro bn
euro60 bn
7CAGR
1 Before special items

Diagramm1
Tabelle1
002
023 025029
032037
042044
055
062
93 08 09 10 11 12 13 14 15 16 17 18
25 2421 20 21 21 22 21 22 23 24
Fresenius SE Earnings-Linked Dividend Policy
General Credit Presentation November 2019 copy Fresenius SE amp Co KGaA Investor Relations 8
euro per share
bull Dividend growth aligned to EPS1
growth
bull Pay-out Ratio 20 to 25
Dividend distribution (eurom)
Pay-out Ratio
075
2018 Pay-out Ratio 24 Dividend Policy
122 140 155 196 225 238 300 416114 343 445
080
1 Before special items
Global Health Care Trends ndash Strong Growth Fundamentals
9
1 WHO 10 facts on aging and the life course2 World Bank Health expenditure per capita3 World Economic Forum Health Systems Leapfrogging in Emerging Economies ndash Project Paper (2014)
General Credit Presentation November 2019 copy Fresenius SE amp Co KGaA Investor Relations
60+ Aging population and higher incidence of chronic diseasesWorld population age 60+ will reach gt2bn by 20501
Increasing health expenditure per capita 2014 vs 1999 ndash USA $9403 (+108) China $420 (+977) India $75 (+317)2
13 By 2022 one third of all global health expenditure will occur in Emerging Economies3
Fresenius Medical Care Global Dialysis Market Leader
bull The worldrsquos leading provider of dialysis products and services treating more than 342000 patients1
in 4003 clinics1
bull Provide highest standard of product quality and patient care
bull Expansion in Care Coordination and global dialysis service opportunities enter new geographies
Global Dialysis Market 2018 bull ~euro71 bnbull ~6 patient growth pa
Growth Drivers bull Aging population increasing incidence of diabetes
and high blood pressure treatment quality improvements
International30
Sales 2018euro165 bn North America
70
Dialysis products
Dialysis services
Complete therapy offerings
1 As of September 30 2019
Market Dynamics
10General Credit Presentation November 2019 copy Fresenius SE amp Co KGaA Investor Relations
21292409
25622306
15 16 17 18
15455
16570
17784
16547
15 16 17 18
Fresenius Medical Care Sales and EBIT development
General Credit Presentation November 2019 copy Fresenius SE amp Co KGaA Investor Relations 11
EBIT1 in euro millionSales in euro million
1 Before special items
Fresenius Kabi A Leading Global Hospital Supplier
bull Comprehensive product portfolio for critically and chronically ill patients
bull Strong Emerging Markets presencebull Leading market positions in four product
segments
bull Focus on organic growth through geographic product rollouts and new product launches
bull Development of biosimilars with a focus on oncology and autoimmune diseases
Global Addressable Market 2018 bull ~euro81 bnGrowth Drivers bull Patent expirations rising demand for health care
services higher health care spending in Emerging Markets
Market Dynamics
Emerging Markets30
Sales 2018euro65 bn Europe 34
North America 36
Generic IV Drugs
Clinical Nutrition
Infusion Therapy
Medical Devices Transfusion Technology
Biosimilars
12General Credit Presentation November 2019 copy Fresenius SE amp Co KGaA Investor Relations
1197
1171 1177
1139
15 16 17 18
59506007
6358
6544
15 16 17 18
Fresenius Kabi Sales and EBIT development
General Credit Presentation November 2019 copy Fresenius SE amp Co KGaA Investor Relations 13
Sales in euro million EBIT1 in euro million
1 Before special items
bull ~51 share in German acute care hospital market
bull Organic growth based on growing number ofadmissions and reimbursement rate increases
bull Ranks as quality leader in the German hospital sector defined quality targets publication of medical treatment results peer review processes
bull Key medical indicators eg mortality rate for heart failure pneumonia below German average
86 hospitals~29000 beds~12 million inpatient
admissions pa~41 million outpatient
admissions pa1 Based on sales 2 German Federal Statistical Office 2018 total costs gross of the German hospitals
less academic research and teaching As of September 30 2019
Fresenius Helios Europersquos Largest Private Hospital OperatorHelios Germany
German Acute Care Hospital Market bull ~euro102 bn2
Growth Drivers bull Aging population leading to increasing
hospital admissions
Largest network amp nationwide presence
Acute Care
Market Dynamics
Outpatient
14General Credit Presentation November 2019 copy Fresenius SE amp Co KGaA Investor Relations
bull ~euro30 bn sales in 2018
bull ~121 share in Spanish private hospital market
bull Market leader in size and quality with excellent growth prospects
bull Broad revenue base with privately insured patients PPPs self-pay and Occupational Risk Prevention (ORP)
bull Strong management team with proven track record
bull Cross-selling opportunities
Fresenius Helios Europersquos Largest Private Hospital Operator Helios Spain
Spanish Private Hospital Market bull ~euro14 bn2
Growth Drivers bull Aging population increasing number of privately
insured patients greenfield projects market consolidation
Quiroacutensalud hospitals in every major metropolitan region of Spain
Acute Care
Occupational Risk Prevention
Outpatient
1 Based on sales2 Market data based on company research Market definition does neither include
Public Private Partnerships (PPP) nor Occupational Risk Prevention centers (ORP)
Market Dynamics
As of September 30 2019
50 hospitals ~7000 beds~04 m inpatientadmissions pa~129 m outpatient admissions pa
15General Credit Presentation November 2019 copy Fresenius SE amp Co KGaA Investor Relations
642 683
1052 1052
15 16 17 18
5578 5843
8668 8993
15 16 17 18
Fresenius Helios Sales and EBIT development
General Credit Presentation November 2019 copy Fresenius SE amp Co KGaA Investor Relations 16
Sales in euro million EBIT in euro million
2017 11 months contribution of Helios Spain (Quiroacutensalud)1 Before special items
bull Manages hospital constructionexpansion projects and provides services for health care facilities worldwide
bull Offers project development planning turnkey construction maintenance as well as technical management and total operational management
bull Strong track record More than 900 projects in over 90 countries completed
bull Leading European post-acute care provider operating in five European countries
Fresenius Vamed Leading Global Hospital Projects and Services Specialist
Market Dynamics
Growth Drivers bull Emerging Market demand for building and
developing hospital infrastructurebull Outsourcing of non-medical services from public to
private operators
Emerging Markets22
Sales 2018euro17 bn Europe 78
Projects
Services
Post-acute care
17General Credit Presentation November 2019 copy Fresenius SE amp Co KGaA Investor Relations
1118
1160
1228
15 16 17 18
1688
6469
76
110
15 16 17 18
Fresenius Vamed Sales an EBIT development
General Credit Presentation November 2019 copy Fresenius SE amp Co KGaA Investor Relations 18
EBIT in euro millionSales in euro million
Fresenius Group Key Figures
General Credit Presentation November 2019 copy Fresenius SE amp Co KGaA Investor Relations 19
eurom 20181 20171 Growth (cc)5
Sales 33530 33886 6
EBITDA 5991 6267 0Margin 179 185
EBIT 4561 4830 -1Margin 136 143
Interest net -570 -652 7
EBT 3991 4178 0
Taxes -880 -1168 21
Net Income3 3111 3010 8
Employees4 276750 273249
1 Before special items2 4 organic growth 2 acquisitions 0 divestitures -4 currency effects 3 Net income incl attributable to non-controlling interest4 As of December 315 Adjusted for IFRS and divestitures of Care Coordination activities
Cash Flow Development by Business Segment
General Credit Presentation November 2019 copy Fresenius SE amp Co KGaA Investor Relations 20
1 Before acquisitions and dividends2 Margin incl FMC dividend3 Understated 17 excluding euro30 million of capex commitments from acquisitions
Operating CF Capex (net) Free Cash Flow1
eurom 2018 Margin 2018 Margin 2018 Margin
1040 159 -553 -85 487 74
554 62 -434 -49 120 133
106 63 -29 -17 77 46
CorporateOther -20 na -58 na -78 na
1680 1042 -1074 -63 606 412
2062 125 -1003 -61 1059 64
3742 112 -2077 -62 16654 50
Excl FMC
Group
Margin = in of sales
48 48 4852 53
5855 55 54
65
3
4
5
6
7
8
2009 2010 2011 2012 2013 2014 2015 2016 2017 2018
Fresenius Group Consistent Cash Generation
Capex gross in of sales
FCF margin (before acquisitions amp dividends)CFFO margin
21General Credit Presentation November 2019 copy Fresenius SE amp Co KGaA Investor Relations
110
120
103
126
114
109
120 122
116
112
8
9
10
11
12
13
14
2009 2010 2011 2012 2013 2014 2015 2016 2017 2018
63
74
56
76
62
52
67 67 66
50
3
4
5
6
7
8
9
2009 2010 2011 2012 2013 2014 2015 2016 2017 2018
Fresenius Group Proven Track Record of Deleveraging
22
Net DebtEBITDA1
1 At actual FX rates for both Net Debt and EBITDA before special items pro forma closed acquisitionsdivestitures2 Pro forma excluding advances made for the acquisition of hospitals from Rhoumln-Klinikum AG3 Calculated at actual FX rates for both net debt and EBITDA including acquisition of the NxStage excluding IFRS 16 effect (comparable to updated guidance from May 2 2019)4 Calculated at expected annual average exchange rates for both net debt and EBITDA including acquisition of NxStage without potential unannounced acquisitions adjusted for
IFRS 16 effects (comparable to updated guidance from May 2 2019)
32x
30x
27x
22x 23x
35x
30x
26x
36x
30x
26x
28x
25x 25x
34x
27x
24x
28x
27x
32x3
20
30
40
2001 2002 2003 2004 2005 Q106 2006 2007 2008 2009 2010 2011 2012 2013 2014 2015 2016 2017 2018 Q3192
Target 20194 around the upper-end of self-imposed target corridor of 25 ndash 30x
Hospitals from
General Credit Presentation November 2019 copy Fresenius SE amp Co KGaA Investor Relations
4
Fresenius Group Capitalization ndash September 30 2019 excl IFRS 16
23
1 Based on market capitalization for FSE and FMC as of September 30 20192 Before acquisition-related expenses Pro Forma acquisitions3 EURUSD exchange rate as of September 30 2019 except for market capitalization which uses the exchange rate as of September 30 2019
Instrument per Book Value in euro million in $ million3 oftotal cap EBITDA LTM x
Syndicated Credit Agreement Revolver (euro US-$) 229 249 04 Syndicated Credit Agreement Term Loan A (euro US-$) 2029 2209 36 Bonds (euro US-$) 5516 6006 98 Convertible Bonds 463 504 08 Schuldschein Loans 2191 2386 39 Commercial Paper 1000 1089 18 Other debt 836 910 15 Total Debt (FSE excl FMC) gross 12264 13354 218 Cash (excl FMC) 917 999 16 Total debt (FSE excl FMC) net 11347 12356 201 Total FMC debt net 8246 8979 146 Consolidation Adjustments (78) (85)Total consolidated debt net 19515 21250 346 32x Market capitalization1 36859 40136 654 60x
Total capitalization 56374 61386 1000 92x FSE Group EBITDA2 6100
General Credit Presentation November 2019 copy Fresenius SE amp Co KGaA Investor Relations
4
Fresenius Group Capitalization ndash September 30 2019 incl IFRS 16
24
1 Based on market capitalization for FSE and FMC as of September 30 20192 Before acquisition-related expenses Pro Forma acquisitions3 EURUSD exchange rate as of September 30 2019 except for market capitalization which uses the exchange rate as of September 30 2019
Instrument per Book Value in euro million in $ million3 oftotal cap EBITDA LTM x
Syndicated Credit Agreement Revolver (euro US-$) 229 249 04 Syndicated Credit Agreement Term Loan A (euro US-$) 2029 2209 33 Bonds (euro US-$) 5516 6006 89 Convertible Bonds 463 504 07 Schuldschein Loans 2191 2386 35 Commercial Paper 1000 1089 16 Lease Obligations 1749 1904 28 Other debt 653 711 10 Total Debt (FSE excl FMC) gross 13830 15059 222 Cash (excl FMC) 917 999 15 Total debt (FSE excl FMC) net 12913 14061 207 Total FMC debt net 12704 13833 204 Consolidation Adjustments (203) (221) (03)Total consolidated debt net 25414 27673 408 36x Market capitalization1 36859 40136 592 52x
Total capitalization 62273 67810 1000 88x FSE Group EBITDA2 7064
General Credit Presentation November 2019 copy Fresenius SE amp Co KGaA Investor Relations
Fresenius Group Broad Mix of Financing Instruments
General Credit Presentation November 2019 copy Fresenius SE amp Co KGaA Investor Relations 25
Commercial Paper 9
Other financial Liabilities 13
Syndicated loans 22 Bonds 42
Equity-neutralconvertible bonds 4
Total BS Debt1
~euro21114 m
1 As of September 30 2019 adjusted for IFRS 16 effect
bull Optimize funding costs and ensure financial flexibility
bull Diversify investor base
bull Strong liquidity provided by sufficient financial cushion (~euro29 billion as of September 30 2019)
Well Positioned to Meet Financing NeedsSchuldschein Loans 10
Average interest ratecost of debt22 pa
26
Fresenius GroupDebt Maturity Profile ndash September 30 201912
1 Based on utilization of major financing instruments2 Excluding IFRS 16 adjustments
eurom
General Credit Presentation November 2019 copy Fresenius SE amp Co KGaA Investor Relations
779
1653 1704
2384
367 500 459
637
1163
1944
2260
708
2071
500
238
907
584
5000
1000
2000
3000
4000
5000
2019 2020 2021 2022 2023 2024 2025 2026 2027 2028 2029 2030 2031 2032
Fresenius Medical Care Fresenius excl Fresenius Medical Care
Maturity 32 years on
average
Fresenius Group excl Fresenius Medical CareDebt Maturity Profile ndash September 30 201912
27General Credit Presentation November 2019 copy Fresenius SE amp Co KGaA Investor Relations
1 Based on utilization of major financing instruments2 Excluding IFRS 16 adjustments
eurom
500726 700
276
1150
500700
500 500
39
155
9051167
106
314
393
432
421
238
207
84
500
598
402
0
500
1000
1500
2000
2500
2019 2020 2021 2022 2023 2024 2025 2026 2027 2028 2029 2030 2031 2032
Bonds Syndicated Loan Schuldschein Loans Equity-neutral convertible bonds Commercial Paper
Maturity 37 years on
average
23 23 23 23
34 32 36 33
43 45 41 44
Dec 31 15 Dec 31 16 Dec 31 17 Dec 31 18
Equity and noncontrolling interest Debt Other liabilities
Fresenius Group Solid Balance Sheet Structure
Healthy Equity and Liability Split
bull Strong equity ratio of gt40 on average
bull Equity ratio kept in narrow range despite rapid growth of Fresenius Group
General Credit Presentation November 2019 copy Fresenius SE amp Co KGaA Investor Relations 28
432 467 531 567
BS total (eurobn)
Fresenius Group Strong Access to Capital Markets
29
Major Financing Instruments
2009 2010 2011 2012 2013 2014 2015 2016 2017 2018 2019
Bondseuro425 m$500 m
euro250 m euro800 m$105 bn
euro750 m$15 bn
euro500 m euro12 bn$12 bn
$300 m euro26 bn euro500 m euro10 bn$500 m1
SyndicatedLoans
$35 bn $898 m $385 bn $18 bneuro245 bn
$41 bneuro700 m
$115 bneuro205 bn
euro530 bn$355 bn
euro100sup2
SchuldscheinLoans
euro200 m euro400 m euro125 m euro500 m euro112 m $400 m euro10 bn euro700 msup3
Convertible Bonds
euro900 m euro500 m
Equityeuro10 bn euro400 m
1 June 2019 new $500 million 2019-2029 Bond issued by Fresenius Medical Care amp Co KGaA2 August 2019 euro100 million increased Revolving Facilities of Fresenius SE amp Co KGaA3 September 2019 new euro700 million 2019-202320262029 Schuldschein Loan issued by Fresenius SE amp Co KGaA
General Credit Presentation November 2019 copy Fresenius SE amp Co KGaA Investor Relations
Fresenius SE Rating History amp Rationale
General Credit Presentation November 2019 copy Fresenius SE amp Co KGaA Investor Relations 30
ldquoFSE delivers solid organic growth thanks to positive underlying growth trends in the life-saving and life-sustaining products and therapies that the group offersrdquo SampP Jan 08 2019
ldquoFSErsquos rating remains anchored in investment-grade given its mature and defensive business risk profile the grouprsquos deleveraging ability based on free cash flow generation and its record of integrating acquisitions successfully and reducing financial leverage in line with communicated policiesrdquo Fitch Sep 20 2018
ldquoThe Baa3 long term issuer rating of FSE reflects its strong defensive business profile underpinned by large absolute scale global footprint and segmental diversification within the healthcare market supported by strong position in its four business segmentsrdquo Moodyrsquos May 15 2018
Rating History Rating Agenciesrsquo Key Statements
In May 2019 SampP upgraded Fresenius to BBB with stable outlook
SampP Moodylsquos Fitch
Corporate Credit Rating BBB Baa3 BBB-
Outlook stable stable stable
Current Credit Ratings
Fresenius Group 2019 Financial Outlook by Business Segment
General Credit Presentation November 2019 copy Fresenius SE amp Co KGaA Investor Relations 31
eurom (except otherwise stated) FY18 Base1 FY19e2
Sales growth3 (cc) 16026 3 ndash 7
Net income growth34 (cc) 1341 -2 to 2
Sales growth (organic) 6544 3 ndash 6
EBIT growth (cc) 1139 3 ndash 6
Sales growth (organic) 8993 2 ndash 5
EBIT 1052 -5 to -2
Sales growth (organic) 1688 ~10
EBIT growth 110 15 ndash 20
1 Before special items and after adjustments2 Before special items (transaction-related expenses expenses associated with cost optimization program at FMC revaluations of biosimilars contingent liabilities) adjusted for IFRS 16 effect3 Excluding effects from NxStage transaction4 Net income attribuitable to shareholders of Fresenius Medical Care AG amp Co KGaA
For a detailed overview of adjustments and special items please see the reconciliation tables on slides 48-69 and for the bases
eurom (except otherwise stated) FY18 Base1 FY192
Sales growth (cc) 33009 4 - 7
Net income3 growth (cc) 1872 ~0
Fresenius Group 2019 Financial Guidance
1 Before special items and after adjustments2 Excluding transaction-related expenses expenses associated with the cost optimization program at FMC revaluations of biosimilars contingent liabilities including operating results of
NxStage adjusted for IFRS 16 effects3 Net income attributable to shareholders of Fresenius SEampCo KGaA
For a detailed overview of adjustments and special items please see the reconciliation tables on slides 48-69 and for the bases
32General Credit Presentation November 2019 copy Fresenius SE amp Co KGaA Investor Relations
Fresenius Group Healthy Growth Targets 2020 ndash 2023 (CAGRs)
General Credit Presentation November 2019 copy Fresenius SE amp Co KGaA Investor Relations 33
Organic sales growth 4 ndash 7 (plus ~1 small tomid-size acquisitions)
Organic net income1 growth 5 ndash 9 (plus ~1 small tomid-size acquisitions)
1 Net income attributable to shareholders of Fresenius SEampCo KGaA
Before special items
FY18 base for Fresenius Group Guidance FY19
General Credit Presentation November 2019 copy Fresenius SE amp Co KGaA Investor Relations 34
eurom
Sales reported 33530
Divestitures of Care Coordination activities at FMC (H118) -521
Sales basis for growth rates 33009
Net Income reported 2027
Transaction Costs Akorn Biosimilars 25
Bridge Financing Costs Akorn 12
Revaluations of Biosimilars contingent liabililties 5
Impact of FCPA related charge 9
Gain related to divestitures of Care Coordination activities -207
Net income (before special items) 1871
Divestitures of Care Coordination activities at FMC (H118) 1
Net income basis for growth rates (before special items and after adjustments) 1872
FY18 base for Fresenius Medical Care Outlook FY19
General Credit Presentation November 2019 copy Fresenius SE amp Co KGaA Investor Relations 35
eurom
Sales reported 16547
Divestitures of Care Coordination activities at FMC (H118) -521
Sales basis for growth rates 16026
Net Income reported 1982
Impact of FCPA related charge 28
Gain related to divestitures of Care Coordination activities -673
Net income (before special items) 1337
Divestitures of Care Coordination activities at FMC (H118) 4
Net income basis for growth rates (before special items and after adjustments) 1341
FY18 base for Fresenius Kabi Outlook FY19
General Credit Presentation November 2019 copy Fresenius SE amp Co KGaA Investor Relations 36
eurom
Sales basis for growth rates 6544
Transaction Costs Akorn Biosimilars 34
Revaluations of Biosimilars contingent liabililties 7
EBIT (before special items = base for Kabi guidance) 1139
The special items are reported in the Group CorporateOther segment
IFRS 16 effect on Group PampL
General Credit Presentation November 2019 copy Fresenius SE amp Co KGaA Investor Relations
eurom
Q319 before
special items adjusted for
IFRS 16 effect IFRS 16 effect
Q319 before
special itemsaccording to
IFRS 16
Q1-319 before
special items adjusted for
IFRS 16 effect IFRS 16 effect
Q1-319 before
special itemsaccording to
IFRS 16
Sales 8877 -35 8842 26173 -75 26098
EBITDA 1526 237 1763 4468 699 5167
Depreciation and amortization -396 -214 -610 -1146 -620 -1766
EBIT 1130 23 1153 3322 79 3401
Net interest -124 -47 -171 -379 -153 -532
Income taxes -232 5 -227 -680 18 -662
Noncontrolling interest -321 11 -310 -865 31 -834
Net income1 453 -8 445 1398 -25 1373
37
1 Net income attributable to shareholders of Fresenius SE amp Co KGaA
IFRS 16 effect on Group Balance Sheet and Cash Flow
General Credit Presentation November 2019 copy Fresenius SE amp Co KGaA Investor Relations
eurom
Sep 30 2019adjusted for
IFRS 16 effect IFRS 16 effect
Sep 30 2019according to
IFRS 16
Right-of-use-assets 1901 5667 5857Lease liabilities 4142 5899 6313Equity 26928 -232 26696Total assets 61092 5667 66759
38
1 Reclassification from machinery equipment and rental equipment under capital leases as of December 31 20182 Reclassifications from capital lease obligations and other liabilities as of December 31 2018
eurom
Q319adjusted for
IFRS 16 effect IFRS 16 effect
Q319according to
IFRS 16
Q1-319adjusted for
IFRS 16 effect IFRS 16 effect
Q1-319according to
IFRS 16
Operating cash flow 1298 185 1483 2439 538 2977Cash flow before acquisitions and dividends 722 185 907 850 538 1388
Free cash flow 547 185 732 -2172 538 -1634Cash provided byused for financing activities -461 -185 -646 995 -538 457
Balance Sheet
Cash Flow
Fresenius Group Credit Highlights
General Credit Presentation November 2019 copy Fresenius SE amp Co KGaA Investor Relations 39
Consistent Cash Generation
Proven Track Record of Deleveraging Following Acquisitions
Broad Mix of Financing Instruments
Well-Balanced Maturity Profile
Solid Balance Sheet Structure
Strong Access to Capital Markets
Attachments
General Credit Presentation November 2019 copy Fresenius SE amp Co KGaA Investor Relations 40
Fresenius Group Key Figures
General Credit Presentation November 2019 copy Fresenius SE amp Co KGaA Investor Relations 41
1 2018 and 2017 before special items 2018 2017 and 2016 pro forma acquisitionsdivestitures2 2018 and 2017 before special items 3 2016 pro forma Quiroacutensalud acquisition 3154 2016 pro forma Quiroacutensalud acquisition 309
2018 2017 2016
Debt (eurom) thereof US$ denominated
1898428
1904231
1478052
Net debt (eurom) 16275 17406 13201
Net debtEBITDA13
Net debt at year-end exchange rate EBITDA at LTM average FX rates
273 279 239
Net debtEBITDA14
at LTM average FX rates for both net debt and EBITDA
271 284 233
Operating Cash flowSales 112 116 122
EBITDAInterest2 105 96 95
42
Fresenius Group Debt and Cash Flow Structure ndash Sep 30 2019 adj for IFRS 16
Fresenius Medical Care
Financing
Fresenius SE Financing
Group Net Debt ~euro195 bn1
DividendsRents Service Agreements
~313 100 77100
- euro306 m Net Debt4 euro63 m Net Debt4 euro32 m Net Debt4euro8246 m Net Debt4
Profit transfer Agreements6
bull Separate financing of Fresenius SE and Fresenius Medical Care
bull No joint financing facilities or mutual guarantees
bull Fresenius Kabi Fresenius Helios and Fresenius Vamed financed primarily through Fresenius SE to avoid structural subordination
FSE Net Debt~euro113 bn
incl Net Debt of KabiHeliosVamed
StockMarketValue~euro58 bn5 FSE Net Debt2
~euro115 bn
1 Incl consolidation adjustments2 Incl Fresenius financing subsidiaries3 Controlling stake4 Incl subsidiaries 5 Based on market capitalization for FMC as of September 30 20196 Via German holding entities (Fresenius Kabi AG and Fresenius ProServe GmbH)
General Credit Presentation November 2019 copy Fresenius SE amp Co KGaA Investor Relations
43
Fresenius Group Debt and Cash Flow Structure ndash Sep 30 2019 accord to IFRS 16
1 Incl consolidation adjustments2 Incl Fresenius financing subsidiaries3 Controlling stake4 Incl subsidiaries 5 Based on market capitalization for FMC as of September 30 20196 Via German holding entities (Fresenius Kabi AG and Fresenius ProServe GmbH)
Fresenius Medical Care
Financing
Fresenius SE Financing
Group Net Debt ~euro254 bn1
DividendsRents Service Agreements
~313 100 77100
euro50 m Net Debt4 euro921 m Net Debt4 euro331 m Net Debt4euro12704 m Net Debt4
Profit transfer Agreements6
bull Separate financing of Fresenius SE and Fresenius Medical Care
bull No joint financing facilities or mutual guarantees
bull Fresenius Kabi Fresenius Helios and Fresenius Vamed financed primarily through Fresenius SE to avoid structural subordination
FSE Net Debt~euro127 bn
incl Net Debt of KabiHeliosVamed
StockMarketValue~euro58 bn5 FSE Net Debt2
~euro114 bn
General Credit Presentation November 2019 copy Fresenius SE amp Co KGaA Investor Relations
Fresenius Group Cash Flow
General Credit Presentation November 2019 copy Fresenius SE amp Co KGaA Investor Relations 44
eurom 2018 Margin 2017 Margin Δ YoY
Operating Cash Flow 3742 112 3937 116 -5
Capex (net) -2077 -62 -1705 -50 -22
Free Cash Flow(before acquisitions and dividends)
1665 50 2232 66 -25
Acquisitions (net) -613 -5865 --
Dividends -904 -924 2
Free Cash Flow(after acquisitions and dividends)
-1374 -41 -4557 -134 --
Fresenius Group Financial Results by Business Segment
General Credit Presentation November 2019 copy Fresenius SE amp Co KGaA Investor Relations 45
2018 2017 2016 Growth2
20182017
Sales euro16547 m euro17784 m euro16570 m 41
EBIT euro2306 m euro2562 m euro2409 m 61
Sales euro6544 m euro6358 m euro6007 m 7
EBIT euro1139 m euro1177 m euro1171 m 2
Sales euro8993 m euro8668 m euro5843 m 6
EBIT euro1052 m euro1052 m euro683 m 3
Sales euro1688 m euro1228 m euro1160 m 19
EBIT euro110m euro76 m euro69 m 9
Sales euro33530 m euro33886 m euro29471 m 6
EBIT euro4561 m euro4830 m euro4302 m -1Group
2018 and 2017 before special items
1 FMC on a comparable basis2 Growth rates at constant currency and after adjustments
Fresenius Group Margins by Business Segment
General Credit Presentation November 2019 copy Fresenius SE amp Co KGaA Investor Relations 46
2018 and 2017 before special items
2018 2017 2016
EBITDA margin 183 185 188
EBIT margin 139 144 145
EBITDA margin 219 233 244
EBIT margin 174 185 195
EBITDA margin 159 165 150
EBIT margin 117 121 117
EBITDA margin 79 71 69
EBIT margin 65 62 59
EBITDA margin 179 185 187
EBIT margin 136 143 146Group
Fresenius SE amp Co KGaA Overview Bonds
General Credit Presentation November 2019 copy Fresenius SE amp Co KGaA Investor Relations 47
Issuer Volume(in millions)
Coupon type
Coupon (in )
MaturityTerm
ISIN (RegS)
WKN
Fresenius SE amp Co KGaAeuro500 Fix 2875 20132020 XS0873432511 A1HEWZ
Fresenius SE amp Co KGaAeuro450 Fix 300 20142021 XS1013955379 A1ZB7H
Fresenius SE amp Co KGaAeuro450 Fix 400 20142024 XS1026109204 A1ZC60
Fresenius SE amp Co KGaAeuro 500 Fix 1875 20192025 XS1936208252 A2NBMS
Fresenius SE amp Co KGaAeuro 500 Fix 2875 20192029 XS1936208419 A2NBMT
Fresenius Finance Ireland plceuro700 Fix 0875 20172022 XS1554373164 A19B3F
Fresenius Finance Ireland plceuro700 Fix 150 20172024 XS1554373248 A19B3G
Fresenius Finance Ireland plceuro700 Fix 2125 20172027 XS1554373677 A19B3H
Fresenius Finance Ireland plceuro500 Fix 300 20172032 XS1554373834 A19B3J
Fresenius US Finance II IncUS$300 Fix 425 20142021 USU31436AG04 A1ZDVJ
Fresenius US Finance II IncUS$300 Fix 450 20152023 USU31436AH86 A1Z64A
Fresenius Group Reconciliation
General Credit Presentation November 2019 copy Fresenius SE amp Co KGaA Investor Relations
eurom Q319 Q318 growthrate
growthrate (cc)
Sales reported 8842 8192 8 6Divestitures of Care Coordination activities at FMC - -7
IFRS 16 effect 35 -
Sales on a comparable basis 8877 8185 8 6
EBIT reported (after special items) 1129 1041 8 6Transaction costs Akorn 0 6
Bridge Financing costs Akorn - 0
Revaluations of biosimilars contingent liabilities 0 -
Gain related to divestitures of Care Coordination activities -3 -10
Transaction costs NxStage 2 -
Expenses associated with the cost optimization program at FMC 25 -
Impact of FCPA related charge - 75
EBIT (before special items) 1153 1112 4 1Divestitures of Care Coordination activities at FMC - 0
IFRS 16 effect -23 -
EBIT on a comparable basis 1130 1112 2 -1
48
Fresenius Group Reconciliation
General Credit Presentation November 2019 copy Fresenius SE amp Co KGaA Investor Relations
eurom Q319 Q318 growthrate
growthrate (cc)
Net interest reported (after special items) -172 -146 -18 -15Bridge Financing costs Akorn - 5
Revaluations of biosimilars contingent liabilities 1 -
Net interest (before special items) -171 -141 -21 -18Divestitures of Care Coordination activities at FMC - 0
IFRS 16 effect 47 -
Net interest on a comparable basis -124 -141 12 15
49
Fresenius Group Reconciliation
General Credit Presentation November 2019 copy Fresenius SE amp Co KGaA Investor Relations
eurom Q319 Q318 growthrate
growthrate (cc)
Income taxes reported (after special items) -202 -196 -3 -1Transaction costs Akorn 0 -1Bridge Financing costs Akorn - -2Revaluations of biosimilars contingent liabilities 0 -Gain related to divestitures of Care Coordination activities -17 -7Transaction costs NxStage -1 -Expenses associated with the cost optimization program at FMC -7 -Income taxes (before special items) -227 -206 -10 -7Divestitures of Care Coordination activities at FMC - -1IFRS 16 effect -5 -Income taxes on a comparable basis -232 -207 -12 -10
Noncontrolling interest reported (after special items) -311 -280 -11 -7Gain related to divestitures of Care Coordination activities 14 12Transaction costs NxStage 0 -Expenses associated with the cost optimization program at FMC -13 -Impact of FCPA related charge - -52Noncontrolling interest (before special items) -310 -320 3 7Divestitures of Care Coordination activities at FMC - 0IFRS 16 effect -11 -Noncontrolling interest on a comparable basis -321 -320 0 3
50
Fresenius Group Reconciliation
General Credit Presentation November 2019 copy Fresenius SE amp Co KGaA Investor Relations
eurom Q319 Q318 growthrate
growthrate (cc)
Net income reported (after special items) 444 419 6 4Transaction costs Akorn 0 5
Bridge Financing costs Akorn - 3
Revaluations of biosimilars contingent liabilities 1 -
Gain related to divestitures of Care Coordination activities -6 -5
Transaction costs NxStage 1 -
Expenses associated with the cost optimization program at FMC 5 -
Impact of FCPA related charge - 23
Net income (before special items) 445 445 0 -2Divestitures of Care Coordination activities at FMC - -1
IFRS 16 effect 8 -
Net income on a comparable basis 453 444 2 0
51
Fresenius Group Reconciliation
General Credit Presentation November 2019 copy Fresenius SE amp Co KGaA Investor Relations
eurom Q1-319 Q1-318 growthrate
growthrate (cc)
Sales reported 26098 24695 6 3Divestitures of Care Coordination activities at FMC - -516
IFRS 16 effect 75 -
Sales on a comparable basis 26173 24179 8 6
EBIT reported (after special items) 3362 4020 -16 -19Transaction costs Akorn 3 45
Bridge Financing costs Akorn - 1
Revaluations of biosimilars contingent liabilities -4 -
Gain related to divestitures of Care Coordination activities -14 -830
Transaction costs NxStage 22 -
Expenses associated with the cost optimization program at FMC 32 -
Impact of FCPA related charge - 75
EBIT (before special items) 3401 3311 3 0Divestitures of Care Coordination activities at FMC - -14
IFRS 16 effect -79 -
EBIT on a comparable basis 3322 3297 1 -2
52
Fresenius Group Reconciliation
General Credit Presentation November 2019 copy Fresenius SE amp Co KGaA Investor Relations
eurom Q1-319 Q1-318 growthrate
growthrate (cc)
Net interest reported (after special items) -535 -453 -18 -15Bridge Financing costs Akorn - 12
Revaluations of biosimilars contingent liabilities 3 -
Net interest (before special items) -532 -441 -21 -17Divestitures of Care Coordination activities at FMC - 21
IFRS 16 effect 153 -
Net interest on a comparable basis -379 -420 10 12
53
Fresenius Group Reconciliation
General Credit Presentation November 2019 copy Fresenius SE amp Co KGaA Investor Relations
eurom Q1-319 Q1-318 growthrate
growthrate (cc)
Income taxes reported (after special items) -632 -754 16 19Transaction costs Akorn 0 -9Bridge Financing costs Akorn - -4Revaluations of biosimilars contingent liabilities 0 -Gain related to divestitures of Care Coordination activities -15 140Transaction costs NxStage -6 -Expenses associated with the cost optimization program at FMC -9 -Income taxes (before special items) -662 -627 -6 -2Divestitures of Care Coordination activities at FMC - -2IFRS 16 effect -18 -Income taxes on a comparable basis -680 -629 -8 -5
Noncontrolling interest reported (after special items) -827 -1302 36 39Gain related to divestitures of Care Coordination activities 20 478Transaction costs NxStage -11 -Expenses associated with the cost optimization program at FMC -16 -Impact of FCPA related charge - -52Noncontrolling interest (before special items) -834 -876 5 9Divestitures of Care Coordination activities at FMC - -4IFRS 16 effect -31 -Noncontrolling interest on a comparable basis -865 -880 2 6
54
Fresenius Group Reconciliation
General Credit Presentation November 2019 copy Fresenius SE amp Co KGaA Investor Relations
eurom Q1-319 Q1-318 growthrate
growthrate (cc)
Net income reported (after special items) 1368 1511 -9 -12Transaction costs Akorn 3 36
Bridge Financing costs Akorn - 9
Revaluations of biosimilars contingent liabilities -1 -
Gain related to divestitures of Care Coordination activities -9 -212
Transaction costs NxStage 5 -
Expenses associated with the cost optimization program at FMC 7 -
Impact of FCPA related charge - 23
Net income (before special items) 1373 1367 0 -2Divestitures of Care Coordination activities at FMC - 1
IFRS 16 effect 25 -
Net income on a comparable basis 1398 1368 2 0
55
Reconciliation according to Fresenius Medical Care
General Credit Presentation November 2019 copy Fresenius SE amp Co KGaA Investor Relations
eurom Q319 Q318 growthrate
growthrate (cc)
Sales reported 4419 4058 9 6Divestitures of Care Coordination activities - -7
IFRS 16 effect 35 -
NxStage operations -79 -
Sales adjusted 4375 4051 8 5
EBIT reported 595 527 13 9
Gain related to divestitures of Care Coordination activities -2 -10
Divestitures of Care Coordination activities - 0
IFRS 16 effect -21 -
NxStage operations 0 -
Transaction costs NxStage 2 -
Expenses associated with the cost optimization program 25 -
Impact of FCPA related charge - 75EBIT adjusted 599 592 1 -3
56
Reconciliation according to Fresenius Medical Care
General Credit Presentation November 2019 copy Fresenius SE amp Co KGaA Investor Relations
eurom Q319 Q318 growthrate
growthrate (cc)
Net income reported 333 285 17 12
Gain related to divestitures of Care Coordination activities -20 -17
Divestitures of Care Coordination activities - 0
IFRS 16 effect 16 -
NxStage operations 15 -
Transaction costs NxStage 1 -
Expenses associated with the cost optimization program 18 -
Impact of FCPA related charge - 75Net income adjusted 363 343 6 2
57
Reconciliation according to Fresenius Medical Care
General Credit Presentation November 2019 copy Fresenius SE amp Co KGaA Investor Relations
eurom Q1-319 Q1-318 growthrate
growthrate (cc)
Sales reported 12897 12247 5 1Divestitures of Care Coordination activities - -516
IFRS 16 effect 75 -
NxStage operations -188 -
Sales adjusted 12784 11731 9 5
EBIT reported 1653 2425 -32 -35Gain related to divestitures of Care Coordination activities -14 -830
Divestitures of Care Coordination activities - -14
IFRS 16 effect -68 -
NxStage operations 16 -
Transaction costs NxStage 22 -
Expenses associated with the cost optimization program 32 -
Impact of FCPA related charge - 75
EBIT adjusted 1641 1656 -1 -5
58
Reconciliation according to Fresenius Medical Care
General Credit Presentation November 2019 copy Fresenius SE amp Co KGaA Investor Relations
eurom Q1-319 Q1-318 growthrate
growthrate (cc)
Net income reported 857 1557 -45 -47Gain related to divestitures of Care Coordination activities -29 -690
Divestitures of Care Coordination activities - 4
IFRS 16 effect 45 -
NxStage operations 49 -
Transaction costs NxStage 16 -
Expenses associated with the cost optimization program 23 -
Impact of FCPA related charge - 75
Net income adjusted 961 946 2 -3
59
Reconciliation Fresenius Medical Care according to Fresenius Group
General Credit Presentation November 2019 copy Fresenius SE amp Co KGaA Investor Relations
eurom Q319 Q318 growthrate
growthrate (cc)
Sales reported 4419 4058 9 6Divestitures of Care Coordination activities - -7
IFRS 16 effect 35 -
Sales on a comparable basis 4454 4051 10 7
EBIT reported (after special items) 595 527 13 9Gain related to divestitures of Care Coordination activities -3 -10
Transaction costs NxStage 2 -
Expenses associated with the cost optimization program 25 -
Impact of FCPA related charge - 75
EBIT (before special items) 619 592 5 1Divestitures of Care Coordination activities - 0
IFRS 16 effect -20 -
EBIT on a comparable basis 599 592 1 -3
60
Reconciliation Fresenius Medical Care according to Fresenius Group
General Credit Presentation November 2019 copy Fresenius SE amp Co KGaA Investor Relations
eurom Q319 Q318 growthrate
growthrate (cc)
Net income reported (after special items) 332 284 17 12Gain related to divestitures of Care Coordination activities -20 -16
Transaction costs NxStage 1 -
Expenses associated with the cost optimization program 18 -
Impact of FCPA related charge - 75
Net income (before special items) 331 343 -3 -7Divestitures of Care Coordination activities - -1
IFRS 16 effect 17 -
Net income on a comparable basis 348 342 2 -2
61
Reconciliation Fresenius Medical Care according to Fresenius Group
General Credit Presentation November 2019 copy Fresenius SE amp Co KGaA Investor Relations
eurom Q1-319 Q1-318 growthrate
growthrate (cc)
Sales reported 12897 12247 5 1Divestitures of Care Coordination activities - -516
IFRS 16 effect 75 -
Sales on a comparable basis 12972 11731 11 7
EBIT reported (after special items) 1653 2425 -32 -35Gain related to divestitures of Care Coordination activities -14 -830
Transaction costs NxStage 22 -
Expenses associated with the cost optimization program 32 -
Impact of FCPA related charge - 75
EBIT (before special items) 1693 1670 1 -3Divestitures of Care Coordination activities - -14
IFRS 16 effect -68 -
EBIT on a comparable basis 1625 1656 -2 -6
62
Reconciliation Fresenius Medical Care according to Fresenius Group
General Credit Presentation November 2019 copy Fresenius SE amp Co KGaA Investor Relations
eurom Q1-319 Q1-318 growthrate
growthrate (cc)
Net income reported (after special items) 857 1557 -45 -47Gain related to divestitures of Care Coordination activities -29 -690
Transaction costs NxStage 16 -
Expenses associated with the cost optimization program 23 -
Impact of FCPA related charge - 75
Net income (before special items) 867 942 -8 -12Divestitures of Care Coordination activities - 4
IFRS 16 effect 45 -
Net income on a comparable basis 912 946 -4 -8
63
Reconciliation Fresenius Kabi
General Credit Presentation November 2019 copy Fresenius SE amp Co KGaA Investor Relations
eurom Q319 Q318 growthrate
growthrate (cc)
Sales reported 1761 1650 7 5
Transaction costs Akorn 0 6
Revaluations of biosimilars contingent liabilities 0 -
EBIT (before special items) 307 297 3 1IFRS 16 effect -1 -
EBIT on a comparable basis 306 297 3 1
Transaction costs Akorn 0 5
Revaluations of biosimilars contingent liabilities 1 -
Net income (before special items) 203 199 2 -1IFRS 16 effect 1 -
Net income on a comparable basis 204 199 3 0
64
Reconciliation Fresenius Kabi
General Credit Presentation November 2019 copy Fresenius SE amp Co KGaA Investor Relations
eurom Q1-319 Q1-318 growthrate
growthrate (cc)
Sales reported 5153 4857 6 5
Transaction costs Akorn 3 45
Revaluations of biosimilars contingent liabilities -4 -
EBIT (before special items) 920 854 8 4IFRS 16 effect -3 -
EBIT on a comparable basis 917 854 7 4
Transaction costs Akorn 3 36
Revaluations of biosimilars contingent liabilities -1 -
Net income (before special items) 614 554 11 7IFRS 16 effect 4 -
Net income on a comparable basis 618 554 12 8
65
Reconciliation Fresenius Helios
General Credit Presentation November 2019 copy Fresenius SE amp Co KGaA Investor Relations
eurom Q319 Q318 growthrate
Sales reported 2230 2088 7German post-acute care business transferred from Fresenius Helios to Fresenius Vamed - 0
Sales adjusted for German post-acute care business 2230 2088 7
EBIT reported 187 204 -8IFRS 16 effect -4 -
EBIT adjusted for IFRS 16 effect 183 204 -10German post-acute care business transferred from Fresenius Helios to Fresenius Vamed - 0EBIT adjusted for IFRS 16 effect and German post-acute care business 183 204 -10
66
Reconciliation Fresenius Helios
General Credit Presentation November 2019 copy Fresenius SE amp Co KGaA Investor Relations
eurom Q1-319 Q1-318 growthrate
Sales reported 6890 6762 2German post-acute care business transferred from Fresenius Helios to Fresenius Vamed - -226
Sales adjusted for German post-acute care business 6890 6536 5
EBIT reported 731 775 -6IFRS 16 effect -8 -
EBIT adjusted for IFRS 16 effect 723 775 -7German post-acute care business transferred from Fresenius Helios to Fresenius Vamed - -10EBIT adjusted for IFRS 16 effect and German post-acute care business 723 765 -5
67
Reconciliation Fresenius Vamed
General Credit Presentation November 2019 copy Fresenius SE amp Co KGaA Investor Relations
eurom Q319 Q318 growthrate
Sales reported 562 476 18German post-acute care business acquired from Fresenius Helios -121 -117
Sales adjusted for German post-acute care business 441 359 23
EBIT reported 33 31 6IFRS 16 effect 1 -
EBIT adjusted for IFRS 16 effect 34 31 10German post-acute care business acquired from Fresenius Helios -15 -15EBIT adjusted for IFRS 16 effect and German post-acute care business 19 16 19
68
Reconciliation Fresenius Vamed
General Credit Presentation November 2019 copy Fresenius SE amp Co KGaA Investor Relations
eurom Q1-319 Q1-318 growthrate
Sales reported 1469 991 48German post-acute care business acquired from Fresenius Helios -350 -117
Sales adjusted for German post-acute care business 1119 874 28
EBIT reported 67 49 37IFRS 16 effect -2 -
EBIT adjusted for IFRS 16 effect 65 49 33German post-acute care business acquired from Fresenius Helios -31 -15EBIT adjusted for IFRS 16 effect and German post-acute care business 34 34 0
69
Financial Calendar Contact
Financial Calendar 20 February 2020 Results FY19
06 May 2020 Results Q120
20 May 2020 Annual General Meeting
30 July 2020 Results Q220
29 October 2020 Results Q320
Please note that these dates could be subject to change
Contact
Investor RelationsFresenius SE amp Co KGaAphone +49 6172 608-2485e-mail ir-frefreseniuscomFor further information and current news wwwfreseniuscom
Follow us on Twitter wwwtwittercomfresenius_irand LinkedIn wwwlinkedincomcompanyfresenius-investor-relations
General Credit Presentation November 2019 copy Fresenius SE amp Co KGaA Investor Relations 70
- Presentation to Credit Investors
- Safe Harbor Statement
- Foliennummer 3
- Strong and Balanced Health Care Portfolio
- Fresenius Group Global Sales Base in Growing Non-Cyclical Markets
- Fresenius Group Strong Track Record of Organic Sales Growth in All Business Segments
- Fresenius Group Strong Track Record of EBITDA Generation
- Fresenius SE Earnings-Linked Dividend Policy
- Global Health Care Trends ndash Strong Growth Fundamentals
- Fresenius Medical Care Global Dialysis Market Leader
- Fresenius Medical Care Sales and EBIT development
- Fresenius Kabi A Leading Global Hospital Supplier
- Fresenius Kabi Sales and EBIT development
- Fresenius Helios Europersquos Largest Private Hospital OperatorHelios Germany
- Fresenius Helios Europersquos Largest Private Hospital Operator Helios Spain
- Fresenius Helios Sales and EBIT development
- Fresenius Vamed Leading Global Hospital Projects and Services Specialist
- Fresenius Vamed Sales an EBIT development
- Fresenius Group Key Figures
- Cash Flow Development by Business Segment
- Fresenius Group Consistent Cash Generation
- Fresenius Group Proven Track Record of Deleveraging
- Fresenius Group Capitalization ndash September 30 2019 excl IFRS 16
- Fresenius Group Capitalization ndash September 30 2019 incl IFRS 16
- Fresenius Group Broad Mix of Financing Instruments
- Foliennummer 26
- Fresenius Group excl Fresenius Medical CareDebt Maturity Profile ndash September 30 201912
- Fresenius Group Solid Balance Sheet Structure
- Fresenius Group Strong Access to Capital Markets
- Fresenius SE Rating History amp Rationale
- Fresenius Group 2019 Financial Outlook by Business Segment
- Fresenius Group 2019 Financial Guidance
- Fresenius Group Healthy Growth Targets 2020 ndash 2023 (CAGRs)
- FY18 base for Fresenius Group Guidance FY19
- FY18 base for Fresenius Medical Care Outlook FY19
- FY18 base for Fresenius Kabi Outlook FY19
- IFRS 16 effect on Group PampL
- IFRS 16 effect on Group Balance Sheet and Cash Flow
- Fresenius Group Credit Highlights
- Attachments
- Fresenius Group Key Figures
- Foliennummer 42
- Foliennummer 43
- Fresenius Group Cash Flow
- Fresenius Group Financial Results by Business Segment
- Fresenius Group Margins by Business Segment
- Fresenius SE amp Co KGaA Overview Bonds
- Fresenius Group Reconciliation
- Fresenius Group Reconciliation
- Fresenius Group Reconciliation
- Fresenius Group Reconciliation
- Fresenius Group Reconciliation
- Fresenius Group Reconciliation
- Fresenius Group Reconciliation
- Fresenius Group Reconciliation
- Reconciliation according to Fresenius Medical Care
- Reconciliation according to Fresenius Medical Care
- Reconciliation according to Fresenius Medical Care
- Reconciliation according to Fresenius Medical Care
- Reconciliation Fresenius Medical Care according to Fresenius Group
- Reconciliation Fresenius Medical Care according to Fresenius Group
- Reconciliation Fresenius Medical Care according to Fresenius Group
- Reconciliation Fresenius Medical Care according to Fresenius Group
- Reconciliation Fresenius Kabi
- Reconciliation Fresenius Kabi
- Reconciliation Fresenius Helios
- Reconciliation Fresenius Helios
- Reconciliation Fresenius Vamed
- Reconciliation Fresenius Vamed
- Financial Calendar Contact
-
| Sales | EBITDA | |||
| 2012 | 39 | |||
| 2013 | 39 | |||
| 2014 | 41 | |||
| 2015 | 51 | |||
| 2016 | 55 | |||
| 2017 | 63 | |||
| 2018 | 6 | |||
| cagr | ||||
| 15384615385 | ||||
| 74 |
| 2012 | |
| 2013 | |
| 2014 | |
| 2015 | |
| 2016 | |
| 2017 | |
| 2018 |

Tabelle1
002
023 025029
032037
042044
055
062
93 08 09 10 11 12 13 14 15 16 17 18
25 2421 20 21 21 22 21 22 23 24
Fresenius SE Earnings-Linked Dividend Policy
General Credit Presentation November 2019 copy Fresenius SE amp Co KGaA Investor Relations 8
euro per share
bull Dividend growth aligned to EPS1
growth
bull Pay-out Ratio 20 to 25
Dividend distribution (eurom)
Pay-out Ratio
075
2018 Pay-out Ratio 24 Dividend Policy
122 140 155 196 225 238 300 416114 343 445
080
1 Before special items
Global Health Care Trends ndash Strong Growth Fundamentals
9
1 WHO 10 facts on aging and the life course2 World Bank Health expenditure per capita3 World Economic Forum Health Systems Leapfrogging in Emerging Economies ndash Project Paper (2014)
General Credit Presentation November 2019 copy Fresenius SE amp Co KGaA Investor Relations
60+ Aging population and higher incidence of chronic diseasesWorld population age 60+ will reach gt2bn by 20501
Increasing health expenditure per capita 2014 vs 1999 ndash USA $9403 (+108) China $420 (+977) India $75 (+317)2
13 By 2022 one third of all global health expenditure will occur in Emerging Economies3
Fresenius Medical Care Global Dialysis Market Leader
bull The worldrsquos leading provider of dialysis products and services treating more than 342000 patients1
in 4003 clinics1
bull Provide highest standard of product quality and patient care
bull Expansion in Care Coordination and global dialysis service opportunities enter new geographies
Global Dialysis Market 2018 bull ~euro71 bnbull ~6 patient growth pa
Growth Drivers bull Aging population increasing incidence of diabetes
and high blood pressure treatment quality improvements
International30
Sales 2018euro165 bn North America
70
Dialysis products
Dialysis services
Complete therapy offerings
1 As of September 30 2019
Market Dynamics
10General Credit Presentation November 2019 copy Fresenius SE amp Co KGaA Investor Relations
21292409
25622306
15 16 17 18
15455
16570
17784
16547
15 16 17 18
Fresenius Medical Care Sales and EBIT development
General Credit Presentation November 2019 copy Fresenius SE amp Co KGaA Investor Relations 11
EBIT1 in euro millionSales in euro million
1 Before special items
Fresenius Kabi A Leading Global Hospital Supplier
bull Comprehensive product portfolio for critically and chronically ill patients
bull Strong Emerging Markets presencebull Leading market positions in four product
segments
bull Focus on organic growth through geographic product rollouts and new product launches
bull Development of biosimilars with a focus on oncology and autoimmune diseases
Global Addressable Market 2018 bull ~euro81 bnGrowth Drivers bull Patent expirations rising demand for health care
services higher health care spending in Emerging Markets
Market Dynamics
Emerging Markets30
Sales 2018euro65 bn Europe 34
North America 36
Generic IV Drugs
Clinical Nutrition
Infusion Therapy
Medical Devices Transfusion Technology
Biosimilars
12General Credit Presentation November 2019 copy Fresenius SE amp Co KGaA Investor Relations
1197
1171 1177
1139
15 16 17 18
59506007
6358
6544
15 16 17 18
Fresenius Kabi Sales and EBIT development
General Credit Presentation November 2019 copy Fresenius SE amp Co KGaA Investor Relations 13
Sales in euro million EBIT1 in euro million
1 Before special items
bull ~51 share in German acute care hospital market
bull Organic growth based on growing number ofadmissions and reimbursement rate increases
bull Ranks as quality leader in the German hospital sector defined quality targets publication of medical treatment results peer review processes
bull Key medical indicators eg mortality rate for heart failure pneumonia below German average
86 hospitals~29000 beds~12 million inpatient
admissions pa~41 million outpatient
admissions pa1 Based on sales 2 German Federal Statistical Office 2018 total costs gross of the German hospitals
less academic research and teaching As of September 30 2019
Fresenius Helios Europersquos Largest Private Hospital OperatorHelios Germany
German Acute Care Hospital Market bull ~euro102 bn2
Growth Drivers bull Aging population leading to increasing
hospital admissions
Largest network amp nationwide presence
Acute Care
Market Dynamics
Outpatient
14General Credit Presentation November 2019 copy Fresenius SE amp Co KGaA Investor Relations
bull ~euro30 bn sales in 2018
bull ~121 share in Spanish private hospital market
bull Market leader in size and quality with excellent growth prospects
bull Broad revenue base with privately insured patients PPPs self-pay and Occupational Risk Prevention (ORP)
bull Strong management team with proven track record
bull Cross-selling opportunities
Fresenius Helios Europersquos Largest Private Hospital Operator Helios Spain
Spanish Private Hospital Market bull ~euro14 bn2
Growth Drivers bull Aging population increasing number of privately
insured patients greenfield projects market consolidation
Quiroacutensalud hospitals in every major metropolitan region of Spain
Acute Care
Occupational Risk Prevention
Outpatient
1 Based on sales2 Market data based on company research Market definition does neither include
Public Private Partnerships (PPP) nor Occupational Risk Prevention centers (ORP)
Market Dynamics
As of September 30 2019
50 hospitals ~7000 beds~04 m inpatientadmissions pa~129 m outpatient admissions pa
15General Credit Presentation November 2019 copy Fresenius SE amp Co KGaA Investor Relations
642 683
1052 1052
15 16 17 18
5578 5843
8668 8993
15 16 17 18
Fresenius Helios Sales and EBIT development
General Credit Presentation November 2019 copy Fresenius SE amp Co KGaA Investor Relations 16
Sales in euro million EBIT in euro million
2017 11 months contribution of Helios Spain (Quiroacutensalud)1 Before special items
bull Manages hospital constructionexpansion projects and provides services for health care facilities worldwide
bull Offers project development planning turnkey construction maintenance as well as technical management and total operational management
bull Strong track record More than 900 projects in over 90 countries completed
bull Leading European post-acute care provider operating in five European countries
Fresenius Vamed Leading Global Hospital Projects and Services Specialist
Market Dynamics
Growth Drivers bull Emerging Market demand for building and
developing hospital infrastructurebull Outsourcing of non-medical services from public to
private operators
Emerging Markets22
Sales 2018euro17 bn Europe 78
Projects
Services
Post-acute care
17General Credit Presentation November 2019 copy Fresenius SE amp Co KGaA Investor Relations
1118
1160
1228
15 16 17 18
1688
6469
76
110
15 16 17 18
Fresenius Vamed Sales an EBIT development
General Credit Presentation November 2019 copy Fresenius SE amp Co KGaA Investor Relations 18
EBIT in euro millionSales in euro million
Fresenius Group Key Figures
General Credit Presentation November 2019 copy Fresenius SE amp Co KGaA Investor Relations 19
eurom 20181 20171 Growth (cc)5
Sales 33530 33886 6
EBITDA 5991 6267 0Margin 179 185
EBIT 4561 4830 -1Margin 136 143
Interest net -570 -652 7
EBT 3991 4178 0
Taxes -880 -1168 21
Net Income3 3111 3010 8
Employees4 276750 273249
1 Before special items2 4 organic growth 2 acquisitions 0 divestitures -4 currency effects 3 Net income incl attributable to non-controlling interest4 As of December 315 Adjusted for IFRS and divestitures of Care Coordination activities
Cash Flow Development by Business Segment
General Credit Presentation November 2019 copy Fresenius SE amp Co KGaA Investor Relations 20
1 Before acquisitions and dividends2 Margin incl FMC dividend3 Understated 17 excluding euro30 million of capex commitments from acquisitions
Operating CF Capex (net) Free Cash Flow1
eurom 2018 Margin 2018 Margin 2018 Margin
1040 159 -553 -85 487 74
554 62 -434 -49 120 133
106 63 -29 -17 77 46
CorporateOther -20 na -58 na -78 na
1680 1042 -1074 -63 606 412
2062 125 -1003 -61 1059 64
3742 112 -2077 -62 16654 50
Excl FMC
Group
Margin = in of sales
48 48 4852 53
5855 55 54
65
3
4
5
6
7
8
2009 2010 2011 2012 2013 2014 2015 2016 2017 2018
Fresenius Group Consistent Cash Generation
Capex gross in of sales
FCF margin (before acquisitions amp dividends)CFFO margin
21General Credit Presentation November 2019 copy Fresenius SE amp Co KGaA Investor Relations
110
120
103
126
114
109
120 122
116
112
8
9
10
11
12
13
14
2009 2010 2011 2012 2013 2014 2015 2016 2017 2018
63
74
56
76
62
52
67 67 66
50
3
4
5
6
7
8
9
2009 2010 2011 2012 2013 2014 2015 2016 2017 2018
Fresenius Group Proven Track Record of Deleveraging
22
Net DebtEBITDA1
1 At actual FX rates for both Net Debt and EBITDA before special items pro forma closed acquisitionsdivestitures2 Pro forma excluding advances made for the acquisition of hospitals from Rhoumln-Klinikum AG3 Calculated at actual FX rates for both net debt and EBITDA including acquisition of the NxStage excluding IFRS 16 effect (comparable to updated guidance from May 2 2019)4 Calculated at expected annual average exchange rates for both net debt and EBITDA including acquisition of NxStage without potential unannounced acquisitions adjusted for
IFRS 16 effects (comparable to updated guidance from May 2 2019)
32x
30x
27x
22x 23x
35x
30x
26x
36x
30x
26x
28x
25x 25x
34x
27x
24x
28x
27x
32x3
20
30
40
2001 2002 2003 2004 2005 Q106 2006 2007 2008 2009 2010 2011 2012 2013 2014 2015 2016 2017 2018 Q3192
Target 20194 around the upper-end of self-imposed target corridor of 25 ndash 30x
Hospitals from
General Credit Presentation November 2019 copy Fresenius SE amp Co KGaA Investor Relations
4
Fresenius Group Capitalization ndash September 30 2019 excl IFRS 16
23
1 Based on market capitalization for FSE and FMC as of September 30 20192 Before acquisition-related expenses Pro Forma acquisitions3 EURUSD exchange rate as of September 30 2019 except for market capitalization which uses the exchange rate as of September 30 2019
Instrument per Book Value in euro million in $ million3 oftotal cap EBITDA LTM x
Syndicated Credit Agreement Revolver (euro US-$) 229 249 04 Syndicated Credit Agreement Term Loan A (euro US-$) 2029 2209 36 Bonds (euro US-$) 5516 6006 98 Convertible Bonds 463 504 08 Schuldschein Loans 2191 2386 39 Commercial Paper 1000 1089 18 Other debt 836 910 15 Total Debt (FSE excl FMC) gross 12264 13354 218 Cash (excl FMC) 917 999 16 Total debt (FSE excl FMC) net 11347 12356 201 Total FMC debt net 8246 8979 146 Consolidation Adjustments (78) (85)Total consolidated debt net 19515 21250 346 32x Market capitalization1 36859 40136 654 60x
Total capitalization 56374 61386 1000 92x FSE Group EBITDA2 6100
General Credit Presentation November 2019 copy Fresenius SE amp Co KGaA Investor Relations
4
Fresenius Group Capitalization ndash September 30 2019 incl IFRS 16
24
1 Based on market capitalization for FSE and FMC as of September 30 20192 Before acquisition-related expenses Pro Forma acquisitions3 EURUSD exchange rate as of September 30 2019 except for market capitalization which uses the exchange rate as of September 30 2019
Instrument per Book Value in euro million in $ million3 oftotal cap EBITDA LTM x
Syndicated Credit Agreement Revolver (euro US-$) 229 249 04 Syndicated Credit Agreement Term Loan A (euro US-$) 2029 2209 33 Bonds (euro US-$) 5516 6006 89 Convertible Bonds 463 504 07 Schuldschein Loans 2191 2386 35 Commercial Paper 1000 1089 16 Lease Obligations 1749 1904 28 Other debt 653 711 10 Total Debt (FSE excl FMC) gross 13830 15059 222 Cash (excl FMC) 917 999 15 Total debt (FSE excl FMC) net 12913 14061 207 Total FMC debt net 12704 13833 204 Consolidation Adjustments (203) (221) (03)Total consolidated debt net 25414 27673 408 36x Market capitalization1 36859 40136 592 52x
Total capitalization 62273 67810 1000 88x FSE Group EBITDA2 7064
General Credit Presentation November 2019 copy Fresenius SE amp Co KGaA Investor Relations
Fresenius Group Broad Mix of Financing Instruments
General Credit Presentation November 2019 copy Fresenius SE amp Co KGaA Investor Relations 25
Commercial Paper 9
Other financial Liabilities 13
Syndicated loans 22 Bonds 42
Equity-neutralconvertible bonds 4
Total BS Debt1
~euro21114 m
1 As of September 30 2019 adjusted for IFRS 16 effect
bull Optimize funding costs and ensure financial flexibility
bull Diversify investor base
bull Strong liquidity provided by sufficient financial cushion (~euro29 billion as of September 30 2019)
Well Positioned to Meet Financing NeedsSchuldschein Loans 10
Average interest ratecost of debt22 pa
26
Fresenius GroupDebt Maturity Profile ndash September 30 201912
1 Based on utilization of major financing instruments2 Excluding IFRS 16 adjustments
eurom
General Credit Presentation November 2019 copy Fresenius SE amp Co KGaA Investor Relations
779
1653 1704
2384
367 500 459
637
1163
1944
2260
708
2071
500
238
907
584
5000
1000
2000
3000
4000
5000
2019 2020 2021 2022 2023 2024 2025 2026 2027 2028 2029 2030 2031 2032
Fresenius Medical Care Fresenius excl Fresenius Medical Care
Maturity 32 years on
average
Fresenius Group excl Fresenius Medical CareDebt Maturity Profile ndash September 30 201912
27General Credit Presentation November 2019 copy Fresenius SE amp Co KGaA Investor Relations
1 Based on utilization of major financing instruments2 Excluding IFRS 16 adjustments
eurom
500726 700
276
1150
500700
500 500
39
155
9051167
106
314
393
432
421
238
207
84
500
598
402
0
500
1000
1500
2000
2500
2019 2020 2021 2022 2023 2024 2025 2026 2027 2028 2029 2030 2031 2032
Bonds Syndicated Loan Schuldschein Loans Equity-neutral convertible bonds Commercial Paper
Maturity 37 years on
average
23 23 23 23
34 32 36 33
43 45 41 44
Dec 31 15 Dec 31 16 Dec 31 17 Dec 31 18
Equity and noncontrolling interest Debt Other liabilities
Fresenius Group Solid Balance Sheet Structure
Healthy Equity and Liability Split
bull Strong equity ratio of gt40 on average
bull Equity ratio kept in narrow range despite rapid growth of Fresenius Group
General Credit Presentation November 2019 copy Fresenius SE amp Co KGaA Investor Relations 28
432 467 531 567
BS total (eurobn)
Fresenius Group Strong Access to Capital Markets
29
Major Financing Instruments
2009 2010 2011 2012 2013 2014 2015 2016 2017 2018 2019
Bondseuro425 m$500 m
euro250 m euro800 m$105 bn
euro750 m$15 bn
euro500 m euro12 bn$12 bn
$300 m euro26 bn euro500 m euro10 bn$500 m1
SyndicatedLoans
$35 bn $898 m $385 bn $18 bneuro245 bn
$41 bneuro700 m
$115 bneuro205 bn
euro530 bn$355 bn
euro100sup2
SchuldscheinLoans
euro200 m euro400 m euro125 m euro500 m euro112 m $400 m euro10 bn euro700 msup3
Convertible Bonds
euro900 m euro500 m
Equityeuro10 bn euro400 m
1 June 2019 new $500 million 2019-2029 Bond issued by Fresenius Medical Care amp Co KGaA2 August 2019 euro100 million increased Revolving Facilities of Fresenius SE amp Co KGaA3 September 2019 new euro700 million 2019-202320262029 Schuldschein Loan issued by Fresenius SE amp Co KGaA
General Credit Presentation November 2019 copy Fresenius SE amp Co KGaA Investor Relations
Fresenius SE Rating History amp Rationale
General Credit Presentation November 2019 copy Fresenius SE amp Co KGaA Investor Relations 30
ldquoFSE delivers solid organic growth thanks to positive underlying growth trends in the life-saving and life-sustaining products and therapies that the group offersrdquo SampP Jan 08 2019
ldquoFSErsquos rating remains anchored in investment-grade given its mature and defensive business risk profile the grouprsquos deleveraging ability based on free cash flow generation and its record of integrating acquisitions successfully and reducing financial leverage in line with communicated policiesrdquo Fitch Sep 20 2018
ldquoThe Baa3 long term issuer rating of FSE reflects its strong defensive business profile underpinned by large absolute scale global footprint and segmental diversification within the healthcare market supported by strong position in its four business segmentsrdquo Moodyrsquos May 15 2018
Rating History Rating Agenciesrsquo Key Statements
In May 2019 SampP upgraded Fresenius to BBB with stable outlook
SampP Moodylsquos Fitch
Corporate Credit Rating BBB Baa3 BBB-
Outlook stable stable stable
Current Credit Ratings
Fresenius Group 2019 Financial Outlook by Business Segment
General Credit Presentation November 2019 copy Fresenius SE amp Co KGaA Investor Relations 31
eurom (except otherwise stated) FY18 Base1 FY19e2
Sales growth3 (cc) 16026 3 ndash 7
Net income growth34 (cc) 1341 -2 to 2
Sales growth (organic) 6544 3 ndash 6
EBIT growth (cc) 1139 3 ndash 6
Sales growth (organic) 8993 2 ndash 5
EBIT 1052 -5 to -2
Sales growth (organic) 1688 ~10
EBIT growth 110 15 ndash 20
1 Before special items and after adjustments2 Before special items (transaction-related expenses expenses associated with cost optimization program at FMC revaluations of biosimilars contingent liabilities) adjusted for IFRS 16 effect3 Excluding effects from NxStage transaction4 Net income attribuitable to shareholders of Fresenius Medical Care AG amp Co KGaA
For a detailed overview of adjustments and special items please see the reconciliation tables on slides 48-69 and for the bases
eurom (except otherwise stated) FY18 Base1 FY192
Sales growth (cc) 33009 4 - 7
Net income3 growth (cc) 1872 ~0
Fresenius Group 2019 Financial Guidance
1 Before special items and after adjustments2 Excluding transaction-related expenses expenses associated with the cost optimization program at FMC revaluations of biosimilars contingent liabilities including operating results of
NxStage adjusted for IFRS 16 effects3 Net income attributable to shareholders of Fresenius SEampCo KGaA
For a detailed overview of adjustments and special items please see the reconciliation tables on slides 48-69 and for the bases
32General Credit Presentation November 2019 copy Fresenius SE amp Co KGaA Investor Relations
Fresenius Group Healthy Growth Targets 2020 ndash 2023 (CAGRs)
General Credit Presentation November 2019 copy Fresenius SE amp Co KGaA Investor Relations 33
Organic sales growth 4 ndash 7 (plus ~1 small tomid-size acquisitions)
Organic net income1 growth 5 ndash 9 (plus ~1 small tomid-size acquisitions)
1 Net income attributable to shareholders of Fresenius SEampCo KGaA
Before special items
FY18 base for Fresenius Group Guidance FY19
General Credit Presentation November 2019 copy Fresenius SE amp Co KGaA Investor Relations 34
eurom
Sales reported 33530
Divestitures of Care Coordination activities at FMC (H118) -521
Sales basis for growth rates 33009
Net Income reported 2027
Transaction Costs Akorn Biosimilars 25
Bridge Financing Costs Akorn 12
Revaluations of Biosimilars contingent liabililties 5
Impact of FCPA related charge 9
Gain related to divestitures of Care Coordination activities -207
Net income (before special items) 1871
Divestitures of Care Coordination activities at FMC (H118) 1
Net income basis for growth rates (before special items and after adjustments) 1872
FY18 base for Fresenius Medical Care Outlook FY19
General Credit Presentation November 2019 copy Fresenius SE amp Co KGaA Investor Relations 35
eurom
Sales reported 16547
Divestitures of Care Coordination activities at FMC (H118) -521
Sales basis for growth rates 16026
Net Income reported 1982
Impact of FCPA related charge 28
Gain related to divestitures of Care Coordination activities -673
Net income (before special items) 1337
Divestitures of Care Coordination activities at FMC (H118) 4
Net income basis for growth rates (before special items and after adjustments) 1341
FY18 base for Fresenius Kabi Outlook FY19
General Credit Presentation November 2019 copy Fresenius SE amp Co KGaA Investor Relations 36
eurom
Sales basis for growth rates 6544
Transaction Costs Akorn Biosimilars 34
Revaluations of Biosimilars contingent liabililties 7
EBIT (before special items = base for Kabi guidance) 1139
The special items are reported in the Group CorporateOther segment
IFRS 16 effect on Group PampL
General Credit Presentation November 2019 copy Fresenius SE amp Co KGaA Investor Relations
eurom
Q319 before
special items adjusted for
IFRS 16 effect IFRS 16 effect
Q319 before
special itemsaccording to
IFRS 16
Q1-319 before
special items adjusted for
IFRS 16 effect IFRS 16 effect
Q1-319 before
special itemsaccording to
IFRS 16
Sales 8877 -35 8842 26173 -75 26098
EBITDA 1526 237 1763 4468 699 5167
Depreciation and amortization -396 -214 -610 -1146 -620 -1766
EBIT 1130 23 1153 3322 79 3401
Net interest -124 -47 -171 -379 -153 -532
Income taxes -232 5 -227 -680 18 -662
Noncontrolling interest -321 11 -310 -865 31 -834
Net income1 453 -8 445 1398 -25 1373
37
1 Net income attributable to shareholders of Fresenius SE amp Co KGaA
IFRS 16 effect on Group Balance Sheet and Cash Flow
General Credit Presentation November 2019 copy Fresenius SE amp Co KGaA Investor Relations
eurom
Sep 30 2019adjusted for
IFRS 16 effect IFRS 16 effect
Sep 30 2019according to
IFRS 16
Right-of-use-assets 1901 5667 5857Lease liabilities 4142 5899 6313Equity 26928 -232 26696Total assets 61092 5667 66759
38
1 Reclassification from machinery equipment and rental equipment under capital leases as of December 31 20182 Reclassifications from capital lease obligations and other liabilities as of December 31 2018
eurom
Q319adjusted for
IFRS 16 effect IFRS 16 effect
Q319according to
IFRS 16
Q1-319adjusted for
IFRS 16 effect IFRS 16 effect
Q1-319according to
IFRS 16
Operating cash flow 1298 185 1483 2439 538 2977Cash flow before acquisitions and dividends 722 185 907 850 538 1388
Free cash flow 547 185 732 -2172 538 -1634Cash provided byused for financing activities -461 -185 -646 995 -538 457
Balance Sheet
Cash Flow
Fresenius Group Credit Highlights
General Credit Presentation November 2019 copy Fresenius SE amp Co KGaA Investor Relations 39
Consistent Cash Generation
Proven Track Record of Deleveraging Following Acquisitions
Broad Mix of Financing Instruments
Well-Balanced Maturity Profile
Solid Balance Sheet Structure
Strong Access to Capital Markets
Attachments
General Credit Presentation November 2019 copy Fresenius SE amp Co KGaA Investor Relations 40
Fresenius Group Key Figures
General Credit Presentation November 2019 copy Fresenius SE amp Co KGaA Investor Relations 41
1 2018 and 2017 before special items 2018 2017 and 2016 pro forma acquisitionsdivestitures2 2018 and 2017 before special items 3 2016 pro forma Quiroacutensalud acquisition 3154 2016 pro forma Quiroacutensalud acquisition 309
2018 2017 2016
Debt (eurom) thereof US$ denominated
1898428
1904231
1478052
Net debt (eurom) 16275 17406 13201
Net debtEBITDA13
Net debt at year-end exchange rate EBITDA at LTM average FX rates
273 279 239
Net debtEBITDA14
at LTM average FX rates for both net debt and EBITDA
271 284 233
Operating Cash flowSales 112 116 122
EBITDAInterest2 105 96 95
42
Fresenius Group Debt and Cash Flow Structure ndash Sep 30 2019 adj for IFRS 16
Fresenius Medical Care
Financing
Fresenius SE Financing
Group Net Debt ~euro195 bn1
DividendsRents Service Agreements
~313 100 77100
- euro306 m Net Debt4 euro63 m Net Debt4 euro32 m Net Debt4euro8246 m Net Debt4
Profit transfer Agreements6
bull Separate financing of Fresenius SE and Fresenius Medical Care
bull No joint financing facilities or mutual guarantees
bull Fresenius Kabi Fresenius Helios and Fresenius Vamed financed primarily through Fresenius SE to avoid structural subordination
FSE Net Debt~euro113 bn
incl Net Debt of KabiHeliosVamed
StockMarketValue~euro58 bn5 FSE Net Debt2
~euro115 bn
1 Incl consolidation adjustments2 Incl Fresenius financing subsidiaries3 Controlling stake4 Incl subsidiaries 5 Based on market capitalization for FMC as of September 30 20196 Via German holding entities (Fresenius Kabi AG and Fresenius ProServe GmbH)
General Credit Presentation November 2019 copy Fresenius SE amp Co KGaA Investor Relations
43
Fresenius Group Debt and Cash Flow Structure ndash Sep 30 2019 accord to IFRS 16
1 Incl consolidation adjustments2 Incl Fresenius financing subsidiaries3 Controlling stake4 Incl subsidiaries 5 Based on market capitalization for FMC as of September 30 20196 Via German holding entities (Fresenius Kabi AG and Fresenius ProServe GmbH)
Fresenius Medical Care
Financing
Fresenius SE Financing
Group Net Debt ~euro254 bn1
DividendsRents Service Agreements
~313 100 77100
euro50 m Net Debt4 euro921 m Net Debt4 euro331 m Net Debt4euro12704 m Net Debt4
Profit transfer Agreements6
bull Separate financing of Fresenius SE and Fresenius Medical Care
bull No joint financing facilities or mutual guarantees
bull Fresenius Kabi Fresenius Helios and Fresenius Vamed financed primarily through Fresenius SE to avoid structural subordination
FSE Net Debt~euro127 bn
incl Net Debt of KabiHeliosVamed
StockMarketValue~euro58 bn5 FSE Net Debt2
~euro114 bn
General Credit Presentation November 2019 copy Fresenius SE amp Co KGaA Investor Relations
Fresenius Group Cash Flow
General Credit Presentation November 2019 copy Fresenius SE amp Co KGaA Investor Relations 44
eurom 2018 Margin 2017 Margin Δ YoY
Operating Cash Flow 3742 112 3937 116 -5
Capex (net) -2077 -62 -1705 -50 -22
Free Cash Flow(before acquisitions and dividends)
1665 50 2232 66 -25
Acquisitions (net) -613 -5865 --
Dividends -904 -924 2
Free Cash Flow(after acquisitions and dividends)
-1374 -41 -4557 -134 --
Fresenius Group Financial Results by Business Segment
General Credit Presentation November 2019 copy Fresenius SE amp Co KGaA Investor Relations 45
2018 2017 2016 Growth2
20182017
Sales euro16547 m euro17784 m euro16570 m 41
EBIT euro2306 m euro2562 m euro2409 m 61
Sales euro6544 m euro6358 m euro6007 m 7
EBIT euro1139 m euro1177 m euro1171 m 2
Sales euro8993 m euro8668 m euro5843 m 6
EBIT euro1052 m euro1052 m euro683 m 3
Sales euro1688 m euro1228 m euro1160 m 19
EBIT euro110m euro76 m euro69 m 9
Sales euro33530 m euro33886 m euro29471 m 6
EBIT euro4561 m euro4830 m euro4302 m -1Group
2018 and 2017 before special items
1 FMC on a comparable basis2 Growth rates at constant currency and after adjustments
Fresenius Group Margins by Business Segment
General Credit Presentation November 2019 copy Fresenius SE amp Co KGaA Investor Relations 46
2018 and 2017 before special items
2018 2017 2016
EBITDA margin 183 185 188
EBIT margin 139 144 145
EBITDA margin 219 233 244
EBIT margin 174 185 195
EBITDA margin 159 165 150
EBIT margin 117 121 117
EBITDA margin 79 71 69
EBIT margin 65 62 59
EBITDA margin 179 185 187
EBIT margin 136 143 146Group
Fresenius SE amp Co KGaA Overview Bonds
General Credit Presentation November 2019 copy Fresenius SE amp Co KGaA Investor Relations 47
Issuer Volume(in millions)
Coupon type
Coupon (in )
MaturityTerm
ISIN (RegS)
WKN
Fresenius SE amp Co KGaAeuro500 Fix 2875 20132020 XS0873432511 A1HEWZ
Fresenius SE amp Co KGaAeuro450 Fix 300 20142021 XS1013955379 A1ZB7H
Fresenius SE amp Co KGaAeuro450 Fix 400 20142024 XS1026109204 A1ZC60
Fresenius SE amp Co KGaAeuro 500 Fix 1875 20192025 XS1936208252 A2NBMS
Fresenius SE amp Co KGaAeuro 500 Fix 2875 20192029 XS1936208419 A2NBMT
Fresenius Finance Ireland plceuro700 Fix 0875 20172022 XS1554373164 A19B3F
Fresenius Finance Ireland plceuro700 Fix 150 20172024 XS1554373248 A19B3G
Fresenius Finance Ireland plceuro700 Fix 2125 20172027 XS1554373677 A19B3H
Fresenius Finance Ireland plceuro500 Fix 300 20172032 XS1554373834 A19B3J
Fresenius US Finance II IncUS$300 Fix 425 20142021 USU31436AG04 A1ZDVJ
Fresenius US Finance II IncUS$300 Fix 450 20152023 USU31436AH86 A1Z64A
Fresenius Group Reconciliation
General Credit Presentation November 2019 copy Fresenius SE amp Co KGaA Investor Relations
eurom Q319 Q318 growthrate
growthrate (cc)
Sales reported 8842 8192 8 6Divestitures of Care Coordination activities at FMC - -7
IFRS 16 effect 35 -
Sales on a comparable basis 8877 8185 8 6
EBIT reported (after special items) 1129 1041 8 6Transaction costs Akorn 0 6
Bridge Financing costs Akorn - 0
Revaluations of biosimilars contingent liabilities 0 -
Gain related to divestitures of Care Coordination activities -3 -10
Transaction costs NxStage 2 -
Expenses associated with the cost optimization program at FMC 25 -
Impact of FCPA related charge - 75
EBIT (before special items) 1153 1112 4 1Divestitures of Care Coordination activities at FMC - 0
IFRS 16 effect -23 -
EBIT on a comparable basis 1130 1112 2 -1
48
Fresenius Group Reconciliation
General Credit Presentation November 2019 copy Fresenius SE amp Co KGaA Investor Relations
eurom Q319 Q318 growthrate
growthrate (cc)
Net interest reported (after special items) -172 -146 -18 -15Bridge Financing costs Akorn - 5
Revaluations of biosimilars contingent liabilities 1 -
Net interest (before special items) -171 -141 -21 -18Divestitures of Care Coordination activities at FMC - 0
IFRS 16 effect 47 -
Net interest on a comparable basis -124 -141 12 15
49
Fresenius Group Reconciliation
General Credit Presentation November 2019 copy Fresenius SE amp Co KGaA Investor Relations
eurom Q319 Q318 growthrate
growthrate (cc)
Income taxes reported (after special items) -202 -196 -3 -1Transaction costs Akorn 0 -1Bridge Financing costs Akorn - -2Revaluations of biosimilars contingent liabilities 0 -Gain related to divestitures of Care Coordination activities -17 -7Transaction costs NxStage -1 -Expenses associated with the cost optimization program at FMC -7 -Income taxes (before special items) -227 -206 -10 -7Divestitures of Care Coordination activities at FMC - -1IFRS 16 effect -5 -Income taxes on a comparable basis -232 -207 -12 -10
Noncontrolling interest reported (after special items) -311 -280 -11 -7Gain related to divestitures of Care Coordination activities 14 12Transaction costs NxStage 0 -Expenses associated with the cost optimization program at FMC -13 -Impact of FCPA related charge - -52Noncontrolling interest (before special items) -310 -320 3 7Divestitures of Care Coordination activities at FMC - 0IFRS 16 effect -11 -Noncontrolling interest on a comparable basis -321 -320 0 3
50
Fresenius Group Reconciliation
General Credit Presentation November 2019 copy Fresenius SE amp Co KGaA Investor Relations
eurom Q319 Q318 growthrate
growthrate (cc)
Net income reported (after special items) 444 419 6 4Transaction costs Akorn 0 5
Bridge Financing costs Akorn - 3
Revaluations of biosimilars contingent liabilities 1 -
Gain related to divestitures of Care Coordination activities -6 -5
Transaction costs NxStage 1 -
Expenses associated with the cost optimization program at FMC 5 -
Impact of FCPA related charge - 23
Net income (before special items) 445 445 0 -2Divestitures of Care Coordination activities at FMC - -1
IFRS 16 effect 8 -
Net income on a comparable basis 453 444 2 0
51
Fresenius Group Reconciliation
General Credit Presentation November 2019 copy Fresenius SE amp Co KGaA Investor Relations
eurom Q1-319 Q1-318 growthrate
growthrate (cc)
Sales reported 26098 24695 6 3Divestitures of Care Coordination activities at FMC - -516
IFRS 16 effect 75 -
Sales on a comparable basis 26173 24179 8 6
EBIT reported (after special items) 3362 4020 -16 -19Transaction costs Akorn 3 45
Bridge Financing costs Akorn - 1
Revaluations of biosimilars contingent liabilities -4 -
Gain related to divestitures of Care Coordination activities -14 -830
Transaction costs NxStage 22 -
Expenses associated with the cost optimization program at FMC 32 -
Impact of FCPA related charge - 75
EBIT (before special items) 3401 3311 3 0Divestitures of Care Coordination activities at FMC - -14
IFRS 16 effect -79 -
EBIT on a comparable basis 3322 3297 1 -2
52
Fresenius Group Reconciliation
General Credit Presentation November 2019 copy Fresenius SE amp Co KGaA Investor Relations
eurom Q1-319 Q1-318 growthrate
growthrate (cc)
Net interest reported (after special items) -535 -453 -18 -15Bridge Financing costs Akorn - 12
Revaluations of biosimilars contingent liabilities 3 -
Net interest (before special items) -532 -441 -21 -17Divestitures of Care Coordination activities at FMC - 21
IFRS 16 effect 153 -
Net interest on a comparable basis -379 -420 10 12
53
Fresenius Group Reconciliation
General Credit Presentation November 2019 copy Fresenius SE amp Co KGaA Investor Relations
eurom Q1-319 Q1-318 growthrate
growthrate (cc)
Income taxes reported (after special items) -632 -754 16 19Transaction costs Akorn 0 -9Bridge Financing costs Akorn - -4Revaluations of biosimilars contingent liabilities 0 -Gain related to divestitures of Care Coordination activities -15 140Transaction costs NxStage -6 -Expenses associated with the cost optimization program at FMC -9 -Income taxes (before special items) -662 -627 -6 -2Divestitures of Care Coordination activities at FMC - -2IFRS 16 effect -18 -Income taxes on a comparable basis -680 -629 -8 -5
Noncontrolling interest reported (after special items) -827 -1302 36 39Gain related to divestitures of Care Coordination activities 20 478Transaction costs NxStage -11 -Expenses associated with the cost optimization program at FMC -16 -Impact of FCPA related charge - -52Noncontrolling interest (before special items) -834 -876 5 9Divestitures of Care Coordination activities at FMC - -4IFRS 16 effect -31 -Noncontrolling interest on a comparable basis -865 -880 2 6
54
Fresenius Group Reconciliation
General Credit Presentation November 2019 copy Fresenius SE amp Co KGaA Investor Relations
eurom Q1-319 Q1-318 growthrate
growthrate (cc)
Net income reported (after special items) 1368 1511 -9 -12Transaction costs Akorn 3 36
Bridge Financing costs Akorn - 9
Revaluations of biosimilars contingent liabilities -1 -
Gain related to divestitures of Care Coordination activities -9 -212
Transaction costs NxStage 5 -
Expenses associated with the cost optimization program at FMC 7 -
Impact of FCPA related charge - 23
Net income (before special items) 1373 1367 0 -2Divestitures of Care Coordination activities at FMC - 1
IFRS 16 effect 25 -
Net income on a comparable basis 1398 1368 2 0
55
Reconciliation according to Fresenius Medical Care
General Credit Presentation November 2019 copy Fresenius SE amp Co KGaA Investor Relations
eurom Q319 Q318 growthrate
growthrate (cc)
Sales reported 4419 4058 9 6Divestitures of Care Coordination activities - -7
IFRS 16 effect 35 -
NxStage operations -79 -
Sales adjusted 4375 4051 8 5
EBIT reported 595 527 13 9
Gain related to divestitures of Care Coordination activities -2 -10
Divestitures of Care Coordination activities - 0
IFRS 16 effect -21 -
NxStage operations 0 -
Transaction costs NxStage 2 -
Expenses associated with the cost optimization program 25 -
Impact of FCPA related charge - 75EBIT adjusted 599 592 1 -3
56
Reconciliation according to Fresenius Medical Care
General Credit Presentation November 2019 copy Fresenius SE amp Co KGaA Investor Relations
eurom Q319 Q318 growthrate
growthrate (cc)
Net income reported 333 285 17 12
Gain related to divestitures of Care Coordination activities -20 -17
Divestitures of Care Coordination activities - 0
IFRS 16 effect 16 -
NxStage operations 15 -
Transaction costs NxStage 1 -
Expenses associated with the cost optimization program 18 -
Impact of FCPA related charge - 75Net income adjusted 363 343 6 2
57
Reconciliation according to Fresenius Medical Care
General Credit Presentation November 2019 copy Fresenius SE amp Co KGaA Investor Relations
eurom Q1-319 Q1-318 growthrate
growthrate (cc)
Sales reported 12897 12247 5 1Divestitures of Care Coordination activities - -516
IFRS 16 effect 75 -
NxStage operations -188 -
Sales adjusted 12784 11731 9 5
EBIT reported 1653 2425 -32 -35Gain related to divestitures of Care Coordination activities -14 -830
Divestitures of Care Coordination activities - -14
IFRS 16 effect -68 -
NxStage operations 16 -
Transaction costs NxStage 22 -
Expenses associated with the cost optimization program 32 -
Impact of FCPA related charge - 75
EBIT adjusted 1641 1656 -1 -5
58
Reconciliation according to Fresenius Medical Care
General Credit Presentation November 2019 copy Fresenius SE amp Co KGaA Investor Relations
eurom Q1-319 Q1-318 growthrate
growthrate (cc)
Net income reported 857 1557 -45 -47Gain related to divestitures of Care Coordination activities -29 -690
Divestitures of Care Coordination activities - 4
IFRS 16 effect 45 -
NxStage operations 49 -
Transaction costs NxStage 16 -
Expenses associated with the cost optimization program 23 -
Impact of FCPA related charge - 75
Net income adjusted 961 946 2 -3
59
Reconciliation Fresenius Medical Care according to Fresenius Group
General Credit Presentation November 2019 copy Fresenius SE amp Co KGaA Investor Relations
eurom Q319 Q318 growthrate
growthrate (cc)
Sales reported 4419 4058 9 6Divestitures of Care Coordination activities - -7
IFRS 16 effect 35 -
Sales on a comparable basis 4454 4051 10 7
EBIT reported (after special items) 595 527 13 9Gain related to divestitures of Care Coordination activities -3 -10
Transaction costs NxStage 2 -
Expenses associated with the cost optimization program 25 -
Impact of FCPA related charge - 75
EBIT (before special items) 619 592 5 1Divestitures of Care Coordination activities - 0
IFRS 16 effect -20 -
EBIT on a comparable basis 599 592 1 -3
60
Reconciliation Fresenius Medical Care according to Fresenius Group
General Credit Presentation November 2019 copy Fresenius SE amp Co KGaA Investor Relations
eurom Q319 Q318 growthrate
growthrate (cc)
Net income reported (after special items) 332 284 17 12Gain related to divestitures of Care Coordination activities -20 -16
Transaction costs NxStage 1 -
Expenses associated with the cost optimization program 18 -
Impact of FCPA related charge - 75
Net income (before special items) 331 343 -3 -7Divestitures of Care Coordination activities - -1
IFRS 16 effect 17 -
Net income on a comparable basis 348 342 2 -2
61
Reconciliation Fresenius Medical Care according to Fresenius Group
General Credit Presentation November 2019 copy Fresenius SE amp Co KGaA Investor Relations
eurom Q1-319 Q1-318 growthrate
growthrate (cc)
Sales reported 12897 12247 5 1Divestitures of Care Coordination activities - -516
IFRS 16 effect 75 -
Sales on a comparable basis 12972 11731 11 7
EBIT reported (after special items) 1653 2425 -32 -35Gain related to divestitures of Care Coordination activities -14 -830
Transaction costs NxStage 22 -
Expenses associated with the cost optimization program 32 -
Impact of FCPA related charge - 75
EBIT (before special items) 1693 1670 1 -3Divestitures of Care Coordination activities - -14
IFRS 16 effect -68 -
EBIT on a comparable basis 1625 1656 -2 -6
62
Reconciliation Fresenius Medical Care according to Fresenius Group
General Credit Presentation November 2019 copy Fresenius SE amp Co KGaA Investor Relations
eurom Q1-319 Q1-318 growthrate
growthrate (cc)
Net income reported (after special items) 857 1557 -45 -47Gain related to divestitures of Care Coordination activities -29 -690
Transaction costs NxStage 16 -
Expenses associated with the cost optimization program 23 -
Impact of FCPA related charge - 75
Net income (before special items) 867 942 -8 -12Divestitures of Care Coordination activities - 4
IFRS 16 effect 45 -
Net income on a comparable basis 912 946 -4 -8
63
Reconciliation Fresenius Kabi
General Credit Presentation November 2019 copy Fresenius SE amp Co KGaA Investor Relations
eurom Q319 Q318 growthrate
growthrate (cc)
Sales reported 1761 1650 7 5
Transaction costs Akorn 0 6
Revaluations of biosimilars contingent liabilities 0 -
EBIT (before special items) 307 297 3 1IFRS 16 effect -1 -
EBIT on a comparable basis 306 297 3 1
Transaction costs Akorn 0 5
Revaluations of biosimilars contingent liabilities 1 -
Net income (before special items) 203 199 2 -1IFRS 16 effect 1 -
Net income on a comparable basis 204 199 3 0
64
Reconciliation Fresenius Kabi
General Credit Presentation November 2019 copy Fresenius SE amp Co KGaA Investor Relations
eurom Q1-319 Q1-318 growthrate
growthrate (cc)
Sales reported 5153 4857 6 5
Transaction costs Akorn 3 45
Revaluations of biosimilars contingent liabilities -4 -
EBIT (before special items) 920 854 8 4IFRS 16 effect -3 -
EBIT on a comparable basis 917 854 7 4
Transaction costs Akorn 3 36
Revaluations of biosimilars contingent liabilities -1 -
Net income (before special items) 614 554 11 7IFRS 16 effect 4 -
Net income on a comparable basis 618 554 12 8
65
Reconciliation Fresenius Helios
General Credit Presentation November 2019 copy Fresenius SE amp Co KGaA Investor Relations
eurom Q319 Q318 growthrate
Sales reported 2230 2088 7German post-acute care business transferred from Fresenius Helios to Fresenius Vamed - 0
Sales adjusted for German post-acute care business 2230 2088 7
EBIT reported 187 204 -8IFRS 16 effect -4 -
EBIT adjusted for IFRS 16 effect 183 204 -10German post-acute care business transferred from Fresenius Helios to Fresenius Vamed - 0EBIT adjusted for IFRS 16 effect and German post-acute care business 183 204 -10
66
Reconciliation Fresenius Helios
General Credit Presentation November 2019 copy Fresenius SE amp Co KGaA Investor Relations
eurom Q1-319 Q1-318 growthrate
Sales reported 6890 6762 2German post-acute care business transferred from Fresenius Helios to Fresenius Vamed - -226
Sales adjusted for German post-acute care business 6890 6536 5
EBIT reported 731 775 -6IFRS 16 effect -8 -
EBIT adjusted for IFRS 16 effect 723 775 -7German post-acute care business transferred from Fresenius Helios to Fresenius Vamed - -10EBIT adjusted for IFRS 16 effect and German post-acute care business 723 765 -5
67
Reconciliation Fresenius Vamed
General Credit Presentation November 2019 copy Fresenius SE amp Co KGaA Investor Relations
eurom Q319 Q318 growthrate
Sales reported 562 476 18German post-acute care business acquired from Fresenius Helios -121 -117
Sales adjusted for German post-acute care business 441 359 23
EBIT reported 33 31 6IFRS 16 effect 1 -
EBIT adjusted for IFRS 16 effect 34 31 10German post-acute care business acquired from Fresenius Helios -15 -15EBIT adjusted for IFRS 16 effect and German post-acute care business 19 16 19
68
Reconciliation Fresenius Vamed
General Credit Presentation November 2019 copy Fresenius SE amp Co KGaA Investor Relations
eurom Q1-319 Q1-318 growthrate
Sales reported 1469 991 48German post-acute care business acquired from Fresenius Helios -350 -117
Sales adjusted for German post-acute care business 1119 874 28
EBIT reported 67 49 37IFRS 16 effect -2 -
EBIT adjusted for IFRS 16 effect 65 49 33German post-acute care business acquired from Fresenius Helios -31 -15EBIT adjusted for IFRS 16 effect and German post-acute care business 34 34 0
69
Financial Calendar Contact
Financial Calendar 20 February 2020 Results FY19
06 May 2020 Results Q120
20 May 2020 Annual General Meeting
30 July 2020 Results Q220
29 October 2020 Results Q320
Please note that these dates could be subject to change
Contact
Investor RelationsFresenius SE amp Co KGaAphone +49 6172 608-2485e-mail ir-frefreseniuscomFor further information and current news wwwfreseniuscom
Follow us on Twitter wwwtwittercomfresenius_irand LinkedIn wwwlinkedincomcompanyfresenius-investor-relations
General Credit Presentation November 2019 copy Fresenius SE amp Co KGaA Investor Relations 70
- Presentation to Credit Investors
- Safe Harbor Statement
- Foliennummer 3
- Strong and Balanced Health Care Portfolio
- Fresenius Group Global Sales Base in Growing Non-Cyclical Markets
- Fresenius Group Strong Track Record of Organic Sales Growth in All Business Segments
- Fresenius Group Strong Track Record of EBITDA Generation
- Fresenius SE Earnings-Linked Dividend Policy
- Global Health Care Trends ndash Strong Growth Fundamentals
- Fresenius Medical Care Global Dialysis Market Leader
- Fresenius Medical Care Sales and EBIT development
- Fresenius Kabi A Leading Global Hospital Supplier
- Fresenius Kabi Sales and EBIT development
- Fresenius Helios Europersquos Largest Private Hospital OperatorHelios Germany
- Fresenius Helios Europersquos Largest Private Hospital Operator Helios Spain
- Fresenius Helios Sales and EBIT development
- Fresenius Vamed Leading Global Hospital Projects and Services Specialist
- Fresenius Vamed Sales an EBIT development
- Fresenius Group Key Figures
- Cash Flow Development by Business Segment
- Fresenius Group Consistent Cash Generation
- Fresenius Group Proven Track Record of Deleveraging
- Fresenius Group Capitalization ndash September 30 2019 excl IFRS 16
- Fresenius Group Capitalization ndash September 30 2019 incl IFRS 16
- Fresenius Group Broad Mix of Financing Instruments
- Foliennummer 26
- Fresenius Group excl Fresenius Medical CareDebt Maturity Profile ndash September 30 201912
- Fresenius Group Solid Balance Sheet Structure
- Fresenius Group Strong Access to Capital Markets
- Fresenius SE Rating History amp Rationale
- Fresenius Group 2019 Financial Outlook by Business Segment
- Fresenius Group 2019 Financial Guidance
- Fresenius Group Healthy Growth Targets 2020 ndash 2023 (CAGRs)
- FY18 base for Fresenius Group Guidance FY19
- FY18 base for Fresenius Medical Care Outlook FY19
- FY18 base for Fresenius Kabi Outlook FY19
- IFRS 16 effect on Group PampL
- IFRS 16 effect on Group Balance Sheet and Cash Flow
- Fresenius Group Credit Highlights
- Attachments
- Fresenius Group Key Figures
- Foliennummer 42
- Foliennummer 43
- Fresenius Group Cash Flow
- Fresenius Group Financial Results by Business Segment
- Fresenius Group Margins by Business Segment
- Fresenius SE amp Co KGaA Overview Bonds
- Fresenius Group Reconciliation
- Fresenius Group Reconciliation
- Fresenius Group Reconciliation
- Fresenius Group Reconciliation
- Fresenius Group Reconciliation
- Fresenius Group Reconciliation
- Fresenius Group Reconciliation
- Fresenius Group Reconciliation
- Reconciliation according to Fresenius Medical Care
- Reconciliation according to Fresenius Medical Care
- Reconciliation according to Fresenius Medical Care
- Reconciliation according to Fresenius Medical Care
- Reconciliation Fresenius Medical Care according to Fresenius Group
- Reconciliation Fresenius Medical Care according to Fresenius Group
- Reconciliation Fresenius Medical Care according to Fresenius Group
- Reconciliation Fresenius Medical Care according to Fresenius Group
- Reconciliation Fresenius Kabi
- Reconciliation Fresenius Kabi
- Reconciliation Fresenius Helios
- Reconciliation Fresenius Helios
- Reconciliation Fresenius Vamed
- Reconciliation Fresenius Vamed
- Financial Calendar Contact
-
| Sales | EBITDA | |||
| 2012 | 39 | |||
| 2013 | 39 | |||
| 2014 | 41 | |||
| 2015 | 51 | |||
| 2016 | 55 | |||
| 2017 | 63 | |||
| 2018 | 6 | |||
| cagr | ||||
| 15384615385 | ||||
| 74 |

002
023 025029
032037
042044
055
062
93 08 09 10 11 12 13 14 15 16 17 18
25 2421 20 21 21 22 21 22 23 24
Fresenius SE Earnings-Linked Dividend Policy
General Credit Presentation November 2019 copy Fresenius SE amp Co KGaA Investor Relations 8
euro per share
bull Dividend growth aligned to EPS1
growth
bull Pay-out Ratio 20 to 25
Dividend distribution (eurom)
Pay-out Ratio
075
2018 Pay-out Ratio 24 Dividend Policy
122 140 155 196 225 238 300 416114 343 445
080
1 Before special items
Global Health Care Trends ndash Strong Growth Fundamentals
9
1 WHO 10 facts on aging and the life course2 World Bank Health expenditure per capita3 World Economic Forum Health Systems Leapfrogging in Emerging Economies ndash Project Paper (2014)
General Credit Presentation November 2019 copy Fresenius SE amp Co KGaA Investor Relations
60+ Aging population and higher incidence of chronic diseasesWorld population age 60+ will reach gt2bn by 20501
Increasing health expenditure per capita 2014 vs 1999 ndash USA $9403 (+108) China $420 (+977) India $75 (+317)2
13 By 2022 one third of all global health expenditure will occur in Emerging Economies3
Fresenius Medical Care Global Dialysis Market Leader
bull The worldrsquos leading provider of dialysis products and services treating more than 342000 patients1
in 4003 clinics1
bull Provide highest standard of product quality and patient care
bull Expansion in Care Coordination and global dialysis service opportunities enter new geographies
Global Dialysis Market 2018 bull ~euro71 bnbull ~6 patient growth pa
Growth Drivers bull Aging population increasing incidence of diabetes
and high blood pressure treatment quality improvements
International30
Sales 2018euro165 bn North America
70
Dialysis products
Dialysis services
Complete therapy offerings
1 As of September 30 2019
Market Dynamics
10General Credit Presentation November 2019 copy Fresenius SE amp Co KGaA Investor Relations
21292409
25622306
15 16 17 18
15455
16570
17784
16547
15 16 17 18
Fresenius Medical Care Sales and EBIT development
General Credit Presentation November 2019 copy Fresenius SE amp Co KGaA Investor Relations 11
EBIT1 in euro millionSales in euro million
1 Before special items
Fresenius Kabi A Leading Global Hospital Supplier
bull Comprehensive product portfolio for critically and chronically ill patients
bull Strong Emerging Markets presencebull Leading market positions in four product
segments
bull Focus on organic growth through geographic product rollouts and new product launches
bull Development of biosimilars with a focus on oncology and autoimmune diseases
Global Addressable Market 2018 bull ~euro81 bnGrowth Drivers bull Patent expirations rising demand for health care
services higher health care spending in Emerging Markets
Market Dynamics
Emerging Markets30
Sales 2018euro65 bn Europe 34
North America 36
Generic IV Drugs
Clinical Nutrition
Infusion Therapy
Medical Devices Transfusion Technology
Biosimilars
12General Credit Presentation November 2019 copy Fresenius SE amp Co KGaA Investor Relations
1197
1171 1177
1139
15 16 17 18
59506007
6358
6544
15 16 17 18
Fresenius Kabi Sales and EBIT development
General Credit Presentation November 2019 copy Fresenius SE amp Co KGaA Investor Relations 13
Sales in euro million EBIT1 in euro million
1 Before special items
bull ~51 share in German acute care hospital market
bull Organic growth based on growing number ofadmissions and reimbursement rate increases
bull Ranks as quality leader in the German hospital sector defined quality targets publication of medical treatment results peer review processes
bull Key medical indicators eg mortality rate for heart failure pneumonia below German average
86 hospitals~29000 beds~12 million inpatient
admissions pa~41 million outpatient
admissions pa1 Based on sales 2 German Federal Statistical Office 2018 total costs gross of the German hospitals
less academic research and teaching As of September 30 2019
Fresenius Helios Europersquos Largest Private Hospital OperatorHelios Germany
German Acute Care Hospital Market bull ~euro102 bn2
Growth Drivers bull Aging population leading to increasing
hospital admissions
Largest network amp nationwide presence
Acute Care
Market Dynamics
Outpatient
14General Credit Presentation November 2019 copy Fresenius SE amp Co KGaA Investor Relations
bull ~euro30 bn sales in 2018
bull ~121 share in Spanish private hospital market
bull Market leader in size and quality with excellent growth prospects
bull Broad revenue base with privately insured patients PPPs self-pay and Occupational Risk Prevention (ORP)
bull Strong management team with proven track record
bull Cross-selling opportunities
Fresenius Helios Europersquos Largest Private Hospital Operator Helios Spain
Spanish Private Hospital Market bull ~euro14 bn2
Growth Drivers bull Aging population increasing number of privately
insured patients greenfield projects market consolidation
Quiroacutensalud hospitals in every major metropolitan region of Spain
Acute Care
Occupational Risk Prevention
Outpatient
1 Based on sales2 Market data based on company research Market definition does neither include
Public Private Partnerships (PPP) nor Occupational Risk Prevention centers (ORP)
Market Dynamics
As of September 30 2019
50 hospitals ~7000 beds~04 m inpatientadmissions pa~129 m outpatient admissions pa
15General Credit Presentation November 2019 copy Fresenius SE amp Co KGaA Investor Relations
642 683
1052 1052
15 16 17 18
5578 5843
8668 8993
15 16 17 18
Fresenius Helios Sales and EBIT development
General Credit Presentation November 2019 copy Fresenius SE amp Co KGaA Investor Relations 16
Sales in euro million EBIT in euro million
2017 11 months contribution of Helios Spain (Quiroacutensalud)1 Before special items
bull Manages hospital constructionexpansion projects and provides services for health care facilities worldwide
bull Offers project development planning turnkey construction maintenance as well as technical management and total operational management
bull Strong track record More than 900 projects in over 90 countries completed
bull Leading European post-acute care provider operating in five European countries
Fresenius Vamed Leading Global Hospital Projects and Services Specialist
Market Dynamics
Growth Drivers bull Emerging Market demand for building and
developing hospital infrastructurebull Outsourcing of non-medical services from public to
private operators
Emerging Markets22
Sales 2018euro17 bn Europe 78
Projects
Services
Post-acute care
17General Credit Presentation November 2019 copy Fresenius SE amp Co KGaA Investor Relations
1118
1160
1228
15 16 17 18
1688
6469
76
110
15 16 17 18
Fresenius Vamed Sales an EBIT development
General Credit Presentation November 2019 copy Fresenius SE amp Co KGaA Investor Relations 18
EBIT in euro millionSales in euro million
Fresenius Group Key Figures
General Credit Presentation November 2019 copy Fresenius SE amp Co KGaA Investor Relations 19
eurom 20181 20171 Growth (cc)5
Sales 33530 33886 6
EBITDA 5991 6267 0Margin 179 185
EBIT 4561 4830 -1Margin 136 143
Interest net -570 -652 7
EBT 3991 4178 0
Taxes -880 -1168 21
Net Income3 3111 3010 8
Employees4 276750 273249
1 Before special items2 4 organic growth 2 acquisitions 0 divestitures -4 currency effects 3 Net income incl attributable to non-controlling interest4 As of December 315 Adjusted for IFRS and divestitures of Care Coordination activities
Cash Flow Development by Business Segment
General Credit Presentation November 2019 copy Fresenius SE amp Co KGaA Investor Relations 20
1 Before acquisitions and dividends2 Margin incl FMC dividend3 Understated 17 excluding euro30 million of capex commitments from acquisitions
Operating CF Capex (net) Free Cash Flow1
eurom 2018 Margin 2018 Margin 2018 Margin
1040 159 -553 -85 487 74
554 62 -434 -49 120 133
106 63 -29 -17 77 46
CorporateOther -20 na -58 na -78 na
1680 1042 -1074 -63 606 412
2062 125 -1003 -61 1059 64
3742 112 -2077 -62 16654 50
Excl FMC
Group
Margin = in of sales
48 48 4852 53
5855 55 54
65
3
4
5
6
7
8
2009 2010 2011 2012 2013 2014 2015 2016 2017 2018
Fresenius Group Consistent Cash Generation
Capex gross in of sales
FCF margin (before acquisitions amp dividends)CFFO margin
21General Credit Presentation November 2019 copy Fresenius SE amp Co KGaA Investor Relations
110
120
103
126
114
109
120 122
116
112
8
9
10
11
12
13
14
2009 2010 2011 2012 2013 2014 2015 2016 2017 2018
63
74
56
76
62
52
67 67 66
50
3
4
5
6
7
8
9
2009 2010 2011 2012 2013 2014 2015 2016 2017 2018
Fresenius Group Proven Track Record of Deleveraging
22
Net DebtEBITDA1
1 At actual FX rates for both Net Debt and EBITDA before special items pro forma closed acquisitionsdivestitures2 Pro forma excluding advances made for the acquisition of hospitals from Rhoumln-Klinikum AG3 Calculated at actual FX rates for both net debt and EBITDA including acquisition of the NxStage excluding IFRS 16 effect (comparable to updated guidance from May 2 2019)4 Calculated at expected annual average exchange rates for both net debt and EBITDA including acquisition of NxStage without potential unannounced acquisitions adjusted for
IFRS 16 effects (comparable to updated guidance from May 2 2019)
32x
30x
27x
22x 23x
35x
30x
26x
36x
30x
26x
28x
25x 25x
34x
27x
24x
28x
27x
32x3
20
30
40
2001 2002 2003 2004 2005 Q106 2006 2007 2008 2009 2010 2011 2012 2013 2014 2015 2016 2017 2018 Q3192
Target 20194 around the upper-end of self-imposed target corridor of 25 ndash 30x
Hospitals from
General Credit Presentation November 2019 copy Fresenius SE amp Co KGaA Investor Relations
4
Fresenius Group Capitalization ndash September 30 2019 excl IFRS 16
23
1 Based on market capitalization for FSE and FMC as of September 30 20192 Before acquisition-related expenses Pro Forma acquisitions3 EURUSD exchange rate as of September 30 2019 except for market capitalization which uses the exchange rate as of September 30 2019
Instrument per Book Value in euro million in $ million3 oftotal cap EBITDA LTM x
Syndicated Credit Agreement Revolver (euro US-$) 229 249 04 Syndicated Credit Agreement Term Loan A (euro US-$) 2029 2209 36 Bonds (euro US-$) 5516 6006 98 Convertible Bonds 463 504 08 Schuldschein Loans 2191 2386 39 Commercial Paper 1000 1089 18 Other debt 836 910 15 Total Debt (FSE excl FMC) gross 12264 13354 218 Cash (excl FMC) 917 999 16 Total debt (FSE excl FMC) net 11347 12356 201 Total FMC debt net 8246 8979 146 Consolidation Adjustments (78) (85)Total consolidated debt net 19515 21250 346 32x Market capitalization1 36859 40136 654 60x
Total capitalization 56374 61386 1000 92x FSE Group EBITDA2 6100
General Credit Presentation November 2019 copy Fresenius SE amp Co KGaA Investor Relations
4
Fresenius Group Capitalization ndash September 30 2019 incl IFRS 16
24
1 Based on market capitalization for FSE and FMC as of September 30 20192 Before acquisition-related expenses Pro Forma acquisitions3 EURUSD exchange rate as of September 30 2019 except for market capitalization which uses the exchange rate as of September 30 2019
Instrument per Book Value in euro million in $ million3 oftotal cap EBITDA LTM x
Syndicated Credit Agreement Revolver (euro US-$) 229 249 04 Syndicated Credit Agreement Term Loan A (euro US-$) 2029 2209 33 Bonds (euro US-$) 5516 6006 89 Convertible Bonds 463 504 07 Schuldschein Loans 2191 2386 35 Commercial Paper 1000 1089 16 Lease Obligations 1749 1904 28 Other debt 653 711 10 Total Debt (FSE excl FMC) gross 13830 15059 222 Cash (excl FMC) 917 999 15 Total debt (FSE excl FMC) net 12913 14061 207 Total FMC debt net 12704 13833 204 Consolidation Adjustments (203) (221) (03)Total consolidated debt net 25414 27673 408 36x Market capitalization1 36859 40136 592 52x
Total capitalization 62273 67810 1000 88x FSE Group EBITDA2 7064
General Credit Presentation November 2019 copy Fresenius SE amp Co KGaA Investor Relations
Fresenius Group Broad Mix of Financing Instruments
General Credit Presentation November 2019 copy Fresenius SE amp Co KGaA Investor Relations 25
Commercial Paper 9
Other financial Liabilities 13
Syndicated loans 22 Bonds 42
Equity-neutralconvertible bonds 4
Total BS Debt1
~euro21114 m
1 As of September 30 2019 adjusted for IFRS 16 effect
bull Optimize funding costs and ensure financial flexibility
bull Diversify investor base
bull Strong liquidity provided by sufficient financial cushion (~euro29 billion as of September 30 2019)
Well Positioned to Meet Financing NeedsSchuldschein Loans 10
Average interest ratecost of debt22 pa
26
Fresenius GroupDebt Maturity Profile ndash September 30 201912
1 Based on utilization of major financing instruments2 Excluding IFRS 16 adjustments
eurom
General Credit Presentation November 2019 copy Fresenius SE amp Co KGaA Investor Relations
779
1653 1704
2384
367 500 459
637
1163
1944
2260
708
2071
500
238
907
584
5000
1000
2000
3000
4000
5000
2019 2020 2021 2022 2023 2024 2025 2026 2027 2028 2029 2030 2031 2032
Fresenius Medical Care Fresenius excl Fresenius Medical Care
Maturity 32 years on
average
Fresenius Group excl Fresenius Medical CareDebt Maturity Profile ndash September 30 201912
27General Credit Presentation November 2019 copy Fresenius SE amp Co KGaA Investor Relations
1 Based on utilization of major financing instruments2 Excluding IFRS 16 adjustments
eurom
500726 700
276
1150
500700
500 500
39
155
9051167
106
314
393
432
421
238
207
84
500
598
402
0
500
1000
1500
2000
2500
2019 2020 2021 2022 2023 2024 2025 2026 2027 2028 2029 2030 2031 2032
Bonds Syndicated Loan Schuldschein Loans Equity-neutral convertible bonds Commercial Paper
Maturity 37 years on
average
23 23 23 23
34 32 36 33
43 45 41 44
Dec 31 15 Dec 31 16 Dec 31 17 Dec 31 18
Equity and noncontrolling interest Debt Other liabilities
Fresenius Group Solid Balance Sheet Structure
Healthy Equity and Liability Split
bull Strong equity ratio of gt40 on average
bull Equity ratio kept in narrow range despite rapid growth of Fresenius Group
General Credit Presentation November 2019 copy Fresenius SE amp Co KGaA Investor Relations 28
432 467 531 567
BS total (eurobn)
Fresenius Group Strong Access to Capital Markets
29
Major Financing Instruments
2009 2010 2011 2012 2013 2014 2015 2016 2017 2018 2019
Bondseuro425 m$500 m
euro250 m euro800 m$105 bn
euro750 m$15 bn
euro500 m euro12 bn$12 bn
$300 m euro26 bn euro500 m euro10 bn$500 m1
SyndicatedLoans
$35 bn $898 m $385 bn $18 bneuro245 bn
$41 bneuro700 m
$115 bneuro205 bn
euro530 bn$355 bn
euro100sup2
SchuldscheinLoans
euro200 m euro400 m euro125 m euro500 m euro112 m $400 m euro10 bn euro700 msup3
Convertible Bonds
euro900 m euro500 m
Equityeuro10 bn euro400 m
1 June 2019 new $500 million 2019-2029 Bond issued by Fresenius Medical Care amp Co KGaA2 August 2019 euro100 million increased Revolving Facilities of Fresenius SE amp Co KGaA3 September 2019 new euro700 million 2019-202320262029 Schuldschein Loan issued by Fresenius SE amp Co KGaA
General Credit Presentation November 2019 copy Fresenius SE amp Co KGaA Investor Relations
Fresenius SE Rating History amp Rationale
General Credit Presentation November 2019 copy Fresenius SE amp Co KGaA Investor Relations 30
ldquoFSE delivers solid organic growth thanks to positive underlying growth trends in the life-saving and life-sustaining products and therapies that the group offersrdquo SampP Jan 08 2019
ldquoFSErsquos rating remains anchored in investment-grade given its mature and defensive business risk profile the grouprsquos deleveraging ability based on free cash flow generation and its record of integrating acquisitions successfully and reducing financial leverage in line with communicated policiesrdquo Fitch Sep 20 2018
ldquoThe Baa3 long term issuer rating of FSE reflects its strong defensive business profile underpinned by large absolute scale global footprint and segmental diversification within the healthcare market supported by strong position in its four business segmentsrdquo Moodyrsquos May 15 2018
Rating History Rating Agenciesrsquo Key Statements
In May 2019 SampP upgraded Fresenius to BBB with stable outlook
SampP Moodylsquos Fitch
Corporate Credit Rating BBB Baa3 BBB-
Outlook stable stable stable
Current Credit Ratings
Fresenius Group 2019 Financial Outlook by Business Segment
General Credit Presentation November 2019 copy Fresenius SE amp Co KGaA Investor Relations 31
eurom (except otherwise stated) FY18 Base1 FY19e2
Sales growth3 (cc) 16026 3 ndash 7
Net income growth34 (cc) 1341 -2 to 2
Sales growth (organic) 6544 3 ndash 6
EBIT growth (cc) 1139 3 ndash 6
Sales growth (organic) 8993 2 ndash 5
EBIT 1052 -5 to -2
Sales growth (organic) 1688 ~10
EBIT growth 110 15 ndash 20
1 Before special items and after adjustments2 Before special items (transaction-related expenses expenses associated with cost optimization program at FMC revaluations of biosimilars contingent liabilities) adjusted for IFRS 16 effect3 Excluding effects from NxStage transaction4 Net income attribuitable to shareholders of Fresenius Medical Care AG amp Co KGaA
For a detailed overview of adjustments and special items please see the reconciliation tables on slides 48-69 and for the bases
eurom (except otherwise stated) FY18 Base1 FY192
Sales growth (cc) 33009 4 - 7
Net income3 growth (cc) 1872 ~0
Fresenius Group 2019 Financial Guidance
1 Before special items and after adjustments2 Excluding transaction-related expenses expenses associated with the cost optimization program at FMC revaluations of biosimilars contingent liabilities including operating results of
NxStage adjusted for IFRS 16 effects3 Net income attributable to shareholders of Fresenius SEampCo KGaA
For a detailed overview of adjustments and special items please see the reconciliation tables on slides 48-69 and for the bases
32General Credit Presentation November 2019 copy Fresenius SE amp Co KGaA Investor Relations
Fresenius Group Healthy Growth Targets 2020 ndash 2023 (CAGRs)
General Credit Presentation November 2019 copy Fresenius SE amp Co KGaA Investor Relations 33
Organic sales growth 4 ndash 7 (plus ~1 small tomid-size acquisitions)
Organic net income1 growth 5 ndash 9 (plus ~1 small tomid-size acquisitions)
1 Net income attributable to shareholders of Fresenius SEampCo KGaA
Before special items
FY18 base for Fresenius Group Guidance FY19
General Credit Presentation November 2019 copy Fresenius SE amp Co KGaA Investor Relations 34
eurom
Sales reported 33530
Divestitures of Care Coordination activities at FMC (H118) -521
Sales basis for growth rates 33009
Net Income reported 2027
Transaction Costs Akorn Biosimilars 25
Bridge Financing Costs Akorn 12
Revaluations of Biosimilars contingent liabililties 5
Impact of FCPA related charge 9
Gain related to divestitures of Care Coordination activities -207
Net income (before special items) 1871
Divestitures of Care Coordination activities at FMC (H118) 1
Net income basis for growth rates (before special items and after adjustments) 1872
FY18 base for Fresenius Medical Care Outlook FY19
General Credit Presentation November 2019 copy Fresenius SE amp Co KGaA Investor Relations 35
eurom
Sales reported 16547
Divestitures of Care Coordination activities at FMC (H118) -521
Sales basis for growth rates 16026
Net Income reported 1982
Impact of FCPA related charge 28
Gain related to divestitures of Care Coordination activities -673
Net income (before special items) 1337
Divestitures of Care Coordination activities at FMC (H118) 4
Net income basis for growth rates (before special items and after adjustments) 1341
FY18 base for Fresenius Kabi Outlook FY19
General Credit Presentation November 2019 copy Fresenius SE amp Co KGaA Investor Relations 36
eurom
Sales basis for growth rates 6544
Transaction Costs Akorn Biosimilars 34
Revaluations of Biosimilars contingent liabililties 7
EBIT (before special items = base for Kabi guidance) 1139
The special items are reported in the Group CorporateOther segment
IFRS 16 effect on Group PampL
General Credit Presentation November 2019 copy Fresenius SE amp Co KGaA Investor Relations
eurom
Q319 before
special items adjusted for
IFRS 16 effect IFRS 16 effect
Q319 before
special itemsaccording to
IFRS 16
Q1-319 before
special items adjusted for
IFRS 16 effect IFRS 16 effect
Q1-319 before
special itemsaccording to
IFRS 16
Sales 8877 -35 8842 26173 -75 26098
EBITDA 1526 237 1763 4468 699 5167
Depreciation and amortization -396 -214 -610 -1146 -620 -1766
EBIT 1130 23 1153 3322 79 3401
Net interest -124 -47 -171 -379 -153 -532
Income taxes -232 5 -227 -680 18 -662
Noncontrolling interest -321 11 -310 -865 31 -834
Net income1 453 -8 445 1398 -25 1373
37
1 Net income attributable to shareholders of Fresenius SE amp Co KGaA
IFRS 16 effect on Group Balance Sheet and Cash Flow
General Credit Presentation November 2019 copy Fresenius SE amp Co KGaA Investor Relations
eurom
Sep 30 2019adjusted for
IFRS 16 effect IFRS 16 effect
Sep 30 2019according to
IFRS 16
Right-of-use-assets 1901 5667 5857Lease liabilities 4142 5899 6313Equity 26928 -232 26696Total assets 61092 5667 66759
38
1 Reclassification from machinery equipment and rental equipment under capital leases as of December 31 20182 Reclassifications from capital lease obligations and other liabilities as of December 31 2018
eurom
Q319adjusted for
IFRS 16 effect IFRS 16 effect
Q319according to
IFRS 16
Q1-319adjusted for
IFRS 16 effect IFRS 16 effect
Q1-319according to
IFRS 16
Operating cash flow 1298 185 1483 2439 538 2977Cash flow before acquisitions and dividends 722 185 907 850 538 1388
Free cash flow 547 185 732 -2172 538 -1634Cash provided byused for financing activities -461 -185 -646 995 -538 457
Balance Sheet
Cash Flow
Fresenius Group Credit Highlights
General Credit Presentation November 2019 copy Fresenius SE amp Co KGaA Investor Relations 39
Consistent Cash Generation
Proven Track Record of Deleveraging Following Acquisitions
Broad Mix of Financing Instruments
Well-Balanced Maturity Profile
Solid Balance Sheet Structure
Strong Access to Capital Markets
Attachments
General Credit Presentation November 2019 copy Fresenius SE amp Co KGaA Investor Relations 40
Fresenius Group Key Figures
General Credit Presentation November 2019 copy Fresenius SE amp Co KGaA Investor Relations 41
1 2018 and 2017 before special items 2018 2017 and 2016 pro forma acquisitionsdivestitures2 2018 and 2017 before special items 3 2016 pro forma Quiroacutensalud acquisition 3154 2016 pro forma Quiroacutensalud acquisition 309
2018 2017 2016
Debt (eurom) thereof US$ denominated
1898428
1904231
1478052
Net debt (eurom) 16275 17406 13201
Net debtEBITDA13
Net debt at year-end exchange rate EBITDA at LTM average FX rates
273 279 239
Net debtEBITDA14
at LTM average FX rates for both net debt and EBITDA
271 284 233
Operating Cash flowSales 112 116 122
EBITDAInterest2 105 96 95
42
Fresenius Group Debt and Cash Flow Structure ndash Sep 30 2019 adj for IFRS 16
Fresenius Medical Care
Financing
Fresenius SE Financing
Group Net Debt ~euro195 bn1
DividendsRents Service Agreements
~313 100 77100
- euro306 m Net Debt4 euro63 m Net Debt4 euro32 m Net Debt4euro8246 m Net Debt4
Profit transfer Agreements6
bull Separate financing of Fresenius SE and Fresenius Medical Care
bull No joint financing facilities or mutual guarantees
bull Fresenius Kabi Fresenius Helios and Fresenius Vamed financed primarily through Fresenius SE to avoid structural subordination
FSE Net Debt~euro113 bn
incl Net Debt of KabiHeliosVamed
StockMarketValue~euro58 bn5 FSE Net Debt2
~euro115 bn
1 Incl consolidation adjustments2 Incl Fresenius financing subsidiaries3 Controlling stake4 Incl subsidiaries 5 Based on market capitalization for FMC as of September 30 20196 Via German holding entities (Fresenius Kabi AG and Fresenius ProServe GmbH)
General Credit Presentation November 2019 copy Fresenius SE amp Co KGaA Investor Relations
43
Fresenius Group Debt and Cash Flow Structure ndash Sep 30 2019 accord to IFRS 16
1 Incl consolidation adjustments2 Incl Fresenius financing subsidiaries3 Controlling stake4 Incl subsidiaries 5 Based on market capitalization for FMC as of September 30 20196 Via German holding entities (Fresenius Kabi AG and Fresenius ProServe GmbH)
Fresenius Medical Care
Financing
Fresenius SE Financing
Group Net Debt ~euro254 bn1
DividendsRents Service Agreements
~313 100 77100
euro50 m Net Debt4 euro921 m Net Debt4 euro331 m Net Debt4euro12704 m Net Debt4
Profit transfer Agreements6
bull Separate financing of Fresenius SE and Fresenius Medical Care
bull No joint financing facilities or mutual guarantees
bull Fresenius Kabi Fresenius Helios and Fresenius Vamed financed primarily through Fresenius SE to avoid structural subordination
FSE Net Debt~euro127 bn
incl Net Debt of KabiHeliosVamed
StockMarketValue~euro58 bn5 FSE Net Debt2
~euro114 bn
General Credit Presentation November 2019 copy Fresenius SE amp Co KGaA Investor Relations
Fresenius Group Cash Flow
General Credit Presentation November 2019 copy Fresenius SE amp Co KGaA Investor Relations 44
eurom 2018 Margin 2017 Margin Δ YoY
Operating Cash Flow 3742 112 3937 116 -5
Capex (net) -2077 -62 -1705 -50 -22
Free Cash Flow(before acquisitions and dividends)
1665 50 2232 66 -25
Acquisitions (net) -613 -5865 --
Dividends -904 -924 2
Free Cash Flow(after acquisitions and dividends)
-1374 -41 -4557 -134 --
Fresenius Group Financial Results by Business Segment
General Credit Presentation November 2019 copy Fresenius SE amp Co KGaA Investor Relations 45
2018 2017 2016 Growth2
20182017
Sales euro16547 m euro17784 m euro16570 m 41
EBIT euro2306 m euro2562 m euro2409 m 61
Sales euro6544 m euro6358 m euro6007 m 7
EBIT euro1139 m euro1177 m euro1171 m 2
Sales euro8993 m euro8668 m euro5843 m 6
EBIT euro1052 m euro1052 m euro683 m 3
Sales euro1688 m euro1228 m euro1160 m 19
EBIT euro110m euro76 m euro69 m 9
Sales euro33530 m euro33886 m euro29471 m 6
EBIT euro4561 m euro4830 m euro4302 m -1Group
2018 and 2017 before special items
1 FMC on a comparable basis2 Growth rates at constant currency and after adjustments
Fresenius Group Margins by Business Segment
General Credit Presentation November 2019 copy Fresenius SE amp Co KGaA Investor Relations 46
2018 and 2017 before special items
2018 2017 2016
EBITDA margin 183 185 188
EBIT margin 139 144 145
EBITDA margin 219 233 244
EBIT margin 174 185 195
EBITDA margin 159 165 150
EBIT margin 117 121 117
EBITDA margin 79 71 69
EBIT margin 65 62 59
EBITDA margin 179 185 187
EBIT margin 136 143 146Group
Fresenius SE amp Co KGaA Overview Bonds
General Credit Presentation November 2019 copy Fresenius SE amp Co KGaA Investor Relations 47
Issuer Volume(in millions)
Coupon type
Coupon (in )
MaturityTerm
ISIN (RegS)
WKN
Fresenius SE amp Co KGaAeuro500 Fix 2875 20132020 XS0873432511 A1HEWZ
Fresenius SE amp Co KGaAeuro450 Fix 300 20142021 XS1013955379 A1ZB7H
Fresenius SE amp Co KGaAeuro450 Fix 400 20142024 XS1026109204 A1ZC60
Fresenius SE amp Co KGaAeuro 500 Fix 1875 20192025 XS1936208252 A2NBMS
Fresenius SE amp Co KGaAeuro 500 Fix 2875 20192029 XS1936208419 A2NBMT
Fresenius Finance Ireland plceuro700 Fix 0875 20172022 XS1554373164 A19B3F
Fresenius Finance Ireland plceuro700 Fix 150 20172024 XS1554373248 A19B3G
Fresenius Finance Ireland plceuro700 Fix 2125 20172027 XS1554373677 A19B3H
Fresenius Finance Ireland plceuro500 Fix 300 20172032 XS1554373834 A19B3J
Fresenius US Finance II IncUS$300 Fix 425 20142021 USU31436AG04 A1ZDVJ
Fresenius US Finance II IncUS$300 Fix 450 20152023 USU31436AH86 A1Z64A
Fresenius Group Reconciliation
General Credit Presentation November 2019 copy Fresenius SE amp Co KGaA Investor Relations
eurom Q319 Q318 growthrate
growthrate (cc)
Sales reported 8842 8192 8 6Divestitures of Care Coordination activities at FMC - -7
IFRS 16 effect 35 -
Sales on a comparable basis 8877 8185 8 6
EBIT reported (after special items) 1129 1041 8 6Transaction costs Akorn 0 6
Bridge Financing costs Akorn - 0
Revaluations of biosimilars contingent liabilities 0 -
Gain related to divestitures of Care Coordination activities -3 -10
Transaction costs NxStage 2 -
Expenses associated with the cost optimization program at FMC 25 -
Impact of FCPA related charge - 75
EBIT (before special items) 1153 1112 4 1Divestitures of Care Coordination activities at FMC - 0
IFRS 16 effect -23 -
EBIT on a comparable basis 1130 1112 2 -1
48
Fresenius Group Reconciliation
General Credit Presentation November 2019 copy Fresenius SE amp Co KGaA Investor Relations
eurom Q319 Q318 growthrate
growthrate (cc)
Net interest reported (after special items) -172 -146 -18 -15Bridge Financing costs Akorn - 5
Revaluations of biosimilars contingent liabilities 1 -
Net interest (before special items) -171 -141 -21 -18Divestitures of Care Coordination activities at FMC - 0
IFRS 16 effect 47 -
Net interest on a comparable basis -124 -141 12 15
49
Fresenius Group Reconciliation
General Credit Presentation November 2019 copy Fresenius SE amp Co KGaA Investor Relations
eurom Q319 Q318 growthrate
growthrate (cc)
Income taxes reported (after special items) -202 -196 -3 -1Transaction costs Akorn 0 -1Bridge Financing costs Akorn - -2Revaluations of biosimilars contingent liabilities 0 -Gain related to divestitures of Care Coordination activities -17 -7Transaction costs NxStage -1 -Expenses associated with the cost optimization program at FMC -7 -Income taxes (before special items) -227 -206 -10 -7Divestitures of Care Coordination activities at FMC - -1IFRS 16 effect -5 -Income taxes on a comparable basis -232 -207 -12 -10
Noncontrolling interest reported (after special items) -311 -280 -11 -7Gain related to divestitures of Care Coordination activities 14 12Transaction costs NxStage 0 -Expenses associated with the cost optimization program at FMC -13 -Impact of FCPA related charge - -52Noncontrolling interest (before special items) -310 -320 3 7Divestitures of Care Coordination activities at FMC - 0IFRS 16 effect -11 -Noncontrolling interest on a comparable basis -321 -320 0 3
50
Fresenius Group Reconciliation
General Credit Presentation November 2019 copy Fresenius SE amp Co KGaA Investor Relations
eurom Q319 Q318 growthrate
growthrate (cc)
Net income reported (after special items) 444 419 6 4Transaction costs Akorn 0 5
Bridge Financing costs Akorn - 3
Revaluations of biosimilars contingent liabilities 1 -
Gain related to divestitures of Care Coordination activities -6 -5
Transaction costs NxStage 1 -
Expenses associated with the cost optimization program at FMC 5 -
Impact of FCPA related charge - 23
Net income (before special items) 445 445 0 -2Divestitures of Care Coordination activities at FMC - -1
IFRS 16 effect 8 -
Net income on a comparable basis 453 444 2 0
51
Fresenius Group Reconciliation
General Credit Presentation November 2019 copy Fresenius SE amp Co KGaA Investor Relations
eurom Q1-319 Q1-318 growthrate
growthrate (cc)
Sales reported 26098 24695 6 3Divestitures of Care Coordination activities at FMC - -516
IFRS 16 effect 75 -
Sales on a comparable basis 26173 24179 8 6
EBIT reported (after special items) 3362 4020 -16 -19Transaction costs Akorn 3 45
Bridge Financing costs Akorn - 1
Revaluations of biosimilars contingent liabilities -4 -
Gain related to divestitures of Care Coordination activities -14 -830
Transaction costs NxStage 22 -
Expenses associated with the cost optimization program at FMC 32 -
Impact of FCPA related charge - 75
EBIT (before special items) 3401 3311 3 0Divestitures of Care Coordination activities at FMC - -14
IFRS 16 effect -79 -
EBIT on a comparable basis 3322 3297 1 -2
52
Fresenius Group Reconciliation
General Credit Presentation November 2019 copy Fresenius SE amp Co KGaA Investor Relations
eurom Q1-319 Q1-318 growthrate
growthrate (cc)
Net interest reported (after special items) -535 -453 -18 -15Bridge Financing costs Akorn - 12
Revaluations of biosimilars contingent liabilities 3 -
Net interest (before special items) -532 -441 -21 -17Divestitures of Care Coordination activities at FMC - 21
IFRS 16 effect 153 -
Net interest on a comparable basis -379 -420 10 12
53
Fresenius Group Reconciliation
General Credit Presentation November 2019 copy Fresenius SE amp Co KGaA Investor Relations
eurom Q1-319 Q1-318 growthrate
growthrate (cc)
Income taxes reported (after special items) -632 -754 16 19Transaction costs Akorn 0 -9Bridge Financing costs Akorn - -4Revaluations of biosimilars contingent liabilities 0 -Gain related to divestitures of Care Coordination activities -15 140Transaction costs NxStage -6 -Expenses associated with the cost optimization program at FMC -9 -Income taxes (before special items) -662 -627 -6 -2Divestitures of Care Coordination activities at FMC - -2IFRS 16 effect -18 -Income taxes on a comparable basis -680 -629 -8 -5
Noncontrolling interest reported (after special items) -827 -1302 36 39Gain related to divestitures of Care Coordination activities 20 478Transaction costs NxStage -11 -Expenses associated with the cost optimization program at FMC -16 -Impact of FCPA related charge - -52Noncontrolling interest (before special items) -834 -876 5 9Divestitures of Care Coordination activities at FMC - -4IFRS 16 effect -31 -Noncontrolling interest on a comparable basis -865 -880 2 6
54
Fresenius Group Reconciliation
General Credit Presentation November 2019 copy Fresenius SE amp Co KGaA Investor Relations
eurom Q1-319 Q1-318 growthrate
growthrate (cc)
Net income reported (after special items) 1368 1511 -9 -12Transaction costs Akorn 3 36
Bridge Financing costs Akorn - 9
Revaluations of biosimilars contingent liabilities -1 -
Gain related to divestitures of Care Coordination activities -9 -212
Transaction costs NxStage 5 -
Expenses associated with the cost optimization program at FMC 7 -
Impact of FCPA related charge - 23
Net income (before special items) 1373 1367 0 -2Divestitures of Care Coordination activities at FMC - 1
IFRS 16 effect 25 -
Net income on a comparable basis 1398 1368 2 0
55
Reconciliation according to Fresenius Medical Care
General Credit Presentation November 2019 copy Fresenius SE amp Co KGaA Investor Relations
eurom Q319 Q318 growthrate
growthrate (cc)
Sales reported 4419 4058 9 6Divestitures of Care Coordination activities - -7
IFRS 16 effect 35 -
NxStage operations -79 -
Sales adjusted 4375 4051 8 5
EBIT reported 595 527 13 9
Gain related to divestitures of Care Coordination activities -2 -10
Divestitures of Care Coordination activities - 0
IFRS 16 effect -21 -
NxStage operations 0 -
Transaction costs NxStage 2 -
Expenses associated with the cost optimization program 25 -
Impact of FCPA related charge - 75EBIT adjusted 599 592 1 -3
56
Reconciliation according to Fresenius Medical Care
General Credit Presentation November 2019 copy Fresenius SE amp Co KGaA Investor Relations
eurom Q319 Q318 growthrate
growthrate (cc)
Net income reported 333 285 17 12
Gain related to divestitures of Care Coordination activities -20 -17
Divestitures of Care Coordination activities - 0
IFRS 16 effect 16 -
NxStage operations 15 -
Transaction costs NxStage 1 -
Expenses associated with the cost optimization program 18 -
Impact of FCPA related charge - 75Net income adjusted 363 343 6 2
57
Reconciliation according to Fresenius Medical Care
General Credit Presentation November 2019 copy Fresenius SE amp Co KGaA Investor Relations
eurom Q1-319 Q1-318 growthrate
growthrate (cc)
Sales reported 12897 12247 5 1Divestitures of Care Coordination activities - -516
IFRS 16 effect 75 -
NxStage operations -188 -
Sales adjusted 12784 11731 9 5
EBIT reported 1653 2425 -32 -35Gain related to divestitures of Care Coordination activities -14 -830
Divestitures of Care Coordination activities - -14
IFRS 16 effect -68 -
NxStage operations 16 -
Transaction costs NxStage 22 -
Expenses associated with the cost optimization program 32 -
Impact of FCPA related charge - 75
EBIT adjusted 1641 1656 -1 -5
58
Reconciliation according to Fresenius Medical Care
General Credit Presentation November 2019 copy Fresenius SE amp Co KGaA Investor Relations
eurom Q1-319 Q1-318 growthrate
growthrate (cc)
Net income reported 857 1557 -45 -47Gain related to divestitures of Care Coordination activities -29 -690
Divestitures of Care Coordination activities - 4
IFRS 16 effect 45 -
NxStage operations 49 -
Transaction costs NxStage 16 -
Expenses associated with the cost optimization program 23 -
Impact of FCPA related charge - 75
Net income adjusted 961 946 2 -3
59
Reconciliation Fresenius Medical Care according to Fresenius Group
General Credit Presentation November 2019 copy Fresenius SE amp Co KGaA Investor Relations
eurom Q319 Q318 growthrate
growthrate (cc)
Sales reported 4419 4058 9 6Divestitures of Care Coordination activities - -7
IFRS 16 effect 35 -
Sales on a comparable basis 4454 4051 10 7
EBIT reported (after special items) 595 527 13 9Gain related to divestitures of Care Coordination activities -3 -10
Transaction costs NxStage 2 -
Expenses associated with the cost optimization program 25 -
Impact of FCPA related charge - 75
EBIT (before special items) 619 592 5 1Divestitures of Care Coordination activities - 0
IFRS 16 effect -20 -
EBIT on a comparable basis 599 592 1 -3
60
Reconciliation Fresenius Medical Care according to Fresenius Group
General Credit Presentation November 2019 copy Fresenius SE amp Co KGaA Investor Relations
eurom Q319 Q318 growthrate
growthrate (cc)
Net income reported (after special items) 332 284 17 12Gain related to divestitures of Care Coordination activities -20 -16
Transaction costs NxStage 1 -
Expenses associated with the cost optimization program 18 -
Impact of FCPA related charge - 75
Net income (before special items) 331 343 -3 -7Divestitures of Care Coordination activities - -1
IFRS 16 effect 17 -
Net income on a comparable basis 348 342 2 -2
61
Reconciliation Fresenius Medical Care according to Fresenius Group
General Credit Presentation November 2019 copy Fresenius SE amp Co KGaA Investor Relations
eurom Q1-319 Q1-318 growthrate
growthrate (cc)
Sales reported 12897 12247 5 1Divestitures of Care Coordination activities - -516
IFRS 16 effect 75 -
Sales on a comparable basis 12972 11731 11 7
EBIT reported (after special items) 1653 2425 -32 -35Gain related to divestitures of Care Coordination activities -14 -830
Transaction costs NxStage 22 -
Expenses associated with the cost optimization program 32 -
Impact of FCPA related charge - 75
EBIT (before special items) 1693 1670 1 -3Divestitures of Care Coordination activities - -14
IFRS 16 effect -68 -
EBIT on a comparable basis 1625 1656 -2 -6
62
Reconciliation Fresenius Medical Care according to Fresenius Group
General Credit Presentation November 2019 copy Fresenius SE amp Co KGaA Investor Relations
eurom Q1-319 Q1-318 growthrate
growthrate (cc)
Net income reported (after special items) 857 1557 -45 -47Gain related to divestitures of Care Coordination activities -29 -690
Transaction costs NxStage 16 -
Expenses associated with the cost optimization program 23 -
Impact of FCPA related charge - 75
Net income (before special items) 867 942 -8 -12Divestitures of Care Coordination activities - 4
IFRS 16 effect 45 -
Net income on a comparable basis 912 946 -4 -8
63
Reconciliation Fresenius Kabi
General Credit Presentation November 2019 copy Fresenius SE amp Co KGaA Investor Relations
eurom Q319 Q318 growthrate
growthrate (cc)
Sales reported 1761 1650 7 5
Transaction costs Akorn 0 6
Revaluations of biosimilars contingent liabilities 0 -
EBIT (before special items) 307 297 3 1IFRS 16 effect -1 -
EBIT on a comparable basis 306 297 3 1
Transaction costs Akorn 0 5
Revaluations of biosimilars contingent liabilities 1 -
Net income (before special items) 203 199 2 -1IFRS 16 effect 1 -
Net income on a comparable basis 204 199 3 0
64
Reconciliation Fresenius Kabi
General Credit Presentation November 2019 copy Fresenius SE amp Co KGaA Investor Relations
eurom Q1-319 Q1-318 growthrate
growthrate (cc)
Sales reported 5153 4857 6 5
Transaction costs Akorn 3 45
Revaluations of biosimilars contingent liabilities -4 -
EBIT (before special items) 920 854 8 4IFRS 16 effect -3 -
EBIT on a comparable basis 917 854 7 4
Transaction costs Akorn 3 36
Revaluations of biosimilars contingent liabilities -1 -
Net income (before special items) 614 554 11 7IFRS 16 effect 4 -
Net income on a comparable basis 618 554 12 8
65
Reconciliation Fresenius Helios
General Credit Presentation November 2019 copy Fresenius SE amp Co KGaA Investor Relations
eurom Q319 Q318 growthrate
Sales reported 2230 2088 7German post-acute care business transferred from Fresenius Helios to Fresenius Vamed - 0
Sales adjusted for German post-acute care business 2230 2088 7
EBIT reported 187 204 -8IFRS 16 effect -4 -
EBIT adjusted for IFRS 16 effect 183 204 -10German post-acute care business transferred from Fresenius Helios to Fresenius Vamed - 0EBIT adjusted for IFRS 16 effect and German post-acute care business 183 204 -10
66
Reconciliation Fresenius Helios
General Credit Presentation November 2019 copy Fresenius SE amp Co KGaA Investor Relations
eurom Q1-319 Q1-318 growthrate
Sales reported 6890 6762 2German post-acute care business transferred from Fresenius Helios to Fresenius Vamed - -226
Sales adjusted for German post-acute care business 6890 6536 5
EBIT reported 731 775 -6IFRS 16 effect -8 -
EBIT adjusted for IFRS 16 effect 723 775 -7German post-acute care business transferred from Fresenius Helios to Fresenius Vamed - -10EBIT adjusted for IFRS 16 effect and German post-acute care business 723 765 -5
67
Reconciliation Fresenius Vamed
General Credit Presentation November 2019 copy Fresenius SE amp Co KGaA Investor Relations
eurom Q319 Q318 growthrate
Sales reported 562 476 18German post-acute care business acquired from Fresenius Helios -121 -117
Sales adjusted for German post-acute care business 441 359 23
EBIT reported 33 31 6IFRS 16 effect 1 -
EBIT adjusted for IFRS 16 effect 34 31 10German post-acute care business acquired from Fresenius Helios -15 -15EBIT adjusted for IFRS 16 effect and German post-acute care business 19 16 19
68
Reconciliation Fresenius Vamed
General Credit Presentation November 2019 copy Fresenius SE amp Co KGaA Investor Relations
eurom Q1-319 Q1-318 growthrate
Sales reported 1469 991 48German post-acute care business acquired from Fresenius Helios -350 -117
Sales adjusted for German post-acute care business 1119 874 28
EBIT reported 67 49 37IFRS 16 effect -2 -
EBIT adjusted for IFRS 16 effect 65 49 33German post-acute care business acquired from Fresenius Helios -31 -15EBIT adjusted for IFRS 16 effect and German post-acute care business 34 34 0
69
Financial Calendar Contact
Financial Calendar 20 February 2020 Results FY19
06 May 2020 Results Q120
20 May 2020 Annual General Meeting
30 July 2020 Results Q220
29 October 2020 Results Q320
Please note that these dates could be subject to change
Contact
Investor RelationsFresenius SE amp Co KGaAphone +49 6172 608-2485e-mail ir-frefreseniuscomFor further information and current news wwwfreseniuscom
Follow us on Twitter wwwtwittercomfresenius_irand LinkedIn wwwlinkedincomcompanyfresenius-investor-relations
General Credit Presentation November 2019 copy Fresenius SE amp Co KGaA Investor Relations 70
- Presentation to Credit Investors
- Safe Harbor Statement
- Foliennummer 3
- Strong and Balanced Health Care Portfolio
- Fresenius Group Global Sales Base in Growing Non-Cyclical Markets
- Fresenius Group Strong Track Record of Organic Sales Growth in All Business Segments
- Fresenius Group Strong Track Record of EBITDA Generation
- Fresenius SE Earnings-Linked Dividend Policy
- Global Health Care Trends ndash Strong Growth Fundamentals
- Fresenius Medical Care Global Dialysis Market Leader
- Fresenius Medical Care Sales and EBIT development
- Fresenius Kabi A Leading Global Hospital Supplier
- Fresenius Kabi Sales and EBIT development
- Fresenius Helios Europersquos Largest Private Hospital OperatorHelios Germany
- Fresenius Helios Europersquos Largest Private Hospital Operator Helios Spain
- Fresenius Helios Sales and EBIT development
- Fresenius Vamed Leading Global Hospital Projects and Services Specialist
- Fresenius Vamed Sales an EBIT development
- Fresenius Group Key Figures
- Cash Flow Development by Business Segment
- Fresenius Group Consistent Cash Generation
- Fresenius Group Proven Track Record of Deleveraging
- Fresenius Group Capitalization ndash September 30 2019 excl IFRS 16
- Fresenius Group Capitalization ndash September 30 2019 incl IFRS 16
- Fresenius Group Broad Mix of Financing Instruments
- Foliennummer 26
- Fresenius Group excl Fresenius Medical CareDebt Maturity Profile ndash September 30 201912
- Fresenius Group Solid Balance Sheet Structure
- Fresenius Group Strong Access to Capital Markets
- Fresenius SE Rating History amp Rationale
- Fresenius Group 2019 Financial Outlook by Business Segment
- Fresenius Group 2019 Financial Guidance
- Fresenius Group Healthy Growth Targets 2020 ndash 2023 (CAGRs)
- FY18 base for Fresenius Group Guidance FY19
- FY18 base for Fresenius Medical Care Outlook FY19
- FY18 base for Fresenius Kabi Outlook FY19
- IFRS 16 effect on Group PampL
- IFRS 16 effect on Group Balance Sheet and Cash Flow
- Fresenius Group Credit Highlights
- Attachments
- Fresenius Group Key Figures
- Foliennummer 42
- Foliennummer 43
- Fresenius Group Cash Flow
- Fresenius Group Financial Results by Business Segment
- Fresenius Group Margins by Business Segment
- Fresenius SE amp Co KGaA Overview Bonds
- Fresenius Group Reconciliation
- Fresenius Group Reconciliation
- Fresenius Group Reconciliation
- Fresenius Group Reconciliation
- Fresenius Group Reconciliation
- Fresenius Group Reconciliation
- Fresenius Group Reconciliation
- Fresenius Group Reconciliation
- Reconciliation according to Fresenius Medical Care
- Reconciliation according to Fresenius Medical Care
- Reconciliation according to Fresenius Medical Care
- Reconciliation according to Fresenius Medical Care
- Reconciliation Fresenius Medical Care according to Fresenius Group
- Reconciliation Fresenius Medical Care according to Fresenius Group
- Reconciliation Fresenius Medical Care according to Fresenius Group
- Reconciliation Fresenius Medical Care according to Fresenius Group
- Reconciliation Fresenius Kabi
- Reconciliation Fresenius Kabi
- Reconciliation Fresenius Helios
- Reconciliation Fresenius Helios
- Reconciliation Fresenius Vamed
- Reconciliation Fresenius Vamed
- Financial Calendar Contact
-
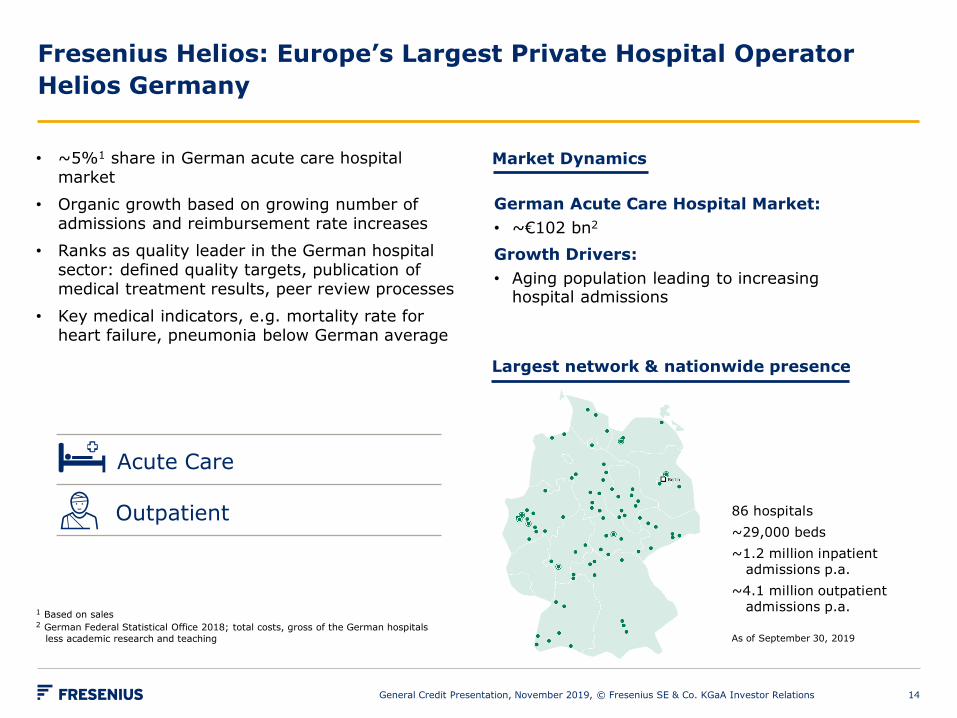

Fresenius Group Key Figures
General Credit Presentation November 2019 copy Fresenius SE amp Co KGaA Investor Relations 19
eurom 20181 20171 Growth (cc)5
Sales 33530 33886 6
EBITDA 5991 6267 0Margin 179 185
EBIT 4561 4830 -1Margin 136 143
Interest net -570 -652 7
EBT 3991 4178 0
Taxes -880 -1168 21
Net Income3 3111 3010 8
Employees4 276750 273249
1 Before special items2 4 organic growth 2 acquisitions 0 divestitures -4 currency effects 3 Net income incl attributable to non-controlling interest4 As of December 315 Adjusted for IFRS and divestitures of Care Coordination activities
Cash Flow Development by Business Segment
General Credit Presentation November 2019 copy Fresenius SE amp Co KGaA Investor Relations 20
1 Before acquisitions and dividends2 Margin incl FMC dividend3 Understated 17 excluding euro30 million of capex commitments from acquisitions
Operating CF Capex (net) Free Cash Flow1
eurom 2018 Margin 2018 Margin 2018 Margin
1040 159 -553 -85 487 74
554 62 -434 -49 120 133
106 63 -29 -17 77 46
CorporateOther -20 na -58 na -78 na
1680 1042 -1074 -63 606 412
2062 125 -1003 -61 1059 64
3742 112 -2077 -62 16654 50
Excl FMC
Group
Margin = in of sales
48 48 4852 53
5855 55 54
65
3
4
5
6
7
8
2009 2010 2011 2012 2013 2014 2015 2016 2017 2018
Fresenius Group Consistent Cash Generation
Capex gross in of sales
FCF margin (before acquisitions amp dividends)CFFO margin
21General Credit Presentation November 2019 copy Fresenius SE amp Co KGaA Investor Relations
110
120
103
126
114
109
120 122
116
112
8
9
10
11
12
13
14
2009 2010 2011 2012 2013 2014 2015 2016 2017 2018
63
74
56
76
62
52
67 67 66
50
3
4
5
6
7
8
9
2009 2010 2011 2012 2013 2014 2015 2016 2017 2018
Fresenius Group Proven Track Record of Deleveraging
22
Net DebtEBITDA1
1 At actual FX rates for both Net Debt and EBITDA before special items pro forma closed acquisitionsdivestitures2 Pro forma excluding advances made for the acquisition of hospitals from Rhoumln-Klinikum AG3 Calculated at actual FX rates for both net debt and EBITDA including acquisition of the NxStage excluding IFRS 16 effect (comparable to updated guidance from May 2 2019)4 Calculated at expected annual average exchange rates for both net debt and EBITDA including acquisition of NxStage without potential unannounced acquisitions adjusted for
IFRS 16 effects (comparable to updated guidance from May 2 2019)
32x
30x
27x
22x 23x
35x
30x
26x
36x
30x
26x
28x
25x 25x
34x
27x
24x
28x
27x
32x3
20
30
40
2001 2002 2003 2004 2005 Q106 2006 2007 2008 2009 2010 2011 2012 2013 2014 2015 2016 2017 2018 Q3192
Target 20194 around the upper-end of self-imposed target corridor of 25 ndash 30x
Hospitals from
General Credit Presentation November 2019 copy Fresenius SE amp Co KGaA Investor Relations
4
Fresenius Group Capitalization ndash September 30 2019 excl IFRS 16
23
1 Based on market capitalization for FSE and FMC as of September 30 20192 Before acquisition-related expenses Pro Forma acquisitions3 EURUSD exchange rate as of September 30 2019 except for market capitalization which uses the exchange rate as of September 30 2019
Instrument per Book Value in euro million in $ million3 oftotal cap EBITDA LTM x
Syndicated Credit Agreement Revolver (euro US-$) 229 249 04 Syndicated Credit Agreement Term Loan A (euro US-$) 2029 2209 36 Bonds (euro US-$) 5516 6006 98 Convertible Bonds 463 504 08 Schuldschein Loans 2191 2386 39 Commercial Paper 1000 1089 18 Other debt 836 910 15 Total Debt (FSE excl FMC) gross 12264 13354 218 Cash (excl FMC) 917 999 16 Total debt (FSE excl FMC) net 11347 12356 201 Total FMC debt net 8246 8979 146 Consolidation Adjustments (78) (85)Total consolidated debt net 19515 21250 346 32x Market capitalization1 36859 40136 654 60x
Total capitalization 56374 61386 1000 92x FSE Group EBITDA2 6100
General Credit Presentation November 2019 copy Fresenius SE amp Co KGaA Investor Relations
4
Fresenius Group Capitalization ndash September 30 2019 incl IFRS 16
24
1 Based on market capitalization for FSE and FMC as of September 30 20192 Before acquisition-related expenses Pro Forma acquisitions3 EURUSD exchange rate as of September 30 2019 except for market capitalization which uses the exchange rate as of September 30 2019
Instrument per Book Value in euro million in $ million3 oftotal cap EBITDA LTM x
Syndicated Credit Agreement Revolver (euro US-$) 229 249 04 Syndicated Credit Agreement Term Loan A (euro US-$) 2029 2209 33 Bonds (euro US-$) 5516 6006 89 Convertible Bonds 463 504 07 Schuldschein Loans 2191 2386 35 Commercial Paper 1000 1089 16 Lease Obligations 1749 1904 28 Other debt 653 711 10 Total Debt (FSE excl FMC) gross 13830 15059 222 Cash (excl FMC) 917 999 15 Total debt (FSE excl FMC) net 12913 14061 207 Total FMC debt net 12704 13833 204 Consolidation Adjustments (203) (221) (03)Total consolidated debt net 25414 27673 408 36x Market capitalization1 36859 40136 592 52x
Total capitalization 62273 67810 1000 88x FSE Group EBITDA2 7064
General Credit Presentation November 2019 copy Fresenius SE amp Co KGaA Investor Relations
Fresenius Group Broad Mix of Financing Instruments
General Credit Presentation November 2019 copy Fresenius SE amp Co KGaA Investor Relations 25
Commercial Paper 9
Other financial Liabilities 13
Syndicated loans 22 Bonds 42
Equity-neutralconvertible bonds 4
Total BS Debt1
~euro21114 m
1 As of September 30 2019 adjusted for IFRS 16 effect
bull Optimize funding costs and ensure financial flexibility
bull Diversify investor base
bull Strong liquidity provided by sufficient financial cushion (~euro29 billion as of September 30 2019)
Well Positioned to Meet Financing NeedsSchuldschein Loans 10
Average interest ratecost of debt22 pa
26
Fresenius GroupDebt Maturity Profile ndash September 30 201912
1 Based on utilization of major financing instruments2 Excluding IFRS 16 adjustments
eurom
General Credit Presentation November 2019 copy Fresenius SE amp Co KGaA Investor Relations
779
1653 1704
2384
367 500 459
637
1163
1944
2260
708
2071
500
238
907
584
5000
1000
2000
3000
4000
5000
2019 2020 2021 2022 2023 2024 2025 2026 2027 2028 2029 2030 2031 2032
Fresenius Medical Care Fresenius excl Fresenius Medical Care
Maturity 32 years on
average
Fresenius Group excl Fresenius Medical CareDebt Maturity Profile ndash September 30 201912
27General Credit Presentation November 2019 copy Fresenius SE amp Co KGaA Investor Relations
1 Based on utilization of major financing instruments2 Excluding IFRS 16 adjustments
eurom
500726 700
276
1150
500700
500 500
39
155
9051167
106
314
393
432
421
238
207
84
500
598
402
0
500
1000
1500
2000
2500
2019 2020 2021 2022 2023 2024 2025 2026 2027 2028 2029 2030 2031 2032
Bonds Syndicated Loan Schuldschein Loans Equity-neutral convertible bonds Commercial Paper
Maturity 37 years on
average
23 23 23 23
34 32 36 33
43 45 41 44
Dec 31 15 Dec 31 16 Dec 31 17 Dec 31 18
Equity and noncontrolling interest Debt Other liabilities
Fresenius Group Solid Balance Sheet Structure
Healthy Equity and Liability Split
bull Strong equity ratio of gt40 on average
bull Equity ratio kept in narrow range despite rapid growth of Fresenius Group
General Credit Presentation November 2019 copy Fresenius SE amp Co KGaA Investor Relations 28
432 467 531 567
BS total (eurobn)
Fresenius Group Strong Access to Capital Markets
29
Major Financing Instruments
2009 2010 2011 2012 2013 2014 2015 2016 2017 2018 2019
Bondseuro425 m$500 m
euro250 m euro800 m$105 bn
euro750 m$15 bn
euro500 m euro12 bn$12 bn
$300 m euro26 bn euro500 m euro10 bn$500 m1
SyndicatedLoans
$35 bn $898 m $385 bn $18 bneuro245 bn
$41 bneuro700 m
$115 bneuro205 bn
euro530 bn$355 bn
euro100sup2
SchuldscheinLoans
euro200 m euro400 m euro125 m euro500 m euro112 m $400 m euro10 bn euro700 msup3
Convertible Bonds
euro900 m euro500 m
Equityeuro10 bn euro400 m
1 June 2019 new $500 million 2019-2029 Bond issued by Fresenius Medical Care amp Co KGaA2 August 2019 euro100 million increased Revolving Facilities of Fresenius SE amp Co KGaA3 September 2019 new euro700 million 2019-202320262029 Schuldschein Loan issued by Fresenius SE amp Co KGaA
General Credit Presentation November 2019 copy Fresenius SE amp Co KGaA Investor Relations
Fresenius SE Rating History amp Rationale
General Credit Presentation November 2019 copy Fresenius SE amp Co KGaA Investor Relations 30
ldquoFSE delivers solid organic growth thanks to positive underlying growth trends in the life-saving and life-sustaining products and therapies that the group offersrdquo SampP Jan 08 2019
ldquoFSErsquos rating remains anchored in investment-grade given its mature and defensive business risk profile the grouprsquos deleveraging ability based on free cash flow generation and its record of integrating acquisitions successfully and reducing financial leverage in line with communicated policiesrdquo Fitch Sep 20 2018
ldquoThe Baa3 long term issuer rating of FSE reflects its strong defensive business profile underpinned by large absolute scale global footprint and segmental diversification within the healthcare market supported by strong position in its four business segmentsrdquo Moodyrsquos May 15 2018
Rating History Rating Agenciesrsquo Key Statements
In May 2019 SampP upgraded Fresenius to BBB with stable outlook
SampP Moodylsquos Fitch
Corporate Credit Rating BBB Baa3 BBB-
Outlook stable stable stable
Current Credit Ratings
Fresenius Group 2019 Financial Outlook by Business Segment
General Credit Presentation November 2019 copy Fresenius SE amp Co KGaA Investor Relations 31
eurom (except otherwise stated) FY18 Base1 FY19e2
Sales growth3 (cc) 16026 3 ndash 7
Net income growth34 (cc) 1341 -2 to 2
Sales growth (organic) 6544 3 ndash 6
EBIT growth (cc) 1139 3 ndash 6
Sales growth (organic) 8993 2 ndash 5
EBIT 1052 -5 to -2
Sales growth (organic) 1688 ~10
EBIT growth 110 15 ndash 20
1 Before special items and after adjustments2 Before special items (transaction-related expenses expenses associated with cost optimization program at FMC revaluations of biosimilars contingent liabilities) adjusted for IFRS 16 effect3 Excluding effects from NxStage transaction4 Net income attribuitable to shareholders of Fresenius Medical Care AG amp Co KGaA
For a detailed overview of adjustments and special items please see the reconciliation tables on slides 48-69 and for the bases
eurom (except otherwise stated) FY18 Base1 FY192
Sales growth (cc) 33009 4 - 7
Net income3 growth (cc) 1872 ~0
Fresenius Group 2019 Financial Guidance
1 Before special items and after adjustments2 Excluding transaction-related expenses expenses associated with the cost optimization program at FMC revaluations of biosimilars contingent liabilities including operating results of
NxStage adjusted for IFRS 16 effects3 Net income attributable to shareholders of Fresenius SEampCo KGaA
For a detailed overview of adjustments and special items please see the reconciliation tables on slides 48-69 and for the bases
32General Credit Presentation November 2019 copy Fresenius SE amp Co KGaA Investor Relations
Fresenius Group Healthy Growth Targets 2020 ndash 2023 (CAGRs)
General Credit Presentation November 2019 copy Fresenius SE amp Co KGaA Investor Relations 33
Organic sales growth 4 ndash 7 (plus ~1 small tomid-size acquisitions)
Organic net income1 growth 5 ndash 9 (plus ~1 small tomid-size acquisitions)
1 Net income attributable to shareholders of Fresenius SEampCo KGaA
Before special items
FY18 base for Fresenius Group Guidance FY19
General Credit Presentation November 2019 copy Fresenius SE amp Co KGaA Investor Relations 34
eurom
Sales reported 33530
Divestitures of Care Coordination activities at FMC (H118) -521
Sales basis for growth rates 33009
Net Income reported 2027
Transaction Costs Akorn Biosimilars 25
Bridge Financing Costs Akorn 12
Revaluations of Biosimilars contingent liabililties 5
Impact of FCPA related charge 9
Gain related to divestitures of Care Coordination activities -207
Net income (before special items) 1871
Divestitures of Care Coordination activities at FMC (H118) 1
Net income basis for growth rates (before special items and after adjustments) 1872
FY18 base for Fresenius Medical Care Outlook FY19
General Credit Presentation November 2019 copy Fresenius SE amp Co KGaA Investor Relations 35
eurom
Sales reported 16547
Divestitures of Care Coordination activities at FMC (H118) -521
Sales basis for growth rates 16026
Net Income reported 1982
Impact of FCPA related charge 28
Gain related to divestitures of Care Coordination activities -673
Net income (before special items) 1337
Divestitures of Care Coordination activities at FMC (H118) 4
Net income basis for growth rates (before special items and after adjustments) 1341
FY18 base for Fresenius Kabi Outlook FY19
General Credit Presentation November 2019 copy Fresenius SE amp Co KGaA Investor Relations 36
eurom
Sales basis for growth rates 6544
Transaction Costs Akorn Biosimilars 34
Revaluations of Biosimilars contingent liabililties 7
EBIT (before special items = base for Kabi guidance) 1139
The special items are reported in the Group CorporateOther segment
IFRS 16 effect on Group PampL
General Credit Presentation November 2019 copy Fresenius SE amp Co KGaA Investor Relations
eurom
Q319 before
special items adjusted for
IFRS 16 effect IFRS 16 effect
Q319 before
special itemsaccording to
IFRS 16
Q1-319 before
special items adjusted for
IFRS 16 effect IFRS 16 effect
Q1-319 before
special itemsaccording to
IFRS 16
Sales 8877 -35 8842 26173 -75 26098
EBITDA 1526 237 1763 4468 699 5167
Depreciation and amortization -396 -214 -610 -1146 -620 -1766
EBIT 1130 23 1153 3322 79 3401
Net interest -124 -47 -171 -379 -153 -532
Income taxes -232 5 -227 -680 18 -662
Noncontrolling interest -321 11 -310 -865 31 -834
Net income1 453 -8 445 1398 -25 1373
37
1 Net income attributable to shareholders of Fresenius SE amp Co KGaA
IFRS 16 effect on Group Balance Sheet and Cash Flow
General Credit Presentation November 2019 copy Fresenius SE amp Co KGaA Investor Relations
eurom
Sep 30 2019adjusted for
IFRS 16 effect IFRS 16 effect
Sep 30 2019according to
IFRS 16
Right-of-use-assets 1901 5667 5857Lease liabilities 4142 5899 6313Equity 26928 -232 26696Total assets 61092 5667 66759
38
1 Reclassification from machinery equipment and rental equipment under capital leases as of December 31 20182 Reclassifications from capital lease obligations and other liabilities as of December 31 2018
eurom
Q319adjusted for
IFRS 16 effect IFRS 16 effect
Q319according to
IFRS 16
Q1-319adjusted for
IFRS 16 effect IFRS 16 effect
Q1-319according to
IFRS 16
Operating cash flow 1298 185 1483 2439 538 2977Cash flow before acquisitions and dividends 722 185 907 850 538 1388
Free cash flow 547 185 732 -2172 538 -1634Cash provided byused for financing activities -461 -185 -646 995 -538 457
Balance Sheet
Cash Flow
Fresenius Group Credit Highlights
General Credit Presentation November 2019 copy Fresenius SE amp Co KGaA Investor Relations 39
Consistent Cash Generation
Proven Track Record of Deleveraging Following Acquisitions
Broad Mix of Financing Instruments
Well-Balanced Maturity Profile
Solid Balance Sheet Structure
Strong Access to Capital Markets
Attachments
General Credit Presentation November 2019 copy Fresenius SE amp Co KGaA Investor Relations 40
Fresenius Group Key Figures
General Credit Presentation November 2019 copy Fresenius SE amp Co KGaA Investor Relations 41
1 2018 and 2017 before special items 2018 2017 and 2016 pro forma acquisitionsdivestitures2 2018 and 2017 before special items 3 2016 pro forma Quiroacutensalud acquisition 3154 2016 pro forma Quiroacutensalud acquisition 309
2018 2017 2016
Debt (eurom) thereof US$ denominated
1898428
1904231
1478052
Net debt (eurom) 16275 17406 13201
Net debtEBITDA13
Net debt at year-end exchange rate EBITDA at LTM average FX rates
273 279 239
Net debtEBITDA14
at LTM average FX rates for both net debt and EBITDA
271 284 233
Operating Cash flowSales 112 116 122
EBITDAInterest2 105 96 95
42
Fresenius Group Debt and Cash Flow Structure ndash Sep 30 2019 adj for IFRS 16
Fresenius Medical Care
Financing
Fresenius SE Financing
Group Net Debt ~euro195 bn1
DividendsRents Service Agreements
~313 100 77100
- euro306 m Net Debt4 euro63 m Net Debt4 euro32 m Net Debt4euro8246 m Net Debt4
Profit transfer Agreements6
bull Separate financing of Fresenius SE and Fresenius Medical Care
bull No joint financing facilities or mutual guarantees
bull Fresenius Kabi Fresenius Helios and Fresenius Vamed financed primarily through Fresenius SE to avoid structural subordination
FSE Net Debt~euro113 bn
incl Net Debt of KabiHeliosVamed
StockMarketValue~euro58 bn5 FSE Net Debt2
~euro115 bn
1 Incl consolidation adjustments2 Incl Fresenius financing subsidiaries3 Controlling stake4 Incl subsidiaries 5 Based on market capitalization for FMC as of September 30 20196 Via German holding entities (Fresenius Kabi AG and Fresenius ProServe GmbH)
General Credit Presentation November 2019 copy Fresenius SE amp Co KGaA Investor Relations
43
Fresenius Group Debt and Cash Flow Structure ndash Sep 30 2019 accord to IFRS 16
1 Incl consolidation adjustments2 Incl Fresenius financing subsidiaries3 Controlling stake4 Incl subsidiaries 5 Based on market capitalization for FMC as of September 30 20196 Via German holding entities (Fresenius Kabi AG and Fresenius ProServe GmbH)
Fresenius Medical Care
Financing
Fresenius SE Financing
Group Net Debt ~euro254 bn1
DividendsRents Service Agreements
~313 100 77100
euro50 m Net Debt4 euro921 m Net Debt4 euro331 m Net Debt4euro12704 m Net Debt4
Profit transfer Agreements6
bull Separate financing of Fresenius SE and Fresenius Medical Care
bull No joint financing facilities or mutual guarantees
bull Fresenius Kabi Fresenius Helios and Fresenius Vamed financed primarily through Fresenius SE to avoid structural subordination
FSE Net Debt~euro127 bn
incl Net Debt of KabiHeliosVamed
StockMarketValue~euro58 bn5 FSE Net Debt2
~euro114 bn
General Credit Presentation November 2019 copy Fresenius SE amp Co KGaA Investor Relations
Fresenius Group Cash Flow
General Credit Presentation November 2019 copy Fresenius SE amp Co KGaA Investor Relations 44
eurom 2018 Margin 2017 Margin Δ YoY
Operating Cash Flow 3742 112 3937 116 -5
Capex (net) -2077 -62 -1705 -50 -22
Free Cash Flow(before acquisitions and dividends)
1665 50 2232 66 -25
Acquisitions (net) -613 -5865 --
Dividends -904 -924 2
Free Cash Flow(after acquisitions and dividends)
-1374 -41 -4557 -134 --
Fresenius Group Financial Results by Business Segment
General Credit Presentation November 2019 copy Fresenius SE amp Co KGaA Investor Relations 45
2018 2017 2016 Growth2
20182017
Sales euro16547 m euro17784 m euro16570 m 41
EBIT euro2306 m euro2562 m euro2409 m 61
Sales euro6544 m euro6358 m euro6007 m 7
EBIT euro1139 m euro1177 m euro1171 m 2
Sales euro8993 m euro8668 m euro5843 m 6
EBIT euro1052 m euro1052 m euro683 m 3
Sales euro1688 m euro1228 m euro1160 m 19
EBIT euro110m euro76 m euro69 m 9
Sales euro33530 m euro33886 m euro29471 m 6
EBIT euro4561 m euro4830 m euro4302 m -1Group
2018 and 2017 before special items
1 FMC on a comparable basis2 Growth rates at constant currency and after adjustments
Fresenius Group Margins by Business Segment
General Credit Presentation November 2019 copy Fresenius SE amp Co KGaA Investor Relations 46
2018 and 2017 before special items
2018 2017 2016
EBITDA margin 183 185 188
EBIT margin 139 144 145
EBITDA margin 219 233 244
EBIT margin 174 185 195
EBITDA margin 159 165 150
EBIT margin 117 121 117
EBITDA margin 79 71 69
EBIT margin 65 62 59
EBITDA margin 179 185 187
EBIT margin 136 143 146Group
Fresenius SE amp Co KGaA Overview Bonds
General Credit Presentation November 2019 copy Fresenius SE amp Co KGaA Investor Relations 47
Issuer Volume(in millions)
Coupon type
Coupon (in )
MaturityTerm
ISIN (RegS)
WKN
Fresenius SE amp Co KGaAeuro500 Fix 2875 20132020 XS0873432511 A1HEWZ
Fresenius SE amp Co KGaAeuro450 Fix 300 20142021 XS1013955379 A1ZB7H
Fresenius SE amp Co KGaAeuro450 Fix 400 20142024 XS1026109204 A1ZC60
Fresenius SE amp Co KGaAeuro 500 Fix 1875 20192025 XS1936208252 A2NBMS
Fresenius SE amp Co KGaAeuro 500 Fix 2875 20192029 XS1936208419 A2NBMT
Fresenius Finance Ireland plceuro700 Fix 0875 20172022 XS1554373164 A19B3F
Fresenius Finance Ireland plceuro700 Fix 150 20172024 XS1554373248 A19B3G
Fresenius Finance Ireland plceuro700 Fix 2125 20172027 XS1554373677 A19B3H
Fresenius Finance Ireland plceuro500 Fix 300 20172032 XS1554373834 A19B3J
Fresenius US Finance II IncUS$300 Fix 425 20142021 USU31436AG04 A1ZDVJ
Fresenius US Finance II IncUS$300 Fix 450 20152023 USU31436AH86 A1Z64A
Fresenius Group Reconciliation
General Credit Presentation November 2019 copy Fresenius SE amp Co KGaA Investor Relations
eurom Q319 Q318 growthrate
growthrate (cc)
Sales reported 8842 8192 8 6Divestitures of Care Coordination activities at FMC - -7
IFRS 16 effect 35 -
Sales on a comparable basis 8877 8185 8 6
EBIT reported (after special items) 1129 1041 8 6Transaction costs Akorn 0 6
Bridge Financing costs Akorn - 0
Revaluations of biosimilars contingent liabilities 0 -
Gain related to divestitures of Care Coordination activities -3 -10
Transaction costs NxStage 2 -
Expenses associated with the cost optimization program at FMC 25 -
Impact of FCPA related charge - 75
EBIT (before special items) 1153 1112 4 1Divestitures of Care Coordination activities at FMC - 0
IFRS 16 effect -23 -
EBIT on a comparable basis 1130 1112 2 -1
48
Fresenius Group Reconciliation
General Credit Presentation November 2019 copy Fresenius SE amp Co KGaA Investor Relations
eurom Q319 Q318 growthrate
growthrate (cc)
Net interest reported (after special items) -172 -146 -18 -15Bridge Financing costs Akorn - 5
Revaluations of biosimilars contingent liabilities 1 -
Net interest (before special items) -171 -141 -21 -18Divestitures of Care Coordination activities at FMC - 0
IFRS 16 effect 47 -
Net interest on a comparable basis -124 -141 12 15
49
Fresenius Group Reconciliation
General Credit Presentation November 2019 copy Fresenius SE amp Co KGaA Investor Relations
eurom Q319 Q318 growthrate
growthrate (cc)
Income taxes reported (after special items) -202 -196 -3 -1Transaction costs Akorn 0 -1Bridge Financing costs Akorn - -2Revaluations of biosimilars contingent liabilities 0 -Gain related to divestitures of Care Coordination activities -17 -7Transaction costs NxStage -1 -Expenses associated with the cost optimization program at FMC -7 -Income taxes (before special items) -227 -206 -10 -7Divestitures of Care Coordination activities at FMC - -1IFRS 16 effect -5 -Income taxes on a comparable basis -232 -207 -12 -10
Noncontrolling interest reported (after special items) -311 -280 -11 -7Gain related to divestitures of Care Coordination activities 14 12Transaction costs NxStage 0 -Expenses associated with the cost optimization program at FMC -13 -Impact of FCPA related charge - -52Noncontrolling interest (before special items) -310 -320 3 7Divestitures of Care Coordination activities at FMC - 0IFRS 16 effect -11 -Noncontrolling interest on a comparable basis -321 -320 0 3
50
Fresenius Group Reconciliation
General Credit Presentation November 2019 copy Fresenius SE amp Co KGaA Investor Relations
eurom Q319 Q318 growthrate
growthrate (cc)
Net income reported (after special items) 444 419 6 4Transaction costs Akorn 0 5
Bridge Financing costs Akorn - 3
Revaluations of biosimilars contingent liabilities 1 -
Gain related to divestitures of Care Coordination activities -6 -5
Transaction costs NxStage 1 -
Expenses associated with the cost optimization program at FMC 5 -
Impact of FCPA related charge - 23
Net income (before special items) 445 445 0 -2Divestitures of Care Coordination activities at FMC - -1
IFRS 16 effect 8 -
Net income on a comparable basis 453 444 2 0
51
Fresenius Group Reconciliation
General Credit Presentation November 2019 copy Fresenius SE amp Co KGaA Investor Relations
eurom Q1-319 Q1-318 growthrate
growthrate (cc)
Sales reported 26098 24695 6 3Divestitures of Care Coordination activities at FMC - -516
IFRS 16 effect 75 -
Sales on a comparable basis 26173 24179 8 6
EBIT reported (after special items) 3362 4020 -16 -19Transaction costs Akorn 3 45
Bridge Financing costs Akorn - 1
Revaluations of biosimilars contingent liabilities -4 -
Gain related to divestitures of Care Coordination activities -14 -830
Transaction costs NxStage 22 -
Expenses associated with the cost optimization program at FMC 32 -
Impact of FCPA related charge - 75
EBIT (before special items) 3401 3311 3 0Divestitures of Care Coordination activities at FMC - -14
IFRS 16 effect -79 -
EBIT on a comparable basis 3322 3297 1 -2
52
Fresenius Group Reconciliation
General Credit Presentation November 2019 copy Fresenius SE amp Co KGaA Investor Relations
eurom Q1-319 Q1-318 growthrate
growthrate (cc)
Net interest reported (after special items) -535 -453 -18 -15Bridge Financing costs Akorn - 12
Revaluations of biosimilars contingent liabilities 3 -
Net interest (before special items) -532 -441 -21 -17Divestitures of Care Coordination activities at FMC - 21
IFRS 16 effect 153 -
Net interest on a comparable basis -379 -420 10 12
53
Fresenius Group Reconciliation
General Credit Presentation November 2019 copy Fresenius SE amp Co KGaA Investor Relations
eurom Q1-319 Q1-318 growthrate
growthrate (cc)
Income taxes reported (after special items) -632 -754 16 19Transaction costs Akorn 0 -9Bridge Financing costs Akorn - -4Revaluations of biosimilars contingent liabilities 0 -Gain related to divestitures of Care Coordination activities -15 140Transaction costs NxStage -6 -Expenses associated with the cost optimization program at FMC -9 -Income taxes (before special items) -662 -627 -6 -2Divestitures of Care Coordination activities at FMC - -2IFRS 16 effect -18 -Income taxes on a comparable basis -680 -629 -8 -5
Noncontrolling interest reported (after special items) -827 -1302 36 39Gain related to divestitures of Care Coordination activities 20 478Transaction costs NxStage -11 -Expenses associated with the cost optimization program at FMC -16 -Impact of FCPA related charge - -52Noncontrolling interest (before special items) -834 -876 5 9Divestitures of Care Coordination activities at FMC - -4IFRS 16 effect -31 -Noncontrolling interest on a comparable basis -865 -880 2 6
54
Fresenius Group Reconciliation
General Credit Presentation November 2019 copy Fresenius SE amp Co KGaA Investor Relations
eurom Q1-319 Q1-318 growthrate
growthrate (cc)
Net income reported (after special items) 1368 1511 -9 -12Transaction costs Akorn 3 36
Bridge Financing costs Akorn - 9
Revaluations of biosimilars contingent liabilities -1 -
Gain related to divestitures of Care Coordination activities -9 -212
Transaction costs NxStage 5 -
Expenses associated with the cost optimization program at FMC 7 -
Impact of FCPA related charge - 23
Net income (before special items) 1373 1367 0 -2Divestitures of Care Coordination activities at FMC - 1
IFRS 16 effect 25 -
Net income on a comparable basis 1398 1368 2 0
55
Reconciliation according to Fresenius Medical Care
General Credit Presentation November 2019 copy Fresenius SE amp Co KGaA Investor Relations
eurom Q319 Q318 growthrate
growthrate (cc)
Sales reported 4419 4058 9 6Divestitures of Care Coordination activities - -7
IFRS 16 effect 35 -
NxStage operations -79 -
Sales adjusted 4375 4051 8 5
EBIT reported 595 527 13 9
Gain related to divestitures of Care Coordination activities -2 -10
Divestitures of Care Coordination activities - 0
IFRS 16 effect -21 -
NxStage operations 0 -
Transaction costs NxStage 2 -
Expenses associated with the cost optimization program 25 -
Impact of FCPA related charge - 75EBIT adjusted 599 592 1 -3
56
Reconciliation according to Fresenius Medical Care
General Credit Presentation November 2019 copy Fresenius SE amp Co KGaA Investor Relations
eurom Q319 Q318 growthrate
growthrate (cc)
Net income reported 333 285 17 12
Gain related to divestitures of Care Coordination activities -20 -17
Divestitures of Care Coordination activities - 0
IFRS 16 effect 16 -
NxStage operations 15 -
Transaction costs NxStage 1 -
Expenses associated with the cost optimization program 18 -
Impact of FCPA related charge - 75Net income adjusted 363 343 6 2
57
Reconciliation according to Fresenius Medical Care
General Credit Presentation November 2019 copy Fresenius SE amp Co KGaA Investor Relations
eurom Q1-319 Q1-318 growthrate
growthrate (cc)
Sales reported 12897 12247 5 1Divestitures of Care Coordination activities - -516
IFRS 16 effect 75 -
NxStage operations -188 -
Sales adjusted 12784 11731 9 5
EBIT reported 1653 2425 -32 -35Gain related to divestitures of Care Coordination activities -14 -830
Divestitures of Care Coordination activities - -14
IFRS 16 effect -68 -
NxStage operations 16 -
Transaction costs NxStage 22 -
Expenses associated with the cost optimization program 32 -
Impact of FCPA related charge - 75
EBIT adjusted 1641 1656 -1 -5
58
Reconciliation according to Fresenius Medical Care
General Credit Presentation November 2019 copy Fresenius SE amp Co KGaA Investor Relations
eurom Q1-319 Q1-318 growthrate
growthrate (cc)
Net income reported 857 1557 -45 -47Gain related to divestitures of Care Coordination activities -29 -690
Divestitures of Care Coordination activities - 4
IFRS 16 effect 45 -
NxStage operations 49 -
Transaction costs NxStage 16 -
Expenses associated with the cost optimization program 23 -
Impact of FCPA related charge - 75
Net income adjusted 961 946 2 -3
59
Reconciliation Fresenius Medical Care according to Fresenius Group
General Credit Presentation November 2019 copy Fresenius SE amp Co KGaA Investor Relations
eurom Q319 Q318 growthrate
growthrate (cc)
Sales reported 4419 4058 9 6Divestitures of Care Coordination activities - -7
IFRS 16 effect 35 -
Sales on a comparable basis 4454 4051 10 7
EBIT reported (after special items) 595 527 13 9Gain related to divestitures of Care Coordination activities -3 -10
Transaction costs NxStage 2 -
Expenses associated with the cost optimization program 25 -
Impact of FCPA related charge - 75
EBIT (before special items) 619 592 5 1Divestitures of Care Coordination activities - 0
IFRS 16 effect -20 -
EBIT on a comparable basis 599 592 1 -3
60
Reconciliation Fresenius Medical Care according to Fresenius Group
General Credit Presentation November 2019 copy Fresenius SE amp Co KGaA Investor Relations
eurom Q319 Q318 growthrate
growthrate (cc)
Net income reported (after special items) 332 284 17 12Gain related to divestitures of Care Coordination activities -20 -16
Transaction costs NxStage 1 -
Expenses associated with the cost optimization program 18 -
Impact of FCPA related charge - 75
Net income (before special items) 331 343 -3 -7Divestitures of Care Coordination activities - -1
IFRS 16 effect 17 -
Net income on a comparable basis 348 342 2 -2
61
Reconciliation Fresenius Medical Care according to Fresenius Group
General Credit Presentation November 2019 copy Fresenius SE amp Co KGaA Investor Relations
eurom Q1-319 Q1-318 growthrate
growthrate (cc)
Sales reported 12897 12247 5 1Divestitures of Care Coordination activities - -516
IFRS 16 effect 75 -
Sales on a comparable basis 12972 11731 11 7
EBIT reported (after special items) 1653 2425 -32 -35Gain related to divestitures of Care Coordination activities -14 -830
Transaction costs NxStage 22 -
Expenses associated with the cost optimization program 32 -
Impact of FCPA related charge - 75
EBIT (before special items) 1693 1670 1 -3Divestitures of Care Coordination activities - -14
IFRS 16 effect -68 -
EBIT on a comparable basis 1625 1656 -2 -6
62
Reconciliation Fresenius Medical Care according to Fresenius Group
General Credit Presentation November 2019 copy Fresenius SE amp Co KGaA Investor Relations
eurom Q1-319 Q1-318 growthrate
growthrate (cc)
Net income reported (after special items) 857 1557 -45 -47Gain related to divestitures of Care Coordination activities -29 -690
Transaction costs NxStage 16 -
Expenses associated with the cost optimization program 23 -
Impact of FCPA related charge - 75
Net income (before special items) 867 942 -8 -12Divestitures of Care Coordination activities - 4
IFRS 16 effect 45 -
Net income on a comparable basis 912 946 -4 -8
63
Reconciliation Fresenius Kabi
General Credit Presentation November 2019 copy Fresenius SE amp Co KGaA Investor Relations
eurom Q319 Q318 growthrate
growthrate (cc)
Sales reported 1761 1650 7 5
Transaction costs Akorn 0 6
Revaluations of biosimilars contingent liabilities 0 -
EBIT (before special items) 307 297 3 1IFRS 16 effect -1 -
EBIT on a comparable basis 306 297 3 1
Transaction costs Akorn 0 5
Revaluations of biosimilars contingent liabilities 1 -
Net income (before special items) 203 199 2 -1IFRS 16 effect 1 -
Net income on a comparable basis 204 199 3 0
64
Reconciliation Fresenius Kabi
General Credit Presentation November 2019 copy Fresenius SE amp Co KGaA Investor Relations
eurom Q1-319 Q1-318 growthrate
growthrate (cc)
Sales reported 5153 4857 6 5
Transaction costs Akorn 3 45
Revaluations of biosimilars contingent liabilities -4 -
EBIT (before special items) 920 854 8 4IFRS 16 effect -3 -
EBIT on a comparable basis 917 854 7 4
Transaction costs Akorn 3 36
Revaluations of biosimilars contingent liabilities -1 -
Net income (before special items) 614 554 11 7IFRS 16 effect 4 -
Net income on a comparable basis 618 554 12 8
65
Reconciliation Fresenius Helios
General Credit Presentation November 2019 copy Fresenius SE amp Co KGaA Investor Relations
eurom Q319 Q318 growthrate
Sales reported 2230 2088 7German post-acute care business transferred from Fresenius Helios to Fresenius Vamed - 0
Sales adjusted for German post-acute care business 2230 2088 7
EBIT reported 187 204 -8IFRS 16 effect -4 -
EBIT adjusted for IFRS 16 effect 183 204 -10German post-acute care business transferred from Fresenius Helios to Fresenius Vamed - 0EBIT adjusted for IFRS 16 effect and German post-acute care business 183 204 -10
66
Reconciliation Fresenius Helios
General Credit Presentation November 2019 copy Fresenius SE amp Co KGaA Investor Relations
eurom Q1-319 Q1-318 growthrate
Sales reported 6890 6762 2German post-acute care business transferred from Fresenius Helios to Fresenius Vamed - -226
Sales adjusted for German post-acute care business 6890 6536 5
EBIT reported 731 775 -6IFRS 16 effect -8 -
EBIT adjusted for IFRS 16 effect 723 775 -7German post-acute care business transferred from Fresenius Helios to Fresenius Vamed - -10EBIT adjusted for IFRS 16 effect and German post-acute care business 723 765 -5
67
Reconciliation Fresenius Vamed
General Credit Presentation November 2019 copy Fresenius SE amp Co KGaA Investor Relations
eurom Q319 Q318 growthrate
Sales reported 562 476 18German post-acute care business acquired from Fresenius Helios -121 -117
Sales adjusted for German post-acute care business 441 359 23
EBIT reported 33 31 6IFRS 16 effect 1 -
EBIT adjusted for IFRS 16 effect 34 31 10German post-acute care business acquired from Fresenius Helios -15 -15EBIT adjusted for IFRS 16 effect and German post-acute care business 19 16 19
68
Reconciliation Fresenius Vamed
General Credit Presentation November 2019 copy Fresenius SE amp Co KGaA Investor Relations
eurom Q1-319 Q1-318 growthrate
Sales reported 1469 991 48German post-acute care business acquired from Fresenius Helios -350 -117
Sales adjusted for German post-acute care business 1119 874 28
EBIT reported 67 49 37IFRS 16 effect -2 -
EBIT adjusted for IFRS 16 effect 65 49 33German post-acute care business acquired from Fresenius Helios -31 -15EBIT adjusted for IFRS 16 effect and German post-acute care business 34 34 0
69
Financial Calendar Contact
Financial Calendar 20 February 2020 Results FY19
06 May 2020 Results Q120
20 May 2020 Annual General Meeting
30 July 2020 Results Q220
29 October 2020 Results Q320
Please note that these dates could be subject to change
Contact
Investor RelationsFresenius SE amp Co KGaAphone +49 6172 608-2485e-mail ir-frefreseniuscomFor further information and current news wwwfreseniuscom
Follow us on Twitter wwwtwittercomfresenius_irand LinkedIn wwwlinkedincomcompanyfresenius-investor-relations
General Credit Presentation November 2019 copy Fresenius SE amp Co KGaA Investor Relations 70
- Presentation to Credit Investors
- Safe Harbor Statement
- Foliennummer 3
- Strong and Balanced Health Care Portfolio
- Fresenius Group Global Sales Base in Growing Non-Cyclical Markets
- Fresenius Group Strong Track Record of Organic Sales Growth in All Business Segments
- Fresenius Group Strong Track Record of EBITDA Generation
- Fresenius SE Earnings-Linked Dividend Policy
- Global Health Care Trends ndash Strong Growth Fundamentals
- Fresenius Medical Care Global Dialysis Market Leader
- Fresenius Medical Care Sales and EBIT development
- Fresenius Kabi A Leading Global Hospital Supplier
- Fresenius Kabi Sales and EBIT development
- Fresenius Helios Europersquos Largest Private Hospital OperatorHelios Germany
- Fresenius Helios Europersquos Largest Private Hospital Operator Helios Spain
- Fresenius Helios Sales and EBIT development
- Fresenius Vamed Leading Global Hospital Projects and Services Specialist
- Fresenius Vamed Sales an EBIT development
- Fresenius Group Key Figures
- Cash Flow Development by Business Segment
- Fresenius Group Consistent Cash Generation
- Fresenius Group Proven Track Record of Deleveraging
- Fresenius Group Capitalization ndash September 30 2019 excl IFRS 16
- Fresenius Group Capitalization ndash September 30 2019 incl IFRS 16
- Fresenius Group Broad Mix of Financing Instruments
- Foliennummer 26
- Fresenius Group excl Fresenius Medical CareDebt Maturity Profile ndash September 30 201912
- Fresenius Group Solid Balance Sheet Structure
- Fresenius Group Strong Access to Capital Markets
- Fresenius SE Rating History amp Rationale
- Fresenius Group 2019 Financial Outlook by Business Segment
- Fresenius Group 2019 Financial Guidance
- Fresenius Group Healthy Growth Targets 2020 ndash 2023 (CAGRs)
- FY18 base for Fresenius Group Guidance FY19
- FY18 base for Fresenius Medical Care Outlook FY19
- FY18 base for Fresenius Kabi Outlook FY19
- IFRS 16 effect on Group PampL
- IFRS 16 effect on Group Balance Sheet and Cash Flow
- Fresenius Group Credit Highlights
- Attachments
- Fresenius Group Key Figures
- Foliennummer 42
- Foliennummer 43
- Fresenius Group Cash Flow
- Fresenius Group Financial Results by Business Segment
- Fresenius Group Margins by Business Segment
- Fresenius SE amp Co KGaA Overview Bonds
- Fresenius Group Reconciliation
- Fresenius Group Reconciliation
- Fresenius Group Reconciliation
- Fresenius Group Reconciliation
- Fresenius Group Reconciliation
- Fresenius Group Reconciliation
- Fresenius Group Reconciliation
- Fresenius Group Reconciliation
- Reconciliation according to Fresenius Medical Care
- Reconciliation according to Fresenius Medical Care
- Reconciliation according to Fresenius Medical Care
- Reconciliation according to Fresenius Medical Care
- Reconciliation Fresenius Medical Care according to Fresenius Group
- Reconciliation Fresenius Medical Care according to Fresenius Group
- Reconciliation Fresenius Medical Care according to Fresenius Group
- Reconciliation Fresenius Medical Care according to Fresenius Group
- Reconciliation Fresenius Kabi
- Reconciliation Fresenius Kabi
- Reconciliation Fresenius Helios
- Reconciliation Fresenius Helios
- Reconciliation Fresenius Vamed
- Reconciliation Fresenius Vamed
- Financial Calendar Contact
-

4
Fresenius Group Capitalization ndash September 30 2019 incl IFRS 16
24
1 Based on market capitalization for FSE and FMC as of September 30 20192 Before acquisition-related expenses Pro Forma acquisitions3 EURUSD exchange rate as of September 30 2019 except for market capitalization which uses the exchange rate as of September 30 2019
Instrument per Book Value in euro million in $ million3 oftotal cap EBITDA LTM x
Syndicated Credit Agreement Revolver (euro US-$) 229 249 04 Syndicated Credit Agreement Term Loan A (euro US-$) 2029 2209 33 Bonds (euro US-$) 5516 6006 89 Convertible Bonds 463 504 07 Schuldschein Loans 2191 2386 35 Commercial Paper 1000 1089 16 Lease Obligations 1749 1904 28 Other debt 653 711 10 Total Debt (FSE excl FMC) gross 13830 15059 222 Cash (excl FMC) 917 999 15 Total debt (FSE excl FMC) net 12913 14061 207 Total FMC debt net 12704 13833 204 Consolidation Adjustments (203) (221) (03)Total consolidated debt net 25414 27673 408 36x Market capitalization1 36859 40136 592 52x
Total capitalization 62273 67810 1000 88x FSE Group EBITDA2 7064
General Credit Presentation November 2019 copy Fresenius SE amp Co KGaA Investor Relations
Fresenius Group Broad Mix of Financing Instruments
General Credit Presentation November 2019 copy Fresenius SE amp Co KGaA Investor Relations 25
Commercial Paper 9
Other financial Liabilities 13
Syndicated loans 22 Bonds 42
Equity-neutralconvertible bonds 4
Total BS Debt1
~euro21114 m
1 As of September 30 2019 adjusted for IFRS 16 effect
bull Optimize funding costs and ensure financial flexibility
bull Diversify investor base
bull Strong liquidity provided by sufficient financial cushion (~euro29 billion as of September 30 2019)
Well Positioned to Meet Financing NeedsSchuldschein Loans 10
Average interest ratecost of debt22 pa
26
Fresenius GroupDebt Maturity Profile ndash September 30 201912
1 Based on utilization of major financing instruments2 Excluding IFRS 16 adjustments
eurom
General Credit Presentation November 2019 copy Fresenius SE amp Co KGaA Investor Relations
779
1653 1704
2384
367 500 459
637
1163
1944
2260
708
2071
500
238
907
584
5000
1000
2000
3000
4000
5000
2019 2020 2021 2022 2023 2024 2025 2026 2027 2028 2029 2030 2031 2032
Fresenius Medical Care Fresenius excl Fresenius Medical Care
Maturity 32 years on
average
Fresenius Group excl Fresenius Medical CareDebt Maturity Profile ndash September 30 201912
27General Credit Presentation November 2019 copy Fresenius SE amp Co KGaA Investor Relations
1 Based on utilization of major financing instruments2 Excluding IFRS 16 adjustments
eurom
500726 700
276
1150
500700
500 500
39
155
9051167
106
314
393
432
421
238
207
84
500
598
402
0
500
1000
1500
2000
2500
2019 2020 2021 2022 2023 2024 2025 2026 2027 2028 2029 2030 2031 2032
Bonds Syndicated Loan Schuldschein Loans Equity-neutral convertible bonds Commercial Paper
Maturity 37 years on
average
23 23 23 23
34 32 36 33
43 45 41 44
Dec 31 15 Dec 31 16 Dec 31 17 Dec 31 18
Equity and noncontrolling interest Debt Other liabilities
Fresenius Group Solid Balance Sheet Structure
Healthy Equity and Liability Split
bull Strong equity ratio of gt40 on average
bull Equity ratio kept in narrow range despite rapid growth of Fresenius Group
General Credit Presentation November 2019 copy Fresenius SE amp Co KGaA Investor Relations 28
432 467 531 567
BS total (eurobn)
Fresenius Group Strong Access to Capital Markets
29
Major Financing Instruments
2009 2010 2011 2012 2013 2014 2015 2016 2017 2018 2019
Bondseuro425 m$500 m
euro250 m euro800 m$105 bn
euro750 m$15 bn
euro500 m euro12 bn$12 bn
$300 m euro26 bn euro500 m euro10 bn$500 m1
SyndicatedLoans
$35 bn $898 m $385 bn $18 bneuro245 bn
$41 bneuro700 m
$115 bneuro205 bn
euro530 bn$355 bn
euro100sup2
SchuldscheinLoans
euro200 m euro400 m euro125 m euro500 m euro112 m $400 m euro10 bn euro700 msup3
Convertible Bonds
euro900 m euro500 m
Equityeuro10 bn euro400 m
1 June 2019 new $500 million 2019-2029 Bond issued by Fresenius Medical Care amp Co KGaA2 August 2019 euro100 million increased Revolving Facilities of Fresenius SE amp Co KGaA3 September 2019 new euro700 million 2019-202320262029 Schuldschein Loan issued by Fresenius SE amp Co KGaA
General Credit Presentation November 2019 copy Fresenius SE amp Co KGaA Investor Relations
Fresenius SE Rating History amp Rationale
General Credit Presentation November 2019 copy Fresenius SE amp Co KGaA Investor Relations 30
ldquoFSE delivers solid organic growth thanks to positive underlying growth trends in the life-saving and life-sustaining products and therapies that the group offersrdquo SampP Jan 08 2019
ldquoFSErsquos rating remains anchored in investment-grade given its mature and defensive business risk profile the grouprsquos deleveraging ability based on free cash flow generation and its record of integrating acquisitions successfully and reducing financial leverage in line with communicated policiesrdquo Fitch Sep 20 2018
ldquoThe Baa3 long term issuer rating of FSE reflects its strong defensive business profile underpinned by large absolute scale global footprint and segmental diversification within the healthcare market supported by strong position in its four business segmentsrdquo Moodyrsquos May 15 2018
Rating History Rating Agenciesrsquo Key Statements
In May 2019 SampP upgraded Fresenius to BBB with stable outlook
SampP Moodylsquos Fitch
Corporate Credit Rating BBB Baa3 BBB-
Outlook stable stable stable
Current Credit Ratings
Fresenius Group 2019 Financial Outlook by Business Segment
General Credit Presentation November 2019 copy Fresenius SE amp Co KGaA Investor Relations 31
eurom (except otherwise stated) FY18 Base1 FY19e2
Sales growth3 (cc) 16026 3 ndash 7
Net income growth34 (cc) 1341 -2 to 2
Sales growth (organic) 6544 3 ndash 6
EBIT growth (cc) 1139 3 ndash 6
Sales growth (organic) 8993 2 ndash 5
EBIT 1052 -5 to -2
Sales growth (organic) 1688 ~10
EBIT growth 110 15 ndash 20
1 Before special items and after adjustments2 Before special items (transaction-related expenses expenses associated with cost optimization program at FMC revaluations of biosimilars contingent liabilities) adjusted for IFRS 16 effect3 Excluding effects from NxStage transaction4 Net income attribuitable to shareholders of Fresenius Medical Care AG amp Co KGaA
For a detailed overview of adjustments and special items please see the reconciliation tables on slides 48-69 and for the bases
eurom (except otherwise stated) FY18 Base1 FY192
Sales growth (cc) 33009 4 - 7
Net income3 growth (cc) 1872 ~0
Fresenius Group 2019 Financial Guidance
1 Before special items and after adjustments2 Excluding transaction-related expenses expenses associated with the cost optimization program at FMC revaluations of biosimilars contingent liabilities including operating results of
NxStage adjusted for IFRS 16 effects3 Net income attributable to shareholders of Fresenius SEampCo KGaA
For a detailed overview of adjustments and special items please see the reconciliation tables on slides 48-69 and for the bases
32General Credit Presentation November 2019 copy Fresenius SE amp Co KGaA Investor Relations
Fresenius Group Healthy Growth Targets 2020 ndash 2023 (CAGRs)
General Credit Presentation November 2019 copy Fresenius SE amp Co KGaA Investor Relations 33
Organic sales growth 4 ndash 7 (plus ~1 small tomid-size acquisitions)
Organic net income1 growth 5 ndash 9 (plus ~1 small tomid-size acquisitions)
1 Net income attributable to shareholders of Fresenius SEampCo KGaA
Before special items
FY18 base for Fresenius Group Guidance FY19
General Credit Presentation November 2019 copy Fresenius SE amp Co KGaA Investor Relations 34
eurom
Sales reported 33530
Divestitures of Care Coordination activities at FMC (H118) -521
Sales basis for growth rates 33009
Net Income reported 2027
Transaction Costs Akorn Biosimilars 25
Bridge Financing Costs Akorn 12
Revaluations of Biosimilars contingent liabililties 5
Impact of FCPA related charge 9
Gain related to divestitures of Care Coordination activities -207
Net income (before special items) 1871
Divestitures of Care Coordination activities at FMC (H118) 1
Net income basis for growth rates (before special items and after adjustments) 1872
FY18 base for Fresenius Medical Care Outlook FY19
General Credit Presentation November 2019 copy Fresenius SE amp Co KGaA Investor Relations 35
eurom
Sales reported 16547
Divestitures of Care Coordination activities at FMC (H118) -521
Sales basis for growth rates 16026
Net Income reported 1982
Impact of FCPA related charge 28
Gain related to divestitures of Care Coordination activities -673
Net income (before special items) 1337
Divestitures of Care Coordination activities at FMC (H118) 4
Net income basis for growth rates (before special items and after adjustments) 1341
FY18 base for Fresenius Kabi Outlook FY19
General Credit Presentation November 2019 copy Fresenius SE amp Co KGaA Investor Relations 36
eurom
Sales basis for growth rates 6544
Transaction Costs Akorn Biosimilars 34
Revaluations of Biosimilars contingent liabililties 7
EBIT (before special items = base for Kabi guidance) 1139
The special items are reported in the Group CorporateOther segment
IFRS 16 effect on Group PampL
General Credit Presentation November 2019 copy Fresenius SE amp Co KGaA Investor Relations
eurom
Q319 before
special items adjusted for
IFRS 16 effect IFRS 16 effect
Q319 before
special itemsaccording to
IFRS 16
Q1-319 before
special items adjusted for
IFRS 16 effect IFRS 16 effect
Q1-319 before
special itemsaccording to
IFRS 16
Sales 8877 -35 8842 26173 -75 26098
EBITDA 1526 237 1763 4468 699 5167
Depreciation and amortization -396 -214 -610 -1146 -620 -1766
EBIT 1130 23 1153 3322 79 3401
Net interest -124 -47 -171 -379 -153 -532
Income taxes -232 5 -227 -680 18 -662
Noncontrolling interest -321 11 -310 -865 31 -834
Net income1 453 -8 445 1398 -25 1373
37
1 Net income attributable to shareholders of Fresenius SE amp Co KGaA
IFRS 16 effect on Group Balance Sheet and Cash Flow
General Credit Presentation November 2019 copy Fresenius SE amp Co KGaA Investor Relations
eurom
Sep 30 2019adjusted for
IFRS 16 effect IFRS 16 effect
Sep 30 2019according to
IFRS 16
Right-of-use-assets 1901 5667 5857Lease liabilities 4142 5899 6313Equity 26928 -232 26696Total assets 61092 5667 66759
38
1 Reclassification from machinery equipment and rental equipment under capital leases as of December 31 20182 Reclassifications from capital lease obligations and other liabilities as of December 31 2018
eurom
Q319adjusted for
IFRS 16 effect IFRS 16 effect
Q319according to
IFRS 16
Q1-319adjusted for
IFRS 16 effect IFRS 16 effect
Q1-319according to
IFRS 16
Operating cash flow 1298 185 1483 2439 538 2977Cash flow before acquisitions and dividends 722 185 907 850 538 1388
Free cash flow 547 185 732 -2172 538 -1634Cash provided byused for financing activities -461 -185 -646 995 -538 457
Balance Sheet
Cash Flow
Fresenius Group Credit Highlights
General Credit Presentation November 2019 copy Fresenius SE amp Co KGaA Investor Relations 39
Consistent Cash Generation
Proven Track Record of Deleveraging Following Acquisitions
Broad Mix of Financing Instruments
Well-Balanced Maturity Profile
Solid Balance Sheet Structure
Strong Access to Capital Markets
Attachments
General Credit Presentation November 2019 copy Fresenius SE amp Co KGaA Investor Relations 40
Fresenius Group Key Figures
General Credit Presentation November 2019 copy Fresenius SE amp Co KGaA Investor Relations 41
1 2018 and 2017 before special items 2018 2017 and 2016 pro forma acquisitionsdivestitures2 2018 and 2017 before special items 3 2016 pro forma Quiroacutensalud acquisition 3154 2016 pro forma Quiroacutensalud acquisition 309
2018 2017 2016
Debt (eurom) thereof US$ denominated
1898428
1904231
1478052
Net debt (eurom) 16275 17406 13201
Net debtEBITDA13
Net debt at year-end exchange rate EBITDA at LTM average FX rates
273 279 239
Net debtEBITDA14
at LTM average FX rates for both net debt and EBITDA
271 284 233
Operating Cash flowSales 112 116 122
EBITDAInterest2 105 96 95
42
Fresenius Group Debt and Cash Flow Structure ndash Sep 30 2019 adj for IFRS 16
Fresenius Medical Care
Financing
Fresenius SE Financing
Group Net Debt ~euro195 bn1
DividendsRents Service Agreements
~313 100 77100
- euro306 m Net Debt4 euro63 m Net Debt4 euro32 m Net Debt4euro8246 m Net Debt4
Profit transfer Agreements6
bull Separate financing of Fresenius SE and Fresenius Medical Care
bull No joint financing facilities or mutual guarantees
bull Fresenius Kabi Fresenius Helios and Fresenius Vamed financed primarily through Fresenius SE to avoid structural subordination
FSE Net Debt~euro113 bn
incl Net Debt of KabiHeliosVamed
StockMarketValue~euro58 bn5 FSE Net Debt2
~euro115 bn
1 Incl consolidation adjustments2 Incl Fresenius financing subsidiaries3 Controlling stake4 Incl subsidiaries 5 Based on market capitalization for FMC as of September 30 20196 Via German holding entities (Fresenius Kabi AG and Fresenius ProServe GmbH)
General Credit Presentation November 2019 copy Fresenius SE amp Co KGaA Investor Relations
43
Fresenius Group Debt and Cash Flow Structure ndash Sep 30 2019 accord to IFRS 16
1 Incl consolidation adjustments2 Incl Fresenius financing subsidiaries3 Controlling stake4 Incl subsidiaries 5 Based on market capitalization for FMC as of September 30 20196 Via German holding entities (Fresenius Kabi AG and Fresenius ProServe GmbH)
Fresenius Medical Care
Financing
Fresenius SE Financing
Group Net Debt ~euro254 bn1
DividendsRents Service Agreements
~313 100 77100
euro50 m Net Debt4 euro921 m Net Debt4 euro331 m Net Debt4euro12704 m Net Debt4
Profit transfer Agreements6
bull Separate financing of Fresenius SE and Fresenius Medical Care
bull No joint financing facilities or mutual guarantees
bull Fresenius Kabi Fresenius Helios and Fresenius Vamed financed primarily through Fresenius SE to avoid structural subordination
FSE Net Debt~euro127 bn
incl Net Debt of KabiHeliosVamed
StockMarketValue~euro58 bn5 FSE Net Debt2
~euro114 bn
General Credit Presentation November 2019 copy Fresenius SE amp Co KGaA Investor Relations
Fresenius Group Cash Flow
General Credit Presentation November 2019 copy Fresenius SE amp Co KGaA Investor Relations 44
eurom 2018 Margin 2017 Margin Δ YoY
Operating Cash Flow 3742 112 3937 116 -5
Capex (net) -2077 -62 -1705 -50 -22
Free Cash Flow(before acquisitions and dividends)
1665 50 2232 66 -25
Acquisitions (net) -613 -5865 --
Dividends -904 -924 2
Free Cash Flow(after acquisitions and dividends)
-1374 -41 -4557 -134 --
Fresenius Group Financial Results by Business Segment
General Credit Presentation November 2019 copy Fresenius SE amp Co KGaA Investor Relations 45
2018 2017 2016 Growth2
20182017
Sales euro16547 m euro17784 m euro16570 m 41
EBIT euro2306 m euro2562 m euro2409 m 61
Sales euro6544 m euro6358 m euro6007 m 7
EBIT euro1139 m euro1177 m euro1171 m 2
Sales euro8993 m euro8668 m euro5843 m 6
EBIT euro1052 m euro1052 m euro683 m 3
Sales euro1688 m euro1228 m euro1160 m 19
EBIT euro110m euro76 m euro69 m 9
Sales euro33530 m euro33886 m euro29471 m 6
EBIT euro4561 m euro4830 m euro4302 m -1Group
2018 and 2017 before special items
1 FMC on a comparable basis2 Growth rates at constant currency and after adjustments
Fresenius Group Margins by Business Segment
General Credit Presentation November 2019 copy Fresenius SE amp Co KGaA Investor Relations 46
2018 and 2017 before special items
2018 2017 2016
EBITDA margin 183 185 188
EBIT margin 139 144 145
EBITDA margin 219 233 244
EBIT margin 174 185 195
EBITDA margin 159 165 150
EBIT margin 117 121 117
EBITDA margin 79 71 69
EBIT margin 65 62 59
EBITDA margin 179 185 187
EBIT margin 136 143 146Group
Fresenius SE amp Co KGaA Overview Bonds
General Credit Presentation November 2019 copy Fresenius SE amp Co KGaA Investor Relations 47
Issuer Volume(in millions)
Coupon type
Coupon (in )
MaturityTerm
ISIN (RegS)
WKN
Fresenius SE amp Co KGaAeuro500 Fix 2875 20132020 XS0873432511 A1HEWZ
Fresenius SE amp Co KGaAeuro450 Fix 300 20142021 XS1013955379 A1ZB7H
Fresenius SE amp Co KGaAeuro450 Fix 400 20142024 XS1026109204 A1ZC60
Fresenius SE amp Co KGaAeuro 500 Fix 1875 20192025 XS1936208252 A2NBMS
Fresenius SE amp Co KGaAeuro 500 Fix 2875 20192029 XS1936208419 A2NBMT
Fresenius Finance Ireland plceuro700 Fix 0875 20172022 XS1554373164 A19B3F
Fresenius Finance Ireland plceuro700 Fix 150 20172024 XS1554373248 A19B3G
Fresenius Finance Ireland plceuro700 Fix 2125 20172027 XS1554373677 A19B3H
Fresenius Finance Ireland plceuro500 Fix 300 20172032 XS1554373834 A19B3J
Fresenius US Finance II IncUS$300 Fix 425 20142021 USU31436AG04 A1ZDVJ
Fresenius US Finance II IncUS$300 Fix 450 20152023 USU31436AH86 A1Z64A
Fresenius Group Reconciliation
General Credit Presentation November 2019 copy Fresenius SE amp Co KGaA Investor Relations
eurom Q319 Q318 growthrate
growthrate (cc)
Sales reported 8842 8192 8 6Divestitures of Care Coordination activities at FMC - -7
IFRS 16 effect 35 -
Sales on a comparable basis 8877 8185 8 6
EBIT reported (after special items) 1129 1041 8 6Transaction costs Akorn 0 6
Bridge Financing costs Akorn - 0
Revaluations of biosimilars contingent liabilities 0 -
Gain related to divestitures of Care Coordination activities -3 -10
Transaction costs NxStage 2 -
Expenses associated with the cost optimization program at FMC 25 -
Impact of FCPA related charge - 75
EBIT (before special items) 1153 1112 4 1Divestitures of Care Coordination activities at FMC - 0
IFRS 16 effect -23 -
EBIT on a comparable basis 1130 1112 2 -1
48
Fresenius Group Reconciliation
General Credit Presentation November 2019 copy Fresenius SE amp Co KGaA Investor Relations
eurom Q319 Q318 growthrate
growthrate (cc)
Net interest reported (after special items) -172 -146 -18 -15Bridge Financing costs Akorn - 5
Revaluations of biosimilars contingent liabilities 1 -
Net interest (before special items) -171 -141 -21 -18Divestitures of Care Coordination activities at FMC - 0
IFRS 16 effect 47 -
Net interest on a comparable basis -124 -141 12 15
49
Fresenius Group Reconciliation
General Credit Presentation November 2019 copy Fresenius SE amp Co KGaA Investor Relations
eurom Q319 Q318 growthrate
growthrate (cc)
Income taxes reported (after special items) -202 -196 -3 -1Transaction costs Akorn 0 -1Bridge Financing costs Akorn - -2Revaluations of biosimilars contingent liabilities 0 -Gain related to divestitures of Care Coordination activities -17 -7Transaction costs NxStage -1 -Expenses associated with the cost optimization program at FMC -7 -Income taxes (before special items) -227 -206 -10 -7Divestitures of Care Coordination activities at FMC - -1IFRS 16 effect -5 -Income taxes on a comparable basis -232 -207 -12 -10
Noncontrolling interest reported (after special items) -311 -280 -11 -7Gain related to divestitures of Care Coordination activities 14 12Transaction costs NxStage 0 -Expenses associated with the cost optimization program at FMC -13 -Impact of FCPA related charge - -52Noncontrolling interest (before special items) -310 -320 3 7Divestitures of Care Coordination activities at FMC - 0IFRS 16 effect -11 -Noncontrolling interest on a comparable basis -321 -320 0 3
50
Fresenius Group Reconciliation
General Credit Presentation November 2019 copy Fresenius SE amp Co KGaA Investor Relations
eurom Q319 Q318 growthrate
growthrate (cc)
Net income reported (after special items) 444 419 6 4Transaction costs Akorn 0 5
Bridge Financing costs Akorn - 3
Revaluations of biosimilars contingent liabilities 1 -
Gain related to divestitures of Care Coordination activities -6 -5
Transaction costs NxStage 1 -
Expenses associated with the cost optimization program at FMC 5 -
Impact of FCPA related charge - 23
Net income (before special items) 445 445 0 -2Divestitures of Care Coordination activities at FMC - -1
IFRS 16 effect 8 -
Net income on a comparable basis 453 444 2 0
51
Fresenius Group Reconciliation
General Credit Presentation November 2019 copy Fresenius SE amp Co KGaA Investor Relations
eurom Q1-319 Q1-318 growthrate
growthrate (cc)
Sales reported 26098 24695 6 3Divestitures of Care Coordination activities at FMC - -516
IFRS 16 effect 75 -
Sales on a comparable basis 26173 24179 8 6
EBIT reported (after special items) 3362 4020 -16 -19Transaction costs Akorn 3 45
Bridge Financing costs Akorn - 1
Revaluations of biosimilars contingent liabilities -4 -
Gain related to divestitures of Care Coordination activities -14 -830
Transaction costs NxStage 22 -
Expenses associated with the cost optimization program at FMC 32 -
Impact of FCPA related charge - 75
EBIT (before special items) 3401 3311 3 0Divestitures of Care Coordination activities at FMC - -14
IFRS 16 effect -79 -
EBIT on a comparable basis 3322 3297 1 -2
52
Fresenius Group Reconciliation
General Credit Presentation November 2019 copy Fresenius SE amp Co KGaA Investor Relations
eurom Q1-319 Q1-318 growthrate
growthrate (cc)
Net interest reported (after special items) -535 -453 -18 -15Bridge Financing costs Akorn - 12
Revaluations of biosimilars contingent liabilities 3 -
Net interest (before special items) -532 -441 -21 -17Divestitures of Care Coordination activities at FMC - 21
IFRS 16 effect 153 -
Net interest on a comparable basis -379 -420 10 12
53
Fresenius Group Reconciliation
General Credit Presentation November 2019 copy Fresenius SE amp Co KGaA Investor Relations
eurom Q1-319 Q1-318 growthrate
growthrate (cc)
Income taxes reported (after special items) -632 -754 16 19Transaction costs Akorn 0 -9Bridge Financing costs Akorn - -4Revaluations of biosimilars contingent liabilities 0 -Gain related to divestitures of Care Coordination activities -15 140Transaction costs NxStage -6 -Expenses associated with the cost optimization program at FMC -9 -Income taxes (before special items) -662 -627 -6 -2Divestitures of Care Coordination activities at FMC - -2IFRS 16 effect -18 -Income taxes on a comparable basis -680 -629 -8 -5
Noncontrolling interest reported (after special items) -827 -1302 36 39Gain related to divestitures of Care Coordination activities 20 478Transaction costs NxStage -11 -Expenses associated with the cost optimization program at FMC -16 -Impact of FCPA related charge - -52Noncontrolling interest (before special items) -834 -876 5 9Divestitures of Care Coordination activities at FMC - -4IFRS 16 effect -31 -Noncontrolling interest on a comparable basis -865 -880 2 6
54
Fresenius Group Reconciliation
General Credit Presentation November 2019 copy Fresenius SE amp Co KGaA Investor Relations
eurom Q1-319 Q1-318 growthrate
growthrate (cc)
Net income reported (after special items) 1368 1511 -9 -12Transaction costs Akorn 3 36
Bridge Financing costs Akorn - 9
Revaluations of biosimilars contingent liabilities -1 -
Gain related to divestitures of Care Coordination activities -9 -212
Transaction costs NxStage 5 -
Expenses associated with the cost optimization program at FMC 7 -
Impact of FCPA related charge - 23
Net income (before special items) 1373 1367 0 -2Divestitures of Care Coordination activities at FMC - 1
IFRS 16 effect 25 -
Net income on a comparable basis 1398 1368 2 0
55
Reconciliation according to Fresenius Medical Care
General Credit Presentation November 2019 copy Fresenius SE amp Co KGaA Investor Relations
eurom Q319 Q318 growthrate
growthrate (cc)
Sales reported 4419 4058 9 6Divestitures of Care Coordination activities - -7
IFRS 16 effect 35 -
NxStage operations -79 -
Sales adjusted 4375 4051 8 5
EBIT reported 595 527 13 9
Gain related to divestitures of Care Coordination activities -2 -10
Divestitures of Care Coordination activities - 0
IFRS 16 effect -21 -
NxStage operations 0 -
Transaction costs NxStage 2 -
Expenses associated with the cost optimization program 25 -
Impact of FCPA related charge - 75EBIT adjusted 599 592 1 -3
56
Reconciliation according to Fresenius Medical Care
General Credit Presentation November 2019 copy Fresenius SE amp Co KGaA Investor Relations
eurom Q319 Q318 growthrate
growthrate (cc)
Net income reported 333 285 17 12
Gain related to divestitures of Care Coordination activities -20 -17
Divestitures of Care Coordination activities - 0
IFRS 16 effect 16 -
NxStage operations 15 -
Transaction costs NxStage 1 -
Expenses associated with the cost optimization program 18 -
Impact of FCPA related charge - 75Net income adjusted 363 343 6 2
57
Reconciliation according to Fresenius Medical Care
General Credit Presentation November 2019 copy Fresenius SE amp Co KGaA Investor Relations
eurom Q1-319 Q1-318 growthrate
growthrate (cc)
Sales reported 12897 12247 5 1Divestitures of Care Coordination activities - -516
IFRS 16 effect 75 -
NxStage operations -188 -
Sales adjusted 12784 11731 9 5
EBIT reported 1653 2425 -32 -35Gain related to divestitures of Care Coordination activities -14 -830
Divestitures of Care Coordination activities - -14
IFRS 16 effect -68 -
NxStage operations 16 -
Transaction costs NxStage 22 -
Expenses associated with the cost optimization program 32 -
Impact of FCPA related charge - 75
EBIT adjusted 1641 1656 -1 -5
58
Reconciliation according to Fresenius Medical Care
General Credit Presentation November 2019 copy Fresenius SE amp Co KGaA Investor Relations
eurom Q1-319 Q1-318 growthrate
growthrate (cc)
Net income reported 857 1557 -45 -47Gain related to divestitures of Care Coordination activities -29 -690
Divestitures of Care Coordination activities - 4
IFRS 16 effect 45 -
NxStage operations 49 -
Transaction costs NxStage 16 -
Expenses associated with the cost optimization program 23 -
Impact of FCPA related charge - 75
Net income adjusted 961 946 2 -3
59
Reconciliation Fresenius Medical Care according to Fresenius Group
General Credit Presentation November 2019 copy Fresenius SE amp Co KGaA Investor Relations
eurom Q319 Q318 growthrate
growthrate (cc)
Sales reported 4419 4058 9 6Divestitures of Care Coordination activities - -7
IFRS 16 effect 35 -
Sales on a comparable basis 4454 4051 10 7
EBIT reported (after special items) 595 527 13 9Gain related to divestitures of Care Coordination activities -3 -10
Transaction costs NxStage 2 -
Expenses associated with the cost optimization program 25 -
Impact of FCPA related charge - 75
EBIT (before special items) 619 592 5 1Divestitures of Care Coordination activities - 0
IFRS 16 effect -20 -
EBIT on a comparable basis 599 592 1 -3
60
Reconciliation Fresenius Medical Care according to Fresenius Group
General Credit Presentation November 2019 copy Fresenius SE amp Co KGaA Investor Relations
eurom Q319 Q318 growthrate
growthrate (cc)
Net income reported (after special items) 332 284 17 12Gain related to divestitures of Care Coordination activities -20 -16
Transaction costs NxStage 1 -
Expenses associated with the cost optimization program 18 -
Impact of FCPA related charge - 75
Net income (before special items) 331 343 -3 -7Divestitures of Care Coordination activities - -1
IFRS 16 effect 17 -
Net income on a comparable basis 348 342 2 -2
61
Reconciliation Fresenius Medical Care according to Fresenius Group
General Credit Presentation November 2019 copy Fresenius SE amp Co KGaA Investor Relations
eurom Q1-319 Q1-318 growthrate
growthrate (cc)
Sales reported 12897 12247 5 1Divestitures of Care Coordination activities - -516
IFRS 16 effect 75 -
Sales on a comparable basis 12972 11731 11 7
EBIT reported (after special items) 1653 2425 -32 -35Gain related to divestitures of Care Coordination activities -14 -830
Transaction costs NxStage 22 -
Expenses associated with the cost optimization program 32 -
Impact of FCPA related charge - 75
EBIT (before special items) 1693 1670 1 -3Divestitures of Care Coordination activities - -14
IFRS 16 effect -68 -
EBIT on a comparable basis 1625 1656 -2 -6
62
Reconciliation Fresenius Medical Care according to Fresenius Group
General Credit Presentation November 2019 copy Fresenius SE amp Co KGaA Investor Relations
eurom Q1-319 Q1-318 growthrate
growthrate (cc)
Net income reported (after special items) 857 1557 -45 -47Gain related to divestitures of Care Coordination activities -29 -690
Transaction costs NxStage 16 -
Expenses associated with the cost optimization program 23 -
Impact of FCPA related charge - 75
Net income (before special items) 867 942 -8 -12Divestitures of Care Coordination activities - 4
IFRS 16 effect 45 -
Net income on a comparable basis 912 946 -4 -8
63
Reconciliation Fresenius Kabi
General Credit Presentation November 2019 copy Fresenius SE amp Co KGaA Investor Relations
eurom Q319 Q318 growthrate
growthrate (cc)
Sales reported 1761 1650 7 5
Transaction costs Akorn 0 6
Revaluations of biosimilars contingent liabilities 0 -
EBIT (before special items) 307 297 3 1IFRS 16 effect -1 -
EBIT on a comparable basis 306 297 3 1
Transaction costs Akorn 0 5
Revaluations of biosimilars contingent liabilities 1 -
Net income (before special items) 203 199 2 -1IFRS 16 effect 1 -
Net income on a comparable basis 204 199 3 0
64
Reconciliation Fresenius Kabi
General Credit Presentation November 2019 copy Fresenius SE amp Co KGaA Investor Relations
eurom Q1-319 Q1-318 growthrate
growthrate (cc)
Sales reported 5153 4857 6 5
Transaction costs Akorn 3 45
Revaluations of biosimilars contingent liabilities -4 -
EBIT (before special items) 920 854 8 4IFRS 16 effect -3 -
EBIT on a comparable basis 917 854 7 4
Transaction costs Akorn 3 36
Revaluations of biosimilars contingent liabilities -1 -
Net income (before special items) 614 554 11 7IFRS 16 effect 4 -
Net income on a comparable basis 618 554 12 8
65
Reconciliation Fresenius Helios
General Credit Presentation November 2019 copy Fresenius SE amp Co KGaA Investor Relations
eurom Q319 Q318 growthrate
Sales reported 2230 2088 7German post-acute care business transferred from Fresenius Helios to Fresenius Vamed - 0
Sales adjusted for German post-acute care business 2230 2088 7
EBIT reported 187 204 -8IFRS 16 effect -4 -
EBIT adjusted for IFRS 16 effect 183 204 -10German post-acute care business transferred from Fresenius Helios to Fresenius Vamed - 0EBIT adjusted for IFRS 16 effect and German post-acute care business 183 204 -10
66
Reconciliation Fresenius Helios
General Credit Presentation November 2019 copy Fresenius SE amp Co KGaA Investor Relations
eurom Q1-319 Q1-318 growthrate
Sales reported 6890 6762 2German post-acute care business transferred from Fresenius Helios to Fresenius Vamed - -226
Sales adjusted for German post-acute care business 6890 6536 5
EBIT reported 731 775 -6IFRS 16 effect -8 -
EBIT adjusted for IFRS 16 effect 723 775 -7German post-acute care business transferred from Fresenius Helios to Fresenius Vamed - -10EBIT adjusted for IFRS 16 effect and German post-acute care business 723 765 -5
67
Reconciliation Fresenius Vamed
General Credit Presentation November 2019 copy Fresenius SE amp Co KGaA Investor Relations
eurom Q319 Q318 growthrate
Sales reported 562 476 18German post-acute care business acquired from Fresenius Helios -121 -117
Sales adjusted for German post-acute care business 441 359 23
EBIT reported 33 31 6IFRS 16 effect 1 -
EBIT adjusted for IFRS 16 effect 34 31 10German post-acute care business acquired from Fresenius Helios -15 -15EBIT adjusted for IFRS 16 effect and German post-acute care business 19 16 19
68
Reconciliation Fresenius Vamed
General Credit Presentation November 2019 copy Fresenius SE amp Co KGaA Investor Relations
eurom Q1-319 Q1-318 growthrate
Sales reported 1469 991 48German post-acute care business acquired from Fresenius Helios -350 -117
Sales adjusted for German post-acute care business 1119 874 28
EBIT reported 67 49 37IFRS 16 effect -2 -
EBIT adjusted for IFRS 16 effect 65 49 33German post-acute care business acquired from Fresenius Helios -31 -15EBIT adjusted for IFRS 16 effect and German post-acute care business 34 34 0
69
Financial Calendar Contact
Financial Calendar 20 February 2020 Results FY19
06 May 2020 Results Q120
20 May 2020 Annual General Meeting
30 July 2020 Results Q220
29 October 2020 Results Q320
Please note that these dates could be subject to change
Contact
Investor RelationsFresenius SE amp Co KGaAphone +49 6172 608-2485e-mail ir-frefreseniuscomFor further information and current news wwwfreseniuscom
Follow us on Twitter wwwtwittercomfresenius_irand LinkedIn wwwlinkedincomcompanyfresenius-investor-relations
General Credit Presentation November 2019 copy Fresenius SE amp Co KGaA Investor Relations 70
- Presentation to Credit Investors
- Safe Harbor Statement
- Foliennummer 3
- Strong and Balanced Health Care Portfolio
- Fresenius Group Global Sales Base in Growing Non-Cyclical Markets
- Fresenius Group Strong Track Record of Organic Sales Growth in All Business Segments
- Fresenius Group Strong Track Record of EBITDA Generation
- Fresenius SE Earnings-Linked Dividend Policy
- Global Health Care Trends ndash Strong Growth Fundamentals
- Fresenius Medical Care Global Dialysis Market Leader
- Fresenius Medical Care Sales and EBIT development
- Fresenius Kabi A Leading Global Hospital Supplier
- Fresenius Kabi Sales and EBIT development
- Fresenius Helios Europersquos Largest Private Hospital OperatorHelios Germany
- Fresenius Helios Europersquos Largest Private Hospital Operator Helios Spain
- Fresenius Helios Sales and EBIT development
- Fresenius Vamed Leading Global Hospital Projects and Services Specialist
- Fresenius Vamed Sales an EBIT development
- Fresenius Group Key Figures
- Cash Flow Development by Business Segment
- Fresenius Group Consistent Cash Generation
- Fresenius Group Proven Track Record of Deleveraging
- Fresenius Group Capitalization ndash September 30 2019 excl IFRS 16
- Fresenius Group Capitalization ndash September 30 2019 incl IFRS 16
- Fresenius Group Broad Mix of Financing Instruments
- Foliennummer 26
- Fresenius Group excl Fresenius Medical CareDebt Maturity Profile ndash September 30 201912
- Fresenius Group Solid Balance Sheet Structure
- Fresenius Group Strong Access to Capital Markets
- Fresenius SE Rating History amp Rationale
- Fresenius Group 2019 Financial Outlook by Business Segment
- Fresenius Group 2019 Financial Guidance
- Fresenius Group Healthy Growth Targets 2020 ndash 2023 (CAGRs)
- FY18 base for Fresenius Group Guidance FY19
- FY18 base for Fresenius Medical Care Outlook FY19
- FY18 base for Fresenius Kabi Outlook FY19
- IFRS 16 effect on Group PampL
- IFRS 16 effect on Group Balance Sheet and Cash Flow
- Fresenius Group Credit Highlights
- Attachments
- Fresenius Group Key Figures
- Foliennummer 42
- Foliennummer 43
- Fresenius Group Cash Flow
- Fresenius Group Financial Results by Business Segment
- Fresenius Group Margins by Business Segment
- Fresenius SE amp Co KGaA Overview Bonds
- Fresenius Group Reconciliation
- Fresenius Group Reconciliation
- Fresenius Group Reconciliation
- Fresenius Group Reconciliation
- Fresenius Group Reconciliation
- Fresenius Group Reconciliation
- Fresenius Group Reconciliation
- Fresenius Group Reconciliation
- Reconciliation according to Fresenius Medical Care
- Reconciliation according to Fresenius Medical Care
- Reconciliation according to Fresenius Medical Care
- Reconciliation according to Fresenius Medical Care
- Reconciliation Fresenius Medical Care according to Fresenius Group
- Reconciliation Fresenius Medical Care according to Fresenius Group
- Reconciliation Fresenius Medical Care according to Fresenius Group
- Reconciliation Fresenius Medical Care according to Fresenius Group
- Reconciliation Fresenius Kabi
- Reconciliation Fresenius Kabi
- Reconciliation Fresenius Helios
- Reconciliation Fresenius Helios
- Reconciliation Fresenius Vamed
- Reconciliation Fresenius Vamed
- Financial Calendar Contact
-
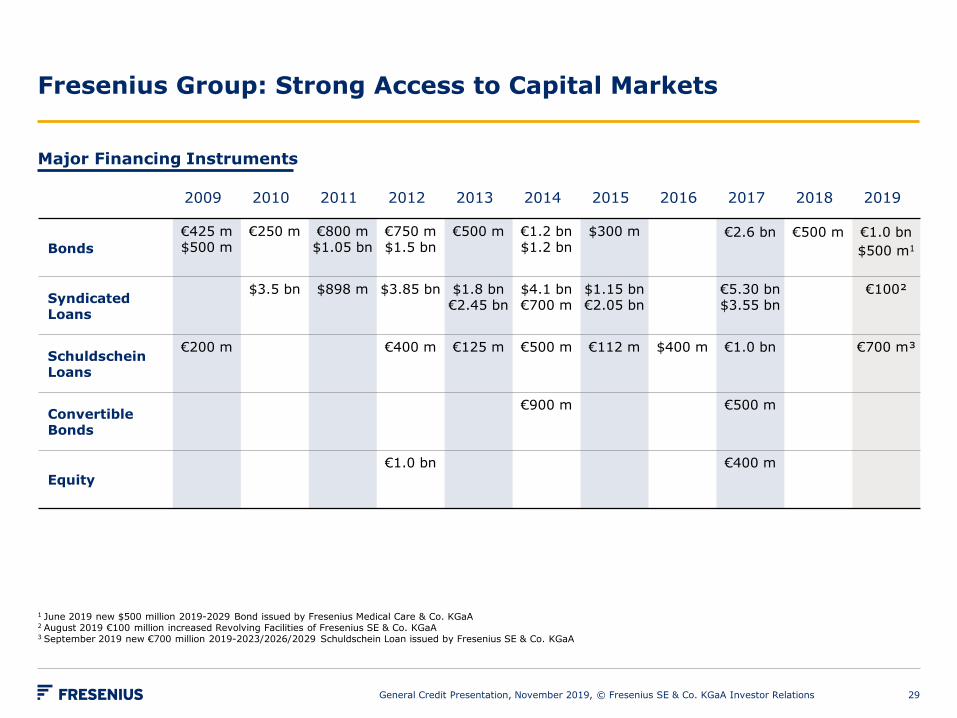
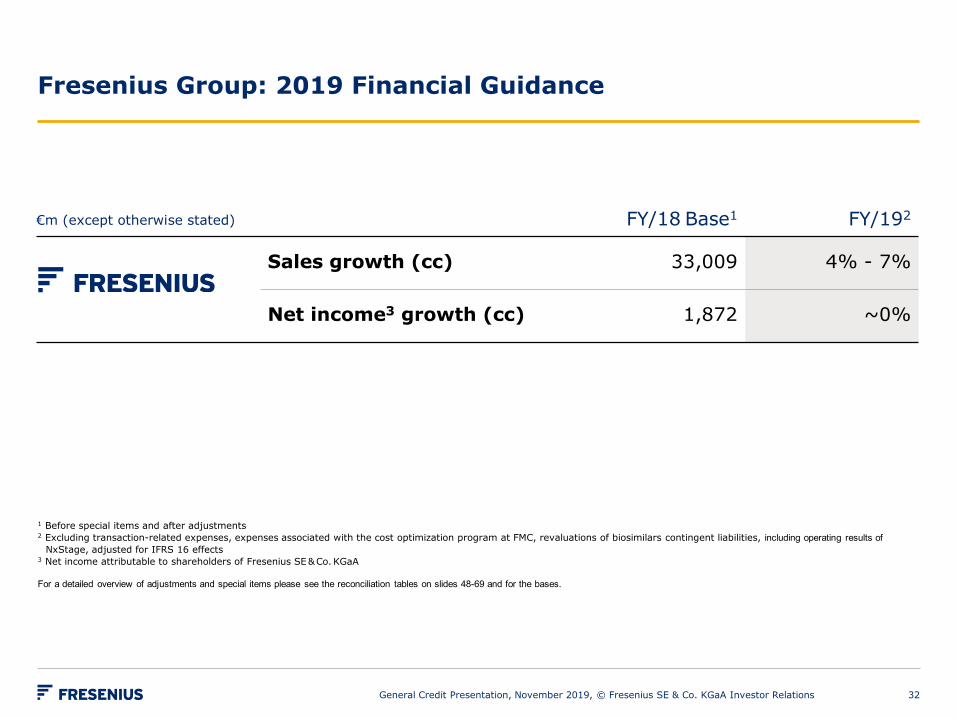
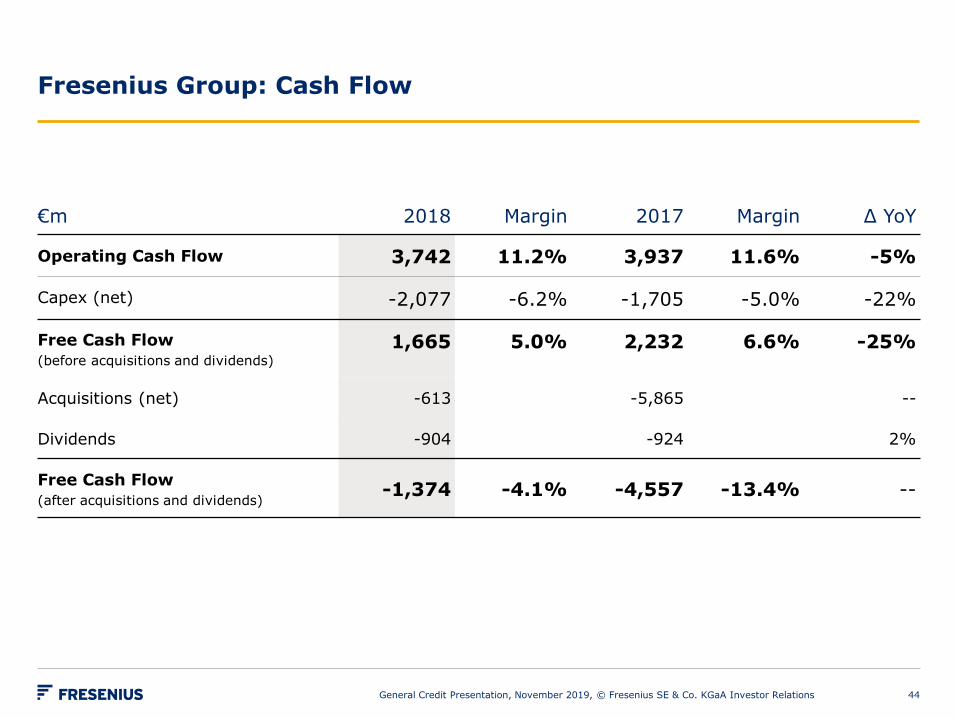
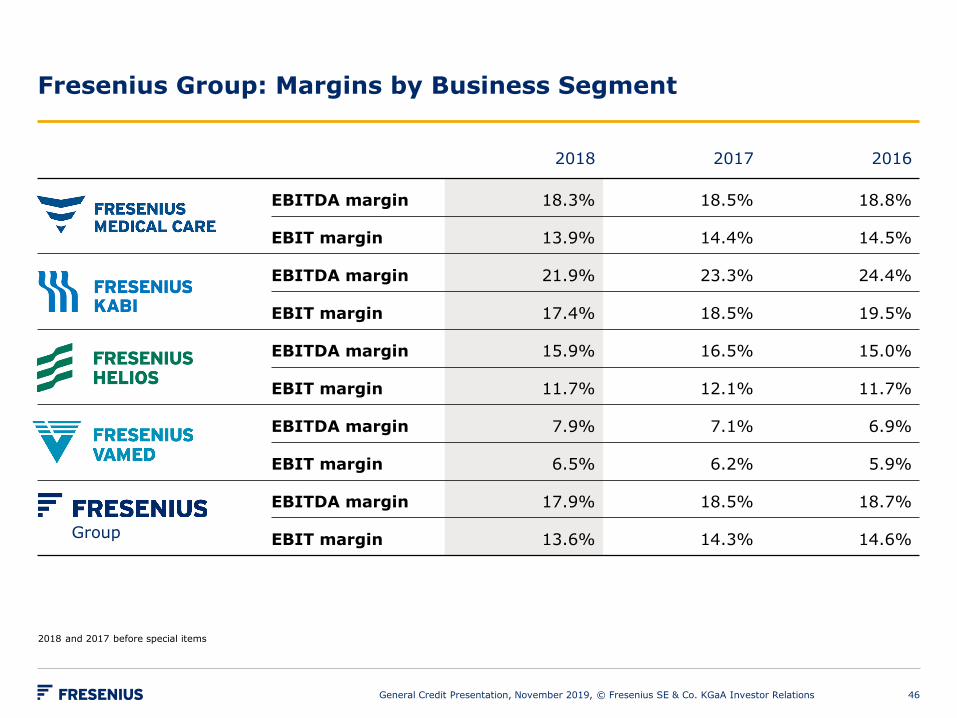

Fresenius Group Reconciliation
General Credit Presentation November 2019 copy Fresenius SE amp Co KGaA Investor Relations
eurom Q319 Q318 growthrate
growthrate (cc)
Net income reported (after special items) 444 419 6 4Transaction costs Akorn 0 5
Bridge Financing costs Akorn - 3
Revaluations of biosimilars contingent liabilities 1 -
Gain related to divestitures of Care Coordination activities -6 -5
Transaction costs NxStage 1 -
Expenses associated with the cost optimization program at FMC 5 -
Impact of FCPA related charge - 23
Net income (before special items) 445 445 0 -2Divestitures of Care Coordination activities at FMC - -1
IFRS 16 effect 8 -
Net income on a comparable basis 453 444 2 0
51
Fresenius Group Reconciliation
General Credit Presentation November 2019 copy Fresenius SE amp Co KGaA Investor Relations
eurom Q1-319 Q1-318 growthrate
growthrate (cc)
Sales reported 26098 24695 6 3Divestitures of Care Coordination activities at FMC - -516
IFRS 16 effect 75 -
Sales on a comparable basis 26173 24179 8 6
EBIT reported (after special items) 3362 4020 -16 -19Transaction costs Akorn 3 45
Bridge Financing costs Akorn - 1
Revaluations of biosimilars contingent liabilities -4 -
Gain related to divestitures of Care Coordination activities -14 -830
Transaction costs NxStage 22 -
Expenses associated with the cost optimization program at FMC 32 -
Impact of FCPA related charge - 75
EBIT (before special items) 3401 3311 3 0Divestitures of Care Coordination activities at FMC - -14
IFRS 16 effect -79 -
EBIT on a comparable basis 3322 3297 1 -2
52
Fresenius Group Reconciliation
General Credit Presentation November 2019 copy Fresenius SE amp Co KGaA Investor Relations
eurom Q1-319 Q1-318 growthrate
growthrate (cc)
Net interest reported (after special items) -535 -453 -18 -15Bridge Financing costs Akorn - 12
Revaluations of biosimilars contingent liabilities 3 -
Net interest (before special items) -532 -441 -21 -17Divestitures of Care Coordination activities at FMC - 21
IFRS 16 effect 153 -
Net interest on a comparable basis -379 -420 10 12
53
Fresenius Group Reconciliation
General Credit Presentation November 2019 copy Fresenius SE amp Co KGaA Investor Relations
eurom Q1-319 Q1-318 growthrate
growthrate (cc)
Income taxes reported (after special items) -632 -754 16 19Transaction costs Akorn 0 -9Bridge Financing costs Akorn - -4Revaluations of biosimilars contingent liabilities 0 -Gain related to divestitures of Care Coordination activities -15 140Transaction costs NxStage -6 -Expenses associated with the cost optimization program at FMC -9 -Income taxes (before special items) -662 -627 -6 -2Divestitures of Care Coordination activities at FMC - -2IFRS 16 effect -18 -Income taxes on a comparable basis -680 -629 -8 -5
Noncontrolling interest reported (after special items) -827 -1302 36 39Gain related to divestitures of Care Coordination activities 20 478Transaction costs NxStage -11 -Expenses associated with the cost optimization program at FMC -16 -Impact of FCPA related charge - -52Noncontrolling interest (before special items) -834 -876 5 9Divestitures of Care Coordination activities at FMC - -4IFRS 16 effect -31 -Noncontrolling interest on a comparable basis -865 -880 2 6
54
Fresenius Group Reconciliation
General Credit Presentation November 2019 copy Fresenius SE amp Co KGaA Investor Relations
eurom Q1-319 Q1-318 growthrate
growthrate (cc)
Net income reported (after special items) 1368 1511 -9 -12Transaction costs Akorn 3 36
Bridge Financing costs Akorn - 9
Revaluations of biosimilars contingent liabilities -1 -
Gain related to divestitures of Care Coordination activities -9 -212
Transaction costs NxStage 5 -
Expenses associated with the cost optimization program at FMC 7 -
Impact of FCPA related charge - 23
Net income (before special items) 1373 1367 0 -2Divestitures of Care Coordination activities at FMC - 1
IFRS 16 effect 25 -
Net income on a comparable basis 1398 1368 2 0
55
Reconciliation according to Fresenius Medical Care
General Credit Presentation November 2019 copy Fresenius SE amp Co KGaA Investor Relations
eurom Q319 Q318 growthrate
growthrate (cc)
Sales reported 4419 4058 9 6Divestitures of Care Coordination activities - -7
IFRS 16 effect 35 -
NxStage operations -79 -
Sales adjusted 4375 4051 8 5
EBIT reported 595 527 13 9
Gain related to divestitures of Care Coordination activities -2 -10
Divestitures of Care Coordination activities - 0
IFRS 16 effect -21 -
NxStage operations 0 -
Transaction costs NxStage 2 -
Expenses associated with the cost optimization program 25 -
Impact of FCPA related charge - 75EBIT adjusted 599 592 1 -3
56
Reconciliation according to Fresenius Medical Care
General Credit Presentation November 2019 copy Fresenius SE amp Co KGaA Investor Relations
eurom Q319 Q318 growthrate
growthrate (cc)
Net income reported 333 285 17 12
Gain related to divestitures of Care Coordination activities -20 -17
Divestitures of Care Coordination activities - 0
IFRS 16 effect 16 -
NxStage operations 15 -
Transaction costs NxStage 1 -
Expenses associated with the cost optimization program 18 -
Impact of FCPA related charge - 75Net income adjusted 363 343 6 2
57
Reconciliation according to Fresenius Medical Care
General Credit Presentation November 2019 copy Fresenius SE amp Co KGaA Investor Relations
eurom Q1-319 Q1-318 growthrate
growthrate (cc)
Sales reported 12897 12247 5 1Divestitures of Care Coordination activities - -516
IFRS 16 effect 75 -
NxStage operations -188 -
Sales adjusted 12784 11731 9 5
EBIT reported 1653 2425 -32 -35Gain related to divestitures of Care Coordination activities -14 -830
Divestitures of Care Coordination activities - -14
IFRS 16 effect -68 -
NxStage operations 16 -
Transaction costs NxStage 22 -
Expenses associated with the cost optimization program 32 -
Impact of FCPA related charge - 75
EBIT adjusted 1641 1656 -1 -5
58
Reconciliation according to Fresenius Medical Care
General Credit Presentation November 2019 copy Fresenius SE amp Co KGaA Investor Relations
eurom Q1-319 Q1-318 growthrate
growthrate (cc)
Net income reported 857 1557 -45 -47Gain related to divestitures of Care Coordination activities -29 -690
Divestitures of Care Coordination activities - 4
IFRS 16 effect 45 -
NxStage operations 49 -
Transaction costs NxStage 16 -
Expenses associated with the cost optimization program 23 -
Impact of FCPA related charge - 75
Net income adjusted 961 946 2 -3
59
Reconciliation Fresenius Medical Care according to Fresenius Group
General Credit Presentation November 2019 copy Fresenius SE amp Co KGaA Investor Relations
eurom Q319 Q318 growthrate
growthrate (cc)
Sales reported 4419 4058 9 6Divestitures of Care Coordination activities - -7
IFRS 16 effect 35 -
Sales on a comparable basis 4454 4051 10 7
EBIT reported (after special items) 595 527 13 9Gain related to divestitures of Care Coordination activities -3 -10
Transaction costs NxStage 2 -
Expenses associated with the cost optimization program 25 -
Impact of FCPA related charge - 75
EBIT (before special items) 619 592 5 1Divestitures of Care Coordination activities - 0
IFRS 16 effect -20 -
EBIT on a comparable basis 599 592 1 -3
60
Reconciliation Fresenius Medical Care according to Fresenius Group
General Credit Presentation November 2019 copy Fresenius SE amp Co KGaA Investor Relations
eurom Q319 Q318 growthrate
growthrate (cc)
Net income reported (after special items) 332 284 17 12Gain related to divestitures of Care Coordination activities -20 -16
Transaction costs NxStage 1 -
Expenses associated with the cost optimization program 18 -
Impact of FCPA related charge - 75
Net income (before special items) 331 343 -3 -7Divestitures of Care Coordination activities - -1
IFRS 16 effect 17 -
Net income on a comparable basis 348 342 2 -2
61
Reconciliation Fresenius Medical Care according to Fresenius Group
General Credit Presentation November 2019 copy Fresenius SE amp Co KGaA Investor Relations
eurom Q1-319 Q1-318 growthrate
growthrate (cc)
Sales reported 12897 12247 5 1Divestitures of Care Coordination activities - -516
IFRS 16 effect 75 -
Sales on a comparable basis 12972 11731 11 7
EBIT reported (after special items) 1653 2425 -32 -35Gain related to divestitures of Care Coordination activities -14 -830
Transaction costs NxStage 22 -
Expenses associated with the cost optimization program 32 -
Impact of FCPA related charge - 75
EBIT (before special items) 1693 1670 1 -3Divestitures of Care Coordination activities - -14
IFRS 16 effect -68 -
EBIT on a comparable basis 1625 1656 -2 -6
62
Reconciliation Fresenius Medical Care according to Fresenius Group
General Credit Presentation November 2019 copy Fresenius SE amp Co KGaA Investor Relations
eurom Q1-319 Q1-318 growthrate
growthrate (cc)
Net income reported (after special items) 857 1557 -45 -47Gain related to divestitures of Care Coordination activities -29 -690
Transaction costs NxStage 16 -
Expenses associated with the cost optimization program 23 -
Impact of FCPA related charge - 75
Net income (before special items) 867 942 -8 -12Divestitures of Care Coordination activities - 4
IFRS 16 effect 45 -
Net income on a comparable basis 912 946 -4 -8
63
Reconciliation Fresenius Kabi
General Credit Presentation November 2019 copy Fresenius SE amp Co KGaA Investor Relations
eurom Q319 Q318 growthrate
growthrate (cc)
Sales reported 1761 1650 7 5
Transaction costs Akorn 0 6
Revaluations of biosimilars contingent liabilities 0 -
EBIT (before special items) 307 297 3 1IFRS 16 effect -1 -
EBIT on a comparable basis 306 297 3 1
Transaction costs Akorn 0 5
Revaluations of biosimilars contingent liabilities 1 -
Net income (before special items) 203 199 2 -1IFRS 16 effect 1 -
Net income on a comparable basis 204 199 3 0
64
Reconciliation Fresenius Kabi
General Credit Presentation November 2019 copy Fresenius SE amp Co KGaA Investor Relations
eurom Q1-319 Q1-318 growthrate
growthrate (cc)
Sales reported 5153 4857 6 5
Transaction costs Akorn 3 45
Revaluations of biosimilars contingent liabilities -4 -
EBIT (before special items) 920 854 8 4IFRS 16 effect -3 -
EBIT on a comparable basis 917 854 7 4
Transaction costs Akorn 3 36
Revaluations of biosimilars contingent liabilities -1 -
Net income (before special items) 614 554 11 7IFRS 16 effect 4 -
Net income on a comparable basis 618 554 12 8
65
Reconciliation Fresenius Helios
General Credit Presentation November 2019 copy Fresenius SE amp Co KGaA Investor Relations
eurom Q319 Q318 growthrate
Sales reported 2230 2088 7German post-acute care business transferred from Fresenius Helios to Fresenius Vamed - 0
Sales adjusted for German post-acute care business 2230 2088 7
EBIT reported 187 204 -8IFRS 16 effect -4 -
EBIT adjusted for IFRS 16 effect 183 204 -10German post-acute care business transferred from Fresenius Helios to Fresenius Vamed - 0EBIT adjusted for IFRS 16 effect and German post-acute care business 183 204 -10
66
Reconciliation Fresenius Helios
General Credit Presentation November 2019 copy Fresenius SE amp Co KGaA Investor Relations
eurom Q1-319 Q1-318 growthrate
Sales reported 6890 6762 2German post-acute care business transferred from Fresenius Helios to Fresenius Vamed - -226
Sales adjusted for German post-acute care business 6890 6536 5
EBIT reported 731 775 -6IFRS 16 effect -8 -
EBIT adjusted for IFRS 16 effect 723 775 -7German post-acute care business transferred from Fresenius Helios to Fresenius Vamed - -10EBIT adjusted for IFRS 16 effect and German post-acute care business 723 765 -5
67
Reconciliation Fresenius Vamed
General Credit Presentation November 2019 copy Fresenius SE amp Co KGaA Investor Relations
eurom Q319 Q318 growthrate
Sales reported 562 476 18German post-acute care business acquired from Fresenius Helios -121 -117
Sales adjusted for German post-acute care business 441 359 23
EBIT reported 33 31 6IFRS 16 effect 1 -
EBIT adjusted for IFRS 16 effect 34 31 10German post-acute care business acquired from Fresenius Helios -15 -15EBIT adjusted for IFRS 16 effect and German post-acute care business 19 16 19
68
Reconciliation Fresenius Vamed
General Credit Presentation November 2019 copy Fresenius SE amp Co KGaA Investor Relations
eurom Q1-319 Q1-318 growthrate
Sales reported 1469 991 48German post-acute care business acquired from Fresenius Helios -350 -117
Sales adjusted for German post-acute care business 1119 874 28
EBIT reported 67 49 37IFRS 16 effect -2 -
EBIT adjusted for IFRS 16 effect 65 49 33German post-acute care business acquired from Fresenius Helios -31 -15EBIT adjusted for IFRS 16 effect and German post-acute care business 34 34 0
69
Financial Calendar Contact
Financial Calendar 20 February 2020 Results FY19
06 May 2020 Results Q120
20 May 2020 Annual General Meeting
30 July 2020 Results Q220
29 October 2020 Results Q320
Please note that these dates could be subject to change
Contact
Investor RelationsFresenius SE amp Co KGaAphone +49 6172 608-2485e-mail ir-frefreseniuscomFor further information and current news wwwfreseniuscom
Follow us on Twitter wwwtwittercomfresenius_irand LinkedIn wwwlinkedincomcompanyfresenius-investor-relations
General Credit Presentation November 2019 copy Fresenius SE amp Co KGaA Investor Relations 70
- Presentation to Credit Investors
- Safe Harbor Statement
- Foliennummer 3
- Strong and Balanced Health Care Portfolio
- Fresenius Group Global Sales Base in Growing Non-Cyclical Markets
- Fresenius Group Strong Track Record of Organic Sales Growth in All Business Segments
- Fresenius Group Strong Track Record of EBITDA Generation
- Fresenius SE Earnings-Linked Dividend Policy
- Global Health Care Trends ndash Strong Growth Fundamentals
- Fresenius Medical Care Global Dialysis Market Leader
- Fresenius Medical Care Sales and EBIT development
- Fresenius Kabi A Leading Global Hospital Supplier
- Fresenius Kabi Sales and EBIT development
- Fresenius Helios Europersquos Largest Private Hospital OperatorHelios Germany
- Fresenius Helios Europersquos Largest Private Hospital Operator Helios Spain
- Fresenius Helios Sales and EBIT development
- Fresenius Vamed Leading Global Hospital Projects and Services Specialist
- Fresenius Vamed Sales an EBIT development
- Fresenius Group Key Figures
- Cash Flow Development by Business Segment
- Fresenius Group Consistent Cash Generation
- Fresenius Group Proven Track Record of Deleveraging
- Fresenius Group Capitalization ndash September 30 2019 excl IFRS 16
- Fresenius Group Capitalization ndash September 30 2019 incl IFRS 16
- Fresenius Group Broad Mix of Financing Instruments
- Foliennummer 26
- Fresenius Group excl Fresenius Medical CareDebt Maturity Profile ndash September 30 201912
- Fresenius Group Solid Balance Sheet Structure
- Fresenius Group Strong Access to Capital Markets
- Fresenius SE Rating History amp Rationale
- Fresenius Group 2019 Financial Outlook by Business Segment
- Fresenius Group 2019 Financial Guidance
- Fresenius Group Healthy Growth Targets 2020 ndash 2023 (CAGRs)
- FY18 base for Fresenius Group Guidance FY19
- FY18 base for Fresenius Medical Care Outlook FY19
- FY18 base for Fresenius Kabi Outlook FY19
- IFRS 16 effect on Group PampL
- IFRS 16 effect on Group Balance Sheet and Cash Flow
- Fresenius Group Credit Highlights
- Attachments
- Fresenius Group Key Figures
- Foliennummer 42
- Foliennummer 43
- Fresenius Group Cash Flow
- Fresenius Group Financial Results by Business Segment
- Fresenius Group Margins by Business Segment
- Fresenius SE amp Co KGaA Overview Bonds
- Fresenius Group Reconciliation
- Fresenius Group Reconciliation
- Fresenius Group Reconciliation
- Fresenius Group Reconciliation
- Fresenius Group Reconciliation
- Fresenius Group Reconciliation
- Fresenius Group Reconciliation
- Fresenius Group Reconciliation
- Reconciliation according to Fresenius Medical Care
- Reconciliation according to Fresenius Medical Care
- Reconciliation according to Fresenius Medical Care
- Reconciliation according to Fresenius Medical Care
- Reconciliation Fresenius Medical Care according to Fresenius Group
- Reconciliation Fresenius Medical Care according to Fresenius Group
- Reconciliation Fresenius Medical Care according to Fresenius Group
- Reconciliation Fresenius Medical Care according to Fresenius Group
- Reconciliation Fresenius Kabi
- Reconciliation Fresenius Kabi
- Reconciliation Fresenius Helios
- Reconciliation Fresenius Helios
- Reconciliation Fresenius Vamed
- Reconciliation Fresenius Vamed
- Financial Calendar Contact
-

Fresenius Group Reconciliation
General Credit Presentation November 2019 copy Fresenius SE amp Co KGaA Investor Relations
eurom Q1-319 Q1-318 growthrate
growthrate (cc)
Net income reported (after special items) 1368 1511 -9 -12Transaction costs Akorn 3 36
Bridge Financing costs Akorn - 9
Revaluations of biosimilars contingent liabilities -1 -
Gain related to divestitures of Care Coordination activities -9 -212
Transaction costs NxStage 5 -
Expenses associated with the cost optimization program at FMC 7 -
Impact of FCPA related charge - 23
Net income (before special items) 1373 1367 0 -2Divestitures of Care Coordination activities at FMC - 1
IFRS 16 effect 25 -
Net income on a comparable basis 1398 1368 2 0
55
Reconciliation according to Fresenius Medical Care
General Credit Presentation November 2019 copy Fresenius SE amp Co KGaA Investor Relations
eurom Q319 Q318 growthrate
growthrate (cc)
Sales reported 4419 4058 9 6Divestitures of Care Coordination activities - -7
IFRS 16 effect 35 -
NxStage operations -79 -
Sales adjusted 4375 4051 8 5
EBIT reported 595 527 13 9
Gain related to divestitures of Care Coordination activities -2 -10
Divestitures of Care Coordination activities - 0
IFRS 16 effect -21 -
NxStage operations 0 -
Transaction costs NxStage 2 -
Expenses associated with the cost optimization program 25 -
Impact of FCPA related charge - 75EBIT adjusted 599 592 1 -3
56
Reconciliation according to Fresenius Medical Care
General Credit Presentation November 2019 copy Fresenius SE amp Co KGaA Investor Relations
eurom Q319 Q318 growthrate
growthrate (cc)
Net income reported 333 285 17 12
Gain related to divestitures of Care Coordination activities -20 -17
Divestitures of Care Coordination activities - 0
IFRS 16 effect 16 -
NxStage operations 15 -
Transaction costs NxStage 1 -
Expenses associated with the cost optimization program 18 -
Impact of FCPA related charge - 75Net income adjusted 363 343 6 2
57
Reconciliation according to Fresenius Medical Care
General Credit Presentation November 2019 copy Fresenius SE amp Co KGaA Investor Relations
eurom Q1-319 Q1-318 growthrate
growthrate (cc)
Sales reported 12897 12247 5 1Divestitures of Care Coordination activities - -516
IFRS 16 effect 75 -
NxStage operations -188 -
Sales adjusted 12784 11731 9 5
EBIT reported 1653 2425 -32 -35Gain related to divestitures of Care Coordination activities -14 -830
Divestitures of Care Coordination activities - -14
IFRS 16 effect -68 -
NxStage operations 16 -
Transaction costs NxStage 22 -
Expenses associated with the cost optimization program 32 -
Impact of FCPA related charge - 75
EBIT adjusted 1641 1656 -1 -5
58
Reconciliation according to Fresenius Medical Care
General Credit Presentation November 2019 copy Fresenius SE amp Co KGaA Investor Relations
eurom Q1-319 Q1-318 growthrate
growthrate (cc)
Net income reported 857 1557 -45 -47Gain related to divestitures of Care Coordination activities -29 -690
Divestitures of Care Coordination activities - 4
IFRS 16 effect 45 -
NxStage operations 49 -
Transaction costs NxStage 16 -
Expenses associated with the cost optimization program 23 -
Impact of FCPA related charge - 75
Net income adjusted 961 946 2 -3
59
Reconciliation Fresenius Medical Care according to Fresenius Group
General Credit Presentation November 2019 copy Fresenius SE amp Co KGaA Investor Relations
eurom Q319 Q318 growthrate
growthrate (cc)
Sales reported 4419 4058 9 6Divestitures of Care Coordination activities - -7
IFRS 16 effect 35 -
Sales on a comparable basis 4454 4051 10 7
EBIT reported (after special items) 595 527 13 9Gain related to divestitures of Care Coordination activities -3 -10
Transaction costs NxStage 2 -
Expenses associated with the cost optimization program 25 -
Impact of FCPA related charge - 75
EBIT (before special items) 619 592 5 1Divestitures of Care Coordination activities - 0
IFRS 16 effect -20 -
EBIT on a comparable basis 599 592 1 -3
60
Reconciliation Fresenius Medical Care according to Fresenius Group
General Credit Presentation November 2019 copy Fresenius SE amp Co KGaA Investor Relations
eurom Q319 Q318 growthrate
growthrate (cc)
Net income reported (after special items) 332 284 17 12Gain related to divestitures of Care Coordination activities -20 -16
Transaction costs NxStage 1 -
Expenses associated with the cost optimization program 18 -
Impact of FCPA related charge - 75
Net income (before special items) 331 343 -3 -7Divestitures of Care Coordination activities - -1
IFRS 16 effect 17 -
Net income on a comparable basis 348 342 2 -2
61
Reconciliation Fresenius Medical Care according to Fresenius Group
General Credit Presentation November 2019 copy Fresenius SE amp Co KGaA Investor Relations
eurom Q1-319 Q1-318 growthrate
growthrate (cc)
Sales reported 12897 12247 5 1Divestitures of Care Coordination activities - -516
IFRS 16 effect 75 -
Sales on a comparable basis 12972 11731 11 7
EBIT reported (after special items) 1653 2425 -32 -35Gain related to divestitures of Care Coordination activities -14 -830
Transaction costs NxStage 22 -
Expenses associated with the cost optimization program 32 -
Impact of FCPA related charge - 75
EBIT (before special items) 1693 1670 1 -3Divestitures of Care Coordination activities - -14
IFRS 16 effect -68 -
EBIT on a comparable basis 1625 1656 -2 -6
62
Reconciliation Fresenius Medical Care according to Fresenius Group
General Credit Presentation November 2019 copy Fresenius SE amp Co KGaA Investor Relations
eurom Q1-319 Q1-318 growthrate
growthrate (cc)
Net income reported (after special items) 857 1557 -45 -47Gain related to divestitures of Care Coordination activities -29 -690
Transaction costs NxStage 16 -
Expenses associated with the cost optimization program 23 -
Impact of FCPA related charge - 75
Net income (before special items) 867 942 -8 -12Divestitures of Care Coordination activities - 4
IFRS 16 effect 45 -
Net income on a comparable basis 912 946 -4 -8
63
Reconciliation Fresenius Kabi
General Credit Presentation November 2019 copy Fresenius SE amp Co KGaA Investor Relations
eurom Q319 Q318 growthrate
growthrate (cc)
Sales reported 1761 1650 7 5
Transaction costs Akorn 0 6
Revaluations of biosimilars contingent liabilities 0 -
EBIT (before special items) 307 297 3 1IFRS 16 effect -1 -
EBIT on a comparable basis 306 297 3 1
Transaction costs Akorn 0 5
Revaluations of biosimilars contingent liabilities 1 -
Net income (before special items) 203 199 2 -1IFRS 16 effect 1 -
Net income on a comparable basis 204 199 3 0
64
Reconciliation Fresenius Kabi
General Credit Presentation November 2019 copy Fresenius SE amp Co KGaA Investor Relations
eurom Q1-319 Q1-318 growthrate
growthrate (cc)
Sales reported 5153 4857 6 5
Transaction costs Akorn 3 45
Revaluations of biosimilars contingent liabilities -4 -
EBIT (before special items) 920 854 8 4IFRS 16 effect -3 -
EBIT on a comparable basis 917 854 7 4
Transaction costs Akorn 3 36
Revaluations of biosimilars contingent liabilities -1 -
Net income (before special items) 614 554 11 7IFRS 16 effect 4 -
Net income on a comparable basis 618 554 12 8
65
Reconciliation Fresenius Helios
General Credit Presentation November 2019 copy Fresenius SE amp Co KGaA Investor Relations
eurom Q319 Q318 growthrate
Sales reported 2230 2088 7German post-acute care business transferred from Fresenius Helios to Fresenius Vamed - 0
Sales adjusted for German post-acute care business 2230 2088 7
EBIT reported 187 204 -8IFRS 16 effect -4 -
EBIT adjusted for IFRS 16 effect 183 204 -10German post-acute care business transferred from Fresenius Helios to Fresenius Vamed - 0EBIT adjusted for IFRS 16 effect and German post-acute care business 183 204 -10
66
Reconciliation Fresenius Helios
General Credit Presentation November 2019 copy Fresenius SE amp Co KGaA Investor Relations
eurom Q1-319 Q1-318 growthrate
Sales reported 6890 6762 2German post-acute care business transferred from Fresenius Helios to Fresenius Vamed - -226
Sales adjusted for German post-acute care business 6890 6536 5
EBIT reported 731 775 -6IFRS 16 effect -8 -
EBIT adjusted for IFRS 16 effect 723 775 -7German post-acute care business transferred from Fresenius Helios to Fresenius Vamed - -10EBIT adjusted for IFRS 16 effect and German post-acute care business 723 765 -5
67
Reconciliation Fresenius Vamed
General Credit Presentation November 2019 copy Fresenius SE amp Co KGaA Investor Relations
eurom Q319 Q318 growthrate
Sales reported 562 476 18German post-acute care business acquired from Fresenius Helios -121 -117
Sales adjusted for German post-acute care business 441 359 23
EBIT reported 33 31 6IFRS 16 effect 1 -
EBIT adjusted for IFRS 16 effect 34 31 10German post-acute care business acquired from Fresenius Helios -15 -15EBIT adjusted for IFRS 16 effect and German post-acute care business 19 16 19
68
Reconciliation Fresenius Vamed
General Credit Presentation November 2019 copy Fresenius SE amp Co KGaA Investor Relations
eurom Q1-319 Q1-318 growthrate
Sales reported 1469 991 48German post-acute care business acquired from Fresenius Helios -350 -117
Sales adjusted for German post-acute care business 1119 874 28
EBIT reported 67 49 37IFRS 16 effect -2 -
EBIT adjusted for IFRS 16 effect 65 49 33German post-acute care business acquired from Fresenius Helios -31 -15EBIT adjusted for IFRS 16 effect and German post-acute care business 34 34 0
69
Financial Calendar Contact
Financial Calendar 20 February 2020 Results FY19
06 May 2020 Results Q120
20 May 2020 Annual General Meeting
30 July 2020 Results Q220
29 October 2020 Results Q320
Please note that these dates could be subject to change
Contact
Investor RelationsFresenius SE amp Co KGaAphone +49 6172 608-2485e-mail ir-frefreseniuscomFor further information and current news wwwfreseniuscom
Follow us on Twitter wwwtwittercomfresenius_irand LinkedIn wwwlinkedincomcompanyfresenius-investor-relations
General Credit Presentation November 2019 copy Fresenius SE amp Co KGaA Investor Relations 70
- Presentation to Credit Investors
- Safe Harbor Statement
- Foliennummer 3
- Strong and Balanced Health Care Portfolio
- Fresenius Group Global Sales Base in Growing Non-Cyclical Markets
- Fresenius Group Strong Track Record of Organic Sales Growth in All Business Segments
- Fresenius Group Strong Track Record of EBITDA Generation
- Fresenius SE Earnings-Linked Dividend Policy
- Global Health Care Trends ndash Strong Growth Fundamentals
- Fresenius Medical Care Global Dialysis Market Leader
- Fresenius Medical Care Sales and EBIT development
- Fresenius Kabi A Leading Global Hospital Supplier
- Fresenius Kabi Sales and EBIT development
- Fresenius Helios Europersquos Largest Private Hospital OperatorHelios Germany
- Fresenius Helios Europersquos Largest Private Hospital Operator Helios Spain
- Fresenius Helios Sales and EBIT development
- Fresenius Vamed Leading Global Hospital Projects and Services Specialist
- Fresenius Vamed Sales an EBIT development
- Fresenius Group Key Figures
- Cash Flow Development by Business Segment
- Fresenius Group Consistent Cash Generation
- Fresenius Group Proven Track Record of Deleveraging
- Fresenius Group Capitalization ndash September 30 2019 excl IFRS 16
- Fresenius Group Capitalization ndash September 30 2019 incl IFRS 16
- Fresenius Group Broad Mix of Financing Instruments
- Foliennummer 26
- Fresenius Group excl Fresenius Medical CareDebt Maturity Profile ndash September 30 201912
- Fresenius Group Solid Balance Sheet Structure
- Fresenius Group Strong Access to Capital Markets
- Fresenius SE Rating History amp Rationale
- Fresenius Group 2019 Financial Outlook by Business Segment
- Fresenius Group 2019 Financial Guidance
- Fresenius Group Healthy Growth Targets 2020 ndash 2023 (CAGRs)
- FY18 base for Fresenius Group Guidance FY19
- FY18 base for Fresenius Medical Care Outlook FY19
- FY18 base for Fresenius Kabi Outlook FY19
- IFRS 16 effect on Group PampL
- IFRS 16 effect on Group Balance Sheet and Cash Flow
- Fresenius Group Credit Highlights
- Attachments
- Fresenius Group Key Figures
- Foliennummer 42
- Foliennummer 43
- Fresenius Group Cash Flow
- Fresenius Group Financial Results by Business Segment
- Fresenius Group Margins by Business Segment
- Fresenius SE amp Co KGaA Overview Bonds
- Fresenius Group Reconciliation
- Fresenius Group Reconciliation
- Fresenius Group Reconciliation
- Fresenius Group Reconciliation
- Fresenius Group Reconciliation
- Fresenius Group Reconciliation
- Fresenius Group Reconciliation
- Fresenius Group Reconciliation
- Reconciliation according to Fresenius Medical Care
- Reconciliation according to Fresenius Medical Care
- Reconciliation according to Fresenius Medical Care
- Reconciliation according to Fresenius Medical Care
- Reconciliation Fresenius Medical Care according to Fresenius Group
- Reconciliation Fresenius Medical Care according to Fresenius Group
- Reconciliation Fresenius Medical Care according to Fresenius Group
- Reconciliation Fresenius Medical Care according to Fresenius Group
- Reconciliation Fresenius Kabi
- Reconciliation Fresenius Kabi
- Reconciliation Fresenius Helios
- Reconciliation Fresenius Helios
- Reconciliation Fresenius Vamed
- Reconciliation Fresenius Vamed
- Financial Calendar Contact
-

Reconciliation according to Fresenius Medical Care
General Credit Presentation November 2019 copy Fresenius SE amp Co KGaA Investor Relations
eurom Q319 Q318 growthrate
growthrate (cc)
Sales reported 4419 4058 9 6Divestitures of Care Coordination activities - -7
IFRS 16 effect 35 -
NxStage operations -79 -
Sales adjusted 4375 4051 8 5
EBIT reported 595 527 13 9
Gain related to divestitures of Care Coordination activities -2 -10
Divestitures of Care Coordination activities - 0
IFRS 16 effect -21 -
NxStage operations 0 -
Transaction costs NxStage 2 -
Expenses associated with the cost optimization program 25 -
Impact of FCPA related charge - 75EBIT adjusted 599 592 1 -3
56
Reconciliation according to Fresenius Medical Care
General Credit Presentation November 2019 copy Fresenius SE amp Co KGaA Investor Relations
eurom Q319 Q318 growthrate
growthrate (cc)
Net income reported 333 285 17 12
Gain related to divestitures of Care Coordination activities -20 -17
Divestitures of Care Coordination activities - 0
IFRS 16 effect 16 -
NxStage operations 15 -
Transaction costs NxStage 1 -
Expenses associated with the cost optimization program 18 -
Impact of FCPA related charge - 75Net income adjusted 363 343 6 2
57
Reconciliation according to Fresenius Medical Care
General Credit Presentation November 2019 copy Fresenius SE amp Co KGaA Investor Relations
eurom Q1-319 Q1-318 growthrate
growthrate (cc)
Sales reported 12897 12247 5 1Divestitures of Care Coordination activities - -516
IFRS 16 effect 75 -
NxStage operations -188 -
Sales adjusted 12784 11731 9 5
EBIT reported 1653 2425 -32 -35Gain related to divestitures of Care Coordination activities -14 -830
Divestitures of Care Coordination activities - -14
IFRS 16 effect -68 -
NxStage operations 16 -
Transaction costs NxStage 22 -
Expenses associated with the cost optimization program 32 -
Impact of FCPA related charge - 75
EBIT adjusted 1641 1656 -1 -5
58
Reconciliation according to Fresenius Medical Care
General Credit Presentation November 2019 copy Fresenius SE amp Co KGaA Investor Relations
eurom Q1-319 Q1-318 growthrate
growthrate (cc)
Net income reported 857 1557 -45 -47Gain related to divestitures of Care Coordination activities -29 -690
Divestitures of Care Coordination activities - 4
IFRS 16 effect 45 -
NxStage operations 49 -
Transaction costs NxStage 16 -
Expenses associated with the cost optimization program 23 -
Impact of FCPA related charge - 75
Net income adjusted 961 946 2 -3
59
Reconciliation Fresenius Medical Care according to Fresenius Group
General Credit Presentation November 2019 copy Fresenius SE amp Co KGaA Investor Relations
eurom Q319 Q318 growthrate
growthrate (cc)
Sales reported 4419 4058 9 6Divestitures of Care Coordination activities - -7
IFRS 16 effect 35 -
Sales on a comparable basis 4454 4051 10 7
EBIT reported (after special items) 595 527 13 9Gain related to divestitures of Care Coordination activities -3 -10
Transaction costs NxStage 2 -
Expenses associated with the cost optimization program 25 -
Impact of FCPA related charge - 75
EBIT (before special items) 619 592 5 1Divestitures of Care Coordination activities - 0
IFRS 16 effect -20 -
EBIT on a comparable basis 599 592 1 -3
60
Reconciliation Fresenius Medical Care according to Fresenius Group
General Credit Presentation November 2019 copy Fresenius SE amp Co KGaA Investor Relations
eurom Q319 Q318 growthrate
growthrate (cc)
Net income reported (after special items) 332 284 17 12Gain related to divestitures of Care Coordination activities -20 -16
Transaction costs NxStage 1 -
Expenses associated with the cost optimization program 18 -
Impact of FCPA related charge - 75
Net income (before special items) 331 343 -3 -7Divestitures of Care Coordination activities - -1
IFRS 16 effect 17 -
Net income on a comparable basis 348 342 2 -2
61
Reconciliation Fresenius Medical Care according to Fresenius Group
General Credit Presentation November 2019 copy Fresenius SE amp Co KGaA Investor Relations
eurom Q1-319 Q1-318 growthrate
growthrate (cc)
Sales reported 12897 12247 5 1Divestitures of Care Coordination activities - -516
IFRS 16 effect 75 -
Sales on a comparable basis 12972 11731 11 7
EBIT reported (after special items) 1653 2425 -32 -35Gain related to divestitures of Care Coordination activities -14 -830
Transaction costs NxStage 22 -
Expenses associated with the cost optimization program 32 -
Impact of FCPA related charge - 75
EBIT (before special items) 1693 1670 1 -3Divestitures of Care Coordination activities - -14
IFRS 16 effect -68 -
EBIT on a comparable basis 1625 1656 -2 -6
62
Reconciliation Fresenius Medical Care according to Fresenius Group
General Credit Presentation November 2019 copy Fresenius SE amp Co KGaA Investor Relations
eurom Q1-319 Q1-318 growthrate
growthrate (cc)
Net income reported (after special items) 857 1557 -45 -47Gain related to divestitures of Care Coordination activities -29 -690
Transaction costs NxStage 16 -
Expenses associated with the cost optimization program 23 -
Impact of FCPA related charge - 75
Net income (before special items) 867 942 -8 -12Divestitures of Care Coordination activities - 4
IFRS 16 effect 45 -
Net income on a comparable basis 912 946 -4 -8
63
Reconciliation Fresenius Kabi
General Credit Presentation November 2019 copy Fresenius SE amp Co KGaA Investor Relations
eurom Q319 Q318 growthrate
growthrate (cc)
Sales reported 1761 1650 7 5
Transaction costs Akorn 0 6
Revaluations of biosimilars contingent liabilities 0 -
EBIT (before special items) 307 297 3 1IFRS 16 effect -1 -
EBIT on a comparable basis 306 297 3 1
Transaction costs Akorn 0 5
Revaluations of biosimilars contingent liabilities 1 -
Net income (before special items) 203 199 2 -1IFRS 16 effect 1 -
Net income on a comparable basis 204 199 3 0
64
Reconciliation Fresenius Kabi
General Credit Presentation November 2019 copy Fresenius SE amp Co KGaA Investor Relations
eurom Q1-319 Q1-318 growthrate
growthrate (cc)
Sales reported 5153 4857 6 5
Transaction costs Akorn 3 45
Revaluations of biosimilars contingent liabilities -4 -
EBIT (before special items) 920 854 8 4IFRS 16 effect -3 -
EBIT on a comparable basis 917 854 7 4
Transaction costs Akorn 3 36
Revaluations of biosimilars contingent liabilities -1 -
Net income (before special items) 614 554 11 7IFRS 16 effect 4 -
Net income on a comparable basis 618 554 12 8
65
Reconciliation Fresenius Helios
General Credit Presentation November 2019 copy Fresenius SE amp Co KGaA Investor Relations
eurom Q319 Q318 growthrate
Sales reported 2230 2088 7German post-acute care business transferred from Fresenius Helios to Fresenius Vamed - 0
Sales adjusted for German post-acute care business 2230 2088 7
EBIT reported 187 204 -8IFRS 16 effect -4 -
EBIT adjusted for IFRS 16 effect 183 204 -10German post-acute care business transferred from Fresenius Helios to Fresenius Vamed - 0EBIT adjusted for IFRS 16 effect and German post-acute care business 183 204 -10
66
Reconciliation Fresenius Helios
General Credit Presentation November 2019 copy Fresenius SE amp Co KGaA Investor Relations
eurom Q1-319 Q1-318 growthrate
Sales reported 6890 6762 2German post-acute care business transferred from Fresenius Helios to Fresenius Vamed - -226
Sales adjusted for German post-acute care business 6890 6536 5
EBIT reported 731 775 -6IFRS 16 effect -8 -
EBIT adjusted for IFRS 16 effect 723 775 -7German post-acute care business transferred from Fresenius Helios to Fresenius Vamed - -10EBIT adjusted for IFRS 16 effect and German post-acute care business 723 765 -5
67
Reconciliation Fresenius Vamed
General Credit Presentation November 2019 copy Fresenius SE amp Co KGaA Investor Relations
eurom Q319 Q318 growthrate
Sales reported 562 476 18German post-acute care business acquired from Fresenius Helios -121 -117
Sales adjusted for German post-acute care business 441 359 23
EBIT reported 33 31 6IFRS 16 effect 1 -
EBIT adjusted for IFRS 16 effect 34 31 10German post-acute care business acquired from Fresenius Helios -15 -15EBIT adjusted for IFRS 16 effect and German post-acute care business 19 16 19
68
Reconciliation Fresenius Vamed
General Credit Presentation November 2019 copy Fresenius SE amp Co KGaA Investor Relations
eurom Q1-319 Q1-318 growthrate
Sales reported 1469 991 48German post-acute care business acquired from Fresenius Helios -350 -117
Sales adjusted for German post-acute care business 1119 874 28
EBIT reported 67 49 37IFRS 16 effect -2 -
EBIT adjusted for IFRS 16 effect 65 49 33German post-acute care business acquired from Fresenius Helios -31 -15EBIT adjusted for IFRS 16 effect and German post-acute care business 34 34 0
69
Financial Calendar Contact
Financial Calendar 20 February 2020 Results FY19
06 May 2020 Results Q120
20 May 2020 Annual General Meeting
30 July 2020 Results Q220
29 October 2020 Results Q320
Please note that these dates could be subject to change
Contact
Investor RelationsFresenius SE amp Co KGaAphone +49 6172 608-2485e-mail ir-frefreseniuscomFor further information and current news wwwfreseniuscom
Follow us on Twitter wwwtwittercomfresenius_irand LinkedIn wwwlinkedincomcompanyfresenius-investor-relations
General Credit Presentation November 2019 copy Fresenius SE amp Co KGaA Investor Relations 70
- Presentation to Credit Investors
- Safe Harbor Statement
- Foliennummer 3
- Strong and Balanced Health Care Portfolio
- Fresenius Group Global Sales Base in Growing Non-Cyclical Markets
- Fresenius Group Strong Track Record of Organic Sales Growth in All Business Segments
- Fresenius Group Strong Track Record of EBITDA Generation
- Fresenius SE Earnings-Linked Dividend Policy
- Global Health Care Trends ndash Strong Growth Fundamentals
- Fresenius Medical Care Global Dialysis Market Leader
- Fresenius Medical Care Sales and EBIT development
- Fresenius Kabi A Leading Global Hospital Supplier
- Fresenius Kabi Sales and EBIT development
- Fresenius Helios Europersquos Largest Private Hospital OperatorHelios Germany
- Fresenius Helios Europersquos Largest Private Hospital Operator Helios Spain
- Fresenius Helios Sales and EBIT development
- Fresenius Vamed Leading Global Hospital Projects and Services Specialist
- Fresenius Vamed Sales an EBIT development
- Fresenius Group Key Figures
- Cash Flow Development by Business Segment
- Fresenius Group Consistent Cash Generation
- Fresenius Group Proven Track Record of Deleveraging
- Fresenius Group Capitalization ndash September 30 2019 excl IFRS 16
- Fresenius Group Capitalization ndash September 30 2019 incl IFRS 16
- Fresenius Group Broad Mix of Financing Instruments
- Foliennummer 26
- Fresenius Group excl Fresenius Medical CareDebt Maturity Profile ndash September 30 201912
- Fresenius Group Solid Balance Sheet Structure
- Fresenius Group Strong Access to Capital Markets
- Fresenius SE Rating History amp Rationale
- Fresenius Group 2019 Financial Outlook by Business Segment
- Fresenius Group 2019 Financial Guidance
- Fresenius Group Healthy Growth Targets 2020 ndash 2023 (CAGRs)
- FY18 base for Fresenius Group Guidance FY19
- FY18 base for Fresenius Medical Care Outlook FY19
- FY18 base for Fresenius Kabi Outlook FY19
- IFRS 16 effect on Group PampL
- IFRS 16 effect on Group Balance Sheet and Cash Flow
- Fresenius Group Credit Highlights
- Attachments
- Fresenius Group Key Figures
- Foliennummer 42
- Foliennummer 43
- Fresenius Group Cash Flow
- Fresenius Group Financial Results by Business Segment
- Fresenius Group Margins by Business Segment
- Fresenius SE amp Co KGaA Overview Bonds
- Fresenius Group Reconciliation
- Fresenius Group Reconciliation
- Fresenius Group Reconciliation
- Fresenius Group Reconciliation
- Fresenius Group Reconciliation
- Fresenius Group Reconciliation
- Fresenius Group Reconciliation
- Fresenius Group Reconciliation
- Reconciliation according to Fresenius Medical Care
- Reconciliation according to Fresenius Medical Care
- Reconciliation according to Fresenius Medical Care
- Reconciliation according to Fresenius Medical Care
- Reconciliation Fresenius Medical Care according to Fresenius Group
- Reconciliation Fresenius Medical Care according to Fresenius Group
- Reconciliation Fresenius Medical Care according to Fresenius Group
- Reconciliation Fresenius Medical Care according to Fresenius Group
- Reconciliation Fresenius Kabi
- Reconciliation Fresenius Kabi
- Reconciliation Fresenius Helios
- Reconciliation Fresenius Helios
- Reconciliation Fresenius Vamed
- Reconciliation Fresenius Vamed
- Financial Calendar Contact
-

Reconciliation according to Fresenius Medical Care
General Credit Presentation November 2019 copy Fresenius SE amp Co KGaA Investor Relations
eurom Q319 Q318 growthrate
growthrate (cc)
Net income reported 333 285 17 12
Gain related to divestitures of Care Coordination activities -20 -17
Divestitures of Care Coordination activities - 0
IFRS 16 effect 16 -
NxStage operations 15 -
Transaction costs NxStage 1 -
Expenses associated with the cost optimization program 18 -
Impact of FCPA related charge - 75Net income adjusted 363 343 6 2
57
Reconciliation according to Fresenius Medical Care
General Credit Presentation November 2019 copy Fresenius SE amp Co KGaA Investor Relations
eurom Q1-319 Q1-318 growthrate
growthrate (cc)
Sales reported 12897 12247 5 1Divestitures of Care Coordination activities - -516
IFRS 16 effect 75 -
NxStage operations -188 -
Sales adjusted 12784 11731 9 5
EBIT reported 1653 2425 -32 -35Gain related to divestitures of Care Coordination activities -14 -830
Divestitures of Care Coordination activities - -14
IFRS 16 effect -68 -
NxStage operations 16 -
Transaction costs NxStage 22 -
Expenses associated with the cost optimization program 32 -
Impact of FCPA related charge - 75
EBIT adjusted 1641 1656 -1 -5
58
Reconciliation according to Fresenius Medical Care
General Credit Presentation November 2019 copy Fresenius SE amp Co KGaA Investor Relations
eurom Q1-319 Q1-318 growthrate
growthrate (cc)
Net income reported 857 1557 -45 -47Gain related to divestitures of Care Coordination activities -29 -690
Divestitures of Care Coordination activities - 4
IFRS 16 effect 45 -
NxStage operations 49 -
Transaction costs NxStage 16 -
Expenses associated with the cost optimization program 23 -
Impact of FCPA related charge - 75
Net income adjusted 961 946 2 -3
59
Reconciliation Fresenius Medical Care according to Fresenius Group
General Credit Presentation November 2019 copy Fresenius SE amp Co KGaA Investor Relations
eurom Q319 Q318 growthrate
growthrate (cc)
Sales reported 4419 4058 9 6Divestitures of Care Coordination activities - -7
IFRS 16 effect 35 -
Sales on a comparable basis 4454 4051 10 7
EBIT reported (after special items) 595 527 13 9Gain related to divestitures of Care Coordination activities -3 -10
Transaction costs NxStage 2 -
Expenses associated with the cost optimization program 25 -
Impact of FCPA related charge - 75
EBIT (before special items) 619 592 5 1Divestitures of Care Coordination activities - 0
IFRS 16 effect -20 -
EBIT on a comparable basis 599 592 1 -3
60
Reconciliation Fresenius Medical Care according to Fresenius Group
General Credit Presentation November 2019 copy Fresenius SE amp Co KGaA Investor Relations
eurom Q319 Q318 growthrate
growthrate (cc)
Net income reported (after special items) 332 284 17 12Gain related to divestitures of Care Coordination activities -20 -16
Transaction costs NxStage 1 -
Expenses associated with the cost optimization program 18 -
Impact of FCPA related charge - 75
Net income (before special items) 331 343 -3 -7Divestitures of Care Coordination activities - -1
IFRS 16 effect 17 -
Net income on a comparable basis 348 342 2 -2
61
Reconciliation Fresenius Medical Care according to Fresenius Group
General Credit Presentation November 2019 copy Fresenius SE amp Co KGaA Investor Relations
eurom Q1-319 Q1-318 growthrate
growthrate (cc)
Sales reported 12897 12247 5 1Divestitures of Care Coordination activities - -516
IFRS 16 effect 75 -
Sales on a comparable basis 12972 11731 11 7
EBIT reported (after special items) 1653 2425 -32 -35Gain related to divestitures of Care Coordination activities -14 -830
Transaction costs NxStage 22 -
Expenses associated with the cost optimization program 32 -
Impact of FCPA related charge - 75
EBIT (before special items) 1693 1670 1 -3Divestitures of Care Coordination activities - -14
IFRS 16 effect -68 -
EBIT on a comparable basis 1625 1656 -2 -6
62
Reconciliation Fresenius Medical Care according to Fresenius Group
General Credit Presentation November 2019 copy Fresenius SE amp Co KGaA Investor Relations
eurom Q1-319 Q1-318 growthrate
growthrate (cc)
Net income reported (after special items) 857 1557 -45 -47Gain related to divestitures of Care Coordination activities -29 -690
Transaction costs NxStage 16 -
Expenses associated with the cost optimization program 23 -
Impact of FCPA related charge - 75
Net income (before special items) 867 942 -8 -12Divestitures of Care Coordination activities - 4
IFRS 16 effect 45 -
Net income on a comparable basis 912 946 -4 -8
63
Reconciliation Fresenius Kabi
General Credit Presentation November 2019 copy Fresenius SE amp Co KGaA Investor Relations
eurom Q319 Q318 growthrate
growthrate (cc)
Sales reported 1761 1650 7 5
Transaction costs Akorn 0 6
Revaluations of biosimilars contingent liabilities 0 -
EBIT (before special items) 307 297 3 1IFRS 16 effect -1 -
EBIT on a comparable basis 306 297 3 1
Transaction costs Akorn 0 5
Revaluations of biosimilars contingent liabilities 1 -
Net income (before special items) 203 199 2 -1IFRS 16 effect 1 -
Net income on a comparable basis 204 199 3 0
64
Reconciliation Fresenius Kabi
General Credit Presentation November 2019 copy Fresenius SE amp Co KGaA Investor Relations
eurom Q1-319 Q1-318 growthrate
growthrate (cc)
Sales reported 5153 4857 6 5
Transaction costs Akorn 3 45
Revaluations of biosimilars contingent liabilities -4 -
EBIT (before special items) 920 854 8 4IFRS 16 effect -3 -
EBIT on a comparable basis 917 854 7 4
Transaction costs Akorn 3 36
Revaluations of biosimilars contingent liabilities -1 -
Net income (before special items) 614 554 11 7IFRS 16 effect 4 -
Net income on a comparable basis 618 554 12 8
65
Reconciliation Fresenius Helios
General Credit Presentation November 2019 copy Fresenius SE amp Co KGaA Investor Relations
eurom Q319 Q318 growthrate
Sales reported 2230 2088 7German post-acute care business transferred from Fresenius Helios to Fresenius Vamed - 0
Sales adjusted for German post-acute care business 2230 2088 7
EBIT reported 187 204 -8IFRS 16 effect -4 -
EBIT adjusted for IFRS 16 effect 183 204 -10German post-acute care business transferred from Fresenius Helios to Fresenius Vamed - 0EBIT adjusted for IFRS 16 effect and German post-acute care business 183 204 -10
66
Reconciliation Fresenius Helios
General Credit Presentation November 2019 copy Fresenius SE amp Co KGaA Investor Relations
eurom Q1-319 Q1-318 growthrate
Sales reported 6890 6762 2German post-acute care business transferred from Fresenius Helios to Fresenius Vamed - -226
Sales adjusted for German post-acute care business 6890 6536 5
EBIT reported 731 775 -6IFRS 16 effect -8 -
EBIT adjusted for IFRS 16 effect 723 775 -7German post-acute care business transferred from Fresenius Helios to Fresenius Vamed - -10EBIT adjusted for IFRS 16 effect and German post-acute care business 723 765 -5
67
Reconciliation Fresenius Vamed
General Credit Presentation November 2019 copy Fresenius SE amp Co KGaA Investor Relations
eurom Q319 Q318 growthrate
Sales reported 562 476 18German post-acute care business acquired from Fresenius Helios -121 -117
Sales adjusted for German post-acute care business 441 359 23
EBIT reported 33 31 6IFRS 16 effect 1 -
EBIT adjusted for IFRS 16 effect 34 31 10German post-acute care business acquired from Fresenius Helios -15 -15EBIT adjusted for IFRS 16 effect and German post-acute care business 19 16 19
68
Reconciliation Fresenius Vamed
General Credit Presentation November 2019 copy Fresenius SE amp Co KGaA Investor Relations
eurom Q1-319 Q1-318 growthrate
Sales reported 1469 991 48German post-acute care business acquired from Fresenius Helios -350 -117
Sales adjusted for German post-acute care business 1119 874 28
EBIT reported 67 49 37IFRS 16 effect -2 -
EBIT adjusted for IFRS 16 effect 65 49 33German post-acute care business acquired from Fresenius Helios -31 -15EBIT adjusted for IFRS 16 effect and German post-acute care business 34 34 0
69
Financial Calendar Contact
Financial Calendar 20 February 2020 Results FY19
06 May 2020 Results Q120
20 May 2020 Annual General Meeting
30 July 2020 Results Q220
29 October 2020 Results Q320
Please note that these dates could be subject to change
Contact
Investor RelationsFresenius SE amp Co KGaAphone +49 6172 608-2485e-mail ir-frefreseniuscomFor further information and current news wwwfreseniuscom
Follow us on Twitter wwwtwittercomfresenius_irand LinkedIn wwwlinkedincomcompanyfresenius-investor-relations
General Credit Presentation November 2019 copy Fresenius SE amp Co KGaA Investor Relations 70
- Presentation to Credit Investors
- Safe Harbor Statement
- Foliennummer 3
- Strong and Balanced Health Care Portfolio
- Fresenius Group Global Sales Base in Growing Non-Cyclical Markets
- Fresenius Group Strong Track Record of Organic Sales Growth in All Business Segments
- Fresenius Group Strong Track Record of EBITDA Generation
- Fresenius SE Earnings-Linked Dividend Policy
- Global Health Care Trends ndash Strong Growth Fundamentals
- Fresenius Medical Care Global Dialysis Market Leader
- Fresenius Medical Care Sales and EBIT development
- Fresenius Kabi A Leading Global Hospital Supplier
- Fresenius Kabi Sales and EBIT development
- Fresenius Helios Europersquos Largest Private Hospital OperatorHelios Germany
- Fresenius Helios Europersquos Largest Private Hospital Operator Helios Spain
- Fresenius Helios Sales and EBIT development
- Fresenius Vamed Leading Global Hospital Projects and Services Specialist
- Fresenius Vamed Sales an EBIT development
- Fresenius Group Key Figures
- Cash Flow Development by Business Segment
- Fresenius Group Consistent Cash Generation
- Fresenius Group Proven Track Record of Deleveraging
- Fresenius Group Capitalization ndash September 30 2019 excl IFRS 16
- Fresenius Group Capitalization ndash September 30 2019 incl IFRS 16
- Fresenius Group Broad Mix of Financing Instruments
- Foliennummer 26
- Fresenius Group excl Fresenius Medical CareDebt Maturity Profile ndash September 30 201912
- Fresenius Group Solid Balance Sheet Structure
- Fresenius Group Strong Access to Capital Markets
- Fresenius SE Rating History amp Rationale
- Fresenius Group 2019 Financial Outlook by Business Segment
- Fresenius Group 2019 Financial Guidance
- Fresenius Group Healthy Growth Targets 2020 ndash 2023 (CAGRs)
- FY18 base for Fresenius Group Guidance FY19
- FY18 base for Fresenius Medical Care Outlook FY19
- FY18 base for Fresenius Kabi Outlook FY19
- IFRS 16 effect on Group PampL
- IFRS 16 effect on Group Balance Sheet and Cash Flow
- Fresenius Group Credit Highlights
- Attachments
- Fresenius Group Key Figures
- Foliennummer 42
- Foliennummer 43
- Fresenius Group Cash Flow
- Fresenius Group Financial Results by Business Segment
- Fresenius Group Margins by Business Segment
- Fresenius SE amp Co KGaA Overview Bonds
- Fresenius Group Reconciliation
- Fresenius Group Reconciliation
- Fresenius Group Reconciliation
- Fresenius Group Reconciliation
- Fresenius Group Reconciliation
- Fresenius Group Reconciliation
- Fresenius Group Reconciliation
- Fresenius Group Reconciliation
- Reconciliation according to Fresenius Medical Care
- Reconciliation according to Fresenius Medical Care
- Reconciliation according to Fresenius Medical Care
- Reconciliation according to Fresenius Medical Care
- Reconciliation Fresenius Medical Care according to Fresenius Group
- Reconciliation Fresenius Medical Care according to Fresenius Group
- Reconciliation Fresenius Medical Care according to Fresenius Group
- Reconciliation Fresenius Medical Care according to Fresenius Group
- Reconciliation Fresenius Kabi
- Reconciliation Fresenius Kabi
- Reconciliation Fresenius Helios
- Reconciliation Fresenius Helios
- Reconciliation Fresenius Vamed
- Reconciliation Fresenius Vamed
- Financial Calendar Contact
-

Reconciliation according to Fresenius Medical Care
General Credit Presentation November 2019 copy Fresenius SE amp Co KGaA Investor Relations
eurom Q1-319 Q1-318 growthrate
growthrate (cc)
Sales reported 12897 12247 5 1Divestitures of Care Coordination activities - -516
IFRS 16 effect 75 -
NxStage operations -188 -
Sales adjusted 12784 11731 9 5
EBIT reported 1653 2425 -32 -35Gain related to divestitures of Care Coordination activities -14 -830
Divestitures of Care Coordination activities - -14
IFRS 16 effect -68 -
NxStage operations 16 -
Transaction costs NxStage 22 -
Expenses associated with the cost optimization program 32 -
Impact of FCPA related charge - 75
EBIT adjusted 1641 1656 -1 -5
58
Reconciliation according to Fresenius Medical Care
General Credit Presentation November 2019 copy Fresenius SE amp Co KGaA Investor Relations
eurom Q1-319 Q1-318 growthrate
growthrate (cc)
Net income reported 857 1557 -45 -47Gain related to divestitures of Care Coordination activities -29 -690
Divestitures of Care Coordination activities - 4
IFRS 16 effect 45 -
NxStage operations 49 -
Transaction costs NxStage 16 -
Expenses associated with the cost optimization program 23 -
Impact of FCPA related charge - 75
Net income adjusted 961 946 2 -3
59
Reconciliation Fresenius Medical Care according to Fresenius Group
General Credit Presentation November 2019 copy Fresenius SE amp Co KGaA Investor Relations
eurom Q319 Q318 growthrate
growthrate (cc)
Sales reported 4419 4058 9 6Divestitures of Care Coordination activities - -7
IFRS 16 effect 35 -
Sales on a comparable basis 4454 4051 10 7
EBIT reported (after special items) 595 527 13 9Gain related to divestitures of Care Coordination activities -3 -10
Transaction costs NxStage 2 -
Expenses associated with the cost optimization program 25 -
Impact of FCPA related charge - 75
EBIT (before special items) 619 592 5 1Divestitures of Care Coordination activities - 0
IFRS 16 effect -20 -
EBIT on a comparable basis 599 592 1 -3
60
Reconciliation Fresenius Medical Care according to Fresenius Group
General Credit Presentation November 2019 copy Fresenius SE amp Co KGaA Investor Relations
eurom Q319 Q318 growthrate
growthrate (cc)
Net income reported (after special items) 332 284 17 12Gain related to divestitures of Care Coordination activities -20 -16
Transaction costs NxStage 1 -
Expenses associated with the cost optimization program 18 -
Impact of FCPA related charge - 75
Net income (before special items) 331 343 -3 -7Divestitures of Care Coordination activities - -1
IFRS 16 effect 17 -
Net income on a comparable basis 348 342 2 -2
61
Reconciliation Fresenius Medical Care according to Fresenius Group
General Credit Presentation November 2019 copy Fresenius SE amp Co KGaA Investor Relations
eurom Q1-319 Q1-318 growthrate
growthrate (cc)
Sales reported 12897 12247 5 1Divestitures of Care Coordination activities - -516
IFRS 16 effect 75 -
Sales on a comparable basis 12972 11731 11 7
EBIT reported (after special items) 1653 2425 -32 -35Gain related to divestitures of Care Coordination activities -14 -830
Transaction costs NxStage 22 -
Expenses associated with the cost optimization program 32 -
Impact of FCPA related charge - 75
EBIT (before special items) 1693 1670 1 -3Divestitures of Care Coordination activities - -14
IFRS 16 effect -68 -
EBIT on a comparable basis 1625 1656 -2 -6
62
Reconciliation Fresenius Medical Care according to Fresenius Group
General Credit Presentation November 2019 copy Fresenius SE amp Co KGaA Investor Relations
eurom Q1-319 Q1-318 growthrate
growthrate (cc)
Net income reported (after special items) 857 1557 -45 -47Gain related to divestitures of Care Coordination activities -29 -690
Transaction costs NxStage 16 -
Expenses associated with the cost optimization program 23 -
Impact of FCPA related charge - 75
Net income (before special items) 867 942 -8 -12Divestitures of Care Coordination activities - 4
IFRS 16 effect 45 -
Net income on a comparable basis 912 946 -4 -8
63
Reconciliation Fresenius Kabi
General Credit Presentation November 2019 copy Fresenius SE amp Co KGaA Investor Relations
eurom Q319 Q318 growthrate
growthrate (cc)
Sales reported 1761 1650 7 5
Transaction costs Akorn 0 6
Revaluations of biosimilars contingent liabilities 0 -
EBIT (before special items) 307 297 3 1IFRS 16 effect -1 -
EBIT on a comparable basis 306 297 3 1
Transaction costs Akorn 0 5
Revaluations of biosimilars contingent liabilities 1 -
Net income (before special items) 203 199 2 -1IFRS 16 effect 1 -
Net income on a comparable basis 204 199 3 0
64
Reconciliation Fresenius Kabi
General Credit Presentation November 2019 copy Fresenius SE amp Co KGaA Investor Relations
eurom Q1-319 Q1-318 growthrate
growthrate (cc)
Sales reported 5153 4857 6 5
Transaction costs Akorn 3 45
Revaluations of biosimilars contingent liabilities -4 -
EBIT (before special items) 920 854 8 4IFRS 16 effect -3 -
EBIT on a comparable basis 917 854 7 4
Transaction costs Akorn 3 36
Revaluations of biosimilars contingent liabilities -1 -
Net income (before special items) 614 554 11 7IFRS 16 effect 4 -
Net income on a comparable basis 618 554 12 8
65
Reconciliation Fresenius Helios
General Credit Presentation November 2019 copy Fresenius SE amp Co KGaA Investor Relations
eurom Q319 Q318 growthrate
Sales reported 2230 2088 7German post-acute care business transferred from Fresenius Helios to Fresenius Vamed - 0
Sales adjusted for German post-acute care business 2230 2088 7
EBIT reported 187 204 -8IFRS 16 effect -4 -
EBIT adjusted for IFRS 16 effect 183 204 -10German post-acute care business transferred from Fresenius Helios to Fresenius Vamed - 0EBIT adjusted for IFRS 16 effect and German post-acute care business 183 204 -10
66
Reconciliation Fresenius Helios
General Credit Presentation November 2019 copy Fresenius SE amp Co KGaA Investor Relations
eurom Q1-319 Q1-318 growthrate
Sales reported 6890 6762 2German post-acute care business transferred from Fresenius Helios to Fresenius Vamed - -226
Sales adjusted for German post-acute care business 6890 6536 5
EBIT reported 731 775 -6IFRS 16 effect -8 -
EBIT adjusted for IFRS 16 effect 723 775 -7German post-acute care business transferred from Fresenius Helios to Fresenius Vamed - -10EBIT adjusted for IFRS 16 effect and German post-acute care business 723 765 -5
67
Reconciliation Fresenius Vamed
General Credit Presentation November 2019 copy Fresenius SE amp Co KGaA Investor Relations
eurom Q319 Q318 growthrate
Sales reported 562 476 18German post-acute care business acquired from Fresenius Helios -121 -117
Sales adjusted for German post-acute care business 441 359 23
EBIT reported 33 31 6IFRS 16 effect 1 -
EBIT adjusted for IFRS 16 effect 34 31 10German post-acute care business acquired from Fresenius Helios -15 -15EBIT adjusted for IFRS 16 effect and German post-acute care business 19 16 19
68
Reconciliation Fresenius Vamed
General Credit Presentation November 2019 copy Fresenius SE amp Co KGaA Investor Relations
eurom Q1-319 Q1-318 growthrate
Sales reported 1469 991 48German post-acute care business acquired from Fresenius Helios -350 -117
Sales adjusted for German post-acute care business 1119 874 28
EBIT reported 67 49 37IFRS 16 effect -2 -
EBIT adjusted for IFRS 16 effect 65 49 33German post-acute care business acquired from Fresenius Helios -31 -15EBIT adjusted for IFRS 16 effect and German post-acute care business 34 34 0
69
Financial Calendar Contact
Financial Calendar 20 February 2020 Results FY19
06 May 2020 Results Q120
20 May 2020 Annual General Meeting
30 July 2020 Results Q220
29 October 2020 Results Q320
Please note that these dates could be subject to change
Contact
Investor RelationsFresenius SE amp Co KGaAphone +49 6172 608-2485e-mail ir-frefreseniuscomFor further information and current news wwwfreseniuscom
Follow us on Twitter wwwtwittercomfresenius_irand LinkedIn wwwlinkedincomcompanyfresenius-investor-relations
General Credit Presentation November 2019 copy Fresenius SE amp Co KGaA Investor Relations 70
- Presentation to Credit Investors
- Safe Harbor Statement
- Foliennummer 3
- Strong and Balanced Health Care Portfolio
- Fresenius Group Global Sales Base in Growing Non-Cyclical Markets
- Fresenius Group Strong Track Record of Organic Sales Growth in All Business Segments
- Fresenius Group Strong Track Record of EBITDA Generation
- Fresenius SE Earnings-Linked Dividend Policy
- Global Health Care Trends ndash Strong Growth Fundamentals
- Fresenius Medical Care Global Dialysis Market Leader
- Fresenius Medical Care Sales and EBIT development
- Fresenius Kabi A Leading Global Hospital Supplier
- Fresenius Kabi Sales and EBIT development
- Fresenius Helios Europersquos Largest Private Hospital OperatorHelios Germany
- Fresenius Helios Europersquos Largest Private Hospital Operator Helios Spain
- Fresenius Helios Sales and EBIT development
- Fresenius Vamed Leading Global Hospital Projects and Services Specialist
- Fresenius Vamed Sales an EBIT development
- Fresenius Group Key Figures
- Cash Flow Development by Business Segment
- Fresenius Group Consistent Cash Generation
- Fresenius Group Proven Track Record of Deleveraging
- Fresenius Group Capitalization ndash September 30 2019 excl IFRS 16
- Fresenius Group Capitalization ndash September 30 2019 incl IFRS 16
- Fresenius Group Broad Mix of Financing Instruments
- Foliennummer 26
- Fresenius Group excl Fresenius Medical CareDebt Maturity Profile ndash September 30 201912
- Fresenius Group Solid Balance Sheet Structure
- Fresenius Group Strong Access to Capital Markets
- Fresenius SE Rating History amp Rationale
- Fresenius Group 2019 Financial Outlook by Business Segment
- Fresenius Group 2019 Financial Guidance
- Fresenius Group Healthy Growth Targets 2020 ndash 2023 (CAGRs)
- FY18 base for Fresenius Group Guidance FY19
- FY18 base for Fresenius Medical Care Outlook FY19
- FY18 base for Fresenius Kabi Outlook FY19
- IFRS 16 effect on Group PampL
- IFRS 16 effect on Group Balance Sheet and Cash Flow
- Fresenius Group Credit Highlights
- Attachments
- Fresenius Group Key Figures
- Foliennummer 42
- Foliennummer 43
- Fresenius Group Cash Flow
- Fresenius Group Financial Results by Business Segment
- Fresenius Group Margins by Business Segment
- Fresenius SE amp Co KGaA Overview Bonds
- Fresenius Group Reconciliation
- Fresenius Group Reconciliation
- Fresenius Group Reconciliation
- Fresenius Group Reconciliation
- Fresenius Group Reconciliation
- Fresenius Group Reconciliation
- Fresenius Group Reconciliation
- Fresenius Group Reconciliation
- Reconciliation according to Fresenius Medical Care
- Reconciliation according to Fresenius Medical Care
- Reconciliation according to Fresenius Medical Care
- Reconciliation according to Fresenius Medical Care
- Reconciliation Fresenius Medical Care according to Fresenius Group
- Reconciliation Fresenius Medical Care according to Fresenius Group
- Reconciliation Fresenius Medical Care according to Fresenius Group
- Reconciliation Fresenius Medical Care according to Fresenius Group
- Reconciliation Fresenius Kabi
- Reconciliation Fresenius Kabi
- Reconciliation Fresenius Helios
- Reconciliation Fresenius Helios
- Reconciliation Fresenius Vamed
- Reconciliation Fresenius Vamed
- Financial Calendar Contact
-

Reconciliation according to Fresenius Medical Care
General Credit Presentation November 2019 copy Fresenius SE amp Co KGaA Investor Relations
eurom Q1-319 Q1-318 growthrate
growthrate (cc)
Net income reported 857 1557 -45 -47Gain related to divestitures of Care Coordination activities -29 -690
Divestitures of Care Coordination activities - 4
IFRS 16 effect 45 -
NxStage operations 49 -
Transaction costs NxStage 16 -
Expenses associated with the cost optimization program 23 -
Impact of FCPA related charge - 75
Net income adjusted 961 946 2 -3
59
Reconciliation Fresenius Medical Care according to Fresenius Group
General Credit Presentation November 2019 copy Fresenius SE amp Co KGaA Investor Relations
eurom Q319 Q318 growthrate
growthrate (cc)
Sales reported 4419 4058 9 6Divestitures of Care Coordination activities - -7
IFRS 16 effect 35 -
Sales on a comparable basis 4454 4051 10 7
EBIT reported (after special items) 595 527 13 9Gain related to divestitures of Care Coordination activities -3 -10
Transaction costs NxStage 2 -
Expenses associated with the cost optimization program 25 -
Impact of FCPA related charge - 75
EBIT (before special items) 619 592 5 1Divestitures of Care Coordination activities - 0
IFRS 16 effect -20 -
EBIT on a comparable basis 599 592 1 -3
60
Reconciliation Fresenius Medical Care according to Fresenius Group
General Credit Presentation November 2019 copy Fresenius SE amp Co KGaA Investor Relations
eurom Q319 Q318 growthrate
growthrate (cc)
Net income reported (after special items) 332 284 17 12Gain related to divestitures of Care Coordination activities -20 -16
Transaction costs NxStage 1 -
Expenses associated with the cost optimization program 18 -
Impact of FCPA related charge - 75
Net income (before special items) 331 343 -3 -7Divestitures of Care Coordination activities - -1
IFRS 16 effect 17 -
Net income on a comparable basis 348 342 2 -2
61
Reconciliation Fresenius Medical Care according to Fresenius Group
General Credit Presentation November 2019 copy Fresenius SE amp Co KGaA Investor Relations
eurom Q1-319 Q1-318 growthrate
growthrate (cc)
Sales reported 12897 12247 5 1Divestitures of Care Coordination activities - -516
IFRS 16 effect 75 -
Sales on a comparable basis 12972 11731 11 7
EBIT reported (after special items) 1653 2425 -32 -35Gain related to divestitures of Care Coordination activities -14 -830
Transaction costs NxStage 22 -
Expenses associated with the cost optimization program 32 -
Impact of FCPA related charge - 75
EBIT (before special items) 1693 1670 1 -3Divestitures of Care Coordination activities - -14
IFRS 16 effect -68 -
EBIT on a comparable basis 1625 1656 -2 -6
62
Reconciliation Fresenius Medical Care according to Fresenius Group
General Credit Presentation November 2019 copy Fresenius SE amp Co KGaA Investor Relations
eurom Q1-319 Q1-318 growthrate
growthrate (cc)
Net income reported (after special items) 857 1557 -45 -47Gain related to divestitures of Care Coordination activities -29 -690
Transaction costs NxStage 16 -
Expenses associated with the cost optimization program 23 -
Impact of FCPA related charge - 75
Net income (before special items) 867 942 -8 -12Divestitures of Care Coordination activities - 4
IFRS 16 effect 45 -
Net income on a comparable basis 912 946 -4 -8
63
Reconciliation Fresenius Kabi
General Credit Presentation November 2019 copy Fresenius SE amp Co KGaA Investor Relations
eurom Q319 Q318 growthrate
growthrate (cc)
Sales reported 1761 1650 7 5
Transaction costs Akorn 0 6
Revaluations of biosimilars contingent liabilities 0 -
EBIT (before special items) 307 297 3 1IFRS 16 effect -1 -
EBIT on a comparable basis 306 297 3 1
Transaction costs Akorn 0 5
Revaluations of biosimilars contingent liabilities 1 -
Net income (before special items) 203 199 2 -1IFRS 16 effect 1 -
Net income on a comparable basis 204 199 3 0
64
Reconciliation Fresenius Kabi
General Credit Presentation November 2019 copy Fresenius SE amp Co KGaA Investor Relations
eurom Q1-319 Q1-318 growthrate
growthrate (cc)
Sales reported 5153 4857 6 5
Transaction costs Akorn 3 45
Revaluations of biosimilars contingent liabilities -4 -
EBIT (before special items) 920 854 8 4IFRS 16 effect -3 -
EBIT on a comparable basis 917 854 7 4
Transaction costs Akorn 3 36
Revaluations of biosimilars contingent liabilities -1 -
Net income (before special items) 614 554 11 7IFRS 16 effect 4 -
Net income on a comparable basis 618 554 12 8
65
Reconciliation Fresenius Helios
General Credit Presentation November 2019 copy Fresenius SE amp Co KGaA Investor Relations
eurom Q319 Q318 growthrate
Sales reported 2230 2088 7German post-acute care business transferred from Fresenius Helios to Fresenius Vamed - 0
Sales adjusted for German post-acute care business 2230 2088 7
EBIT reported 187 204 -8IFRS 16 effect -4 -
EBIT adjusted for IFRS 16 effect 183 204 -10German post-acute care business transferred from Fresenius Helios to Fresenius Vamed - 0EBIT adjusted for IFRS 16 effect and German post-acute care business 183 204 -10
66
Reconciliation Fresenius Helios
General Credit Presentation November 2019 copy Fresenius SE amp Co KGaA Investor Relations
eurom Q1-319 Q1-318 growthrate
Sales reported 6890 6762 2German post-acute care business transferred from Fresenius Helios to Fresenius Vamed - -226
Sales adjusted for German post-acute care business 6890 6536 5
EBIT reported 731 775 -6IFRS 16 effect -8 -
EBIT adjusted for IFRS 16 effect 723 775 -7German post-acute care business transferred from Fresenius Helios to Fresenius Vamed - -10EBIT adjusted for IFRS 16 effect and German post-acute care business 723 765 -5
67
Reconciliation Fresenius Vamed
General Credit Presentation November 2019 copy Fresenius SE amp Co KGaA Investor Relations
eurom Q319 Q318 growthrate
Sales reported 562 476 18German post-acute care business acquired from Fresenius Helios -121 -117
Sales adjusted for German post-acute care business 441 359 23
EBIT reported 33 31 6IFRS 16 effect 1 -
EBIT adjusted for IFRS 16 effect 34 31 10German post-acute care business acquired from Fresenius Helios -15 -15EBIT adjusted for IFRS 16 effect and German post-acute care business 19 16 19
68
Reconciliation Fresenius Vamed
General Credit Presentation November 2019 copy Fresenius SE amp Co KGaA Investor Relations
eurom Q1-319 Q1-318 growthrate
Sales reported 1469 991 48German post-acute care business acquired from Fresenius Helios -350 -117
Sales adjusted for German post-acute care business 1119 874 28
EBIT reported 67 49 37IFRS 16 effect -2 -
EBIT adjusted for IFRS 16 effect 65 49 33German post-acute care business acquired from Fresenius Helios -31 -15EBIT adjusted for IFRS 16 effect and German post-acute care business 34 34 0
69
Financial Calendar Contact
Financial Calendar 20 February 2020 Results FY19
06 May 2020 Results Q120
20 May 2020 Annual General Meeting
30 July 2020 Results Q220
29 October 2020 Results Q320
Please note that these dates could be subject to change
Contact
Investor RelationsFresenius SE amp Co KGaAphone +49 6172 608-2485e-mail ir-frefreseniuscomFor further information and current news wwwfreseniuscom
Follow us on Twitter wwwtwittercomfresenius_irand LinkedIn wwwlinkedincomcompanyfresenius-investor-relations
General Credit Presentation November 2019 copy Fresenius SE amp Co KGaA Investor Relations 70
- Presentation to Credit Investors
- Safe Harbor Statement
- Foliennummer 3
- Strong and Balanced Health Care Portfolio
- Fresenius Group Global Sales Base in Growing Non-Cyclical Markets
- Fresenius Group Strong Track Record of Organic Sales Growth in All Business Segments
- Fresenius Group Strong Track Record of EBITDA Generation
- Fresenius SE Earnings-Linked Dividend Policy
- Global Health Care Trends ndash Strong Growth Fundamentals
- Fresenius Medical Care Global Dialysis Market Leader
- Fresenius Medical Care Sales and EBIT development
- Fresenius Kabi A Leading Global Hospital Supplier
- Fresenius Kabi Sales and EBIT development
- Fresenius Helios Europersquos Largest Private Hospital OperatorHelios Germany
- Fresenius Helios Europersquos Largest Private Hospital Operator Helios Spain
- Fresenius Helios Sales and EBIT development
- Fresenius Vamed Leading Global Hospital Projects and Services Specialist
- Fresenius Vamed Sales an EBIT development
- Fresenius Group Key Figures
- Cash Flow Development by Business Segment
- Fresenius Group Consistent Cash Generation
- Fresenius Group Proven Track Record of Deleveraging
- Fresenius Group Capitalization ndash September 30 2019 excl IFRS 16
- Fresenius Group Capitalization ndash September 30 2019 incl IFRS 16
- Fresenius Group Broad Mix of Financing Instruments
- Foliennummer 26
- Fresenius Group excl Fresenius Medical CareDebt Maturity Profile ndash September 30 201912
- Fresenius Group Solid Balance Sheet Structure
- Fresenius Group Strong Access to Capital Markets
- Fresenius SE Rating History amp Rationale
- Fresenius Group 2019 Financial Outlook by Business Segment
- Fresenius Group 2019 Financial Guidance
- Fresenius Group Healthy Growth Targets 2020 ndash 2023 (CAGRs)
- FY18 base for Fresenius Group Guidance FY19
- FY18 base for Fresenius Medical Care Outlook FY19
- FY18 base for Fresenius Kabi Outlook FY19
- IFRS 16 effect on Group PampL
- IFRS 16 effect on Group Balance Sheet and Cash Flow
- Fresenius Group Credit Highlights
- Attachments
- Fresenius Group Key Figures
- Foliennummer 42
- Foliennummer 43
- Fresenius Group Cash Flow
- Fresenius Group Financial Results by Business Segment
- Fresenius Group Margins by Business Segment
- Fresenius SE amp Co KGaA Overview Bonds
- Fresenius Group Reconciliation
- Fresenius Group Reconciliation
- Fresenius Group Reconciliation
- Fresenius Group Reconciliation
- Fresenius Group Reconciliation
- Fresenius Group Reconciliation
- Fresenius Group Reconciliation
- Fresenius Group Reconciliation
- Reconciliation according to Fresenius Medical Care
- Reconciliation according to Fresenius Medical Care
- Reconciliation according to Fresenius Medical Care
- Reconciliation according to Fresenius Medical Care
- Reconciliation Fresenius Medical Care according to Fresenius Group
- Reconciliation Fresenius Medical Care according to Fresenius Group
- Reconciliation Fresenius Medical Care according to Fresenius Group
- Reconciliation Fresenius Medical Care according to Fresenius Group
- Reconciliation Fresenius Kabi
- Reconciliation Fresenius Kabi
- Reconciliation Fresenius Helios
- Reconciliation Fresenius Helios
- Reconciliation Fresenius Vamed
- Reconciliation Fresenius Vamed
- Financial Calendar Contact
-

Reconciliation Fresenius Medical Care according to Fresenius Group
General Credit Presentation November 2019 copy Fresenius SE amp Co KGaA Investor Relations
eurom Q319 Q318 growthrate
growthrate (cc)
Net income reported (after special items) 332 284 17 12Gain related to divestitures of Care Coordination activities -20 -16
Transaction costs NxStage 1 -
Expenses associated with the cost optimization program 18 -
Impact of FCPA related charge - 75
Net income (before special items) 331 343 -3 -7Divestitures of Care Coordination activities - -1
IFRS 16 effect 17 -
Net income on a comparable basis 348 342 2 -2
61
Reconciliation Fresenius Medical Care according to Fresenius Group
General Credit Presentation November 2019 copy Fresenius SE amp Co KGaA Investor Relations
eurom Q1-319 Q1-318 growthrate
growthrate (cc)
Sales reported 12897 12247 5 1Divestitures of Care Coordination activities - -516
IFRS 16 effect 75 -
Sales on a comparable basis 12972 11731 11 7
EBIT reported (after special items) 1653 2425 -32 -35Gain related to divestitures of Care Coordination activities -14 -830
Transaction costs NxStage 22 -
Expenses associated with the cost optimization program 32 -
Impact of FCPA related charge - 75
EBIT (before special items) 1693 1670 1 -3Divestitures of Care Coordination activities - -14
IFRS 16 effect -68 -
EBIT on a comparable basis 1625 1656 -2 -6
62
Reconciliation Fresenius Medical Care according to Fresenius Group
General Credit Presentation November 2019 copy Fresenius SE amp Co KGaA Investor Relations
eurom Q1-319 Q1-318 growthrate
growthrate (cc)
Net income reported (after special items) 857 1557 -45 -47Gain related to divestitures of Care Coordination activities -29 -690
Transaction costs NxStage 16 -
Expenses associated with the cost optimization program 23 -
Impact of FCPA related charge - 75
Net income (before special items) 867 942 -8 -12Divestitures of Care Coordination activities - 4
IFRS 16 effect 45 -
Net income on a comparable basis 912 946 -4 -8
63
Reconciliation Fresenius Kabi
General Credit Presentation November 2019 copy Fresenius SE amp Co KGaA Investor Relations
eurom Q319 Q318 growthrate
growthrate (cc)
Sales reported 1761 1650 7 5
Transaction costs Akorn 0 6
Revaluations of biosimilars contingent liabilities 0 -
EBIT (before special items) 307 297 3 1IFRS 16 effect -1 -
EBIT on a comparable basis 306 297 3 1
Transaction costs Akorn 0 5
Revaluations of biosimilars contingent liabilities 1 -
Net income (before special items) 203 199 2 -1IFRS 16 effect 1 -
Net income on a comparable basis 204 199 3 0
64
Reconciliation Fresenius Kabi
General Credit Presentation November 2019 copy Fresenius SE amp Co KGaA Investor Relations
eurom Q1-319 Q1-318 growthrate
growthrate (cc)
Sales reported 5153 4857 6 5
Transaction costs Akorn 3 45
Revaluations of biosimilars contingent liabilities -4 -
EBIT (before special items) 920 854 8 4IFRS 16 effect -3 -
EBIT on a comparable basis 917 854 7 4
Transaction costs Akorn 3 36
Revaluations of biosimilars contingent liabilities -1 -
Net income (before special items) 614 554 11 7IFRS 16 effect 4 -
Net income on a comparable basis 618 554 12 8
65
Reconciliation Fresenius Helios
General Credit Presentation November 2019 copy Fresenius SE amp Co KGaA Investor Relations
eurom Q319 Q318 growthrate
Sales reported 2230 2088 7German post-acute care business transferred from Fresenius Helios to Fresenius Vamed - 0
Sales adjusted for German post-acute care business 2230 2088 7
EBIT reported 187 204 -8IFRS 16 effect -4 -
EBIT adjusted for IFRS 16 effect 183 204 -10German post-acute care business transferred from Fresenius Helios to Fresenius Vamed - 0EBIT adjusted for IFRS 16 effect and German post-acute care business 183 204 -10
66
Reconciliation Fresenius Helios
General Credit Presentation November 2019 copy Fresenius SE amp Co KGaA Investor Relations
eurom Q1-319 Q1-318 growthrate
Sales reported 6890 6762 2German post-acute care business transferred from Fresenius Helios to Fresenius Vamed - -226
Sales adjusted for German post-acute care business 6890 6536 5
EBIT reported 731 775 -6IFRS 16 effect -8 -
EBIT adjusted for IFRS 16 effect 723 775 -7German post-acute care business transferred from Fresenius Helios to Fresenius Vamed - -10EBIT adjusted for IFRS 16 effect and German post-acute care business 723 765 -5
67
Reconciliation Fresenius Vamed
General Credit Presentation November 2019 copy Fresenius SE amp Co KGaA Investor Relations
eurom Q319 Q318 growthrate
Sales reported 562 476 18German post-acute care business acquired from Fresenius Helios -121 -117
Sales adjusted for German post-acute care business 441 359 23
EBIT reported 33 31 6IFRS 16 effect 1 -
EBIT adjusted for IFRS 16 effect 34 31 10German post-acute care business acquired from Fresenius Helios -15 -15EBIT adjusted for IFRS 16 effect and German post-acute care business 19 16 19
68
Reconciliation Fresenius Vamed
General Credit Presentation November 2019 copy Fresenius SE amp Co KGaA Investor Relations
eurom Q1-319 Q1-318 growthrate
Sales reported 1469 991 48German post-acute care business acquired from Fresenius Helios -350 -117
Sales adjusted for German post-acute care business 1119 874 28
EBIT reported 67 49 37IFRS 16 effect -2 -
EBIT adjusted for IFRS 16 effect 65 49 33German post-acute care business acquired from Fresenius Helios -31 -15EBIT adjusted for IFRS 16 effect and German post-acute care business 34 34 0
69
Financial Calendar Contact
Financial Calendar 20 February 2020 Results FY19
06 May 2020 Results Q120
20 May 2020 Annual General Meeting
30 July 2020 Results Q220
29 October 2020 Results Q320
Please note that these dates could be subject to change
Contact
Investor RelationsFresenius SE amp Co KGaAphone +49 6172 608-2485e-mail ir-frefreseniuscomFor further information and current news wwwfreseniuscom
Follow us on Twitter wwwtwittercomfresenius_irand LinkedIn wwwlinkedincomcompanyfresenius-investor-relations
General Credit Presentation November 2019 copy Fresenius SE amp Co KGaA Investor Relations 70
- Presentation to Credit Investors
- Safe Harbor Statement
- Foliennummer 3
- Strong and Balanced Health Care Portfolio
- Fresenius Group Global Sales Base in Growing Non-Cyclical Markets
- Fresenius Group Strong Track Record of Organic Sales Growth in All Business Segments
- Fresenius Group Strong Track Record of EBITDA Generation
- Fresenius SE Earnings-Linked Dividend Policy
- Global Health Care Trends ndash Strong Growth Fundamentals
- Fresenius Medical Care Global Dialysis Market Leader
- Fresenius Medical Care Sales and EBIT development
- Fresenius Kabi A Leading Global Hospital Supplier
- Fresenius Kabi Sales and EBIT development
- Fresenius Helios Europersquos Largest Private Hospital OperatorHelios Germany
- Fresenius Helios Europersquos Largest Private Hospital Operator Helios Spain
- Fresenius Helios Sales and EBIT development
- Fresenius Vamed Leading Global Hospital Projects and Services Specialist
- Fresenius Vamed Sales an EBIT development
- Fresenius Group Key Figures
- Cash Flow Development by Business Segment
- Fresenius Group Consistent Cash Generation
- Fresenius Group Proven Track Record of Deleveraging
- Fresenius Group Capitalization ndash September 30 2019 excl IFRS 16
- Fresenius Group Capitalization ndash September 30 2019 incl IFRS 16
- Fresenius Group Broad Mix of Financing Instruments
- Foliennummer 26
- Fresenius Group excl Fresenius Medical CareDebt Maturity Profile ndash September 30 201912
- Fresenius Group Solid Balance Sheet Structure
- Fresenius Group Strong Access to Capital Markets
- Fresenius SE Rating History amp Rationale
- Fresenius Group 2019 Financial Outlook by Business Segment
- Fresenius Group 2019 Financial Guidance
- Fresenius Group Healthy Growth Targets 2020 ndash 2023 (CAGRs)
- FY18 base for Fresenius Group Guidance FY19
- FY18 base for Fresenius Medical Care Outlook FY19
- FY18 base for Fresenius Kabi Outlook FY19
- IFRS 16 effect on Group PampL
- IFRS 16 effect on Group Balance Sheet and Cash Flow
- Fresenius Group Credit Highlights
- Attachments
- Fresenius Group Key Figures
- Foliennummer 42
- Foliennummer 43
- Fresenius Group Cash Flow
- Fresenius Group Financial Results by Business Segment
- Fresenius Group Margins by Business Segment
- Fresenius SE amp Co KGaA Overview Bonds
- Fresenius Group Reconciliation
- Fresenius Group Reconciliation
- Fresenius Group Reconciliation
- Fresenius Group Reconciliation
- Fresenius Group Reconciliation
- Fresenius Group Reconciliation
- Fresenius Group Reconciliation
- Fresenius Group Reconciliation
- Reconciliation according to Fresenius Medical Care
- Reconciliation according to Fresenius Medical Care
- Reconciliation according to Fresenius Medical Care
- Reconciliation according to Fresenius Medical Care
- Reconciliation Fresenius Medical Care according to Fresenius Group
- Reconciliation Fresenius Medical Care according to Fresenius Group
- Reconciliation Fresenius Medical Care according to Fresenius Group
- Reconciliation Fresenius Medical Care according to Fresenius Group
- Reconciliation Fresenius Kabi
- Reconciliation Fresenius Kabi
- Reconciliation Fresenius Helios
- Reconciliation Fresenius Helios
- Reconciliation Fresenius Vamed
- Reconciliation Fresenius Vamed
- Financial Calendar Contact
-

Reconciliation Fresenius Medical Care according to Fresenius Group
General Credit Presentation November 2019 copy Fresenius SE amp Co KGaA Investor Relations
eurom Q1-319 Q1-318 growthrate
growthrate (cc)
Net income reported (after special items) 857 1557 -45 -47Gain related to divestitures of Care Coordination activities -29 -690
Transaction costs NxStage 16 -
Expenses associated with the cost optimization program 23 -
Impact of FCPA related charge - 75
Net income (before special items) 867 942 -8 -12Divestitures of Care Coordination activities - 4
IFRS 16 effect 45 -
Net income on a comparable basis 912 946 -4 -8
63
Reconciliation Fresenius Kabi
General Credit Presentation November 2019 copy Fresenius SE amp Co KGaA Investor Relations
eurom Q319 Q318 growthrate
growthrate (cc)
Sales reported 1761 1650 7 5
Transaction costs Akorn 0 6
Revaluations of biosimilars contingent liabilities 0 -
EBIT (before special items) 307 297 3 1IFRS 16 effect -1 -
EBIT on a comparable basis 306 297 3 1
Transaction costs Akorn 0 5
Revaluations of biosimilars contingent liabilities 1 -
Net income (before special items) 203 199 2 -1IFRS 16 effect 1 -
Net income on a comparable basis 204 199 3 0
64
Reconciliation Fresenius Kabi
General Credit Presentation November 2019 copy Fresenius SE amp Co KGaA Investor Relations
eurom Q1-319 Q1-318 growthrate
growthrate (cc)
Sales reported 5153 4857 6 5
Transaction costs Akorn 3 45
Revaluations of biosimilars contingent liabilities -4 -
EBIT (before special items) 920 854 8 4IFRS 16 effect -3 -
EBIT on a comparable basis 917 854 7 4
Transaction costs Akorn 3 36
Revaluations of biosimilars contingent liabilities -1 -
Net income (before special items) 614 554 11 7IFRS 16 effect 4 -
Net income on a comparable basis 618 554 12 8
65
Reconciliation Fresenius Helios
General Credit Presentation November 2019 copy Fresenius SE amp Co KGaA Investor Relations
eurom Q319 Q318 growthrate
Sales reported 2230 2088 7German post-acute care business transferred from Fresenius Helios to Fresenius Vamed - 0
Sales adjusted for German post-acute care business 2230 2088 7
EBIT reported 187 204 -8IFRS 16 effect -4 -
EBIT adjusted for IFRS 16 effect 183 204 -10German post-acute care business transferred from Fresenius Helios to Fresenius Vamed - 0EBIT adjusted for IFRS 16 effect and German post-acute care business 183 204 -10
66
Reconciliation Fresenius Helios
General Credit Presentation November 2019 copy Fresenius SE amp Co KGaA Investor Relations
eurom Q1-319 Q1-318 growthrate
Sales reported 6890 6762 2German post-acute care business transferred from Fresenius Helios to Fresenius Vamed - -226
Sales adjusted for German post-acute care business 6890 6536 5
EBIT reported 731 775 -6IFRS 16 effect -8 -
EBIT adjusted for IFRS 16 effect 723 775 -7German post-acute care business transferred from Fresenius Helios to Fresenius Vamed - -10EBIT adjusted for IFRS 16 effect and German post-acute care business 723 765 -5
67
Reconciliation Fresenius Vamed
General Credit Presentation November 2019 copy Fresenius SE amp Co KGaA Investor Relations
eurom Q319 Q318 growthrate
Sales reported 562 476 18German post-acute care business acquired from Fresenius Helios -121 -117
Sales adjusted for German post-acute care business 441 359 23
EBIT reported 33 31 6IFRS 16 effect 1 -
EBIT adjusted for IFRS 16 effect 34 31 10German post-acute care business acquired from Fresenius Helios -15 -15EBIT adjusted for IFRS 16 effect and German post-acute care business 19 16 19
68
Reconciliation Fresenius Vamed
General Credit Presentation November 2019 copy Fresenius SE amp Co KGaA Investor Relations
eurom Q1-319 Q1-318 growthrate
Sales reported 1469 991 48German post-acute care business acquired from Fresenius Helios -350 -117
Sales adjusted for German post-acute care business 1119 874 28
EBIT reported 67 49 37IFRS 16 effect -2 -
EBIT adjusted for IFRS 16 effect 65 49 33German post-acute care business acquired from Fresenius Helios -31 -15EBIT adjusted for IFRS 16 effect and German post-acute care business 34 34 0
69
Financial Calendar Contact
Financial Calendar 20 February 2020 Results FY19
06 May 2020 Results Q120
20 May 2020 Annual General Meeting
30 July 2020 Results Q220
29 October 2020 Results Q320
Please note that these dates could be subject to change
Contact
Investor RelationsFresenius SE amp Co KGaAphone +49 6172 608-2485e-mail ir-frefreseniuscomFor further information and current news wwwfreseniuscom
Follow us on Twitter wwwtwittercomfresenius_irand LinkedIn wwwlinkedincomcompanyfresenius-investor-relations
General Credit Presentation November 2019 copy Fresenius SE amp Co KGaA Investor Relations 70
- Presentation to Credit Investors
- Safe Harbor Statement
- Foliennummer 3
- Strong and Balanced Health Care Portfolio
- Fresenius Group Global Sales Base in Growing Non-Cyclical Markets
- Fresenius Group Strong Track Record of Organic Sales Growth in All Business Segments
- Fresenius Group Strong Track Record of EBITDA Generation
- Fresenius SE Earnings-Linked Dividend Policy
- Global Health Care Trends ndash Strong Growth Fundamentals
- Fresenius Medical Care Global Dialysis Market Leader
- Fresenius Medical Care Sales and EBIT development
- Fresenius Kabi A Leading Global Hospital Supplier
- Fresenius Kabi Sales and EBIT development
- Fresenius Helios Europersquos Largest Private Hospital OperatorHelios Germany
- Fresenius Helios Europersquos Largest Private Hospital Operator Helios Spain
- Fresenius Helios Sales and EBIT development
- Fresenius Vamed Leading Global Hospital Projects and Services Specialist
- Fresenius Vamed Sales an EBIT development
- Fresenius Group Key Figures
- Cash Flow Development by Business Segment
- Fresenius Group Consistent Cash Generation
- Fresenius Group Proven Track Record of Deleveraging
- Fresenius Group Capitalization ndash September 30 2019 excl IFRS 16
- Fresenius Group Capitalization ndash September 30 2019 incl IFRS 16
- Fresenius Group Broad Mix of Financing Instruments
- Foliennummer 26
- Fresenius Group excl Fresenius Medical CareDebt Maturity Profile ndash September 30 201912
- Fresenius Group Solid Balance Sheet Structure
- Fresenius Group Strong Access to Capital Markets
- Fresenius SE Rating History amp Rationale
- Fresenius Group 2019 Financial Outlook by Business Segment
- Fresenius Group 2019 Financial Guidance
- Fresenius Group Healthy Growth Targets 2020 ndash 2023 (CAGRs)
- FY18 base for Fresenius Group Guidance FY19
- FY18 base for Fresenius Medical Care Outlook FY19
- FY18 base for Fresenius Kabi Outlook FY19
- IFRS 16 effect on Group PampL
- IFRS 16 effect on Group Balance Sheet and Cash Flow
- Fresenius Group Credit Highlights
- Attachments
- Fresenius Group Key Figures
- Foliennummer 42
- Foliennummer 43
- Fresenius Group Cash Flow
- Fresenius Group Financial Results by Business Segment
- Fresenius Group Margins by Business Segment
- Fresenius SE amp Co KGaA Overview Bonds
- Fresenius Group Reconciliation
- Fresenius Group Reconciliation
- Fresenius Group Reconciliation
- Fresenius Group Reconciliation
- Fresenius Group Reconciliation
- Fresenius Group Reconciliation
- Fresenius Group Reconciliation
- Fresenius Group Reconciliation
- Reconciliation according to Fresenius Medical Care
- Reconciliation according to Fresenius Medical Care
- Reconciliation according to Fresenius Medical Care
- Reconciliation according to Fresenius Medical Care
- Reconciliation Fresenius Medical Care according to Fresenius Group
- Reconciliation Fresenius Medical Care according to Fresenius Group
- Reconciliation Fresenius Medical Care according to Fresenius Group
- Reconciliation Fresenius Medical Care according to Fresenius Group
- Reconciliation Fresenius Kabi
- Reconciliation Fresenius Kabi
- Reconciliation Fresenius Helios
- Reconciliation Fresenius Helios
- Reconciliation Fresenius Vamed
- Reconciliation Fresenius Vamed
- Financial Calendar Contact
-

Reconciliation Fresenius Kabi
General Credit Presentation November 2019 copy Fresenius SE amp Co KGaA Investor Relations
eurom Q319 Q318 growthrate
growthrate (cc)
Sales reported 1761 1650 7 5
Transaction costs Akorn 0 6
Revaluations of biosimilars contingent liabilities 0 -
EBIT (before special items) 307 297 3 1IFRS 16 effect -1 -
EBIT on a comparable basis 306 297 3 1
Transaction costs Akorn 0 5
Revaluations of biosimilars contingent liabilities 1 -
Net income (before special items) 203 199 2 -1IFRS 16 effect 1 -
Net income on a comparable basis 204 199 3 0
64
Reconciliation Fresenius Kabi
General Credit Presentation November 2019 copy Fresenius SE amp Co KGaA Investor Relations
eurom Q1-319 Q1-318 growthrate
growthrate (cc)
Sales reported 5153 4857 6 5
Transaction costs Akorn 3 45
Revaluations of biosimilars contingent liabilities -4 -
EBIT (before special items) 920 854 8 4IFRS 16 effect -3 -
EBIT on a comparable basis 917 854 7 4
Transaction costs Akorn 3 36
Revaluations of biosimilars contingent liabilities -1 -
Net income (before special items) 614 554 11 7IFRS 16 effect 4 -
Net income on a comparable basis 618 554 12 8
65
Reconciliation Fresenius Helios
General Credit Presentation November 2019 copy Fresenius SE amp Co KGaA Investor Relations
eurom Q319 Q318 growthrate
Sales reported 2230 2088 7German post-acute care business transferred from Fresenius Helios to Fresenius Vamed - 0
Sales adjusted for German post-acute care business 2230 2088 7
EBIT reported 187 204 -8IFRS 16 effect -4 -
EBIT adjusted for IFRS 16 effect 183 204 -10German post-acute care business transferred from Fresenius Helios to Fresenius Vamed - 0EBIT adjusted for IFRS 16 effect and German post-acute care business 183 204 -10
66
Reconciliation Fresenius Helios
General Credit Presentation November 2019 copy Fresenius SE amp Co KGaA Investor Relations
eurom Q1-319 Q1-318 growthrate
Sales reported 6890 6762 2German post-acute care business transferred from Fresenius Helios to Fresenius Vamed - -226
Sales adjusted for German post-acute care business 6890 6536 5
EBIT reported 731 775 -6IFRS 16 effect -8 -
EBIT adjusted for IFRS 16 effect 723 775 -7German post-acute care business transferred from Fresenius Helios to Fresenius Vamed - -10EBIT adjusted for IFRS 16 effect and German post-acute care business 723 765 -5
67
Reconciliation Fresenius Vamed
General Credit Presentation November 2019 copy Fresenius SE amp Co KGaA Investor Relations
eurom Q319 Q318 growthrate
Sales reported 562 476 18German post-acute care business acquired from Fresenius Helios -121 -117
Sales adjusted for German post-acute care business 441 359 23
EBIT reported 33 31 6IFRS 16 effect 1 -
EBIT adjusted for IFRS 16 effect 34 31 10German post-acute care business acquired from Fresenius Helios -15 -15EBIT adjusted for IFRS 16 effect and German post-acute care business 19 16 19
68
Reconciliation Fresenius Vamed
General Credit Presentation November 2019 copy Fresenius SE amp Co KGaA Investor Relations
eurom Q1-319 Q1-318 growthrate
Sales reported 1469 991 48German post-acute care business acquired from Fresenius Helios -350 -117
Sales adjusted for German post-acute care business 1119 874 28
EBIT reported 67 49 37IFRS 16 effect -2 -
EBIT adjusted for IFRS 16 effect 65 49 33German post-acute care business acquired from Fresenius Helios -31 -15EBIT adjusted for IFRS 16 effect and German post-acute care business 34 34 0
69
Financial Calendar Contact
Financial Calendar 20 February 2020 Results FY19
06 May 2020 Results Q120
20 May 2020 Annual General Meeting
30 July 2020 Results Q220
29 October 2020 Results Q320
Please note that these dates could be subject to change
Contact
Investor RelationsFresenius SE amp Co KGaAphone +49 6172 608-2485e-mail ir-frefreseniuscomFor further information and current news wwwfreseniuscom
Follow us on Twitter wwwtwittercomfresenius_irand LinkedIn wwwlinkedincomcompanyfresenius-investor-relations
General Credit Presentation November 2019 copy Fresenius SE amp Co KGaA Investor Relations 70
- Presentation to Credit Investors
- Safe Harbor Statement
- Foliennummer 3
- Strong and Balanced Health Care Portfolio
- Fresenius Group Global Sales Base in Growing Non-Cyclical Markets
- Fresenius Group Strong Track Record of Organic Sales Growth in All Business Segments
- Fresenius Group Strong Track Record of EBITDA Generation
- Fresenius SE Earnings-Linked Dividend Policy
- Global Health Care Trends ndash Strong Growth Fundamentals
- Fresenius Medical Care Global Dialysis Market Leader
- Fresenius Medical Care Sales and EBIT development
- Fresenius Kabi A Leading Global Hospital Supplier
- Fresenius Kabi Sales and EBIT development
- Fresenius Helios Europersquos Largest Private Hospital OperatorHelios Germany
- Fresenius Helios Europersquos Largest Private Hospital Operator Helios Spain
- Fresenius Helios Sales and EBIT development
- Fresenius Vamed Leading Global Hospital Projects and Services Specialist
- Fresenius Vamed Sales an EBIT development
- Fresenius Group Key Figures
- Cash Flow Development by Business Segment
- Fresenius Group Consistent Cash Generation
- Fresenius Group Proven Track Record of Deleveraging
- Fresenius Group Capitalization ndash September 30 2019 excl IFRS 16
- Fresenius Group Capitalization ndash September 30 2019 incl IFRS 16
- Fresenius Group Broad Mix of Financing Instruments
- Foliennummer 26
- Fresenius Group excl Fresenius Medical CareDebt Maturity Profile ndash September 30 201912
- Fresenius Group Solid Balance Sheet Structure
- Fresenius Group Strong Access to Capital Markets
- Fresenius SE Rating History amp Rationale
- Fresenius Group 2019 Financial Outlook by Business Segment
- Fresenius Group 2019 Financial Guidance
- Fresenius Group Healthy Growth Targets 2020 ndash 2023 (CAGRs)
- FY18 base for Fresenius Group Guidance FY19
- FY18 base for Fresenius Medical Care Outlook FY19
- FY18 base for Fresenius Kabi Outlook FY19
- IFRS 16 effect on Group PampL
- IFRS 16 effect on Group Balance Sheet and Cash Flow
- Fresenius Group Credit Highlights
- Attachments
- Fresenius Group Key Figures
- Foliennummer 42
- Foliennummer 43
- Fresenius Group Cash Flow
- Fresenius Group Financial Results by Business Segment
- Fresenius Group Margins by Business Segment
- Fresenius SE amp Co KGaA Overview Bonds
- Fresenius Group Reconciliation
- Fresenius Group Reconciliation
- Fresenius Group Reconciliation
- Fresenius Group Reconciliation
- Fresenius Group Reconciliation
- Fresenius Group Reconciliation
- Fresenius Group Reconciliation
- Fresenius Group Reconciliation
- Reconciliation according to Fresenius Medical Care
- Reconciliation according to Fresenius Medical Care
- Reconciliation according to Fresenius Medical Care
- Reconciliation according to Fresenius Medical Care
- Reconciliation Fresenius Medical Care according to Fresenius Group
- Reconciliation Fresenius Medical Care according to Fresenius Group
- Reconciliation Fresenius Medical Care according to Fresenius Group
- Reconciliation Fresenius Medical Care according to Fresenius Group
- Reconciliation Fresenius Kabi
- Reconciliation Fresenius Kabi
- Reconciliation Fresenius Helios
- Reconciliation Fresenius Helios
- Reconciliation Fresenius Vamed
- Reconciliation Fresenius Vamed
- Financial Calendar Contact
-

Reconciliation Fresenius Kabi
General Credit Presentation November 2019 copy Fresenius SE amp Co KGaA Investor Relations
eurom Q1-319 Q1-318 growthrate
growthrate (cc)
Sales reported 5153 4857 6 5
Transaction costs Akorn 3 45
Revaluations of biosimilars contingent liabilities -4 -
EBIT (before special items) 920 854 8 4IFRS 16 effect -3 -
EBIT on a comparable basis 917 854 7 4
Transaction costs Akorn 3 36
Revaluations of biosimilars contingent liabilities -1 -
Net income (before special items) 614 554 11 7IFRS 16 effect 4 -
Net income on a comparable basis 618 554 12 8
65
Reconciliation Fresenius Helios
General Credit Presentation November 2019 copy Fresenius SE amp Co KGaA Investor Relations
eurom Q319 Q318 growthrate
Sales reported 2230 2088 7German post-acute care business transferred from Fresenius Helios to Fresenius Vamed - 0
Sales adjusted for German post-acute care business 2230 2088 7
EBIT reported 187 204 -8IFRS 16 effect -4 -
EBIT adjusted for IFRS 16 effect 183 204 -10German post-acute care business transferred from Fresenius Helios to Fresenius Vamed - 0EBIT adjusted for IFRS 16 effect and German post-acute care business 183 204 -10
66
Reconciliation Fresenius Helios
General Credit Presentation November 2019 copy Fresenius SE amp Co KGaA Investor Relations
eurom Q1-319 Q1-318 growthrate
Sales reported 6890 6762 2German post-acute care business transferred from Fresenius Helios to Fresenius Vamed - -226
Sales adjusted for German post-acute care business 6890 6536 5
EBIT reported 731 775 -6IFRS 16 effect -8 -
EBIT adjusted for IFRS 16 effect 723 775 -7German post-acute care business transferred from Fresenius Helios to Fresenius Vamed - -10EBIT adjusted for IFRS 16 effect and German post-acute care business 723 765 -5
67
Reconciliation Fresenius Vamed
General Credit Presentation November 2019 copy Fresenius SE amp Co KGaA Investor Relations
eurom Q319 Q318 growthrate
Sales reported 562 476 18German post-acute care business acquired from Fresenius Helios -121 -117
Sales adjusted for German post-acute care business 441 359 23
EBIT reported 33 31 6IFRS 16 effect 1 -
EBIT adjusted for IFRS 16 effect 34 31 10German post-acute care business acquired from Fresenius Helios -15 -15EBIT adjusted for IFRS 16 effect and German post-acute care business 19 16 19
68
Reconciliation Fresenius Vamed
General Credit Presentation November 2019 copy Fresenius SE amp Co KGaA Investor Relations
eurom Q1-319 Q1-318 growthrate
Sales reported 1469 991 48German post-acute care business acquired from Fresenius Helios -350 -117
Sales adjusted for German post-acute care business 1119 874 28
EBIT reported 67 49 37IFRS 16 effect -2 -
EBIT adjusted for IFRS 16 effect 65 49 33German post-acute care business acquired from Fresenius Helios -31 -15EBIT adjusted for IFRS 16 effect and German post-acute care business 34 34 0
69
Financial Calendar Contact
Financial Calendar 20 February 2020 Results FY19
06 May 2020 Results Q120
20 May 2020 Annual General Meeting
30 July 2020 Results Q220
29 October 2020 Results Q320
Please note that these dates could be subject to change
Contact
Investor RelationsFresenius SE amp Co KGaAphone +49 6172 608-2485e-mail ir-frefreseniuscomFor further information and current news wwwfreseniuscom
Follow us on Twitter wwwtwittercomfresenius_irand LinkedIn wwwlinkedincomcompanyfresenius-investor-relations
General Credit Presentation November 2019 copy Fresenius SE amp Co KGaA Investor Relations 70
- Presentation to Credit Investors
- Safe Harbor Statement
- Foliennummer 3
- Strong and Balanced Health Care Portfolio
- Fresenius Group Global Sales Base in Growing Non-Cyclical Markets
- Fresenius Group Strong Track Record of Organic Sales Growth in All Business Segments
- Fresenius Group Strong Track Record of EBITDA Generation
- Fresenius SE Earnings-Linked Dividend Policy
- Global Health Care Trends ndash Strong Growth Fundamentals
- Fresenius Medical Care Global Dialysis Market Leader
- Fresenius Medical Care Sales and EBIT development
- Fresenius Kabi A Leading Global Hospital Supplier
- Fresenius Kabi Sales and EBIT development
- Fresenius Helios Europersquos Largest Private Hospital OperatorHelios Germany
- Fresenius Helios Europersquos Largest Private Hospital Operator Helios Spain
- Fresenius Helios Sales and EBIT development
- Fresenius Vamed Leading Global Hospital Projects and Services Specialist
- Fresenius Vamed Sales an EBIT development
- Fresenius Group Key Figures
- Cash Flow Development by Business Segment
- Fresenius Group Consistent Cash Generation
- Fresenius Group Proven Track Record of Deleveraging
- Fresenius Group Capitalization ndash September 30 2019 excl IFRS 16
- Fresenius Group Capitalization ndash September 30 2019 incl IFRS 16
- Fresenius Group Broad Mix of Financing Instruments
- Foliennummer 26
- Fresenius Group excl Fresenius Medical CareDebt Maturity Profile ndash September 30 201912
- Fresenius Group Solid Balance Sheet Structure
- Fresenius Group Strong Access to Capital Markets
- Fresenius SE Rating History amp Rationale
- Fresenius Group 2019 Financial Outlook by Business Segment
- Fresenius Group 2019 Financial Guidance
- Fresenius Group Healthy Growth Targets 2020 ndash 2023 (CAGRs)
- FY18 base for Fresenius Group Guidance FY19
- FY18 base for Fresenius Medical Care Outlook FY19
- FY18 base for Fresenius Kabi Outlook FY19
- IFRS 16 effect on Group PampL
- IFRS 16 effect on Group Balance Sheet and Cash Flow
- Fresenius Group Credit Highlights
- Attachments
- Fresenius Group Key Figures
- Foliennummer 42
- Foliennummer 43
- Fresenius Group Cash Flow
- Fresenius Group Financial Results by Business Segment
- Fresenius Group Margins by Business Segment
- Fresenius SE amp Co KGaA Overview Bonds
- Fresenius Group Reconciliation
- Fresenius Group Reconciliation
- Fresenius Group Reconciliation
- Fresenius Group Reconciliation
- Fresenius Group Reconciliation
- Fresenius Group Reconciliation
- Fresenius Group Reconciliation
- Fresenius Group Reconciliation
- Reconciliation according to Fresenius Medical Care
- Reconciliation according to Fresenius Medical Care
- Reconciliation according to Fresenius Medical Care
- Reconciliation according to Fresenius Medical Care
- Reconciliation Fresenius Medical Care according to Fresenius Group
- Reconciliation Fresenius Medical Care according to Fresenius Group
- Reconciliation Fresenius Medical Care according to Fresenius Group
- Reconciliation Fresenius Medical Care according to Fresenius Group
- Reconciliation Fresenius Kabi
- Reconciliation Fresenius Kabi
- Reconciliation Fresenius Helios
- Reconciliation Fresenius Helios
- Reconciliation Fresenius Vamed
- Reconciliation Fresenius Vamed
- Financial Calendar Contact
-

Reconciliation Fresenius Helios
General Credit Presentation November 2019 copy Fresenius SE amp Co KGaA Investor Relations
eurom Q319 Q318 growthrate
Sales reported 2230 2088 7German post-acute care business transferred from Fresenius Helios to Fresenius Vamed - 0
Sales adjusted for German post-acute care business 2230 2088 7
EBIT reported 187 204 -8IFRS 16 effect -4 -
EBIT adjusted for IFRS 16 effect 183 204 -10German post-acute care business transferred from Fresenius Helios to Fresenius Vamed - 0EBIT adjusted for IFRS 16 effect and German post-acute care business 183 204 -10
66
Reconciliation Fresenius Helios
General Credit Presentation November 2019 copy Fresenius SE amp Co KGaA Investor Relations
eurom Q1-319 Q1-318 growthrate
Sales reported 6890 6762 2German post-acute care business transferred from Fresenius Helios to Fresenius Vamed - -226
Sales adjusted for German post-acute care business 6890 6536 5
EBIT reported 731 775 -6IFRS 16 effect -8 -
EBIT adjusted for IFRS 16 effect 723 775 -7German post-acute care business transferred from Fresenius Helios to Fresenius Vamed - -10EBIT adjusted for IFRS 16 effect and German post-acute care business 723 765 -5
67
Reconciliation Fresenius Vamed
General Credit Presentation November 2019 copy Fresenius SE amp Co KGaA Investor Relations
eurom Q319 Q318 growthrate
Sales reported 562 476 18German post-acute care business acquired from Fresenius Helios -121 -117
Sales adjusted for German post-acute care business 441 359 23
EBIT reported 33 31 6IFRS 16 effect 1 -
EBIT adjusted for IFRS 16 effect 34 31 10German post-acute care business acquired from Fresenius Helios -15 -15EBIT adjusted for IFRS 16 effect and German post-acute care business 19 16 19
68
Reconciliation Fresenius Vamed
General Credit Presentation November 2019 copy Fresenius SE amp Co KGaA Investor Relations
eurom Q1-319 Q1-318 growthrate
Sales reported 1469 991 48German post-acute care business acquired from Fresenius Helios -350 -117
Sales adjusted for German post-acute care business 1119 874 28
EBIT reported 67 49 37IFRS 16 effect -2 -
EBIT adjusted for IFRS 16 effect 65 49 33German post-acute care business acquired from Fresenius Helios -31 -15EBIT adjusted for IFRS 16 effect and German post-acute care business 34 34 0
69
Financial Calendar Contact
Financial Calendar 20 February 2020 Results FY19
06 May 2020 Results Q120
20 May 2020 Annual General Meeting
30 July 2020 Results Q220
29 October 2020 Results Q320
Please note that these dates could be subject to change
Contact
Investor RelationsFresenius SE amp Co KGaAphone +49 6172 608-2485e-mail ir-frefreseniuscomFor further information and current news wwwfreseniuscom
Follow us on Twitter wwwtwittercomfresenius_irand LinkedIn wwwlinkedincomcompanyfresenius-investor-relations
General Credit Presentation November 2019 copy Fresenius SE amp Co KGaA Investor Relations 70
- Presentation to Credit Investors
- Safe Harbor Statement
- Foliennummer 3
- Strong and Balanced Health Care Portfolio
- Fresenius Group Global Sales Base in Growing Non-Cyclical Markets
- Fresenius Group Strong Track Record of Organic Sales Growth in All Business Segments
- Fresenius Group Strong Track Record of EBITDA Generation
- Fresenius SE Earnings-Linked Dividend Policy
- Global Health Care Trends ndash Strong Growth Fundamentals
- Fresenius Medical Care Global Dialysis Market Leader
- Fresenius Medical Care Sales and EBIT development
- Fresenius Kabi A Leading Global Hospital Supplier
- Fresenius Kabi Sales and EBIT development
- Fresenius Helios Europersquos Largest Private Hospital OperatorHelios Germany
- Fresenius Helios Europersquos Largest Private Hospital Operator Helios Spain
- Fresenius Helios Sales and EBIT development
- Fresenius Vamed Leading Global Hospital Projects and Services Specialist
- Fresenius Vamed Sales an EBIT development
- Fresenius Group Key Figures
- Cash Flow Development by Business Segment
- Fresenius Group Consistent Cash Generation
- Fresenius Group Proven Track Record of Deleveraging
- Fresenius Group Capitalization ndash September 30 2019 excl IFRS 16
- Fresenius Group Capitalization ndash September 30 2019 incl IFRS 16
- Fresenius Group Broad Mix of Financing Instruments
- Foliennummer 26
- Fresenius Group excl Fresenius Medical CareDebt Maturity Profile ndash September 30 201912
- Fresenius Group Solid Balance Sheet Structure
- Fresenius Group Strong Access to Capital Markets
- Fresenius SE Rating History amp Rationale
- Fresenius Group 2019 Financial Outlook by Business Segment
- Fresenius Group 2019 Financial Guidance
- Fresenius Group Healthy Growth Targets 2020 ndash 2023 (CAGRs)
- FY18 base for Fresenius Group Guidance FY19
- FY18 base for Fresenius Medical Care Outlook FY19
- FY18 base for Fresenius Kabi Outlook FY19
- IFRS 16 effect on Group PampL
- IFRS 16 effect on Group Balance Sheet and Cash Flow
- Fresenius Group Credit Highlights
- Attachments
- Fresenius Group Key Figures
- Foliennummer 42
- Foliennummer 43
- Fresenius Group Cash Flow
- Fresenius Group Financial Results by Business Segment
- Fresenius Group Margins by Business Segment
- Fresenius SE amp Co KGaA Overview Bonds
- Fresenius Group Reconciliation
- Fresenius Group Reconciliation
- Fresenius Group Reconciliation
- Fresenius Group Reconciliation
- Fresenius Group Reconciliation
- Fresenius Group Reconciliation
- Fresenius Group Reconciliation
- Fresenius Group Reconciliation
- Reconciliation according to Fresenius Medical Care
- Reconciliation according to Fresenius Medical Care
- Reconciliation according to Fresenius Medical Care
- Reconciliation according to Fresenius Medical Care
- Reconciliation Fresenius Medical Care according to Fresenius Group
- Reconciliation Fresenius Medical Care according to Fresenius Group
- Reconciliation Fresenius Medical Care according to Fresenius Group
- Reconciliation Fresenius Medical Care according to Fresenius Group
- Reconciliation Fresenius Kabi
- Reconciliation Fresenius Kabi
- Reconciliation Fresenius Helios
- Reconciliation Fresenius Helios
- Reconciliation Fresenius Vamed
- Reconciliation Fresenius Vamed
- Financial Calendar Contact
-

Reconciliation Fresenius Helios
General Credit Presentation November 2019 copy Fresenius SE amp Co KGaA Investor Relations
eurom Q1-319 Q1-318 growthrate
Sales reported 6890 6762 2German post-acute care business transferred from Fresenius Helios to Fresenius Vamed - -226
Sales adjusted for German post-acute care business 6890 6536 5
EBIT reported 731 775 -6IFRS 16 effect -8 -
EBIT adjusted for IFRS 16 effect 723 775 -7German post-acute care business transferred from Fresenius Helios to Fresenius Vamed - -10EBIT adjusted for IFRS 16 effect and German post-acute care business 723 765 -5
67
Reconciliation Fresenius Vamed
General Credit Presentation November 2019 copy Fresenius SE amp Co KGaA Investor Relations
eurom Q319 Q318 growthrate
Sales reported 562 476 18German post-acute care business acquired from Fresenius Helios -121 -117
Sales adjusted for German post-acute care business 441 359 23
EBIT reported 33 31 6IFRS 16 effect 1 -
EBIT adjusted for IFRS 16 effect 34 31 10German post-acute care business acquired from Fresenius Helios -15 -15EBIT adjusted for IFRS 16 effect and German post-acute care business 19 16 19
68
Reconciliation Fresenius Vamed
General Credit Presentation November 2019 copy Fresenius SE amp Co KGaA Investor Relations
eurom Q1-319 Q1-318 growthrate
Sales reported 1469 991 48German post-acute care business acquired from Fresenius Helios -350 -117
Sales adjusted for German post-acute care business 1119 874 28
EBIT reported 67 49 37IFRS 16 effect -2 -
EBIT adjusted for IFRS 16 effect 65 49 33German post-acute care business acquired from Fresenius Helios -31 -15EBIT adjusted for IFRS 16 effect and German post-acute care business 34 34 0
69
Financial Calendar Contact
Financial Calendar 20 February 2020 Results FY19
06 May 2020 Results Q120
20 May 2020 Annual General Meeting
30 July 2020 Results Q220
29 October 2020 Results Q320
Please note that these dates could be subject to change
Contact
Investor RelationsFresenius SE amp Co KGaAphone +49 6172 608-2485e-mail ir-frefreseniuscomFor further information and current news wwwfreseniuscom
Follow us on Twitter wwwtwittercomfresenius_irand LinkedIn wwwlinkedincomcompanyfresenius-investor-relations
General Credit Presentation November 2019 copy Fresenius SE amp Co KGaA Investor Relations 70
- Presentation to Credit Investors
- Safe Harbor Statement
- Foliennummer 3
- Strong and Balanced Health Care Portfolio
- Fresenius Group Global Sales Base in Growing Non-Cyclical Markets
- Fresenius Group Strong Track Record of Organic Sales Growth in All Business Segments
- Fresenius Group Strong Track Record of EBITDA Generation
- Fresenius SE Earnings-Linked Dividend Policy
- Global Health Care Trends ndash Strong Growth Fundamentals
- Fresenius Medical Care Global Dialysis Market Leader
- Fresenius Medical Care Sales and EBIT development
- Fresenius Kabi A Leading Global Hospital Supplier
- Fresenius Kabi Sales and EBIT development
- Fresenius Helios Europersquos Largest Private Hospital OperatorHelios Germany
- Fresenius Helios Europersquos Largest Private Hospital Operator Helios Spain
- Fresenius Helios Sales and EBIT development
- Fresenius Vamed Leading Global Hospital Projects and Services Specialist
- Fresenius Vamed Sales an EBIT development
- Fresenius Group Key Figures
- Cash Flow Development by Business Segment
- Fresenius Group Consistent Cash Generation
- Fresenius Group Proven Track Record of Deleveraging
- Fresenius Group Capitalization ndash September 30 2019 excl IFRS 16
- Fresenius Group Capitalization ndash September 30 2019 incl IFRS 16
- Fresenius Group Broad Mix of Financing Instruments
- Foliennummer 26
- Fresenius Group excl Fresenius Medical CareDebt Maturity Profile ndash September 30 201912
- Fresenius Group Solid Balance Sheet Structure
- Fresenius Group Strong Access to Capital Markets
- Fresenius SE Rating History amp Rationale
- Fresenius Group 2019 Financial Outlook by Business Segment
- Fresenius Group 2019 Financial Guidance
- Fresenius Group Healthy Growth Targets 2020 ndash 2023 (CAGRs)
- FY18 base for Fresenius Group Guidance FY19
- FY18 base for Fresenius Medical Care Outlook FY19
- FY18 base for Fresenius Kabi Outlook FY19
- IFRS 16 effect on Group PampL
- IFRS 16 effect on Group Balance Sheet and Cash Flow
- Fresenius Group Credit Highlights
- Attachments
- Fresenius Group Key Figures
- Foliennummer 42
- Foliennummer 43
- Fresenius Group Cash Flow
- Fresenius Group Financial Results by Business Segment
- Fresenius Group Margins by Business Segment
- Fresenius SE amp Co KGaA Overview Bonds
- Fresenius Group Reconciliation
- Fresenius Group Reconciliation
- Fresenius Group Reconciliation
- Fresenius Group Reconciliation
- Fresenius Group Reconciliation
- Fresenius Group Reconciliation
- Fresenius Group Reconciliation
- Fresenius Group Reconciliation
- Reconciliation according to Fresenius Medical Care
- Reconciliation according to Fresenius Medical Care
- Reconciliation according to Fresenius Medical Care
- Reconciliation according to Fresenius Medical Care
- Reconciliation Fresenius Medical Care according to Fresenius Group
- Reconciliation Fresenius Medical Care according to Fresenius Group
- Reconciliation Fresenius Medical Care according to Fresenius Group
- Reconciliation Fresenius Medical Care according to Fresenius Group
- Reconciliation Fresenius Kabi
- Reconciliation Fresenius Kabi
- Reconciliation Fresenius Helios
- Reconciliation Fresenius Helios
- Reconciliation Fresenius Vamed
- Reconciliation Fresenius Vamed
- Financial Calendar Contact
-

Reconciliation Fresenius Vamed
General Credit Presentation November 2019 copy Fresenius SE amp Co KGaA Investor Relations
eurom Q1-319 Q1-318 growthrate
Sales reported 1469 991 48German post-acute care business acquired from Fresenius Helios -350 -117
Sales adjusted for German post-acute care business 1119 874 28
EBIT reported 67 49 37IFRS 16 effect -2 -
EBIT adjusted for IFRS 16 effect 65 49 33German post-acute care business acquired from Fresenius Helios -31 -15EBIT adjusted for IFRS 16 effect and German post-acute care business 34 34 0
69
Financial Calendar Contact
Financial Calendar 20 February 2020 Results FY19
06 May 2020 Results Q120
20 May 2020 Annual General Meeting
30 July 2020 Results Q220
29 October 2020 Results Q320
Please note that these dates could be subject to change
Contact
Investor RelationsFresenius SE amp Co KGaAphone +49 6172 608-2485e-mail ir-frefreseniuscomFor further information and current news wwwfreseniuscom
Follow us on Twitter wwwtwittercomfresenius_irand LinkedIn wwwlinkedincomcompanyfresenius-investor-relations
General Credit Presentation November 2019 copy Fresenius SE amp Co KGaA Investor Relations 70
- Presentation to Credit Investors
- Safe Harbor Statement
- Foliennummer 3
- Strong and Balanced Health Care Portfolio
- Fresenius Group Global Sales Base in Growing Non-Cyclical Markets
- Fresenius Group Strong Track Record of Organic Sales Growth in All Business Segments
- Fresenius Group Strong Track Record of EBITDA Generation
- Fresenius SE Earnings-Linked Dividend Policy
- Global Health Care Trends ndash Strong Growth Fundamentals
- Fresenius Medical Care Global Dialysis Market Leader
- Fresenius Medical Care Sales and EBIT development
- Fresenius Kabi A Leading Global Hospital Supplier
- Fresenius Kabi Sales and EBIT development
- Fresenius Helios Europersquos Largest Private Hospital OperatorHelios Germany
- Fresenius Helios Europersquos Largest Private Hospital Operator Helios Spain
- Fresenius Helios Sales and EBIT development
- Fresenius Vamed Leading Global Hospital Projects and Services Specialist
- Fresenius Vamed Sales an EBIT development
- Fresenius Group Key Figures
- Cash Flow Development by Business Segment
- Fresenius Group Consistent Cash Generation
- Fresenius Group Proven Track Record of Deleveraging
- Fresenius Group Capitalization ndash September 30 2019 excl IFRS 16
- Fresenius Group Capitalization ndash September 30 2019 incl IFRS 16
- Fresenius Group Broad Mix of Financing Instruments
- Foliennummer 26
- Fresenius Group excl Fresenius Medical CareDebt Maturity Profile ndash September 30 201912
- Fresenius Group Solid Balance Sheet Structure
- Fresenius Group Strong Access to Capital Markets
- Fresenius SE Rating History amp Rationale
- Fresenius Group 2019 Financial Outlook by Business Segment
- Fresenius Group 2019 Financial Guidance
- Fresenius Group Healthy Growth Targets 2020 ndash 2023 (CAGRs)
- FY18 base for Fresenius Group Guidance FY19
- FY18 base for Fresenius Medical Care Outlook FY19
- FY18 base for Fresenius Kabi Outlook FY19
- IFRS 16 effect on Group PampL
- IFRS 16 effect on Group Balance Sheet and Cash Flow
- Fresenius Group Credit Highlights
- Attachments
- Fresenius Group Key Figures
- Foliennummer 42
- Foliennummer 43
- Fresenius Group Cash Flow
- Fresenius Group Financial Results by Business Segment
- Fresenius Group Margins by Business Segment
- Fresenius SE amp Co KGaA Overview Bonds
- Fresenius Group Reconciliation
- Fresenius Group Reconciliation
- Fresenius Group Reconciliation
- Fresenius Group Reconciliation
- Fresenius Group Reconciliation
- Fresenius Group Reconciliation
- Fresenius Group Reconciliation
- Fresenius Group Reconciliation
- Reconciliation according to Fresenius Medical Care
- Reconciliation according to Fresenius Medical Care
- Reconciliation according to Fresenius Medical Care
- Reconciliation according to Fresenius Medical Care
- Reconciliation Fresenius Medical Care according to Fresenius Group
- Reconciliation Fresenius Medical Care according to Fresenius Group
- Reconciliation Fresenius Medical Care according to Fresenius Group
- Reconciliation Fresenius Medical Care according to Fresenius Group
- Reconciliation Fresenius Kabi
- Reconciliation Fresenius Kabi
- Reconciliation Fresenius Helios
- Reconciliation Fresenius Helios
- Reconciliation Fresenius Vamed
- Reconciliation Fresenius Vamed
- Financial Calendar Contact
-