presentation to 2013 powerworld client conference january ... · presentation to 2013 powerworld...
TRANSCRIPT

SolidGroundTM Transformer Neutral Blocking System
Presentation to 2013 PowerWorld Client Conference January 22, 2013
Power World Grid Modeling with GIC and
Neutral Blocking

Agenda
• GMD Threats to the Power Grid
• Estimated 100 Year Geo-Electric Field Magnitudes
• Geomagnetically Induced Current (GIC) Grid Modeling
• SolidGroundTM Transformer Neutral Blocking System
• System testing at KEMA and the Idaho National Laboratories (INL)
• SolidGroundTM Economics

January 14, 2013 | Slide 3
Energetic
Charged Particles
Electromagnetic
Radiation
Magnetic Field
(Magnetized Plasma)
Geomagnetic disturbance is in the mainstream media
“Most power grids have no built-in protection against the onslaught of a powerful geomagnetic storm.”
“Scientists cannot be sure of the storm’s intensity until it reaches the ACE satellite – sometimes a mere 20 minutes before it slams into Earth.”
“The morally right thing to do once you’ve identified a threat of this magnitude is to be prepared… Not preparing for it has intolerable consequences.” June 2012

Solar Storms Damage the Power Grid
Protection Against HV Transformer Damage & Power Grid Voltage Collapse has Been Developed & can be Implemented

100 Year Geo-Electric Field Magnitudes (for 4,800 nT/min Storm)
Area in North
America
WI, MI, VT, NH, Ont., Quebec
100 Year Geo- E. Field J. Kappenman,
15.2 V/km
Estimates from J. Kappenman are from MetTech Report # 319, 2010 scaled up to 4,800 nT/min.

100 Year Geo-Electric Field Magnitudes (for 4,800 nT/min Storm)
Area in North
America
WI, MI, VT, NH, Ont., Quebec
100 Year Geo- E. Field J. Kappenman,
15.2 V/km
Area in North
America
Quebec
100 Year Geo-E. Field A. Pulkkinen et.al.,
20 V/km (10 to 50 V/km)
Estimates from J. Kappenman are from MetTech Report # 319, 2010 scaled up to 4,800 nT/min. Data from A. Pulkkinen et.al. are from Space Weather publication in 2012

100 Year Geo-Electric Field Magnitudes (for 4,800 nT/min Storm)
Area in North
America
WI, MI, VT, NH, Ont., Quebec
Lower NY, NJ, Eastern PA
100 Year Geo- E. Field J. Kappenman,
15.2 V/km 31.2 V/km
Area in North
America
Quebec
100 Year Geo-E. Field A. Pulkkinen et.al.,
20 V/km (10 to 50 V/km)
Estimates from J. Kappenman are from MetTech Report # 319, 2010 scaled up to 4,800 nT/min. Data from A. Pulkkinen et.al. are from Space Weather publication in 2012

100 Year Geo-Electric Field Magnitudes for 4,800 nT/min Storm
Area in NA
Southern States (AL, GA, NC, SC, TN)
British Col.
WI, MI, VT, NH, Ont., Quebec
Lower NY, NJ, Eastern PA
100 Year Geo- E. Field J. Kappenman,
4.8 V/km 4.4 V/km 15.2 V/km 31.2 V/km
Area in NA British Col. Quebec
100 Year Geo-E. Field A. Pulkkinen et.al.,
5 V/km (3 to 15 V/km)
20 V/km (10 to 50 V/km)
Emprimus Proprietary
Estimates from J. Kappenman are from MetTech Report # 319, 2010 scaled up to 4,800 nT/min. Estimates from A. Pulkkinen et.al. are from Space Weather publication in 2012
8

GIC Grid Modeling
• Power World has recently added geomagnetic induced current (GIC) analysis to their power flow analysis
– Provides analysis to help answer questions concerning:
• grid instability from increased transformer MVAR loss
• Identifies locations of potential damage to critical infrastructure (i.e. transformers, SVCs, etc.)
Emprimus Proprietary 9

GIC Modeling – cont’d ATC Approach:
• Requested transformer data from ATC for large Auto-transformers and GSUs
• Analyzed PowerWorld model to reflect correct transformer configurations and input data
Emprimus Proprietary 10

GIC Modeling – cont’d
Approach: • Simulate a range of electric field intensities (2 V/km to 80 V/km)
– 2 V/km was the field that caused the 1989 blackout in Quebec
– 20 V/km (range 10 to 50 V/km) for 100 Yr storm(A. Pulkkinen et. al. )
• Simulate a range of electric field orientations
– North-south and east-west should be examined
– Include the orientation that aligns with most of the transmission lines in the area of interest
• Simulate GMD effects in one area of interest (AOI)
• Identify electric field strength that leads to voltage collapse
• Simulate the grid stability improvements as GIC blocking devices are applied
11

Emprimus Proprietary
Voltage Change at 2 V/km, East-West
Power World Power Flow & GIC Modeling
12

Emprimus Proprietary
Voltage Change at 17.5 V/km, East-West
Power World Power Flow & GIC Modeling
13

Selection of ATC Transformers for Neutral Blocking Devices
Emprimus Proprietary
1st Five Transformers
2nd Five Transformers
3rd Five Transformers
4th Five Transformers
5th Five Transformers
GSU Station C 345/22 #1 GSU Station B 345/19 #1 Substation E 345/138 #1 Substation E 138/13 #1 Substation OC 345/138 #2
GSU Station C 345/22 #2 Substation C 345/138 #2 Substation E 345/138 #2 Substation K 345/138 #1 Substation A 230/115 Kv Substation 345/230 #1
GSU Station B 345/19 #1 Substation S 345/138 #1 Substation K 345/138 #2 Substation C 345/138 #1 Substation SF 138/69 #1
GSU Station E 345/22 #1 Substation WM 345/138 #1 Substation SL 345/161 #1 Substation C 138/69 #1 Substation OC 345/138 #1
GSU Station K 345/20 #1 GSU Station E 345/22 #1 Substation C 345/138 #3 Substation SG 138/25 #1 GSU FW 138/35 #1
November 5, 2012 14

ATC (Wisc. Pw Grid) GIC/Power Flow Simulations using PowerWorld Software
Emprimus Proprietary
0.80 0.81 0.82 0.83 0.84 0.85 0.86 0.87 0.88 0.89 0.90 0.91 0.92 0.93 0.94 0.95 0.96 0.97 0.98 0.99 1.00
5 10 15 20 25 30 35 40
Vo
ltag
e a
t Lo
we
st p
u V
olt
age
Bu
s
Field Strength (V/km)
ATC Voltage Performance, East-West Storm
Baseline, No Transformers
5 Transformers
10 Transformers
25 Transformers
15

Emprimus Proprietary
Solid Ground GIC Mitigation
• Preliminary Results show:
– ATC Voltage collapse occurs at 21.1 V/km(E-W)
– Solid Ground capacitive neutral protection was simulated on 5 , 10, 15, 20 and 25 transformers in the AOI
– Field strength for voltage collapse for 25 neutral blocking devices increased to 27.2 V/km (E-W) or + 29%
Significant Increases in Field Strength for Increased
Number of Neutral Blocking Devices
16
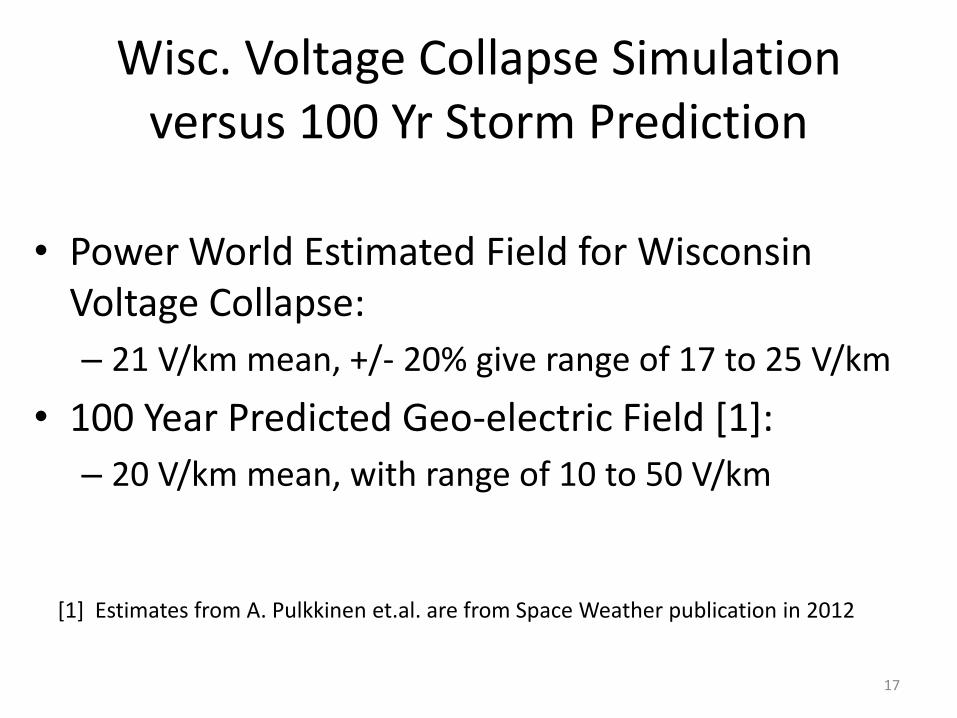
Wisc. Voltage Collapse Simulation versus 100 Yr Storm Prediction
• Power World Estimated Field for Wisconsin Voltage Collapse:
– 21 V/km mean, +/- 20% give range of 17 to 25 V/km
• 100 Year Predicted Geo-electric Field [1]:
– 20 V/km mean, with range of 10 to 50 V/km
17
[1] Estimates from A. Pulkkinen et.al. are from Space Weather publication in 2012

Neutral Blocking Devices Impact at Columbia Site, Field 20 V/km N-S (three
phase GIC currents in amps)
Emprimus Proprietary
Columbia Transformers
No Blocking North- South Field
5 Blocked – Columbia GSUs Blocked
10 Blocked – Columbia Auto-Transformers #2 Blocked
15 Blocked- Columbia Auto-Transformers #3 Blocked
GSU Station C 345/22 #1 818 amps 0 amps 0 amps 0 amps
GSU Station C 345/22 #2 826 amps 0 amps 0 amps 0 amps
Substation C 345/138 #1 50. amps 275 amps 534 amps 775 amps
Substation C 345/138 #2 154 amps 833 amps 0 amps 0 amps
Substation C 345/138 #3 51 amps 277 amps 539 amps 0 amps
Substation C 138/69 #1 13 amps 193 amps 385 amps 563 amps

PowerWorld GIC & Power Flow Simulation Results to Date
• Geo-electric field for voltage collapse is close to the predicted peak 100 year mean field value
• Insertion of transformer neutral blocking at points of highest GIC (i.e. five units at a time) shows improved field collapse values
• Ten (10) & twenty five (25) neutral ground devices show field collapse improvements of 26% and 29%
• Blocking GIC current at a sub-station will require blocking on all station transformers – A single SolidGroundTM device can be used for one to three transformers at
a sub
• Placement of single neutral blocking device does not improve power system voltage degradation – But a blocking device will decrease heating and out-gassing and thereby
increase the expected life of the transformer
Emprimus Proprietary 19

Potential Further Detrimental Factors
• Effects of contingencies, i.e. loss of shunt capacitors, loss of generation, etc.
• Variations of at off-peak and shoulder load levels
• Effects of operating strategies – reactive switching during events and additional generation
• Variations in soil conductivity within an area of interest
Emprimus Proprietary 20

Grid Resiliency System
Protects the power grid from solar storms and Electromagnetic Pulse (EMP ) threats
SolidGroundTM
Automated protection (with manual overrides)
Transformer is always effectively grounded
Uses commercially available components
Laboratory and field verified
Factory assembled; arrives ready to install
Offers financial operating advantages
Applicable to HV transformers, SVC’s, station power
Geomagnetic Induced Current (GIC) causes transformer half-cycle saturation and large VAR consumption on the grid

January 14, 2013 | Slide 22
There is a long history measuring issues related to geomagnetic storms; dating back to 1859.
Mitigation of Geomagnetically Induced and DC Stray
Currents EPRI December, 1983
“Capacitors are the best solutions”
“Prefer a design with a solid ground”
1859 / 1921 Rail and Telegraph outages March, 1989, Quebec outage L. Bolduc, “GIC Observations and studies in the Hydro-Quebec power system”, Journal of
Atmospheric and Solar-Terrestrial Physics 64 (2002) 1793 – 1802
March, 2001 and October, 2001 South African instabilities
J. Koen and R. Gaunt, “Geomagnetically Induced Currents in the Southern African Electricity Transmission Network”, 2003 IEEE Bologna Power Tech Conference, June 23th – 26th, Bologna, Italy
University of Minnesota research V.D. Albertson, J.M. Thorson, Jr., S.A. Miske, Jr., “The Effects of Geomagnetic Storms on Electrical Power
Systems, IEEE Transactions, T73, 370-4, May 23, 1973
Grid stability, outages, and blackout potentials have been known for years …

January 14, 2013 | Slide 23
The electric utility industry has researched GIC mitigation approaches over the same period.
Geomagnetically Induced Currents Conference: EPRI June, 1992
GIC Mitigation: A Neutral Blocking/Bypass Device Conceptual Design and Performance Evaluation
“Therefore, inserting blocking devices in neutral leads appears to be the most logical and effective means of preventing GIC flow.” “The study concluded that a capacitor placed in the neutral of transformers is the most effective and practical blocking device”

Transformer Neutral
4.0 kV Surge Arrester
1 ohm reactance capacitor bank (5,600 kVAR & 2.4 kV )
Transformer
50N 0.001 Ohm Shunt
CT 86
1 ohm power resistor
DC Breaker
AC Breaker
To Quasi-DC Sensor
Kirk Key Interlock
DC Current Blocking System Diagram
Maintenance switch

Mode # 1: Full metallic ground through the switch assembly 99.8 % of time
Mode # 2: Protection mode through resistor/capacitor bank 0.2% of time
Mode # 3: Surge arrester handles the rare potential of a simultaneous DC current & a ground fault
SolidGroundTM Provides 3 Parallel Paths to Ground
1st Path
2nd Path

SolidGround operation has been validated in numerous ways
Software Simulation Modeling at the Univ. of Manitoba
Before After
High Voltage Ground Fault Current Testing in Phil. PA
Idaho National Laboratory Grid Experiment
20kA symmetrical 49kA peak
11.5 kV across arrester

American Transmission Co. (ATC) Installation Plans
• ATC is considering installing a SolidGroundTM (SG-22) system at one of their northern region sub-stations
• With this installation, ATC plans to gain on-line experience of neutral GIC blocking during future GMD events
• Results will be used to determine ATCs future directions w.r.t. GMD mitigation planning
• Reports will be shared with the appropriate NERC committees, EPRI and the power industry
Helping to keep the lights on, businesses running and communities strong®

SolidGround™ Economics

Solid Ground Pricing
• ABB has proposed Solid Ground to several potential customers – Price for ranges from $210k to $250k
depending on the quantity – Estimates of contractor installation
costs range from $25k to $50k – Total cost ranges from $235k to
$300k per Solid Ground installation – One Solid Ground can protect from
one to three transformers
Solid Ground Average Cost is about $80k to $100k per Transformer

30
SolidGroundTM Equates to Large Savings
• SolidGround TM Protection allows Utility Operators to Avoid the so called
“Non-Economic Dispatch Procedure”
• Huge Annual Savings can be Realized
• “Solar Magnetic Disturbance: An Operator’s Wish List,” Greg A. Gucchi, PJM, EPRI-EPRI TR-100450: If we responded to every K alert of level 5 or greater, PJM would have spent over $100 million in excess incremental operating costs…….The ultimate protection against SMD is mitigation.”

January 14, 2013 | Slide 31
Energetic
Charged Particles
Magnetic Field
(Magnetized Plasma)
Geomagnetic disturbance impacts utilities & consumers
“The reduced output at Seabrook came at a time when the power grid was already stressed...”
This one small example represents a cost to industry consumers of ~$24,000 / hr. Preventive measure costs may be recovered by avoidance of just one event!
“The solar storms Sunday night caused high circulating currents in the Seabrook transformers, according to the NRC”

Grid Resiliency System
Protects the power grid from solar storms and Electromagnetic Pulse (EMP ) threats
SolidGroundTM
Automated protection (with manual overrides)
Transformer is always effectively grounded
Uses commercially available components
Laboratory and field verified
Factory assembled; arrives ready to install
Offers financial operating advantages
Applicable to HV transformers, SVC’s, station power
Thanks for Your Attention