presentation title presentation 0619.061119.pdfcorporate overview leading total systems solutions...
TRANSCRIPT

©June 2019

2©June 2019
Forward Looking Statement Safe Harbor: During the course of this presentation, we will make projections or other forward-looking statements regarding the future financial performance of the company or future events, including our strategy, growth drivers, industry outlook, industry trends, market size and our financial model. These statements are made pursuant to the safe harbor provisions of the Private Securities Litigation Reform Act of 1995. These statements involve risks and uncertainties that could cause our actual results to differ materially, including, but not limited to: any economic uncertainty due to monetary policy, political, trade or other issues in the U.S. or internationally, any unexpected fluctuations or weakness in the U.S. and global economies (including China), changes in demand or market acceptance of our products and the products of our customers; our ability to successfully integrate the operations and employees, retain key employees and customers and otherwise realize the expected synergies and benefits of our acquisitions (including our acquisition of Microsemi Corporation); the impact of current and future changes in U.S. corporate tax laws (including the Tax Cuts and Jobs Act of 2017), foreign currency effects on our business; the mix of inventory we hold and our ability to satisfy short-term orders from our inventory; changes in utilization of our manufacturing capacity and our ability to effectively manage and expand our production levels; competitive developments including pricing pressures; the level of orders that are received and can be shipped in a quarter; changes or fluctuations in customer order patterns and seasonality; the impact of any future significant acquisitions that we may make; our ability to obtain a sufficient supply of wafers from third party wafer foundries and the cost of such wafers, the costs and outcome of any current or future tax audit or any litigation or other matters involving intellectual property, customers, or other issues; our actual average stock price in the June 2019 quarter and the impact such price will have on our share count; fluctuations in our stock price and trading volume which could impact the number of shares we acquire under our share repurchase program and the timing of such repurchases; disruptions in our business or the businesses of our customers or suppliers due to natural disasters (including any floods in Thailand), terrorist activity, armed conflict, war, worldwide oil prices and supply, public health concerns or disruptions in the transportation system; and general economic, industry or political conditions in the United States or internationally. For a detailed discussion of these and other risk factors, please refer to Microchip's filings on Forms 10-K and 10-Q. You can obtain copies of Forms 10-K and 10-Q and other relevant documents for free at Microchip's website (www.microchip.com) or the SEC's website (www.sec.gov) or from commercial document retrieval services. You are cautioned not to place undue reliance on our forward-looking statements, which speak only as of the date such statements are made. Microchip does not undertake any obligation to publicly update any forward-looking statements to reflect events, circumstances or new information after the date of this presentation or to reflect the occurrence of unanticipated events.Use of Non-GAAP Financial Measures: In this presentation, we have included certain non-GAAP financial information. Our non-GAAP adjustments include, where applicable, the effect of share-based compensation, expenses related to our acquisition activities (including intangible asset amortization, inventory valuation costs, excess capacity charges to normalize acquired inventory levels, severance and other restructuring costs, and legal and other general and administrative expenses associated with acquisitions), non-cash interest expense on our convertible debentures, adjustments for a manufacturing excursion issue with one of our suppliers, losses on the settlement of debt, and losses on available-for-sale investments. For the fourth quarter of fiscal 2019, our non-GAAP income tax expense is presented based on projected cash taxes for fiscal 2019, excluding transition tax payments under the Tax Cuts and Jobs Act. For the fourth quarter of fiscal 2018, our non-GAAP income tax expense is presented in a manner that excludes the tax impact of non-GAAP adjustments calculated using the applicable tax rates in the jurisdictions where the adjustments occurred, tax adjustments in accordance with ASC 740-270, and one-time tax events. Following our required adoption of the new revenue recognition standard effective April 1, 2018, we disclose "end market demand" which is the net dollar amount of our products, licensing revenue and other services delivered to our direct (non-distributor) customers and by our distributors to their customers. Our determination of our non-GAAP measures might not be the same as similarly titled measures used by other companies, and it should not be construed as a substitute for amounts determined in accordance with GAAP. There are limitations associated with using non-GAAP measures, including that they exclude financial information that some may consider important in evaluating our performance. Management compensates for this by presenting information on both a GAAP and non-GAAP basis for investors and providing reconciliations of the GAAP and non-GAAP results. Reconciliations of certain of our non-GAAP and GAAP results are available on our website at www.microchip.com/investors.

3© June 2019
Q1FY20 Business Update
We have no guidance update since our earnings call of May 8th
The rhetoric on tariffs has gotten more negative since our May 8th call
Since May 8th the Huawei shipment ban was announced and is in effect Huawei represents between 1% and 2% of our
revenue The rest of our business is progressing
as expected

4© June 2019
Corporate Overview● Leading Total Systems Solutions provider:
● High-performance standard and specialized Microcontrollers, Digital Signal Controllers and Microprocessors
● Mixed-Signal, Analog, Interface and Security solutions● Clock and Timing solutions● Wireless and Wired Connectivity solutions● FPGA solutions● Non-volatile EEPROM and Flash Memory solutions● Flash IP solutions
● ~ $5.5 billion in revenue ● ~ 18,200 employees● Headquartered near Phoenix in Chandler, AZ

5© June 2019
Our Vision
Be The Very Best Embedded Control Solutions Company Ever

6©June 2019
Annual End Market Demand Growth$
Mill
ion
114 consecutive quarters of profitability!

7© June 2019
Worldwide Microcontroller Market Share
Based on dollar shipment volume 2003-2018, Source: Gartner and Microchip
2003 2008 2009 2010 2014 2016 2017 2018No. Rank Rank Rank Rank Rank Rank Rank Rank
1 Renesas Renesas Renesas Renesas Renesas Renesas Renesas Renesas
2 Motorola NEC NEC Freescale Freescale NXP NXP NXP
3 NEC Freescale Freescale Samsung ST-Micro Microchip Microchip Microchip
4 Matsushita Infineon Samsung Microchip Microchip ST-Micro ST-Micro ST-Micro
5 Infineon Samsung Microchip Atmel NXP TI TI TI
6 Fujitsu Microchip TI TI TI Infineon Infineon Infineon
7 Toshiba ST-Micro Infineon Infineon Infineon Cypress Cypress Cypress
8 Microchip TI ST-Micro ST-Micro Atmel Samsung Samsung Samsung
9 Samsung Fujitsu Fujitsu Fujitsu Spansion CEC Huada Toshiba Toshiba
10 ST-Micro NXP NXP NXP Samsung Toshiba Si-Labs CEC Huada
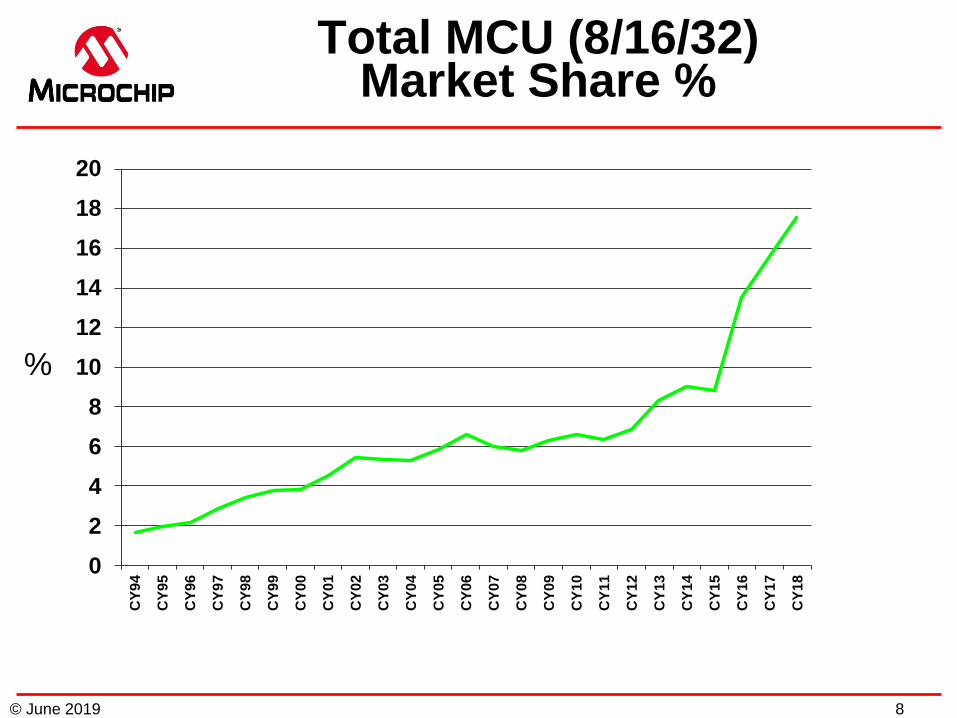
8© June 2019
Total MCU (8/16/32) Market Share %
02468
101214161820
CY9
4
CY9
5
CY9
6
CY9
7
CY9
8
CY9
9
CY0
0
CY0
1
CY0
2
CY0
3
CY0
4
CY0
5
CY0
6
CY0
7
CY0
8
CY0
9
CY1
0
CY1
1
CY1
2
CY1
3
CY1
4
CY1
5
CY1
6
CY1
7
CY1
8
%

9© June 2019
Analog End Market Demand Growth$
Mill
ion

10©June 2019
Microchip 2.01. Total System Solution in Embedded Control2. Leading customer preference to design with our MCUs3. Multiple growth drivers4. Non-GAAP gross margin target of 63% of end market
demand with multiple drivers5. Non-GAAP operating expense target of 22.5% of end
market demand6. End market mix skewed to Industrial and Automotive for
classic Microchip, augmented by Microsemi7. Microsemi adds complementary focus on Aerospace &
Defense, Computing/Datacenter & Communication8. Long-term model with industry leading operating profits

11© June 2019
Microcontrollers, Wireless, Touch,
Automotive, Security and Memory
2008 2009 2010 2011 2012 2013 2014
Expanding Microchip Solutions Through Acquisitions
Hampshire
Touch Screen Controllers
Security & LifeSafety ASICs
Low-Power Embedded
Wi-Fi®
High-Density Flash & IP
Motor Drive Products
Development ToolsCompiler
Assembly & Test Capacity Expansion
LSSHigh-Speed
ADCs
3D Gesture Capture& Proximity Detect
Bluetooth® & Embedded Wi-Fi®
MOST®, USB & Ethernet Wireless
Audio PC Controllers
Non-volatile Memory IP
Equalizer & Coaxial
Transceiver Products
High-Voltage Analog & Mixed-Signal Products
Bluetooth®Low Energy
2015
Analog & mixed-signal, timing, power management
2016 2018
FPGAs, SoCs, ASICS, Power,
PoE, Timing and Storage systems

12© June 2019
Providing TotalSystem Solutions
Wireless• Wi-Fi®• Bluetooth®
• LoRa®
• ZigBee® /MiWi™
PowerDrivers
MotorDrivers
Encryption&
Security
LEDDrivers
Amplifiers
Sensors
Filters A/D
D/A
PrecisionVoltage
Reference
Auto/IndustrialCommunication• MOST®
• RS232/485 • CAN/LIN
DC-DC ConvertersSupervisors & Ref.LDOs, Battery Mgt.Discretes & Modules
Power Management
High VoltageI/Os
Memory•EEPROM•Serial Flash•Serial SRAM
RFICsMMICs
USB• Smart Hubs • Switches• Transceivers• Bridges
Smoke Detector& PiezoelectricHorn Drivers
Timing• Clocks • Timers• RTCC
Microcontrollers Microprocessors
FPGA/ SoCs
Ethernet • Switches• Controllers• EtherCAT• PHYs• PoE
Touch Sensing• Proximity/3D• Buttons/Slider• Touch Screen
OpticalNetworking
Storage• PCIe® Switches• Adapters• Controllers
Voice & Audio
Processing
Digital Potentiometer

13© June 2019
Revenue by End Market
Industrial28%
Automotive18%Consumer
16%
Computing15%
Communication13%
Aero & Defense
10%
Microchip is a top 10 semiconductor player in each of Automotive and Industrial markets
and # 1 in the world for Aero & Defense

14© June 2019
Financial Results, Guidance and Long-Term Model
Microchip does not utilize a GAAP long-term model. All figures are Non-GAAP. Figures prior to Q4 FY19 and are measured off of end market demand. In Q4 FY19, based on discussions with the SEC, Microchip changed to providing Non-GAAP guidance based on GAAP revenue. Excludes share-based compensation, acquisition related charges, non-recurring items. A reconciliation of our GAAP to non-GAAAP results is available at www.microchip.com.
Long Term Model Including MicrosemiGross Margin 63.0%Operating Expenses 22.5%Operating Margin 40.5%
Q1 FY20 Guidance from 5/8/19Net Sales $1,260 - $1,400Gross Margin % 61.8% - 62.2%Operating Expense % 25.3% to 26.3%Operating Margin 35.5% to 36.9%Diluted EPS $1.26 - $1.49
Q1 FY17 Q2 FY17 Q3 FY17 Q4 FY17 Q1 FY18 Q2 FY18 Q3 FY18 Q4 FY18 Q1 FY19 Q2 FY19 Q3 FY19 Q4 FY19Non-GAAP Net Sales $844.0 $873.8 $881.2 $902.7 $972.1 $1,012.1 $994.2 $1,002.3 $1,216.8 $1,513.3 $1,416.0 $1,329.8Gross Profit $471.1 $499.9 $509.7 $534.7 $587.2 $617.8 $610.6 $618.4 $756.7 $933.7 $881.1 $826.9Gross Margin 55.8% 57.2% 57.8% 59.2% 60.4% 61.0% 61.4% 61.7% 62.2% 61.7% 62.2% 62.2%Operating Expenses $240.0 $233.6 $220.6 $213.6 $222.9 $227.3 $218.9 $222.8 $283.2 $354.5 $351.1 $342.8Operating Income $231.1 $266.3 $289.1 $321.2 $364.3 $390.5 $391.7 $395.6 $473.5 $579.3 $530.0 $484.1Operating Margin 27.4% 30.5% 32.8% 35.6% 37.5% 38.6% 39.4% 39.5% 38.9% 38.3% 37.4% 36.4%Net Income $194.0 $219.6 $246.5 $276.9 $319.1 $344.1 $341.2 $351.3 $405.8 $454.6 $405.6 $370.4Diluted EPS $0.84 $0.94 $1.05 $1.16 $1.31 $1.41 $1.36 $1.40 $1.61 $1.81 $1.66 $1.48EBITDA $264.1 $298.8 $321.3 $356.5 $395.6 $422.5 $425.9 $429.6 $537.5 $574.0 $556.3 $544.4
Actual Results

15©June 2019
Summary
A consistent revenue grower and market share gainer with multiple growth drivers
High margin business model and shareholder friendly Microsemi integration and accretion ahead of schedule Executing on Microchip 2.0 - Total system solutions - Smart,
Connected and Secure Premium long-term non-GAAP financial model of 63% gross
margin, 22.5% operating expenses and 40.5% operating income based on end market demand

Thank You!