presentation thailand focusegco.listedcompany.com/.../20120829-egco-roadshow… · ·...
TRANSCRIPT

Corporate Presentation
29 August 2012
1

This presentation was made from the analysis of reliable information in order to assist
investment community to better understand the company's financial status and operation. It
also supports the "Good Corporate Governance Project" of the Securities and Exchange
Commission (SEC).
However, the information within this presentation has been derived from the existing factors in
the present time. Therefore, the forward-looking information on this presentation may not occur
in the future if the aforementioned factors or situations are changed. Investors are, however,
required to use their own discretion regarding the use of information contained in this
presentation for any purpose. For further information, please contact Investor Relations Section
of the Electricity Generating Public Company Limited (EGCO) at Tel: (662) 998-5145-8 or Email:
Disclaimer
2
AgendaThailand Electricity’s Overview EGCO Group’s Overview Financial Performances
• Thailand Electricity’s Overview
• EGCO Group’s Overview
• Financial Performances
3

IPP
2
End Users
EGAT Transmission
EGAT
MEA Direct Customers
PEA
IMPORT SPP
Re
gu
lato
rs
Source: EPPO and EGAT
Current Electricity Supply Industry
EGAT: Electricity Generating Authority of Thailand IMPOPRT: Purchasing from Laos & Malaysia
IPP: Independent Power Producer MEA: Metropolitan Electricity Authority
SPP: Small Power Producer PEA: Provincial Electricity Authority
Thailand Electricity’s Overview EGCO Group’s Overview Financial Performances
4

� As of 30 June 2012, Thailand’s Power Installed Capacity was 31,451 MW.
Thailand’s Power Generation
5
Thailand Electricity’s Overview EGCO Group’s Overview Financial Performances
48%
38%
7%
7%
EGAT 15,010 MW
IPP 12,082 MW
SPP 2,174 MW
IMPORT 2,185 MW
31,451 MW

18,000
23,000
28,000
January Februaary March April May June July August September October November December
2008 2009 2010 2011 2012
Peak Demand Comparison
6
26,121.10 MW
(26 April 2012)
23,900.21 MW
(24 May 2011)
+ 9.3%
Thailand Electricity’s Overview EGCO Group’s Overview Financial Performances

7
Thailand’s Power Generation (PDP 2010 Revision 3)
48%
38%
7%7%
41%
19%
27%
12%
42%
21%
24%
12%
PDP 2010 R. 330 June 2012
(31,451 MW) (55,130 MW) (70,686 MW)
* Including total retired plants of 15,894 MW
2030*
Thailand Electricity’s Overview EGCO Group’s Overview Financial Performances
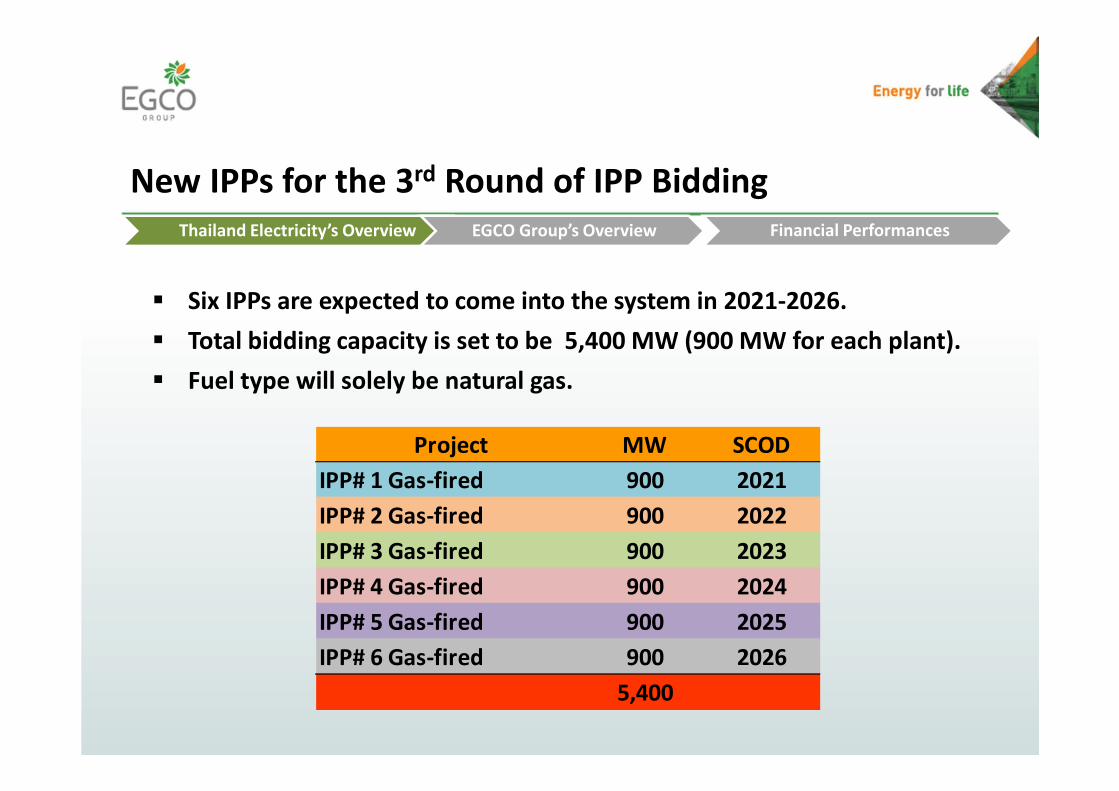
New IPPs for the 3rd Round of IPP Bidding
� Six IPPs are expected to come into the system in 2021-2026.
� Total bidding capacity is set to be 5,400 MW (900 MW for each plant).
� Fuel type will solely be natural gas.
Project MW SCOD
IPP# 1 Gas-fired 900 2021
IPP# 2 Gas-fired 900 2022
IPP# 3 Gas-fired 900 2023
IPP# 4 Gas-fired 900 2024
IPP# 5 Gas-fired 900 2025
IPP# 6 Gas-fired 900 2026
5,400
Thailand Electricity’s Overview EGCO Group’s Overview Financial Performances

Agenda
9
Thailand Electricity’s Overview EGCO Group’s Overview Financial Performances
• Thailand Electricity’s Overview
• EGCO Group’s Overview
• Financial Performances

EGAT
25.41%
TEPDIA
23.94%
Thai Investors
19.35%
Foreign Investors
20.87%
NVDR 10.43%
10
EGCO’s Shareholders
TEPCO
50%
Mitsu-
bishi
50%
As of March 16, 2012
* Nuclear Damage Liability Facilitation Fund
NDF*
50.11%
Others
49.89%
NVDR 10.43%

EGCO’s Board of Directors
11
Thailand Electricity’s Overview EGCO Group’s Overview Financial Performances
BOD
EGAT
4 seats
TEPDIA
4 seats
Independent
Directors
6 seats
President
1 seat

EGCO Group’s Business Lines
� EGCO Group’s business lines can be categorized into 3 business groups:
Power Business
To develop and acquire power plants with multiple fuel types.
Service Business
Other Business
To provide operation, maintenance, engineering and
construction services to power plants and other industries.
To invest in water businesses that supply raw and tap water.
12
Thailand Electricity’s Overview EGCO Group’s Overview Financial Performances
13
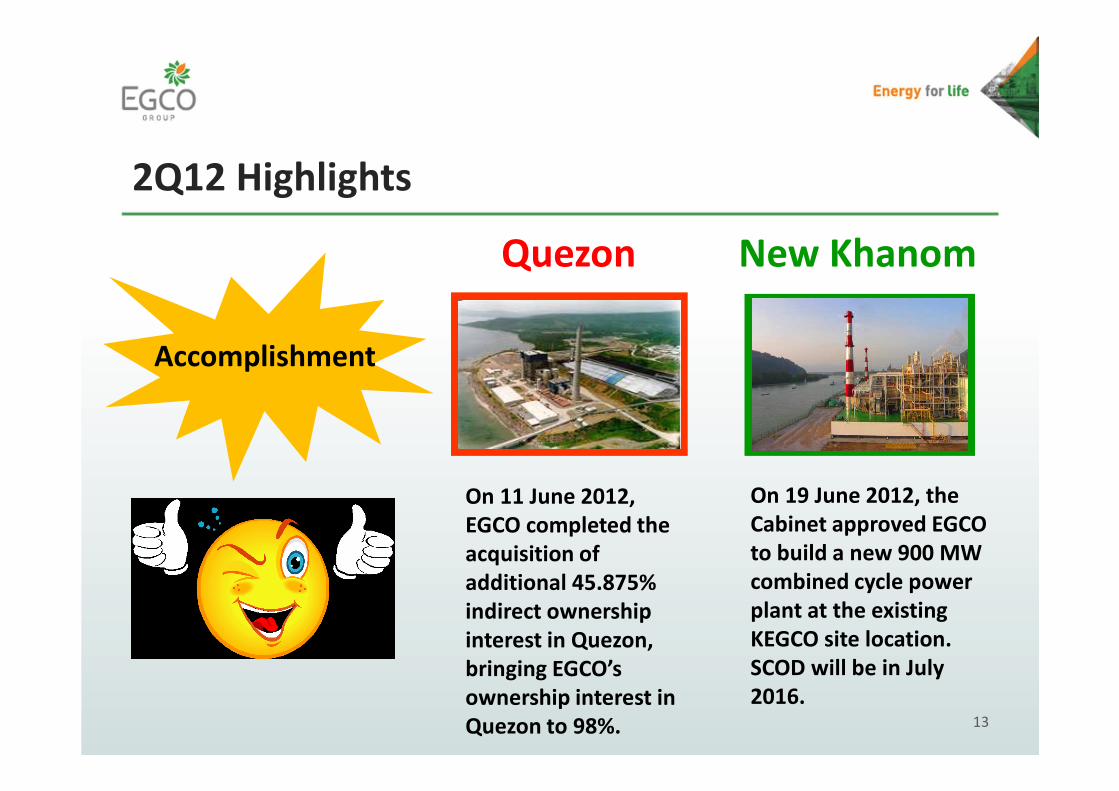
2Q12 Highlights
On 19 June 2012, the
Cabinet approved EGCO
to build a new 900 MW
combined cycle power
plant at the existing
KEGCO site location.
SCOD will be in July
2016.
On 11 June 2012,
EGCO completed the
acquisition of
additional 45.875%
indirect ownership
interest in Quezon,
bringing EGCO’s
ownership interest in
Quezon to 98%.
Accomplishment
Quezon New Khanom

14
Post 2Q12 Highlight
� 16 August Acquired 40% stake in Manambang Muara Enim
Coal Mine (MME)
Type: Open-pit coal mine
Reserve: 140 Million Tons
Coal Type: Sub-bituminous (5,800 kCal/kg)
Location: Muara Enim Regency , South Sumatra
Republic of Indonesia
COD: March 2010
Concession Time: 28 years starting from March 2010MME

15
EGCO Group’s Power Plants Portfolio
Operating Plants Under Development Plants
4,708 MW 1,483 MW
Power
Plant
Equity
MW
Power
Plant
Equity
MW
Power
Plant
Equity
MW
Rayong 1,232 Quezon 493 NED (Expansion) 3
KEGCO 749 Conal-WMPC 19 GPS (4) 4
BLCP 717 Conal-SPPC 10 TWF 12
EGCO Cogen 94 NTPC (NT2) 380 YEH 28
GPG (KK2) 755 NED 18 Khanom 900
GCC 55 SPP2 8 TJ Cogen 125
NKCC 63 SPP3 8 TP Cogen 125
SCC 63 SPP4 6 SK Cogen 125
GYG 12 SPP5 8 XPCL 161
Roi-Et Green 7 GPS (1-3) 12
� As of 30 June 2012, EGCO Group’s portfolio comprised 20 operating power plants and
9 in development, bringing EGCO’s total portfolio to 6,191 MW.
47
1,483
900
125 125
125
161
-
500
1,000
1,500
2,000
2,500
MW
16
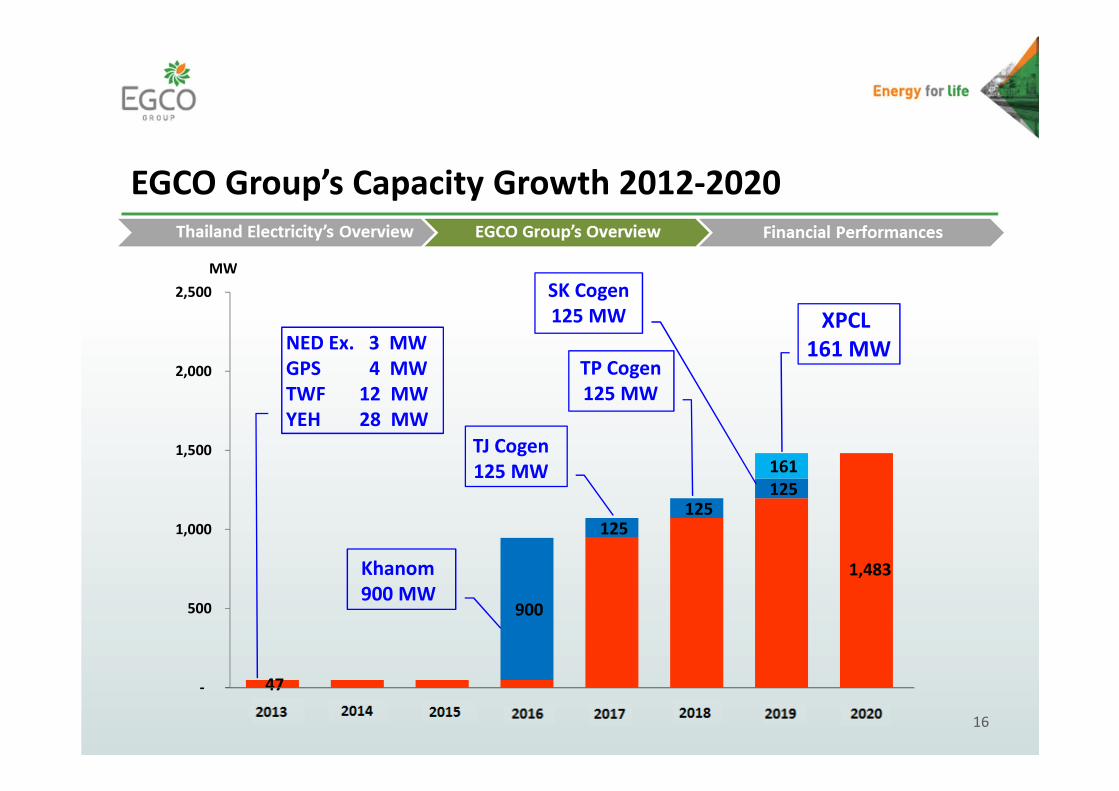
EGCO Group’s Capacity Growth 2012-2020
TP Cogen
125 MW
Khanom
900 MW
TJ Cogen
125 MW
SK Cogen
125 MW XPCL
161 MWNED Ex. 3 MW
GPS 4 MW
TWF 12 MW
YEH 28 MW

17
EGCO Group’s Opportunities Outlook
Domestic
Prospects
International
Prospects
New Business
Lines
Strategic
Project
Acquisition
IPP
Bidding
Cross Border Projects
for Imported Power
Renewable
Energy
Development
& Acquisition
Projects in key ASEAN
countries & regional
market
Quezon
Expansion
Integrated energy business
(Local & International)
SPP
Develop
-ment
IPP and Captive
Power Projects

Agenda
18
Thailand Electricity’s Overview EGCO Group’s Overview Financial Performances
• Thailand Electricity’s Overview
• EGCO Group’s Overview
• Financial Performances

1,703 1,893
61 93
4,310
1,000
2,000
3,000
4,000
5,000
6,000
7,000
2Q11 2Q12
1,681 1,874
68 89
4,310
1,000
2,000
3,000
4,000
5,000
6,000
7,000
2Q11 2Q12
2Q11 VS 2Q12
1,749 1,963
+214 or
12.24 %
6,273
Baht Million
Net Profit Net Profit before FX
1,764 1,986
+222 or
12.59%
6,296
Baht Million
Thailand Electricity’s Overview EGCO Group’s Overview Financial Performances
19
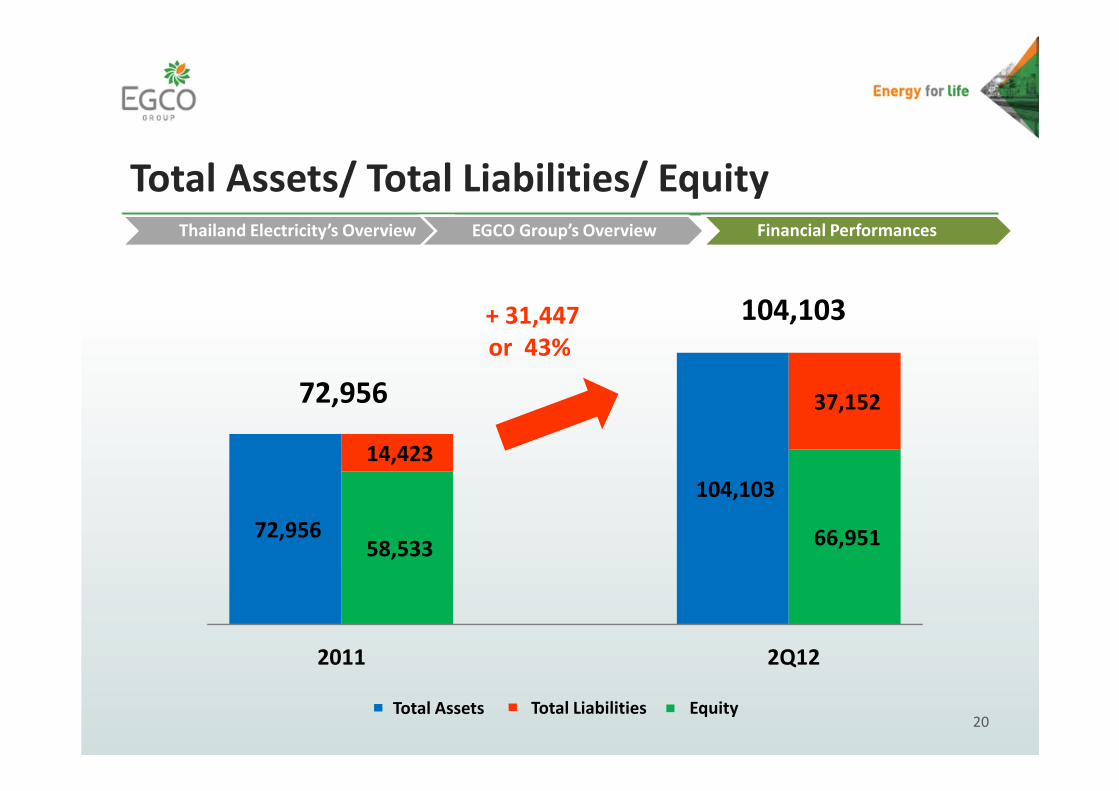
72,956
104,103
58,533 66,951
14,423
37,152
Total Assets/ Total Liabilities/ Equity
2Q122011
104,103+ 31,447
or 43%
72,956
Total Assets Total Liabilities Equity
Thailand Electricity’s Overview EGCO Group’s Overview Financial Performances
20
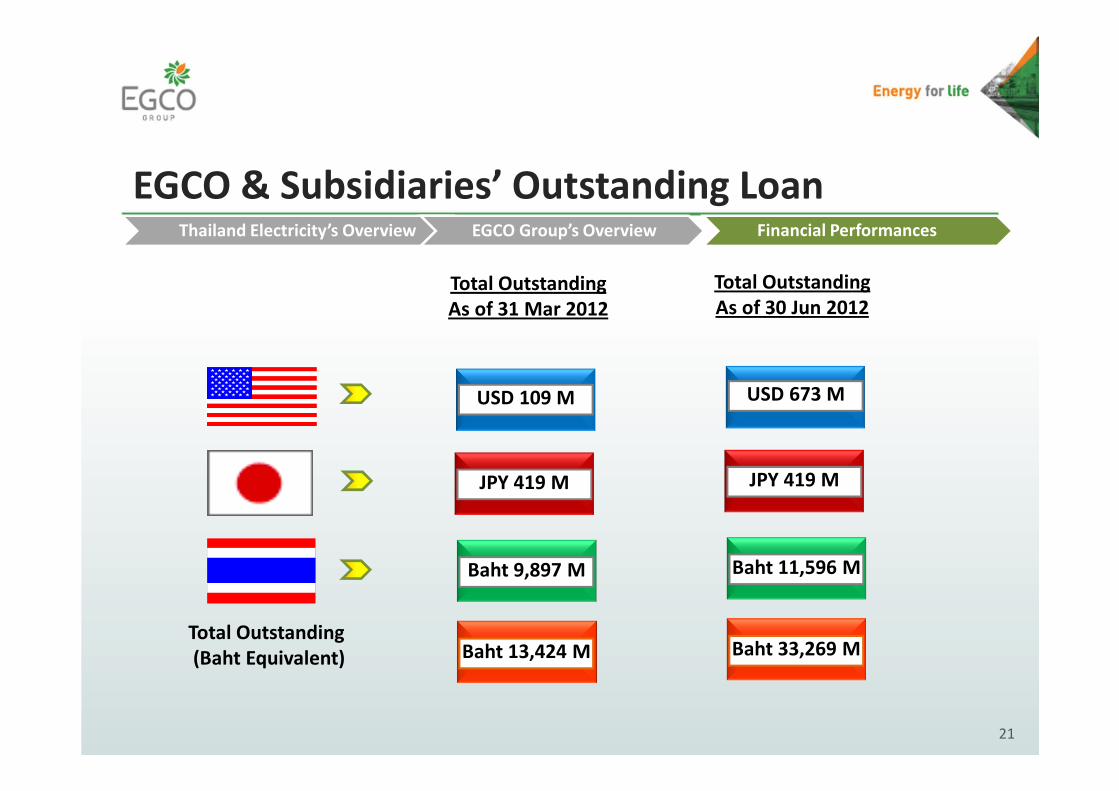
EGCO & Subsidiaries’ Outstanding Loan
USD 673 M
Baht 11,596 M
JPY 419 M
Total Outstanding
(Baht Equivalent) Baht 33,269 M
Total Outstanding
As of 31 Mar 2012
USD 109 M
Baht 9,897 M
JPY 419 M
Baht 13,424 M
Total Outstanding
As of 30 Jun 2012
21
Thailand Electricity’s Overview EGCO Group’s Overview Financial Performances
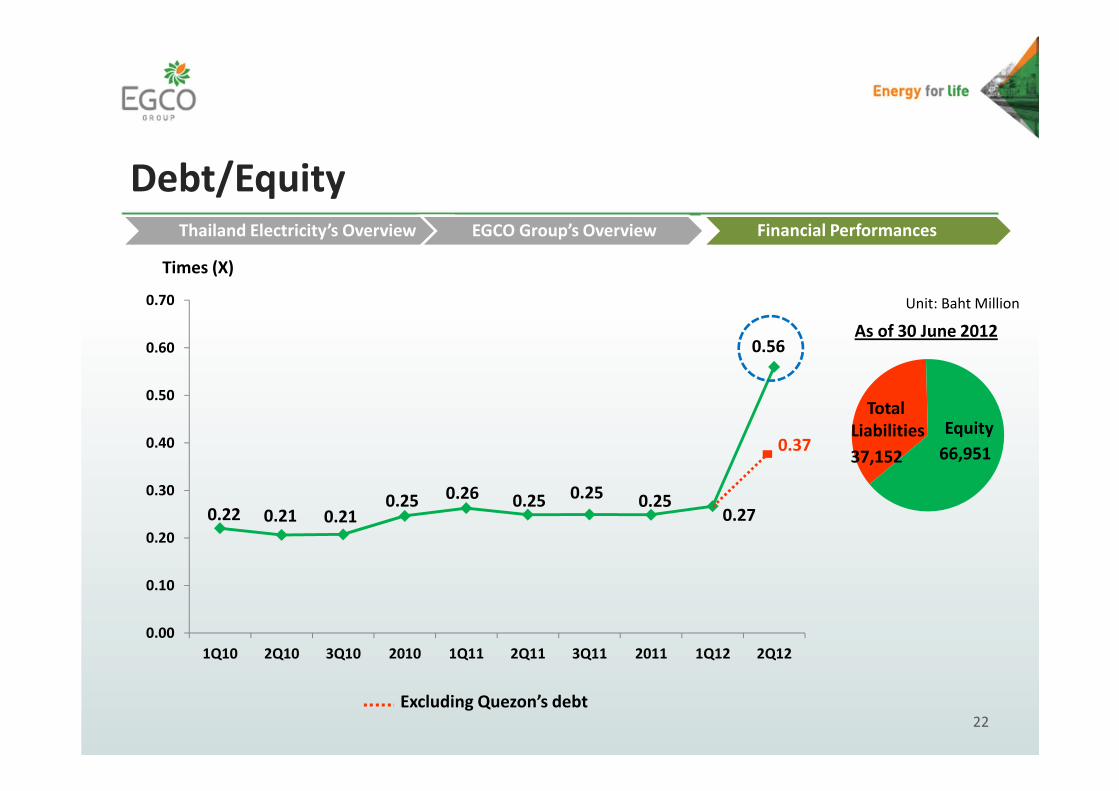
0.22 0.21 0.210.25 0.26 0.25 0.25 0.25
0.27
0.56
0.00
0.10
0.20
0.30
0.40
0.50
0.60
0.70
1Q10 2Q10 3Q10 2010 1Q11 2Q11 3Q11 2011 1Q12 2Q12
Debt/Equity
Times (X)
22
Unit: Baht Million
37,152 66,951
EquityTotal
Liabilities
As of 30 June 2012
0.37
Excluding Quezon’s debt
Thailand Electricity’s Overview EGCO Group’s Overview Financial Performances

Historical Dividend Payment
23
EGCO has a policy to pay dividend at approximately 40% of the consolidated
net profit after tax, or to increase the dividend amount in a steady manner.
Thailand Electricity’s Overview EGCO Group’s Overview Financial Performances
1.00 1.25 1.25 1.50 1.502.00 2.25 2.50 2.50 2.50 2.50 2.75
1.251.25 1.50
1.50 1.75
2.00
2.502.50 2.75 2.75 2.75
0.00
1.00
2.00
3.00
4.00
5.00
6.00
2001 2002 2003 2004 2005 2006 2007 2008 2009 2010 2011 2012
Interim Final
2.25 2.502.75
3.003.25
4.00
4.755.00
5.25 5.25 5.25
2.75
Baht/ Share
24
THANK YOU
25
Appendix

New additional capacity (PDP 2010 Revision 3)
Source: EPPO, EGAT, June 2012 26
Thailand Electricity’s Overview EGCO Group’s Overview Financial Performances
Project MW Project MW Project MW Project MW Project MW Project MW
2012 Others 30 Gheco-One 660 SPP 254 VSPP 8 Renewable 699 Theun-Hin Boun Exp (Jun) 220
2013 Others 19 SPP 1,170 VSPP 16 Renewable 1,021
2014 Wang Noi CC # 4 769 GULF JP NS#1-2 1,600 SPP 270 VSPP 16 Renewable 661
Chana # 2 782
Solar 5
2015 North Bkk # 2 900 GULF JP UT#1-2 1,600 SPP 540 VSPP 17 Renewable 682 Hong Sa #1-2 (Jun,Now) 982
Others 70
2016 Others 5 National Power#1-2 270 SPP 450 VSPP 21 Renewable 984 Hong Sa #3 (Mar) 491
KEGCO (New) (Jul) 900
2017 Lam Takhong Pumped 500 National Power#3-4 270 SPP 900 Renewable 510
Others 25
2018 New Plant_ Replaced SPP 720 VSPP 1 Renewable 366 NamNgiep 1 (Jan) 269
Others 24 Xe-pian (Aug) 390
2019 Coal-Fired Plant TH # 1 800 SPP 720 VSPP 5 Renewable 442 Xaiyaburi (Oct) 1,220
Others 54
2020 Others 6 SPP 90 Renewable 436
2021 Bang Pakong CC # 1 900 IPP#1 Gas-fired(New) 900 SPP 180 VSPP 1 Renewable 439 Neighboring 300
Others 3
2022 Bang Pakong CC # 2 900 IPP#2 Gas-fired(New) 900 SPP 180 VSPP 5 Renewable 287 Neighboring 300
Coal Plant # 2 TH 800
Others 1
2023 South BKK CC #1-2 1,800 IPP#3 Gas-fired(New) 900 SPP 180 Renewable 267 Neighboring 300
Others 14
RenewablePurchase From
Cogeneration Cogeneration Neighboring CountriesYearEGAT IPP / Private Players
SPP VSPP

27Source: EPPO, EGAT, June 2012
Thailand Electricity’s Overview EGCO Group’s Overview Financial Performances
Total New Additional Capacity as of 2030 = 55,130 MW
New additional capacity (PDP 2010 Revision 3)
Project MW Project MW Project MW Project MW Project MW Project MW
2024 South BKK CC # 3 900 IPP#4 Gas-fired(New) 900 SPP 180 VSPP 1 Renewable 272 Neighboring 300
Bang Pakong CC # 3 900
Ohters 2
2025 Coal Plant TH # 3 800 IPP#5 Gas-fired(New) 900 SPP 180 VSPP 5 Renewable 254 Neighboring 300
Bang Pakong CC # 4 900
Others 4
2026 Bang Pakong CC #5 900 IPP#6 Gas-fired(New) 900 SPP 180 Renewable 252 Neighboring 300
Nuclear Plant # 1 1,000
Others 2
2027 Wang Noi CC # 1 900 SPP 180 VSPP 1 Renewable 252 Neighboring 300
Bang Pakong CC # 6 900
Nuclear Plant # 2 1,000
Others 62
2028 Wang Noi CC # 2-3 1,800 VSPP 5 Renewable 252 Neighboring 300
Coal Plant TH # 4 800
Gas Turbine # 1 250
Others 18
2029 South BKK CC # 4 900 Renewable 252 Neighboring 300
New Plant CC # 1 900
Gas Turbine # 2 250
Others 14
2030 New Plant CC # 2 900 VSPP 1 Renewable 252 Neighboring 300
Gas Turbine # 23 250
Others 41
Total 22,801 10,700 6,374 103 8,580 6,572
RenewablePurchase From
Cogeneration Cogeneration Neighboring CountriesYearEGAT IPP / Private Players
SPP VSPP

16.1%
18.3%17.6%
16.6%
24.1%
21.3%
19.5%
18.7% 18.1% 17.9%16.9%
16.4%16.3% 16.4% 16.5%16.2% 16.4%
16.4%16.1%
0.0%
5.0%
10.0%
15.0%
20.0%
25.0%
-
1,000
2,000
3,000
4,000
5,000
6,000
7,000
8,000
2012 2013 2014 2015 2016 2017 2018 2019 2020 2021 2022 2023 2024 2025 2026 2027 2028 2029 2030
28
Reserve Margins: (PDP 2010 Revision 3)
� Average Reserve Margins during 2012-2030 are expected to be 16-17%.
Thailand Electricity’s Overview EGCO Group’s Overview Financial Performances
1,267
Reserve Margins MW
EGAT Private Sector New IPP SPP-Cogen Renewable Neighboring Countries
Khanom

68%
17%
12%
3%
Thailand’s Power Generation classified by fuel type
29
Thailand Electricity’s Overview EGCO Group’s Overview Financial Performances
� Natural Gas is the primary source of fuel for Thailand’s Power Generation.
* OTHERS = Fuel Oil, Diesel, Renewable
NATURAL GAS 21,308 MW
HYDRO 5,321 MW
COAL 3,896 MW
OTHERS* 926 MW
*
31,451 MW

EGCO Group’s Power Plants Portfolio (1994-2020)
30
(75)
(1,232) (778)
(42) (10) (7)
-1,500
-1,000
-500
-
500
1,000
1,500
2,000
2,500
3,000
3,500
4,000
4,500
5,000
1994 1995 1996 1997 1998 1999 2000 2001 2002 2003 2004 2005 2006 2007 2008 2009 2010 2011 2012 2013 2014 2015 2016 2017 2018 2019 2020
Rayong KEGCO #1, 2,3 GCC SCC CONAL-WMPC CONAL-SPPC AEP
NMPC #1, 2 NKCC APB EGCO Cogen Roi-Et Green BLCP #1, 2 GYG
GPG (KK2) #1, 2 QPL #1, 2, 3, 4 NTPC (NT2) #1-6 NED #1,2 SPP4 SPP3 SPP2
SPP5 GPS # 1-4 TWF YEH New KEGCO TJ Cogen TP Cogen
SK Cogen XPCL KEGCO #1 Retire Rayong Retire KEGCO #2, 3 Retire AEP Divestment APB Divestment
Thailand Electricity’s Overview EGCO Group’s Overview Financial Performances
Rayong
KEGCO
BLCP
QuezonKhanom
NMPC#1 Retired
NMPC#2 RetiredAEP (25), AEB (17)
Divestment
KEGCO Barge # 1
Retired
Rayong
Retired
KEGCO (749), CONAL:
WMPC (19), SPPC (10)
Retired
1994: 1,232 MW2020: 4,126 MW
KK2
NTPC
(55)
GCC Retired

Natural Gas
69%
Renewable
2%
Coal
20%
Hydro
8%
Diesel
1%
31
EGCO Group’s Power Plants classified by Fuel Type
Rayong, KEGCO,
GEC-GPG (KK2)
EGCO Cogen,
GEC-GCC, GEC-NKCC
GEC-SCC, Khanom,
TJ Cogen, TP Cogen,
SK Cogen
GEC-GYG,
Roi-Et Green
NED, SPP2
SPP3, SPP4,
GPS (#1-4),
SPP5, TWF, YEH
BLCP, Quezon
NTPC (NT2), XPCL
Conal-WMPC,
Conal-SPPCTotal 6,191 MW

6,927
7,936
6,803
4,990
1,6901,963
7,491 7,505
6,264
5,301
1,487
1,986
0
1,000
2,000
3,000
4,000
5,000
6,000
7,000
8,000
9,000
2008 2009 2010 2011 1Q12 2Q12
Net Profit Net Profit before FX
Unit : Million Baht
32
Net Profit before FX & Net Profit
Historical Net Profit before FX & Net ProfitThailand Electricity’s Overview EGCO Group’s Overview Financial Performances
Baht Million

EGCO’s Financial Performances
33
53,600
11,604
58,330
12,788
62,920
11,826
67,040
11,712
72,956
14,423
76,255
15,936
41,996 45,542
51,094 55,328
58,533 60,319
-
10,000
20,000
30,000
40,000
50,000
60,000
70,000
80,000
90,000
Total Assets/ Total Liabilities & Equity
Unit : Million Baht
2007 2008 2009 2010 2011 1Q12
Total Assets Total Liabilities Equity

Company Cash Flow Summary
34
6M12
Beginning Balance of Cash and Cash Equivalents 5,674
Net Cash Received from (Payments in) Operating Activities
Profit before corporate income tax 1,766
Depreciation 523
Dividend received from subsidiaries and JVs (1,827)
Others (197) 266
Net Cash Received from (Payments in) Investing Activities
Investment in subsidiaries & JVs (11,179)
Net cash received from short-term investments 1,575
Dividend received from subsidiaries and JVs 1,870
Cash payment in long-term loans to a related party (465)
Others (387) (8,586)
Net Cash Received from (Payments in) Financing Activities
Proceed from long-term loans from financial institution 6,326
Dividend paid to shareholders (1,447)
Others (206) 4,673
Ending Balance of Cash and Cash Equivalent 2,027