presentation studio - morningstar,...
TRANSCRIPT

Presentation Studio Fact Sheet Samples for Single Investments

Monthly Manager A Analysis - As of 5/31/2012Qualita�ve Analyst Commentary
This is a good loca�on to enter you custom analysis. These notes can be saved
within the Direct product and referenced in each report or report template.
These notes can be shared across the pla�orm if you should choose.
Once a template is created and approved by compliance, or any other in house
process that may exist, it can be accessed a number of different ways. These
reports or templates can be run using a batch scheduler and distributed. These
can also be accessed through a publishing tool that would allow each individual
rep to access a comparison or report template and run it on an adhoc basis.
All templates or reports will have the ability to combine in house research along
with customized charts, graphs and data tables. The ability to combine your
qualita�ve notes and your in house data with exis�ng Morningstar data will
provide you with a very efficient way of ge�ng quality, �mely informa�on to
your field folks. We can discuss this in greater detail if interested
Investment Growth
Time Period: 6/1/2007 to 5/31/2012
11/2007 5/2008 11/2008 5/2009 11/2009 5/2010 11/2010 5/2011 11/2011 5/201237.0
46.0
55.0
64.0
73.0
82.0
91.0
100.0
109.0
118.0
127.0
136.0
Manager A S&P 500 TR
Returns
Re
turn
YTD 1 YR 2 YR 3 YR 4 YR 5 YR8.0
6.0
4.0
2.0
0.0
2.0
4.0
6.0
8.0
10.0
12.0
14.0
16.0
Manager A S&P 500 TR
Drawdown
Time Period: 6/1/2007 to 5/31/2012
11/2007 5/2008 11/2008 5/2009 11/2009 5/2010 11/2010 5/2011 11/2011 5/201255.0
50.0
45.0
40.0
35.0
30.0
25.0
20.0
15.0
10.0
5.0
0.0
Manager A S&P 500 TR
Rolling Performance vs. Peers
Time Period: 6/1/2005 to 5/31/2012
1st to 25th Percen�le 26th Percen�le to Median 51st to 75th Percen�le 76th to 100th Percen�le
Re
turn 06 09 12
2009
03 06 09 12
2010
03 06 09 12
2011
03 06 09 12
2012
03100.0
75.0
50.0
25.0
0.0
Manager A S&P 500 TR
Trailing Returns
YTD 1 YR 2 YR 3 YR 5 YR 7 YR
Manager A
S&P 500 TR
6.30
5.16
6.50
0.41
3.54
12.00
7.04
14.92
1.41
0.92
4.42
3.52
Calendar Year Returns
YTD 2011 2010 2009 2008 2007
Manager A
S&P 500 TR
6.30
5.16
16.94
2.11
15.99
15.06
15.87
26.46
28.21
37.00
38.49
5.49
Source: Morningstar Direct

ReturnsBased Style
Time Period: 6/1/2004 to 5/31/2012
Russell Top 200
Value TR USD
Russell Top 200
Growth TR USD
Russell Mid Cap
Value TR USD
Russell Mid Cap
Growth TR USD
Russell 2000
Value TR USD
Russell 2000
Growth TR USD
Manager A S&P 500 TR
HoldingsBased Style
Mic
roS
ma
llM
idLa
rge
Gia
nt
DeepVal CoreVal Core CoreGrth HighGrth
Manager A 3/31/2012 S&P 500 TR 5/31/2012
HoldingsBased Style Trail
Time Period: 6/30/2005 to 5/31/2012
Mic
roS
ma
llM
idLa
rge
Gia
nt
DeepVal CoreVal Core CoreGrth HighGrth
Manager A 6/30/2005 3/31/2012 S&P 500 TR 6/30/2005 5/31/2012
Equity Sectors
Por�olio Date: 3/31/2012
So�ware Hardware Media Telecom Healthcare Cons Serv Bus Serv Finl ServCons
GoodsIndus Mat Energy U�li�es
Manager A
S&P 500 TR
0.00 4.14 0.49 0.00 0.00 0.00 13.04 26.56 48.57 0.31 6.89 0.00
4.20 10.64 3.17 6.74 11.22 8.75 3.18 15.31 11.00 11.21 11.28 3.30
RiskReward
Time Period: 6/1/2007 to 5/31/2012
Re
turn
Std Dev
0.0 4.0 8.0 12.0 16.0 20.0 24.0 28.0
5.0
3.0
1.0
1.0
3.0
5.0
7.0
Manager A S&P 500 TR
UpsideDownside Capture
Time Period: 6/1/2007 to 5/31/2012
Up
Ca
ptu
re R
a�
o
Down Capture Ra�o
0.0 20.0 40.0 60.0 80.0 100.0 120.0 140.0
0.0
30.0
60.0
90.0
120.0
150.0
Manager A S&P 500 TR
Market Performance
Time Period: 6/1/2007 to 5/31/2012
Up
Period
Percent
Down
Period
Percent
Ba�ng
AverageAlpha Beta
Informa�on
Ra�o
(geo)
Up
Capture
Ra�o
Down
Capture
Ra�o
Manager A
S&P 500 TR
51.67
55.00
48.33
45.00
50.00
100.00
2.69
0.00
0.87
1.00
0.18 95.16
100.00
86.99
100.00
Monthly Manager A Analysis - As of 5/31/2012
Source: Morningstar Direct

ABC Krone Investments Europa Euro
Operations
Fund Size
Annual Report Net Expense Ratio
Max Front Load
Deferred Load
Subadvised
Closed to New Inv
Enhanced Index
17,334,453.32
2.15
1.89
0.64
No
No
No
Manager Biography
Christian Meyer AM , Copenhagen since 9/19/2008
Trailing Returns
As of Date: 5/31/2012
ReturnExcessReturn
1 month3 months6 monthsYTD1 year3 years5 years10 years15 years
-4.25 1.82-2.10 5.6914.30 12.6011.02 11.41
0.08 11.8311.25 3.57-4.94 1.880.38 -0.672.05 -1.45
Risk
Time Period: 6/1/2007 to 5/31/2012
Inv Bmk1
Return
Std Dev
Downside Deviation
Alpha
Beta
R2
Sharpe Ratio (arith)
Tracking Error
-4.94
19.33
3.27
2.35
1.02
92.98
-0.39
5.20
-6.82
18.25
0.00
0.00
1.00
100.00
-0.52
0.00
Performance
Time Period: 6/1/2007 to 5/31/2012
Inv Bmk1
Return
Std Dev
Excess Return
Information Ratio (arith)
R2
Tracking Error
-4.94
19.33
1.88
0.36
92.98
5.20
-6.82
18.25
0.00
100.00
0.00
Market Performance
Time Period: 6/1/2007 to 5/31/2012
Inv Bmk1Up Period PercentDown Period PercentBest MonthWorst MonthBest QuarterWorst QuarterUp Capture RatioDown Capture RatioR2
46.6753.3314.26
-14.7018.03
-21.98106.98
97.9692.98
41.6758.3314.17
-12.7618.57
-21.98100.00100.00100.00
Manager A Europa - Snapshot
Investment Area
Annual Report Net Expense Ratio
Exchange
Primary Prospectus Benchmark
Morningstar Rating Overall
Fund Legal Structure
Broad Category Group
Base Currency
Region of Sale
Europe
2.15
OMX NORDIC EXCHANGE COPENHAGEN A/S
MSCI Europe NR USD
ÙÙÙÙ
Open Ended Investment Company
Equity
Danish Krone
Denmark
Investment Strategy
ABC Krone Investments Europa investerer i minimum 17 selskaber. Den valgte strategi skal give porteføljemanageren mulighed for at skabe et afkast, der ligger over benchmark. Samtidigt vil restriktionerne og antallet af aktier være medvirkende til at fastholde et acceptabelt risikoniveau. ABC Krone Investments anbefaler en investeringshorisont på minimum 4 år, da kursudsvingene på det europæiske aktiemarked i perioder kan være relativt store.
ABC Krone Investments Europa Return Date: 5/31/2012 MSCI Europe NR USD

ABC Krone Investments Europa Euro
Rolling Beta
Time Period: 6/1/2007 to 5/31/2012
Rolling Window: 2 Years 1 Month shift
Top Quartile 2nd Quartile 3rd Quartile Bottom Quartile
Beta
05 06 07 08 09 10 11 12
2010
01 02 03 04 05 06 07 08 09 10 11 12
2011
01 02 03 04 05 06 07 08 09 10 11 12
2012
01 02 03 04 050.6
0.8
1.0
1.2
1.4
Manager A Europa MSCI Europe NR USD
Performance Relative to Peer Group
Peer Group (5-95%): Open End Funds - Europe/HKG/TWN/SGP - Europe Large-Cap Blend EquityRe
turn
YTD 2011 2010 2009 2008 2007-52.5-45.0-37.5-30.0-22.5-15.0-7.50.07.515.022.530.037.545.0
Manager A Europa MSCI Europe NR USD
Rolling Returns
Rolling Window: 2 Years 1 Month shift
Top Quartile 2nd Quartile 3rd Quartile Bottom Quartile
Retur
n 05 06 07 08 09 10 11 12
2010
01 02 03 04 05 06 07 08 09 10 11 12
2011
01 02 03 04 05 06 07 08 09 10 11 12
2012
01 02 03 04 05-40.0
-20.0
0.0
20.0
40.0
Manager A Europa MSCI Europe NR USD
Rolling Alpha
Time Period: 6/1/2007 to 5/31/2012
Rolling Window: 2 Years 1 Month shift
Top Quartile 2nd Quartile 3rd Quartile Bottom Quartile
Alph
a
05 06 07 08 09 10 11 12
2010
01 02 03 04 05 06 07 08 09 10 11 12
2011
01 02 03 04 05 06 07 08 09 10 11 12
2012
01 02 03 04 05-10.0
-5.0
0.0
5.0
10.0
Manager A Europa MSCI Europe NR USD
Rolling Excess Return
Rolling Window: 2 Years 1 Month shift
Top Quartile 2nd Quartile 3rd Quartile Bottom Quartile
Exce
ss R
eturn
(geo
)
05 06 07 08 09 10 11 12
2010
01 02 03 04 05 06 07 08 09 10 11 12
2011
01 02 03 04 05 06 07 08 09 10 11 12
2012
01 02 03 04 05-10.0
-5.0
0.0
5.0
10.0
Manager A Europa MSCI Europe NR USD
Calendar Year Returns
Data Point: Return
YTD
% ofPeer
GroupBeaten
2011
% ofPeer
GroupBeaten
2010
% ofPeer
GroupBeaten
2009
% ofPeer
GroupBeaten
2008
% ofPeer
GroupBeaten
2007
% ofPeer
GroupBeaten
Manager A Europa
MSCI Europe NR USD
Median
Average
5th Percentile
25th Percentile
50th Percentile
75th Percentile
95th Percentile
1.61
1.61
6.41
3.42
1.61
-0.29
-2.69
-10.42
-10.59
-3.19
-8.26
-10.42
-13.05
-17.90
11.32
11.30
19.11
13.82
11.32
8.55
3.21
29.38
29.58
39.90
33.11
29.38
25.71
18.66
-43.94
-43.26
-33.40
-40.82
-43.94
-46.05
-50.96
1.61
1.71
8.47
4.16
1.61
-0.98
-4.73
11.02
-0.39
-8.32
-8.08
14.36
11.10
27.58
31.60
-44.20
-43.65
2.16
2.69
100
22
75
77
78
47
37
66
46
54
56
62
ABC Krone Investments Europa Return Date: 5/31/2012 MSCI Europe NR USD

ABC Krone Investments Europa Euro
Rolling Tracking Error
Time Period: 6/1/2007 to 5/31/2012
Rolling Window: 2 Years 1 Month shift
Top Quartile 2nd Quartile 3rd Quartile Bottom Quartile
Track
ing Er
ror
05 06 07 08 09 10 11 12
2010
01 02 03 04 05 06 07 08 09 10 11 12
2011
01 02 03 04 05 06 07 08 09 10 11 12
2012
01 02 03 04 050.0
2.5
5.0
7.5
10.0
12.5
Manager A Europa MSCI Europe NR USD
Rolling Batting Average
Rolling Window: 2 Years 1 Month shift
Top Quartile 2nd Quartile 3rd Quartile Bottom Quartile
Batti
ng A
verag
e
05 06 07 08 09 10 11 12
2010
01 02 03 04 05 06 07 08 09 10 11 12
2011
01 02 03 04 05 06 07 08 09 10 11 12
2012
01 02 03 04 0529.2
46.9
64.6
82.3
100.0
Manager A Europa MSCI Europe NR USD
Rolling Information Ratio
Time Period: 6/1/2007 to 5/31/2012
Rolling Window: 2 Years 1 Month shift
Top Quartile 2nd Quartile 3rd Quartile Bottom Quartile
Inform
ation
Rati
o (ari
th)
05 06 07 08 09 10 11 12
2010
01 02 03 04 05 06 07 08 09 10 11 12
2011
01 02 03 04 05 06 07 08 09 10 11 12
2012
01 02 03 04 05-2.3
-1.5
-0.8
0.0
0.8
1.5
Manager A Europa MSCI World NR USD
Rolling Down Percent Ratio
Rolling Window: 2 Years 1 Month shift
Top Quartile 2nd Quartile 3rd Quartile Bottom Quartile
Down
Perce
nt Ra
tio
05 06 07 08 09 10 11 12
2010
01 02 03 04 05 06 07 08 09 10 11 12
2011
01 02 03 04 05 06 07 08 09 10 11 12
2012
01 02 03 04 050.0
0.2
0.5
0.7
0.9
Manager A Europa MSCI Europe NR USD
Rolling Up Percent Ratio
Rolling Window: 2 Years 1 Month shift
Top Quartile 2nd Quartile 3rd Quartile Bottom Quartile
Up Pe
rcent
Ratio
05 06 07 08 09 10 11 12
2010
01 02 03 04 05 06 07 08 09 10 11 12
2011
01 02 03 04 05 06 07 08 09 10 11 12
2012
01 02 03 04 05-0.2
0.0
0.2
0.4
0.6
0.8
1.0
Manager A Europa MSCI Europe NR USD
Rolling Sharpe Ratio
Rolling Window: 2 Years 1 Month shift
1st to 25th Percentile 26th Percentile to Median 51st to 75th Percentile 76th to 100th Percentile
Sharp
e Rati
o (ari
th)
06 07 08 09 10 11 12
2010
01 02 03 04 05 06 07 08 09 10 11 12
2011
01 02 03 04 05 06 07 08 09 10 11 12
2012
01 02 03 04 05100.0
75.0
50.0
25.0
0.0
Manager A Europa MSCI Europe NR USD
ABC Krone Investments Europa Return Date: 5/31/2012 MSCI Europe NR USD

ABC Krone Investments Europa Euro
Relative Weights
Time Period: 2/1/2012 to 4/30/2012
Consumer Discretionary
Consumer Staples
Energy
Financials
Health Care
Industrials
Information Technology
Materials
Telecommunication Services
Utilities
-15.0 -7.5 0.0 7.5 15.0 22.5
Attribution Detail - Selection Effect
Time Period: 2/1/2012 to 4/30/2012
Benchmark: MSCI Europe NR USD
Selec
tion E
ffect
GICS Sector
ConsumerDiscretionary
ConsumerStaples
Energy Financials HealthCare
Industrials InformationTechnology
Materials TelecommunicationServices
Utilities Unclassified-1.00
-0.50
0.00
0.50
1.00
1.50
2.00
2.50
3.00
Manager A Europa
Weighting Effect
Time Period: 2/1/2012 to 4/30/2012
Underperform Outperform
Overweight
Underweight
Relat
ive W
eight
Relative Return
30.00
15.00
0.00
-15.00
-30.00-7.50 -6.00 -4.50 -3.00 -1.50 0.00 1.50 3.00 4.50 6.00 7.50
5
4 3
2
1
6
5
4
3
2
1
Best Weighting Weight +/- Return +/- Effect1 Financials -14.49 -4.52 0.702 Consumer Discretionary 9.43 4.26 0.413 Energy -12.17 -2.97 0.374 Telecommunication Services -6.51 -5.35 0.365 Industrials 20.72 0.70 0.156 Utilities -0.03 -2.77 0.01
Worst Weighting Weight +/- Return +/- Effect1 Health Care -6.86 3.06 -0.212 Consumer Staples -1.87 7.13 -0.143 Information Technology 6.13 -0.37 -0.094 Materials 5.68 -0.87 -0.015 Unclassified -0.02 4.12 0.00
Cumulative Attribution Effects
Time Period: 2/1/2012 to 4/30/2012
GICS Sector- Cumulative Attribution Effects
Cumulative Allocation Effect
Cumulative Selection Effect
Cumulative Interaction Effect
Cumulative Active Return
Attribution Effects
Allocation Effect
Selection Effect
Interaction Effect
Active Return
Attribution Effect %
12.00
9.00
6.00
3.00
0.00
-3.00
-6.00
4.00
2.00
0.00
-2.00
2-29-2012 3-31-2012 4-30-2012
Manager A Europa - Market Performance
Time Period: 6/1/2007 to 5/31/2012
Inv Bmk1
Excess Return
Alpha
R2
Tracking Error
Information Ratio (arith)
Treynor Ratio (arith)
Up Capture Ratio
Down Capture Return
Up Number Ratio
Down Number Ratio
Up Percent Ratio
Down Percent Ratio
Batting Average
1.88
2.35
92.98
5.20
0.36
-7.38
106.98
-3.81
0.96
0.89
0.68
0.51
58.33
0.00
0.00
100.00
0.00
-9.41
100.00
-3.89
1.00
1.00
0.00
0.00
100.00
ABC Krone Investments Europa Return Date: 5/31/2012 MSCI Europe NR USD

ABC Krone Investments Europa Euro
Investment Growth 12 mths
Time Period: 6/1/2011 to 5/31/2012
6/2011 7/2011 8/2011 9/2011 10/2011 11/2011 12/2011 1/2012 2/2012 3/2012 4/2012 5/201280.0
82.5
85.0
87.5
90.0
92.5
95.0
97.5
100.0
102.5
105.0
Manager A Europa MSCI Europe NR USD
Relative Cumulative Performance 12 mths.
Time Period: 6/1/2011 to 5/31/2012
6/2011 7/2011 8/2011 9/2011 10/2011 11/2011 12/2011 1/2012 2/2012 3/2012 4/2012 5/2012-2.8%
-1.4%
0.0%
1.4%
2.8%
4.2%
5.6%
7.0%
8.4%
9.8%
11.2%
12.6%
Manager A Europa MSCI Europe NR USD
Investment Growth 36 mths.
Time Period: 6/1/2009 to 5/31/2012
8/2009 11/2009 2/2010 5/2010 8/2010 11/2010 2/2011 5/2011 8/2011 11/2011 2/2012 5/201295.0
100.0
105.0
110.0
115.0
120.0
125.0
130.0
135.0
140.0
145.0
Manager A Europa MSCI Europe NR USD
Investment Growth 60 mths.
Time Period: 6/1/2007 to 5/31/2012
11/2007 5/2008 11/2008 5/2009 11/2009 5/2010 11/2010 5/2011 11/2011 5/201232.5
39.3
46.0
52.8
59.5
66.3
73.0
79.8
86.5
93.3
100.0
106.8
Manager A Europa MSCI Europe NR USD
Relative Cumulative Performance 36 mths.
Time Period: 6/1/2009 to 5/31/2012
8/2009 11/2009 2/2010 5/2010 8/2010 11/2010 2/2011 5/2011 8/2011 11/2011 2/2012 5/2012-13.8%
-11.0%
-8.3%
-5.5%
-2.8%
0.0%
2.8%
5.5%
8.3%
11.0%
13.8%
16.5%
Manager A Europa MSCI Europe NR USD
Relative Cumulative Performance 60 mths.
Time Period: 6/1/2007 to 5/31/2012
11/2007 5/2008 11/2008 5/2009 11/2009 5/2010 11/2010 5/2011 11/2011 5/2012-7.0%
-5.6%
-4.2%
-2.8%
-1.4%
0.0%
1.4%
2.8%
4.2%
5.6%
7.0%
8.4%
Manager A Europa MSCI Europe NR USD
ABC Krone Investments Europa Return Date: 5/31/2012 MSCI Europe NR USD

ABC Krone Investments Europa Euro
Returns-Based Style
Time Period: 6/1/2007 to 5/31/2012
MSCI AC Americas PR USD
MSCI AC Europe PR USD
MSCI AC Far East Ex Japan PR USD
MSCI Japan PR USD
Manager A Europa MSCI Europe NR USD
Holdings-Based Style Trail
Time Period: 6/30/2007 to 5/31/2012M
icro
Small
Mid
Large
Giant
Deep-Val Core-Val Core Core-Grth High-Grth
Manager A Europa 6/30/2007 5/31/2012 MSCI Europe NR USD 6/30/2007 5/31/2012
Top Holdings
Portfolio Date: 5/31/2012
Style Box Sector
PositionMarket
Value(mil)
PortfolioWeighting %
Air Liquide SA
Rolls-Royce Holdings PLC
Johnson Matthey PLC
Reckitt Benckiser Group PLC
Spectris PLC
SGS Ltd.
Bunzl PLC
Aggreko PLC
Svenska Handelsbanken
Novo Nordisk A/S
Prosegur SA Security Company
Burberry Group PLC
Swatch Group AG
Hennes & Mauritz AB
SKF, Group
Ebro Foods S.A
Fortum Oyj
Ekornes ASA
É Industrial Materials 10.43 8.08
É Industrial Materials 10.42 8.07
È Industrial Materials 10.26 7.95
É Consumer Goods 10.23 7.92
Ì Consumer Goods 9.86 7.63
É Software 6.31 4.89
Ë Business Services 6.24 4.83
É Business Services 6.16 4.77
È Financial Services 6.02 4.67
É Health Care 5.97 4.62
Ì Business Services 5.87 4.55
É Consumer Goods 5.77 4.47
É Consumer Goods 5.67 4.39
É Consumer Services 5.64 4.37
È Industrial Materials 5.62 4.35
Ê Consumer Goods 5.34 4.14
Ç Utilities 5.33 4.13
Í Consumer Goods 4.78 3.70
GICS Sectors
Portfolio Date: 5/31/2012
Inv Bmk1
Energy %
Materials %
Industrials %
Consumer Discretionary %
Consumer Staples %
Healthcare %
Financials %
Information Technology %
Telecom Services %
Utilities %
0.00
16.44
32.27
17.35
12.36
4.74
4.79
7.83
0.00
4.23
11.70
9.59
10.78
8.93
15.21
12.47
17.31
2.93
6.46
4.64
Asset Allocation
Portfolio Date: 5/31/2012
%
Stock 97.5
Bond 0.0
Cash 2.5
Other 0.0
Total 100.0
ABC Krone Investments Europa Return Date: 5/31/2012 MSCI Europe NR USD

ABC Krone Investments Europa Euro
Holding Based Equity Style Valuation
Time Period: 6/1/2007 to 5/31/2012
0.0
10.0
20.0
30.0
40.0
50.0
60.0
70.0
80.0
90.0
100.0
11/2007 5/2008 11/2008 5/2009 11/2009 5/2010 11/2010 5/2011 11/2011 5/2012
Value % Core % Growth %
Holding Based Equity Style Capitalization
Time Period: 6/1/2007 to 5/31/2012
0.0
10.0
20.0
30.0
40.0
50.0
60.0
70.0
80.0
90.0
100.0
11/2007 5/2008 11/2008 5/2009 11/2009 5/2010 11/2010 5/2011 11/2011 5/2012
Large Cap % Mid Cap % Small Cap %
Relative to Peer Group
Peer Group: Open End Funds - Europe/HKG/TWN/SGP - Europe Large-Cap Blend Equity
1st to 25th Percentile 26th Percentile to Median 51st to 75th Percentile 76th to 100th Percentile
Expense Ratio Turnover Ratio % Fund Size Manager Tenure (Longest) Manager Tenure (Average)100.0
75.0
50.0
25.0
0.0
Manager A Europa MSCI Europe NR USD
Return Based Historical Style Exposure
Time Period: 6/1/2007 to 5/31/2012
0.0
10.0
20.0
30.0
40.0
50.0
60.0
70.0
80.0
90.0
100.0
8/2009 11/2009 2/2010 5/2010 8/2010 11/2010 2/2011 5/2011 8/2011 11/2011 2/2012 5/2012
MSCI AC Americas USD MSCI AC Europe USD MSCI AC Far East Ex Japan USDMSCI Japan USD
Price Multiples
Portfolio Date: 5/31/2012
Inv Bmk1
P/E Ratio (TTM) (Long)
P/B Ratio (TTM) (Long)
P/S Ratio (TTM) (Long)
P/C Ratio (TTM) (Long)
Debt to Capital % (trailing) (Long)
Net Margin % (trailing) (Long)
ROA % (TTM) (Long)
ROA % (TTM) (Long)
ROE % (TTM) (Long)
Average Market Cap (mil) (Long)
14.80
2.94
1.72
12.12
38.45
13.47
10.62
10.62
23.10
9,146.62
9.76
1.27
0.71
6.00
36.22
11.93
7.17
7.17
20.07
27,346.80
Style Exposure
Portfolio Date: 5/31/2012
Inv Bmk1
Equity Style Large Cap %
Equity Style Mid Cap %
Equity Style Small Cap %
Equity Style Value %
Equity Style Core %
Equity Style Growth %
Market Cap Giant %
Market Cap Large %
Market Cap Mid %
Market Cap Small %
Market Cap Micro %
74.51
21.69
3.80
12.27
22.35
65.38
25.62
48.89
21.69
3.80
0.00
89.45
10.21
0.35
40.31
28.59
31.10
58.82
30.57
10.26
0.13
0.22
ABC Krone Investments Europa Return Date: 5/31/2012 MSCI Europe NR USD

ABC Krone Investments Europa Euro
Asset Allocation
Time Period: 6/1/2007 to 5/31/2012
0.0
10.0
20.0
30.0
40.0
50.0
60.0
70.0
80.0
90.0
100.0
11/2007 5/2008 11/2008 5/2009 11/2009 5/2010 11/2010 5/2011 11/2011 5/2012
Stock Bond CashOther
Equity Regional Exposure
Time Period: 6/1/2007 to 5/31/2012
0.0
12.5
25.0
37.5
50.0
62.5
75.0
87.5
100.0
11/2007 5/2008 11/2008 5/2009 11/2009 5/2010 11/2010 5/2011 11/2011 5/2012
North America % Latin America % United Kingdom %Europe dev % Europe emrg % Africa/Middle East %Australasia % Japan % Asia dev %Asia emrg %
Equity Sectors (GICS)
Time Period: 6/1/2007 to 5/31/2012
0.0
12.5
25.0
37.5
50.0
62.5
75.0
87.5
100.0
11/2007 5/2008 11/2008 5/2009 11/2009 5/2010 11/2010 5/2011 11/2011 5/2012
Energy % Materials % Industrials %Consumer Discretionary % Consumer Staples % Healthcare %Financials % Information Technology % Telecom Services %Utilities %
ABC Krone Investments Europa Return Date: 5/31/2012 MSCI Europe NR USD

ABC Krone Investments Europa Euro
Turnover Ratio
Time Period: 1/1/2008 to 12/31/2011
Turno
ver R
atio %
2008 2009 2010 20110.0
50.0
100.0
150.0
Manager A Europa
# Holdings
Time Period: 6/1/2007 to 5/31/2012
# of
Sto
ck H
olding
s (Lo
ng)
2007 2008 2009 2010 2011 201218.0
55.0
92.0
129.0
166.0
Manager A Europa
Net Expense Ratio (TER)
Time Period: 1/1/2008 to 12/31/2011
Annu
al Re
port
Net E
xpen
se R
atio
2008 2009 2010 20110.0
0.5
1.0
1.5
2.0
2.5
Manager A Europa
AUM
Time Period: 6/1/2007 to 5/31/2012To
tal M
arket
Value
(Long
)
2007 2008 2009 2010 2011 20128,000,000.0
10,000,000.0
12,000,000.0
14,000,000.0
16,000,000.0
18,000,000.0
20,000,000.0
Manager A Europa
P/E (TTM)
Time Period: 6/1/2007 to 5/31/2012
P/E R
atio (
TTM
) (Lo
ng)
2007 2008 2009 2010 2011 20125.0
10.0
15.0
20.0
25.0
Manager A Europa MSCI Europe NR USD
P/B (TTM)
Time Period: 6/1/2007 to 5/31/2012
P/B
Ratio
(TTM
) (Lo
ng)
2007 2008 2009 2010 2011 20121.0
1.5
2.0
2.5
3.0
3.5
4.0
Manager A Europa MSCI Europe NR USD
ABC Krone Investments Europa Return Date: 5/31/2012 MSCI Europe NR USD

ABC Krone Investments Europa Euro
P/S (TTM)
Time Period: 6/1/2007 to 5/31/2012
P/S
Ratio
(TTM
) (Lo
ng)
2007 2008 2009 2010 2011 20120.5
0.8
1.0
1.3
1.5
1.8
2.0
Manager A Europa MSCI Europe NR USD
P/C (TTM)
Time Period: 6/1/2007 to 5/31/2012
P/C
Ratio
(TTM
) (Lo
ng)
2007 2008 2009 2010 2011 20124.0
6.0
8.0
10.0
12.0
14.0
Manager A Europa MSCI Europe NR USD
LT Earnings Growth
Time Period: 6/1/2007 to 5/31/2012
Equit
y Styl
e Fac
tor L
T Earn
Grow
th (Lo
ng)
2007 2008 2009 2010 2011 20120.0
2.5
5.0
7.5
10.0
12.5
Manager A Europa MSCI Europe NR USD
Net Margin
Time Period: 6/1/2007 to 5/31/2012Ne
t Marg
in %
(trail
ing) (
Long
)
2007 2008 2009 2010 2011 20126.0
8.0
10.0
12.0
14.0
16.0
Manager A Europa MSCI Europe NR USD
ROA (TTM)
Time Period: 6/1/2007 to 5/31/2012
ROA
% (TT
M) (
Long
)
2007 2008 2009 2010 2011 20124.0
6.0
8.0
10.0
12.0
14.0
Manager A Europa MSCI Europe NR USD
ROE (TTM)
Time Period: 6/1/2007 to 5/31/2012
ROE %
(TTM
) (Lo
ng)
2007 2008 2009 2010 2011 201210.0
15.0
20.0
25.0
30.0
Manager A Europa MSCI Europe NR USD
ABC Krone Investments Europa Return Date: 5/31/2012 MSCI Europe NR USD
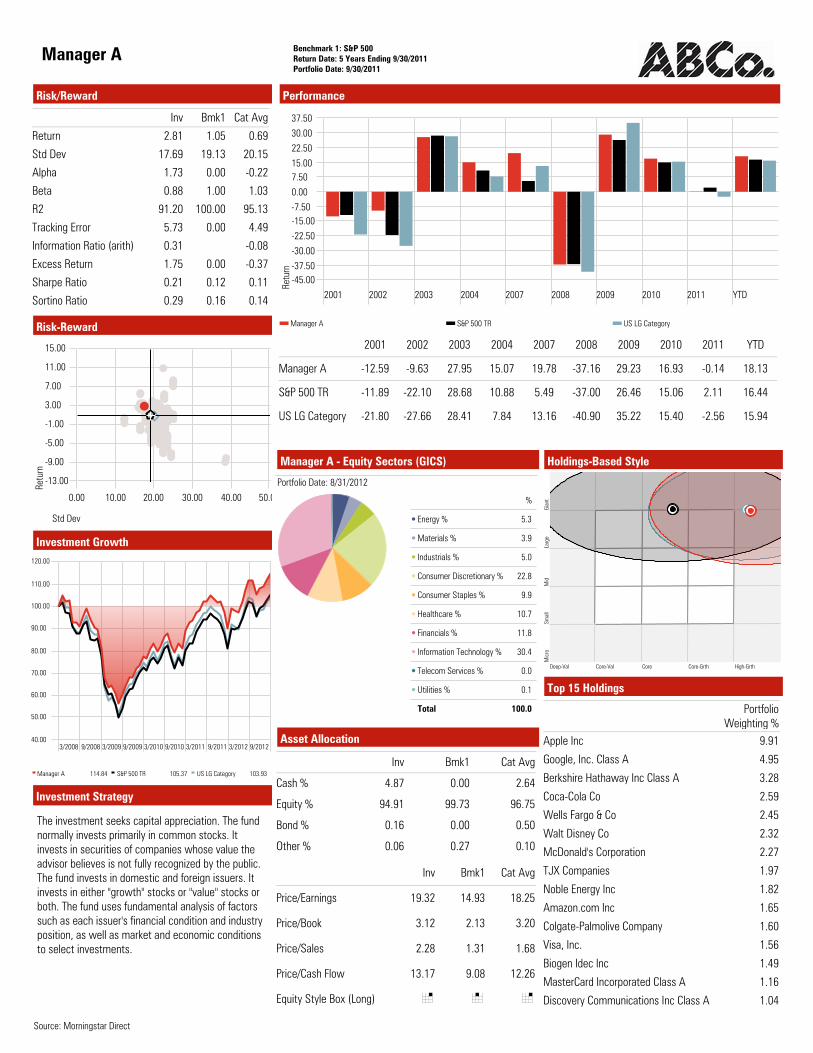
Manager A Benchmark 1: S&P 500 Return Date: 5 Years Ending 9/30/2011Portfolio Date: 9/30/2011
Investment Growth
3/2008 9/2008 3/2009 9/2009 3/2010 9/2010 3/2011 9/2011 3/2012 9/201240.00
50.00
60.00
70.00
80.00
90.00
100.00
110.00
120.00
Manager A 114.84 S&P 500 TR 105.37 US LG Category 103.93
Investment Strategy
The investment seeks capital appreciation. The fund normally invests primarily in common stocks. It invests in securities of companies whose value the advisor believes is not fully recognized by the public. The fund invests in domestic and foreign issuers. It invests in either "growth" stocks or "value" stocks or both. The fund uses fundamental analysis of factors such as each issuer's financial condition and industry position, as well as market and economic conditions to select investments.
Risk-Reward
Retu
rn
Std Dev
0.00 10.00 20.00 30.00 40.00 50.00
-13.00
-9.00
-5.00
-1.00
3.00
7.00
11.00
15.00
Risk/Reward
Inv Bmk1 Cat Avg
Return
Std Dev
Alpha
Beta
R2
Tracking Error
Information Ratio (arith)
Excess Return
Sharpe Ratio
Sortino Ratio
2.81
17.69
1.73
0.88
91.20
5.73
0.31
1.75
0.21
0.29
1.05
19.13
0.00
1.00
100.00
0.00
0.00
0.12
0.16
0.69
20.15
-0.22
1.03
95.13
4.49
-0.08
-0.37
0.11
0.14
2001 2002 2003 2004 2007 2008 2009 2010 2011 YTD
Manager A
S&P 500 TR
US LG Category
-12.59
-11.89
-9.63
-22.10
27.95
28.68
15.07
10.88
19.78
5.49
-37.16
-37.00
29.23
26.46
16.93
15.06
-0.14
2.11
18.13
16.44
-21.80 -27.66 28.41 7.84 13.16 -40.90 35.22 15.40 -2.56 15.94
Asset Allocation
Inv Bmk1 Cat Avg
Cash %
Equity %
Bond %
Other %
4.87
94.91
0.16
0.06
0.00
99.73
0.00
0.27
2.64
96.75
0.50
0.10
Inv Bmk1 Cat Avg
Price/Earnings
Price/Book
Price/Sales
Price/Cash Flow
Equity Style Box (Long)
19.32
3.12
2.28
13.17
É
14.93
2.13
1.31
9.08
È
18.25
3.20
1.68
12.26
É
Manager A - Equity Sectors (GICS)
Portfolio Date: 8/31/2012
%
Energy % 5.3
Materials % 3.9
Industrials % 5.0
Consumer Discretionary % 22.8
Consumer Staples % 9.9
Healthcare % 10.7
Financials % 11.8
Information Technology % 30.4
Telecom Services % 0.0
Utilities % 0.1
Total 100.0
Holdings-Based Style
Mic
roSm
all
Mid
Larg
eGi
ant
Deep-Val Core-Val Core Core-Grth High-Grth
Top 15 Holdings
PortfolioWeighting %
Apple Inc
Google, Inc. Class A
Berkshire Hathaway Inc Class A
Coca-Cola Co
Wells Fargo & Co
Walt Disney Co
McDonald's Corporation
TJX Companies
Noble Energy Inc
Amazon.com Inc
Colgate-Palmolive Company
Visa, Inc.
Biogen Idec Inc
MasterCard Incorporated Class A
Discovery Communications Inc Class A
9.91
4.95
3.28
2.59
2.45
2.32
2.27
1.97
1.82
1.65
1.60
1.56
1.49
1.16
1.04
Performance
Retu
rn2001 2002 2003 2004 2007 2008 2009 2010 2011 YTD
-45.00-37.50
-30.00
-22.50
-15.00-7.50
0.00
7.5015.00
22.50
30.00
37.50
Manager A S&P 500 TR US LG Category
Source: Morningstar Direct

Norden31 Mai 2011
Caractéristiques
Global Investment Fund Sector (GIFS)Morningstar Rating OverallDeviseClassification AMFValorisationEligible PEABase CurrencySociété de gestionRegion of SaleFrais de gestionConditions de souscriptionsCommission de rachatCatégorie Morningstar
Nordic EquityÙÙÙÙÙ
EuroActions internationales
DailyYes
Euro11/28/1994
European Cross-Border1.994.000.00
Europe OE Nordic Equity
Conditions de souscriptionLes demandes des souscription et de rachat sont centralisées chaque jour à 11 heures et sont exécutées sur la base de la prochaine valeur liquidative.
Le prospectus simplifié est disponible sur simple demande auprès de la société ou sur le site internet.
CONTACTSSouscriptions /rachatsJoe Smith 01.45.13.02.89 (fax 01.44.13.09.30)Informations complémentaires :Jane Smith 01.45.13.01.77Publication des VLwww.abc.fr
Norden
Actif net totalValeur Liquidative
341.69111.96
Performances* (as of 26/05/2011)
Currency: Euro
1 mois YTD 3 ans 5 ans 18/06/2002Manager AMSCI Nordic Countries NR LCLMSCI EMU EUR
-4.56-5.50-5.51
3.802.69
-4.96
15.386.53
-2.69
0.00-5.53
-12.86
6.865.48
-2.67
*Ces performances sont données à titre indicatif et s'apprécient à l'issue de la durée de placement recommandée(1) Depuis le 01/07/06 (anciennement Alfred Berg Nordic)18/06/02 : reprise de la gestion
Performances annuelles
2010 2009 2008 2007 2006Manager AMSCI Nordic Countries NR LCLMSCI EMU EUR
-13.44-15.94-17.48
33.8324.46-0.43
70.8534.7123.06
-47.42-46.55-46.58
-0.6910.845.32
Ratios de risque
1 an 3 ansStandard DeviationTracking ErrorInformation Ratio (arith)Beta
27.046.330.520.98
21.706.001.441.01
Courbe de performance
Time Period: 6/1/2007 to 5/31/2012
11/2007 5/2008 11/2008 5/2009 11/2009 5/2010 11/2010 5/2011 11/2011 5/201220.0
30.0
40.0
50.0
60.0
70.0
80.0
90.0
100.0
110.0
120.0
Manager A 96.6 MSCI Nordic Countries NR LCL 72.5 MSCI EMU PR EUR 48.4
Les performances passées ne préjugent pas des performances futures
Manager A - Top Holdings
Style Box
PositionMarketValue(mil)
PortfolioWeighting %
Novo Nordisk A/SEricsson Telephone CompanyStatoil ASANordea Bank ABDNB ASA.Volvo CorporationHennes & Mauritz ABMillicom International Cellular SA DRCarlsberg ASSvenska Cellulosa AB
É 20.77 5.48È 17.67 4.66Ç 17.40 4.59Ç 15.61 4.11Ç 14.94 3.94È 13.73 3.62É 13.40 3.53È 13.31 3.51È 13.01 3.43Ç 11.34 2.99
Norden - Equity Sectors%
Energy % 9.4
Materials % 5.9
Industrials % 18.6
Consumer Discretionary % 14.2
Consumer Staples % 7.7
Healthcare % 7.5
Financials % 14.7
Information Technology % 7.3
Telecom Services % 12.4
Utilities % 2.4
Total 100.0
MSCI Nordic Countries - Equity Sectors%
Energy % 9.2
Materials % 7.5
Industrials % 23.1
Consumer Discretionary % 8.3
Consumer Staples % 3.3
Healthcare % 13.1
Financials % 18.7
Information Technology % 7.5
Telecom Services % 7.7
Utilities % 1.5
Total 100.0
Monthly Estimated Fund-Level Net Flow
Time Period: 6/1/2011 to 5/31/2012
Est
imat
ed F
und-L
evel
Net
Flo
w -
Aggr
from
Shar
e Cla
ss (
Month
ly)
8/2011 11/2011 2/2012 5/2012-50,000,000.0
0.0
50,000,000.0
Manager A
Equity Sectors
Portfolio Date: 3/31/2012
EquityEcon
SectorConsumerCyclical %
EquityEcon
SectorFinancial
Services %
EquityEcon
SectorConsumer
Defensive %
EquityEcon
SectorHealthcare %
EquityEcon
SectorCommunication
Services %
EquityEcon
SectorEnergy %
EquityEcon
SectorIndustrials %
EquityEcon
SectorTechnology %
Manager A 16.05 12.75 10.68 7.46 12.36 9.45 17.70 7.28
Note for Manager A
La Sicav est gérée par ABC depuis le 31 mai 2002. Créée en 1992 à la Banque Vernes, NORDEN est la seule Sicav de droit français, investie dans les actions des quatre pays nordiques : Suède, Finlande, Danemark et Norvège.L’OPCVM n’a pas d’indicateur de référence. Sur la durée de placement recommandée, la comparaison pourra toutefois être faite avec l’indice MSCI Nordic.
Note for Manager A
Les marchés nordiques ont rebondi sur le mois, alors que la majorité des sociétés publiait de bons résultats pour le premier trimestre. Si le portefeuille a été stimulé par les bons chiffres de SKF, Ericsson, Volvo et Millicom, il a en revanche souffert de conditions temporairement plus difficiles pour Electrolux (hausse des coûts matières), Nobia (améliorations plus lentes que prévus) et Husqvarna (problèmes de production). La sicav a ainsi légèrement sousperformé l'indice sur la période, pénalisée également par les hausses de Sandvik et Yara dont nous sommes absents. Suite à la forte rotation du mois de mars, la composition du portefeuille n'a que très peu varié en avril, notre seul mouvement significatif étant un renforcement en KONE, société finlandaise d'installation et de maintenance d'ascenseurs dont la valorisation ne nous semble pas refléter pleinement le potentiel de création de valeur.
Lazard Frères Gestion SAS 11, rue d’Argenson 75008 Paris – Tél : 01 44 13 01 79 – Fax : 01 44 13 09 30Ce document est remis à titre d’information aux porteurs de parts ou actionnaires dans le cadre de la réglementation en vigueur. Les instruments ou valeurs figurant dans ce document sont soumis aux fluctuations du marché et aucune garantie ne saurait
être donnée sur leur performance ou leur évolution future. Les informations contenues dans ce document n’ont pas fait l’objet d’un examen ou d’une certification par les commissaires aux comptes de l’OPCVM ou des OPCVM concernés.
Source: Morningstar Direct

As of 5/31/2012
Note for Manager A
Esta dirigido a personas naturales, empresas y sociedades de inversion que buscan participar tanto del mercado emergente nacional e internacional. Los recursos se invierten en instrumentos de emisores cuyos activos se encuentran principalmente localizados en paises catalogados como economias emergentes, de manera que el inversionista asume el riesgo que conlleva la region, enfrentando una mayor volatilidad a cambio de retornos potenciales mas altos en el tiempo.
Rendimiento
Time Period: 6/1/2010 to 5/31/2012
8/2010 11/2010 2/2011 5/2011 8/2011 11/2011 2/2012 5/2012-18.0%
-13.5%
-9.0%
-4.5%
0.0%
4.5%
9.0%
13.5%
18.0%
22.5%
27.0%31.5%
Manager A -12.0 MSCI EM Latin America NR USD -4.3 Chile OE Latin America Equity -8.6
Riesgo
Time Period: 6/1/2010 to 5/31/2012
Std DevDownsideDeviation
Alpha Beta R2Sharpe
Ratio(arith)
TrackingError
Manager A 26.43 4.06 -4.39 0.95 97.05 -0.24 4.76
Manager A - Operations
Minimum InvestmentBase CurrencyInception DateManagement FeeMax Front LoadDeferred LoadRedemption Fee
1.00US Dollar
10/8/20076.310.001.190.00
Retornos
Retorno
2008 2009 2010 YTD
Excess Return
2008 2009 2010 YTD
Latin America Equity
Manager A 89.46 8.83 -23.57 -5.68 62.99 -6.24 -25.68 -25.91
Note for Manager A
xxxxxxxxxxxxxxxxxxxxxxxxxxxxxxxxxxxxxxxxxxxxxxxxxxxxxxxxxxxxxxxxxxxxxxxxxxxxxxxxxxxxxxxxxxxxxxxxxxxxxxxxxxxxxxxxxxxxxxxxxxxxxxxxxxxxxxxxxxxxxxxxxxxxxxxxxxxxxxxxxxxxxxxxxxxxxx
Manager A - Asset Allocation
Portfolio Date: 4/30/2012
Asset Alloc Cash %
Asset Alloc Equity %
Asset Alloc Bond %
Asset Alloc Other %
0.04
97.27
0.00
2.68
Exposicion por pais
Portfolio Date: 4/30/2012
Equity Country Brazil %
Equity Country Chile %
Equity Country Mexico %
Equity Country Argentina %
53.95
11.18
26.21
0.00
Exposicion sectorial
Portfolio Date: 4/30/2012%
Equity Econ Sector Basic Materials % 17.9
Equity Econ Sector Consumer Cyclical % 4.9
Equity Econ Sector Financial Services % 19.2
Equity Econ Sector Real Estate % 0.2
Equity Econ Sector Consumer Defensive % 16.4
Equity Econ Sector Healthcare % 0.1
Equity Econ Sector Utilities % 6.9
Equity Econ Sector Communication Services % 14.9
Equity Econ Sector Energy % 13.8
Equity Econ Sector Industrials % 4.0
Equity Econ Sector Technology % 1.9
Total 100.0
Manager A - Top Holdings
Portfolio Date: 4/30/2012
PortfolioWeighting %
Itau Unibanco Holding S.A.
Bank Bradesco ADR
Companhia de Bebidas das Americas Ambev ADR
Wal - Mart de Mexico, S.A.B. de C.V. ADR
Mexican Economic Development, Inc. ADR
Latin American Discovery
6.58
5.08
4.11
3.13
2.88
2.59
Trailing Returns
Data Point: Return
3 months 6 months 1 year 3 years
Manager A
MSCI EM Latin America NR USD
Chile OE Latin America Equity
-17.48
-19.09
-6.91
-5.72
-24.22
-21.68
0.93
6.70
-15.13 -1.83 -22.02 4.11
Returns
Ret
urn
3 months 6 months 1 year 3 years-30.0
-25.0
-20.0
-15.0-10.0
-5.0
0.0
5.0
10.015.0
-17.5
-6.9
-24.2
0.9
-19.1
-5.7
-21.7
6.7
-15.1
-1.8
-22.0
4.1
Manager A MSCI EM Latin America NR USD Chile OE Latin America Equity
Source: Morningstar Direct

*Growth of $100,000 invested 10 years ago or since inception if less than 10 years. Performance includes reinvestment of income and dividends. Not adjusted for inflation. Net of expense ratios.
Cumula�ve Growth*
Time Period: 4/1/2005 to 3/31/2012
2005 2006 2007 2008 2009 2010 201167,000
78,000
89,000
100,000
111,000
122,000
133,000
144,000
155,000
166,000
177,000
188,000
Manager A Russell 1000 Growth TR USD
Performance Rela�ve to Peer Group
Peer Group (595%): Open End Funds U.S. Large Growth
Top Quar�le 2nd Quar�le 3rd Quar�le Bo�om Quar�le
Re
turn
MRQ YTD 1 year 3 years 5 years 10 years20.0
0.0
20.0
40.0
60.0
80.0
100.0
120.0
Manager A Russell 1000 Growth TR USD
Investment Strategy
The investment seeks long-term growth of capital. The fund invests at least 70% of its assets (net assets plus any borrowings for investment purposes) in large capitalization companies, which are companies having a market capitalization in excess of $4 billion at the time of purchase. The Subadvisor invests substantially all of the fund's investable assets in domestic securities. However, the fund is permitted to invest up to 20% of its net assets in foreign securities, which are generally securities issued by companies organized outside the U.S. and traded primarily in markets outside the U.S.
Por�olio Highlights
Annual Turnover %
Net Assets ($M)
Assets as of Date
# of Holdings
52.0
16,293.16
5/31/2012
64
Asset Alloca�on
Por�olio Date: 3/31/2012
%
Cash 2.0
US Equity 95.0
NonUS Equity 3.1
Other 0.0
Total 100.0
Manager Biography
JOHN SMITH, CFA
Senior Managing Director - 17 Years ExperienceJoined XYZ Investments in April 1999 as a Managing Director with responsibility for research and portfolio management. John was co-head of the Technology Research Team at CYY Company in Portland from 1997-1999. For the prior four years, he was an investment banker in New York City for Lehman Brothers and Bear Stearns.
Minonoa University, B.S. - 1993Summa Cum Laude - Finance/Investments
JOE THOMAS, CFA
Por�olio Managers
John Smith since 7/5/1995
Joe Thomas since 4/1/1997
Kathy Small since 4/1/1999
INVESTMENT PRODUCTS: NOT FDIC INSURED - NO BANK GUARANTEE - MAY LOSE VALUE
INTERNAL USE ONLY - SHARING THIS INFORMATION WITH CLIENTS IN ANY MANNER IS STRICTLY PROHIBITED
This document may not be copied, distributed, shared or shown in any manner to any third party, including existing or prospective clients, service providers and other Citi personnel not authorized to receive it. Failure to comply with these restrictions is subject to penalty. Sales activities relating to any securities discussed herein may only be conducted on the basis of approved marketing materials. Past performance is not indicative of future returns.
HIGHLIGHTS Page 1 of 4
Manager A Russell 1000 Growth TR USD
Fund Profile Report As of 3/31/2012
Source: Morningstar Direct

Page 2 of 4Portfolio Date: 3/31/2012PORTFOLIO SUMMARY
Capitaliza�on Group %
Por�olio Benchmark
Giant
Large
Mid
Small
Micro
37.0
44.1
18.9
0.0
0.0
45.1
32.9
20.7
1.3
0.0
Top 10 Holdings
SectorPor�olio
Weigh�ng %
Apple, Inc.
Qualcomm, Inc.
Visa, Inc.
Union Pacific Corp
Danaher Corpora�on
UnitedHealth Group Inc
Priceline.com, Inc.
EMC Corpora�on
Cognizant Technology Solu�ons Corpora�on Class A
Google, Inc. Class A
Technology 5.77
Technology 3.64
Financial Services 3.42
Industrials 3.26
Industrials 3.09
Healthcare 3.07
Consumer Cyclical 3.05
Technology 2.92
Technology 2.66
Technology 2.52
GICS* Economic Sectors Over/Underweights %
Informa�on Technology
Health Care
Financials
Industrials
U�li�es
Consumer Discre�onary
Telecommunica�on Services
Materials
Energy
Consumer Staples
10.0 8.0 6.0 4.0 2.0 0.0 2.0 4.0 6.0 8.0
Por�olio Composi�on
Por�olio Benchmark
# of Holdings
Wtd. Avg Mkt Cap ($B)
% In Top 10
64
40.0
33.4
585
46.4
29.2
Equity Characteris�cs
Por�olio Benchmark
Hist. 3YR Sales Growth
Hist. 3YR Earn Growth
Est. LT Earn Growth
Hist Cash Flow Growth
Net Margin %
ROE %
ROA %
Trailing P/E
PricetoBook
PricetoCash Flow
PricetoSales
Dividend Yield
DebttoCapital
14.0
23.7
15.1
28.6
17.6
24.5
12.9
18.1
3.3
9.9
2.0
1.3
22.8
10.4
18.4
12.2
14.6
15.0
30.5
12.6
15.7
3.6
9.4
1.5
1.9
35.7
GICS* Economic Sectors %
Por�olio Benchmark
Consumer Discre�onary
Consumer Staples
Energy
Financials
Healthcare
Industrials
Informa�on Technology
Materials
Telecom Services
U�li�es
16.7
3.2
6.4
7.0
12.9
14.0
35.6
4.3
0.0
0.0
14.4
11.9
10.0
4.3
10.5
12.5
30.4
5.2
0.8
0.1
Please see Important Information Section for defintions, glossary of terms and disclosures.*GICS - Global Industry Classification Standard
Internal Use Only - Sharing this document with existing or prospective clients in any manner is strictly prohibited
Alloca�on Effects
Time Period: 1/1/2012 to 3/31/2012
Por�olio: Manager A Benchmark: Russell 1000 Growth TR USD
Underperform Outperform Ov
erw
eig
ht
Un
de
rwe
igh
t
Re
la�
ve W
eig
ht
Rela�ve Return
12.00
6.00
0.00
6.00
12.0012.50 10.00 7.50 5.00 2.50 0.00 2.50 5.00 7.50 10.00 12.50
3
2
1
5
4
3
2
1
Best Weigh�ng Weight +/ Return +/ Effect1 Consumer Defensive 9.66 8.18 0.822 Technology 3.79 9.98 0.373 Energy 2.09 11.35 0.234 Financial Services 5.55 3.39 0.165 Real Estate 1.63 3.65 0.06
Worst Weigh�ng Weight +/ Return +/ Effect1 Industrials 0.43 2.94 0.042 Healthcare 2.92 0.96 0.033 Communica�on Services 1.09 0.64 0.00
Manager A Russell 1000 Growth TR USD
Fund Profile Report As of 3/31/2012
Source: Morningstar Direct

Page 3 of 4Return Date: 3/31/2012PERFORMANCE & RISK ANALYSIS
Internal Use Only - Sharing this document with existing or prospective clients in any manner is strictly prohibited
Please see Important Information Section for defintions, glossary of terms and disclosures.*GICS - Global Industry Classification Standard
Distribu�on of Returns
Time Period: 5/1/2005 to 3/31/2012
Pe
rce
nt
of
Pe
rio
ds
20.0 15.0 10.0 5.0 0.0 5.0 10.0 15.00.0
4.0
8.0
12.0
16.0
20.0
24.0
28.0
32.0
36.0
40.0
44.0
HoldingsBased Style Trail
Time Period: 4/30/2002 to 3/31/2012
Mic
roSm
all
Mid
Larg
eG
ian
t
DeepVal CoreVal Core CoreGrth HighGrth
Manager A
Russell 1000 Growth TR USD
Morningstar Style Box
1.9 10.8 68.4
0.9 0.0 18.0
0.0 0.0 0.0
Large
Mid
Sma
ll
Value Blend Growth
Equity Style %
Equity Style Value 2.7
Equity Style Core 10.8
Equity Style Growth 86.4
3 Year
Inv Bmk1
Return
Std Dev
Sharpe Ra�o
Info Ra�o
Alpha
Beta
R2
Tracking Error
Ba�ng Average
Up Percent
Down Percent
Max Drawdown
Up Capture
Down Capture
23.76
18.32
0.46
3.27
47.22
66.67
33.33
17.71
104.72
120.63
25.28
16.51
0.00
100.00
66.67
33.33
15.31
100.00
100.00
100.00
1.00
1.52
97.57
1.10
3.24
1.29
0.00
7 Year
Inv Bmk1
Return
Std Dev
Sharpe Ra�o
Info Ra�o
Alpha
Beta
R2
Tracking Error
Ba�ng Average
Up Percent
Down Percent
Max Drawdown
Up Capture
Down Capture
6.49
16.83
0.00
100.00
55.95
44.05
47.99
100.00
100.00
0.26
0.00
1.00
100.00
10 Year
Inv Bmk1
Return
Std Dev
Sharpe Ra�o
Info Ra�o
Alpha
Beta
R2
Tracking Error
Ba�ng Average
Up Percent
Down Percent
Max Drawdown
Up Capture
Down Capture
4.28
16.40
0.00
100.00
56.67
43.33
47.99
100.00
100.00
0.15
0.00
1.00
100.00
5 Year
Inv Bmk1
Return
Std Dev
Sharpe Ra�o
Info Ra�o
Alpha
Beta
R2
Tracking Error
Ba�ng Average
Up Percent
Down Percent
Max Drawdown
Up Capture
Down Capture
6.90
20.26
0.48
3.74
55.00
56.67
43.33
44.99
106.36
100.48
5.10
19.33
0.00
100.00
56.67
43.33
47.99
100.00
0.29
1.71
1.03
96.68
0.21
0.00
1.00
100.00
100.00
Performance Statistics
Trailing Period Returns
MRQ YTD 1 year 3 years 5 years 7 years 10 yearsSince
Incep�on
Incep�on
Date
Manager A
Russell 1000 Growth TR USD
4/1/2005
12/29/1978
17.26 17.26
14.69 14.69
8.91
11.02
23.76
25.28
6.90
5.10 6.49 4.28
8.80
10.78
Calendar Year Returns
YTD 2011 2010 2009 2008 2007 2006 2005 2004 2003 2002
Manager A
Russell 1000 Growth TR USD
17.26
14.69
0.19
2.64
15.65
16.71
39.73
37.21
38.38
38.44
21.57
11.81
7.17
9.07 5.26 6.30 29.75 27.88
Manager A Russell 1000 Growth TR USD
Fund Profile Report As of 3/31/2012
Source: Morningstar Direct

IMPORTANT INFORMATION AND DISCLOSURES Page 4 of 4
Internal Use Only - Sharing this document with existing or prospective clients in any manner is strictly prohibited
Please see Important Information Section for defintions, glossary of terms and disclosures.*GICS - Global Industry Classification Standard
GLOSSARY OF TERMS
Holdings BasedActive Share - Active share uses holdings based analysis determine how active a manager is by measuring the percentage of stock holdings in a manager's portfolio that differ from the benchmark index. Active Share is calculated by taking the sum of the absolute value of the differences of the weight of each holding in the manager's portfolioversus the weight of each holding in the benchmark index and dividing by two.
Debt to Capital - A measurement of a company's financial leverage, calculated as the company's debt divided by its total capital. Debt includes all short-term and long-termobligations. Total capital includes the company's debt and shareholders' equity, which includes common stock, preferred stock, minority interest and net debt.
Dividend Yield - A financial ratio that shows how much a company pays out in dividends each year relative to its share price. In the absence of any capital gains, the dividend yield is the return on investment for a stock. Dividend yield is calculated by dividing the last annual dividends per share by the most recent closing price per share.
Market Capitalization - Market capitalization is the total dollar market value of all of a company's outstanding shares. Market capitalization is calculated by multiplying a company's shares outstanding by the latest closing price in the database.
Net Margin - Net margin is the ratio of net profits to revenues for a company or business segment - typically expressed as a percentage that shows how much of each dollar earned by the company is translated into profits. Net margin is calculated as net income divided by revenue.
Operating Margin - Operating margin is a measurement of what proportion of a company's revenue is left over after paying for variable costs of production such as wages, raw materials, etc. A healthy operating margin is required for a company to be able to pay for its fixed costs, such as interest on debt. Operating margin is calculated as operating income divided by net sales.
Price to Book - Price to book is the ratio of the share price of a publicly-traded company to its book value per share, which is the company's total asset value less the value of its liabilities.
Price to Cash Flow - Similar to the price-earnings ratio, this measure provides an indication of relative value. Because this measure deals with cash flow, the effects of depreciation and other non-cash factors are removed. Price to cash flow is calculated by dividing the most recent closing share price by the last reported annual cash flow.
Price to Earnings Ratio Actual - The P/E ratio using actual trailing earnings is calculated as the most recent closing price in the database divided by the last reported annual earnings per share.
Price to Earnings Ratio Estimate - The P/E ratio using an earnings estimate is calculated as the most recent closing price in the database divided by the street analyst mean FY1 EPS forecast.
Price to Sales - Similar to the price-earnings ratio, this measure provides an indication of relative value. Price to sales is calculated by dividing the most recent closing share price by the last reported annual sales number.
Return on Assets - An indicator of how profitable a company is relative to its total assets. ROA gives an idea as to how efficient management is at using its assets to generate earnings. Calculated by dividing a company's annual earnings by its total assets. Sometimes referred to as return on investment.
Return on Equity - The amount of net income returned as a percentage of shareholder's equity. Return on equity measures a corporation's profitability
Manager A Russell 1000 Growth TR USD
Fund Profile Report As of 3/31/2012
Source: Morningstar Direct

Manager A
Investment Strategy
The investment seeks a favorable long-term return, mainly through capital appreciation, primarily from equity securities. The fund normally invests at least 80% of assets in large-cap equity securities. Large-cap securities are securities of issuers with a capitalization equal to or greater than the top 80% of issuers by capitalization within the Russell 1000® Index at the time of purchase. It may invest up to 20% of total assets in foreign investments.
Risk-Reward
Time Period: 6/1/2007 to 5/31/2012
Retu
rn
Std Dev0.0 4.0 8.0 12.0 16.0 20.0 24.0 28.0
-5.0
-3.0
-1.0
1.0
3.0
5.0
7.0 Manager ARussell 1000 Growth TR USDUS OE Large Growth
# of Investments 3 Yr (Mo-End) 1,520
Fee Rank vs PeersExpense
Ratio
Large Growth
Manager A5th Percentile25th Percentile50th Percentile75th Percentile95th Percentile
0.480.480.480.480.480.48
Manager Biography
Mary Smith
Mary Smith is a managing director with XYZ, Inc. She has been in XYZ, Inc. and its affiliates since 2005. Previously, Smith worked in ABC,Inc. from 2000 to 2005. Prior, she was a managing director with MNO, Inc., her employer since 1996. Previously, she spent six years at RST, Inc.
Smith is a member of the Financial Analysts Federation and the Chicago Society of Security Analysts.
Morningstar Analyst Report
Analysis by Jessica Thomas 4/27/2011
Manager A is daring, but not as daring as it could be.
Manager Mary Smith will go her own way. She will deviate from the benchmark, as evidenced by the fund's higherthanaverage ac�ve share (a measure of the por�olio's overlap with its benchmark, the Russell 1000 Growth Index). The fund is also less pricesensi�ve than peers. In aggregate, its holdings tend to be more expensive than the norm on valua�on mul�ples like price/earnings.
Trailing Returns
InceptionDate
QTD YTD 1 year 3 years 5 years 10 yearsSince
InceptionManager ARussell 1000 Growth TR USDUS OE Large Growth5th Percentile25th Percentile50th Percentile75th Percentile95th Percentile
3/31/200612/29/1978
12/1/1925-5.90-7.09-7.78-8.70
-10.84
10.148.096.595.002.25
4.17-0.22-2.75-5.80
-10.66
19.3715.5313.8511.86
9.58
4.261.820.20
-1.29-3.40
6.975.024.033.011.86
-8.09-6.56
6.587.17
0.971.49
14.8916.89
1.522.01 4.72
3.1610.50
-8.02 6.47 -3.26 13.71 -0.16 3.33 12.03
Calendar Year Returns
2010 2009 2008 2007 2006 2005 2004 2003 2002 2001
Manager A
Russell 1000 Growth TR USD
US OE Large Growth
5th Percentile
25th Percentile
50th Percentile
75th Percentile
95th Percentile
4.02
0.49
-2.00
-5.00
-9.31
23.70
18.74
15.59
12.69
8.91
54.79
41.54
34.72
30.22
20.53
-32.33
-37.29
-40.07
-42.89
-48.54
28.18
18.66
13.23
9.81
3.85
16.61
11.12
7.79
5.14
-0.91
16.23
11.32
7.38
4.67
1.23
17.38
12.14
9.35
6.71
2.66
45.64
33.87
29.08
24.47
19.03
-15.05
-22.28
-25.94
-29.45
-37.67
1.64
2.64
13.17
16.71
34.99
37.21
-41.04
-38.44
21.62
11.81 9.07 5.26 6.30 29.75 -27.88
-2.56 15.40 35.22 -40.90 13.16 6.94 6.70 7.84 28.41 -27.66
Risk Statistics
Time Period: 6/1/2007 to 5/31/2012
TrackingError
InformationRatio
Std Dev Alpha Beta R2Sharpe
RatioTreynor
RatioExcessReturn
DownsideDeviation
Manager A
Russell 1000 Growth TR USD
US OE Large Growth
25th Percentile
50th Percentile
75th Percentile
5.68
4.60
3.68
-0.04
-0.40
-0.74
21.68
20.52
19.52
-0.03
-1.64
-3.12
1.09
1.03
0.98
96.90
95.49
93.26
0.15
0.07
0.00
0.91
-0.65
-2.08
-0.19
-1.81
-3.30
4.22
3.44
2.73
3.02
0.00
-0.16
20.22
20.34
19.43
-0.40
0.00
1.03
1.00
97.91
100.00
0.13
0.15
0.62
1.13
-0.49
0.00
2.12
0.00
1.79 -1.22 -2.17 1.64-2.11 99.35 0.05 -1.011.04
Rolling Excess Returns
Time Period: 6/1/2007 to 5/31/2012
Rolling Window: 3 Years 1 Month shift
Exce
ss R
etur
n
06 07 08 09 10 11 12
2011
01 02 03 04 05 06 07 08 09 10 11 12
2012
01 02 03 04 05-4.0
-2.0
0.0
2.0
Investment Growth
11/2007 5/2008 11/2008 5/2009 11/2009 5/2010 11/2010 5/2011 11/2011 5/201246.0
52.8
59.5
66.3
73.0
79.8
86.5
93.3
100.0
106.8
113.5
120.3
Manager A 107.8 Russell 1000 Growth TR USD 110.5
As of 5/31/2012 Page 1 of 3
Source: Morningstar Direct

Manager A
Market Performance
Time Period: 6/1/2007 to 5/31/2012
Numberof
ObservationsUp Number
DownNumber
BestQuarter
WorstQuarter
UpCaptureReturn
DownCaptureReturn
UpCapture
Ratio
DownCapture
RatioR2
Manager A
Russell 1000 Growth TR USD
60
60
31
32
29
28
15.96
16.32
-23.27
-22.79
4.55
4.40
-4.70
-4.47
103.34
100.00
105.26
100.00
97.91
100.00
Allocation Effects
Time Period: 3/1/2012 to 5/31/2012
Portfolio: Manager A Benchmark: Russell 1000 Growth TR USD
Underperform Outperform Overweight
Underw
eightRe
lativ
e W
eigh
t
Relative Return
9.00
4.50
0.00
-4.50
-9.00-10.00 -8.00 -6.00 -4.00 -2.00 0.00 2.00 4.00 6.00 8.00 10.00
5
4
3
2
1
54
3
2
1
Best Weighting Weight +/- Return +/- Effect1 Energy -4.71 -9.78 0.422 Consumer Cyclical 7.85 3.32 0.243 Industrials -3.43 -3.55 0.124 Basic Materials -0.86 -4.90 0.055 Utilities -0.07 -4.48 0.00
Worst Weighting Weight +/- Return +/- Effect1 Consumer Defensive -7.77 7.53 -0.562 Real Estate -1.62 6.82 -0.113 Financial Services 3.14 -0.68 -0.034 Communication Services -1.21 2.16 -0.025 Technology 8.14 -0.72 -0.02
Selection Effects
Time Period: 3/1/2012 to 5/31/2012
Portfolio: Manager A Benchmark: Russell 1000 Growth TR USD
Underperform Outperform Overweight
Underw
eightRe
lativ
e W
eigh
t
Relative Return
3.00
1.50
0.00
-1.50
-3.00-50.00 -40.00 -30.00 -20.00 -10.00 0.00 10.00 20.00 30.00 40.00 50.00
10
9
8
76
54
3
2
1
10
9
8
765 4
3
21
Best Selections Morningstar Sector Weight +/- Return +/- Effect1 Amazon.com Inc Consumer Cyclical 2.42 18.69 0.382 Monsanto Company Basic Materials 2.57 8.55 0.223 McDonald's Corporation Consumer Cyclical -2.28 -9.10 0.204 Roper Industries, Inc. Technology 1.04 15.00 0.155 Starbucks Corporation Consumer Cyclical 1.11 13.58 0.146 Red Hat, Inc. Technology 1.28 8.12 0.137 Walt Disney Co Consumer Cyclical 1.33 9.06 0.128 Oracle Corporation Technology -2.00 -5.09 0.119 Precision Castparts Co... Industrials 1.58 6.36 0.10
10 Cerner Corporation Technology 1.00 9.83 0.10
Worst Selections Morningstar Sector Weight +/- Return +/- Effect1 Gree Inc. Technology 0.58 -44.80 -0.322 Apple, Inc. Technology -2.71 10.75 -0.283 Herbalife, Ltd. Consumer Defensive 0.62 -35.60 -0.264 Caterpillar Inc Industrials 1.26 -15.88 -0.225 BorgWarner Inc Consumer Cyclical 1.36 -13.19 -0.196 Juniper Networks, Inc. Technology 0.89 -20.19 -0.187 Blackstone Group LP Financial Services 0.89 -17.00 -0.188 Estee Lauder Cos Inc ... Consumer Defensive 1.46 -11.50 -0.179 Fossil, Inc. Consumer Cyclical 0.26 -39.82 -0.14
10 Anadarko Petroleum C... Energy 0.83 -14.11 -0.13
As of 5/31/2012 Page 2 of 3
Source: Morningstar Direct

Manager A
Investment Style
Time Period: 6/30/2007 to 5/31/2012
Mic
roSm
all
Mid
Larg
eGi
ant
Deep-Val Core-Val Core Core-Grth High-Grth
Manager ARussell 1000 Growth TR USD
Asset Allocation
Portfolio Date: 3/31/2012
%
Cash 1.2
US Equity 91.1
Non-US Equity 5.3
Other 2.4
Total 100.0
Fundamentals
# of Holdings% Asset in Top 10 HoldingsAvg Market Cap ($M)P/E RatioP/B RatioP/S Ratio12 Mo Yield
9032.86
41,491.219.83
3.642.460.30
Regional Allocation
0.095.5
99.5
1.90.1
2.60.40.4
0.70.1
0.0 25.0 50.0 75.0 100.0 125.0
Africa/Middle East %
Americas %
Australasia %
Greater Asia %
Greater Europe %
Japan %
United Kingdom %
Not Classified %
Manager A Russell 1000 Growth TR USD
Top 10 Holdings
SectorPortfolio
Weighting %Benchmark
Weighting %
Apple, Inc.
Amazon.com Inc
Google, Inc. Class A
Intuit, Inc.
Microsoft Corporation
Monsanto Company
State Str Navigator Secs Lending Tr
Visa, Inc.
Qualcomm, Inc.
Starbucks Corporation
Technology 6.41
Consumer Cyclical 4.27
Technology 3.81
Technology 3.57
Technology 3.22
Basic Materials 2.74
2.40
Financial Services 2.35
Technology 2.11
Consumer Cyclical 1.98
7.55
1.00
2.20
0.25
3.26
0.58
0.27
1.55
0.57
Sector Allocation
4.3
9.5
3.8 5.2
11.8 12.2
22.0
14.8
4.7
12.7 11.6 10.8
4.2 4.3
37.4
29.6
0.9 0.10.0
20.0
40.0
60.0
Energy Materials Industrials Consumer Discretionary
Consumer Staples
Healthcare Financials Information Technology
Telecom Services Utilities
Manager A Russell 1000 Growth TR USD
Sector Attribution
Time Period: 3/1/2012 to 5/31/2012
Portfolio: Manager A Benchmark: Russell 1000 Growth TR USD
PortfolioWeights
BenchmarkWeights
+/-Weights
PortfolioReturn
BenchmarkReturn
+/-Return
AllocationEffect
SelectionEffect
ActiveReturn
Basic MaterialsCommunication ServicesConsumer CyclicalConsumer DefensiveEnergyFinancial ServicesHealthcareIndustrialsReal EstateTechnologyUtilitiesUnclassifiedAttribution TotalCashBondOtherTotal
3.67 4.68 -1.00 1.18 -8.42 9.60 0.05 0.37 0.421.81 3.09 -1.28 -0.25 -1.36 1.11 -0.02 0.03 0.00
19.63 12.59 7.04 2.28 -0.20 2.48 0.24 0.45 0.684.52 12.46 -7.94 -6.94 4.00 -10.95 -0.56 -0.54 -1.114.99 9.98 -4.99 -21.63 -13.30 -8.33 0.42 -0.46 -0.056.12 3.23 2.89 -7.38 -4.20 -3.18 -0.03 -0.20 -0.229.31 9.89 -0.57 2.36 1.34 1.02 0.00 0.09 0.08
10.47 14.31 -3.84 -8.30 -7.07 -1.23 0.12 -0.14 -0.020.00 1.62 -1.62 3.30 -0.11 0.00 -0.11
35.45 28.09 7.36 -5.42 -4.24 -1.18 -0.02 -0.42 -0.440.00 0.07 -0.07 -8.00 0.00 0.00 0.000.61 0.00 0.61 3.26 0.00 0.00 0.00
96.57 100.00 -3.43 -4.27 -3.52 -0.75 0.08 -0.83 -0.750.77 0.00 0.770.55 0.00 0.552.11 0.00 2.11
100.00 100.00 0.00
Market Cap Breakdown
PortfolioWeights
BenchmarkWeights
+/-Weights
AllocationEffect
UnclassifiedAttribution TotalCashBondOtherTotal
96.57 100.00 -3.43 0.0096.57 100.00 -3.43 0.00
0.77 0.00 0.770.55 0.00 0.552.11 0.00 2.11
100.00 100.00 0.00
Style BreakdownPortfolioWeights
BenchmarkWeights
+/-Weights
AllocationEffect
Large BlendLarge GrowthLarge ValueMid BlendMid GrowthMid ValueSmall BlendSmall GrowthSmall ValueUnclassifiedAttribution TotalCashBondOtherTotal
9.36 24.94 -15.58 -0.3071.77 42.69 29.08 0.55
0.97 10.12 -9.15 0.250.35 7.14 -6.79 0.28
11.91 11.01 0.90 -0.041.00 2.60 -1.61 0.090.00 0.56 -0.56 0.050.09 0.65 -0.56 0.080.19 0.21 -0.02 0.000.92 0.08 0.85 -0.10
96.57 100.00 -3.43 0.870.77 0.00 0.770.55 0.00 0.552.11 0.00 2.11
100.00 100.00 0.00
Emerging / Developed Allocation99.099.9
1.00.1
0.0 50.0 100.0 150.0
Developed %
Emerging %
Manager ARussell 1000 Growth TR USD
As of 5/31/2012 Page 3 of 3
Source: Morningstar Direct

Performance AttributionSubadvisor Navellier & Associates Inc
Attribution/Contribution
Time Period: 1/1/2012 to 3/31/2012
Benchmark: Russell 1000 Growth Index
PortfolioWeights
PortfolioReturn
PortfolioContribution
BenchmarkWeights
BenchmarkReturn
BenchmarkContribution
SelectionEffect
AllocationEffect
TotalEffect
Consumer DiscretionaryConsumer StaplesEnergyFinancialsHealth CareIndustrialsInformation TechnologyMaterialsTelecommunication ServicesUtilitiesAttribution TotalCashMissing PerformanceTotal
30.37 15.68 4.77 14.26 16.76 2.38 -0.32 0.33 0.0224.63 12.33 3.04 12.22 6.60 0.85 1.42 -0.96 0.466.95 5.71 0.40 10.82 2.96 0.33 0.21 0.45 0.660.00 0.00 4.22 15.42 0.65 0.00 -0.03 -0.03
12.54 11.02 1.41 10.49 14.16 1.49 -0.42 0.00 -0.420.00 0.00 12.80 12.66 1.61 0.00 0.25 0.25
12.25 22.58 2.70 28.77 23.75 6.67 -0.12 -1.44 -1.560.00 0.00 5.44 12.63 0.68 0.00 0.10 0.102.14 -2.91 -0.07 0.84 5.02 0.04 -0.18 -0.13 -0.32
10.26 -1.91 -0.21 0.08 -0.78 0.00 -0.13 -1.69 -1.8299.15 12.04 12.04 99.95 14.70 14.70 0.46 -3.12 -2.660.85 0.000.00 0.05
100.00 12.04 100.00 14.70
Data may not total due to rounding. Performance data quoted represents past performance, which is no guarantee of future results. The investment return and principal value of an investment in the Fund will fluctuate so that an investor’s shares, when redeemed, may be worth more or less than their original cost. Current performance may be higher or lower than performance data given. For performance information current to the most recent month-end, visit ABC.com/home/performance/. From time to time, the investment advisor may waive some fees and/or reimburse expenses, which if not waived or reimbursed, may lower performance. Performance by share class will differ due to differences in sales charges and class expenses. Returns assume reinvestment of all distributions. Returns are not annualized for periods less than one year.
The indices mentioned are unmanaged statistical composites of stock market or bond market performance. Investing in an index is not possible.
There is no guarantee that the Fund will continue to hold any one particular security or stay invested in any one particular sector. Holdings are subject to change.
Attribution analysis is a process used to analyze the source of either the absolute portfolio return (often called contribution) or the excess return (often referred to as relative return) between a portfolio and its benchmark. Total return is the price change of the portfolio including dividends accrued over the report period. Contribution to return is the product of the first two columns. The percent contribution for a single day is the security weight multiplied by the daily security return. These returns are averaged over the time period analyzed. Averaging may result in differences between the attribution return and fund performance. These returns are geometrically linked. The overall total effect is the sum of the top group-level total effect values, or the portfolio’s over/under performance.
Stock contributors are stocks whose position in the Fund had a positive effect on the Fund’s performance relative to the Fund’s benchmark. Stock detractors are stocks whose position in the Fund had a negative effect on the Fund’s performance relative to the Fund’s benchmark.
Not valid without page 2 and 3
Stock Detractors
Holdings Weight Return ContributionActiveReturn
Consolidated Edison, Inc.Duke Energy CorporationBristol-Myers Squibb CompanyBCE IncDominion Resources Inc
2.23 -4.84 -0.12 -0.102.01 -3.36 -0.07 -0.061.93 -3.28 -0.07 -0.382.14 -2.91 -0.07 -0.181.92 -2.51 -0.05 -0.04
Industry Detractors
Groupings Weight Return ContributionActiveReturn
UtilitiesTelecommunication ServicesMaterialsFinancialsIndustrials
10.26 -1.91 -0.21 -1.822.14 -2.91 -0.07 -0.320.00 0.00 0.250.00 0.00 -0.030.00 0.00 0.10
Stock Contributors
Holdings Weight Return ContributionActiveReturn
Apple, Inc.Chipotle Mexican Grill, Inc. Class AMonster Beverage CorpTJX CompaniesCerner Corporation
3.00 48.04 1.30 0.074.16 23.76 0.95 0.262.42 34.77 0.78 0.582.57 23.71 0.60 0.122.41 24.34 0.57 0.23
Industry Contributors
Groupings Weight Return ContributionActiveReturn
Consumer DiscretionaryConsumer StaplesInformation TechnologyHealth CareEnergy
30.37 15.68 4.77 0.0224.63 12.33 3.04 0.4612.25 22.58 2.70 -1.5612.54 11.02 1.41 -0.426.95 5.71 0.40 0.66
ABC Company
Growth 4Q | 2011
Source: Morningstar Direct

Not valid without page 1 and 3 800-000-0000 | ABC.com
Allocation EffectsUnderperform Outperform O
verweig
htU
nderw
eight
Rel
ativ
e W
eigh
t
Relative Return
18.00
9.00
0.00
-9.00
-18.00-20.00 -16.00 -12.00 -8.00 -4.00 0.00 4.00 8.00 12.00 16.00 20.00
5
4
3
2
1
4
3
2
1
Best Weighting Weight +/- Return +/- Effect1 Energy -3.82 -11.74 0.452 Consumer Discretionary 16.37 2.07 0.333 Industrials -12.81 -2.04 0.254 Materials -5.44 -2.06 0.10
Worst Weighting Weight +/- Return +/- Effect1 Utilities 10.27 -15.48 -1.692 Information Technology -16.44 9.05 -1.443 Consumer Staples 12.62 -8.10 -0.964 Telecommunication Services 1.32 -9.68 -0.135 Financials -4.23 0.72 -0.03
Portfolio StatisticsInv Bmk1 +/- Bmk1
P/B - DailyAverageGeometric AverageMaximumMinimumStandard DeviationWeighted AverageWeighted Geometric Average
P/C - DailyAverageGeometric AverageMaximumMinimumStandard DeviationWeighted AverageWeighted Geometric Average
P/E - DailyAverageGeometric AverageMaximumMinimumStandard DeviationWeighted AverageWeighted Geometric Average
P/EBITDA - DailyAverageGeometric AverageMaximumMinimumStandard DeviationWeighted AverageWeighted Geometric Average
P/FCF - DailyAverageGeometric AverageMaximumMinimumStandard DeviationWeighted AverageWeighted Geometric Average
P/S - DailyAverageGeometric AverageMaximumMinimumStandard DeviationWeighted AverageWeighted Geometric Average
5.41 4.35 1.064.22 3.29 0.94
19.48 30.00 -10.521.23 0.35 0.884.06 4.52 -0.465.72 5.42 0.304.56 4.31 0.25
16.01 13.63 2.3813.42 11.61 1.8140.00 40.00 0.002.50 0.24 2.279.14 7.79 1.35
16.03 13.19 2.8513.80 11.86 1.93
21.67 21.38 0.2820.00 18.45 1.5552.61 60.00 -7.397.88 1.67 6.219.35 12.68 -3.33
22.19 19.11 3.0720.43 17.16 3.27
12.09 8.66 3.4310.56 10.17 0.3926.41 195.16 -168.752.82 -727.21 730.035.88 43.33 -37.46
12.56 10.78 1.7811.08
25.04 -7.42 32.4623.68 -19.94 43.62
230.07 1,462.66 -1,232.59-67.31 -10,453.42 10,386.1039.51 464.81 -425.3025.97 15.45 10.52
2.53 2.68 -0.141.98 1.79 0.207.52 30.00 -22.480.40 0.00 0.401.70 2.83 -1.132.58 2.89 -0.312.06 2.17 -0.12
ABC Company
Growth 4Q | 2011
Source: Morningstar Direct

Not valid without page 1 and 2 800-000-0000 | ABC.com
The Fund’s returns may have been impacted by investing in technology stocks, which can be more volatile than other sectors. The Fund may invest in a limited number of securities which may involve greater risk and more price volatility than funds that do not limit the number of securities in which they invest. Large cap companies may be unable to respond quickly to new competitive challenges, such as changes in technology and consumer tastes, and also may not be able to attain the high growth rate of successful smaller companies. Diversification does not guarantee a profit or protect against loss. Current and future portfolio holdings are subject to risk.
Please consider the investment objectives, risks, charges and expenses of the fund carefully before investing. The prospectus and the summary prospectus contain this and other information about the Fund. To obtain a prospectus or a summary prospectus, contact your financial advisor or download and/or request one at ABC.com/home/ or call ABC Company at 800-000-0000. Please read the prospectus and/or summary prospectus carefully before investing.
Investment products offered are not FDIC insured, may lose value and have no bank guarantee.
A Word About RiskFund Facts
InceptionDate
Symbol CUSIPNet
Assets($M)
AnnualReportGross
ExpenseRatio
AnnualReport
NetExpense
Ratio
AnnualReport
ExpenseWaiver
MaxFrontLoad
12b-1 FeeDeferred
Load
Manager A
Manager B
Manager C
Manager D
12/19/1997 TEQAX 89154X302 223.2 1.36 1.25 0.13 5.75 0.25
10/6/2003 TEQBX 89154X757 9.5 1.83 1.74 0.13 1.00 5.00
10/6/2003 TEQCX 89154X401 109.3 2.13 2.00 0.13 1.00 1.00
11/10/2004 TIQIX 89154X633 375.3 1.13 0.99 0.13
*Expense ratio is annualized. Data as of 07/29/11 prospectus. ABC Company has contractually agreed to waive a portion of its advisory fee and/or reimburse certain Fund expenses in order to limit “Net Expenses” to 1.35% for Class A shares, 1.75% for Class B shares and Class C shares and 0.89% for Class Y shares. These expense limitations will remain in effect until at least October 28, 2012.
Class A Load Adjusted Returns
Last Quarter
YTD
1 Year
3 Year
5 Year
10 Year
Since Inception
4.37
4.37
4.79
21.18
3.52
5.02
7.01
Annualized Total Returns - Class A
ExcludingSales
ChargeIndex
Last Quarter
YTD
1 Year
3 Year
5 Year
10 Year
Since Inception
10.74
10.74
11.18
23.59
4.76
5.65
7.45
14.69
14.69
11.02
25.28
5.10
4.28
10.78
ABC Company
Growth 4Q | 2011
Source: Morningstar Direct

Growth of hypothetical $10,000 investment
2002 2003 2004 2005 2006 2007 2008 2009 2010 2011 20120.0
5.0
10.0
15.0
20.0
25.0
Manager A 18.5
1 Source: Morningstar. For each fund with at least a 3-year history, Morningstar calculates a risk-adjusted return measure that accounts for variation in a fund’s monthly performance (including the effects of all sales charges), placing more emphasis on downward variations and rewarding consistent performance. The top 10% of funds in each category receives a Morningstar Rating™ of 5 stars, the next 22.5% receive 4 stars, the next 35% receive 3 stars, the next 22.5% receive 2 stars, and the bottom 10% receive 1 star. (Each share class is counted as a fraction of one fund and rated separately.) A fund’s overall rating is derived from a weighted average of the 3-, 5- and 10-year (if applicable) rating metrics. Morningstar Rating™ is for Class A shares only; other classes may have different performance characteristics.
Other Share ClassesClass Z ZYXYZ, incepted 11/11/02Class R RTSUV, incepted 11/30/09
Morningstar Equity Style Box™
LargeM
idSm
all
Value Blend Growth
Asset Allocation
Portfolio Date: 3/31/2012
%
US Equity 72.0
Non-US Equity 23.9
Cash 1.7
Other 2.4
Total 100.0
Fund Facts
Inception date
Primary benchmark
Dividend Frequency
Morningstar Category
Morningstar Institutional Category
3/1/2000
Russell Mid Cap Growth TR USD
Annually
US OE Mid-Cap Growth
SMID Growth
Portfolio Characteristics
Net Assets ($M)
Number of holdings
Portfolio Turnover %
% of Assets in Top 10 Holdings
614.1
66
125
32.10
Subadvisor Morgan Stanley Investment Management Inc
Kevin Smith since 3/22/2011
Jane Thomas since 3/22/2011
Jennifer Jones since 3/22/2011
Tom Thomas since 3/22/2011
Wendy Jimson since 3/22/2011
David Tongen since 3/22/2011
Product Profile
A comprehensive investment solution to help you achieve your tomorrows.
�
�
�
Broad diversification in a single long-term investementActive management with more than twenty unique investment managersDaily portfolio management and oversight by the experts at XYZ Associates
Risk Statistics
Standard Deviation
Beta
23.40
1.30
Equity Statistics
Weighted Average Market Cap (B) 7.6
3 Yr Rating
3 Yr Peer Group Size
5 Yr Rating
5 Yr Peer Group Size
10 Yr Rating
10 Yr Peer Group Size
ÙÙ
679
ÙÙÙ
604
ÙÙÙ
431
Morningstar Ratings
Manager Biography
The investment seeks capital appreciation. The fund invests at least 80% of assets in common stocks of mid cap companies. It seeks long-term capital growth by investing primarily in established and emerging companies with capitalizations within the range of companies included in the Russell Midcap® Growth Index. The fund may invest up to 25% of assets in securities of foreign companies, including emerging market securities. It may also invest up to 10% of assets in real estate investment trusts ("REITs").
Investment Objective
Base Currency US Dollar
Manager A
Quarterly Fund Facts
As of 5/31/2012

The performance data presented represents past performance, which is no guarantee of future results. Current performance may be lower or higher than the performance data quoted. Please see TransamericaInvestments.com for performance data current to the most recent month-end. The investment return and principal value of mutual funds will fluctuate over time so that shares, when redeemed, may be worth more or less than their original cost.
Net Asset Value (NAV) returns include reinvestment of dividends and capital gains but do not refl ect the deduction of any sales charges. Public Offering Price (POP) returns include reinvestment of dividends and capital gains and refl ect the maximum sales charge of 5.50%. Performance for other share classes will vary.
Historical beta illustrates a fund’s sensitivity to price movements inrelation to a benchmark index. Standard Deviation is a statistical measurement that helps to gauge the fund’s historical volatility.An investment in the fund is subject to the risks associated with the underlying funds including fi xed income investing which is subject to credit risk, infl ation risk, and interest rate. Investments in small- and medium-sized companies present additional risks such as increased volatility because their earnings are less predictable, their share price more volatile, and their securities less liquid than larger or more established companies.
Investments in global/international markets involve risks not associated with U.S. markets, such as currency fl uctuations, adverse social and political developments, and therelatively small size and lesser liquidity of the markets.
Asset allocation does not ensure a profit or protect against a loss. Not all share classes are available to investors.
Shares of the fund may only be sold by offering the fund’s prospectus. You should consider the investment objective, risks, charges, and expenses of the fund carefully beforeinvesting. The prospectus contains this and additional important information regarding the fund. To obtain the prospectus and/or a summary prospectus, please contact your financial professional or go to TransamericaInvestments.com. The prospectus should be read carefully before investing.
XZY Investments is a service mark for investment related services offered by ABC Funds, DEF Investments, and RST Asset Management, Inc. Not insured by FDIC or any federal government agency. May lose value. Not a deposit of or guaranteed by any bank, bank affiliate, or credit union.
Technology Sector Breakdown
Peer Group (5-95%): Open End Funds - U.S. - Mid-Cap Growth
1st to 25th Percentile 26th Percentile to Median 51st to 75th Percentile 76th to 100th Percentile
100.0 75.0 50.0 25.0 0.0
GICS Internet & Catalog Retail % (Long Rescaled)
GICS Internet Software & Services % (Long Rescaled)
GICS Software % (Long Rescaled)
GICS Electronic Equip & Instruments % (Long Rescaled)
GICS Semiconductors & Semi Equip % (Long Rescaled)
GICS Diversified Telecom Svcs % (Long Rescaled)
GICS Wireless Telecom Services % (Long Rescaled)
Manager ARussell Mid Cap Growth TR USD
Calendar Year Performance
2010 2009 2008 2007 2006 2005 2004
Manager A
Russell Mid Cap Growth TR USD
-9.68
-1.65
34.78
26.38
35.12
46.29
-41.20
-44.32
22.05
11.43
3.88
10.66
15.38
12.10
Total Return Performance
Qtr YTD 1 Yr 3 Yr 5 Yr 10 YrSince
Inception
Manager A
Russell Mid Cap Growth TR USD
17.73
14.52
4.72
6.09
-15.26
-6.31
16.32
18.45
2.73
1.17
6.32
7.00
0.88
10.11
Total Return Performance (Load-Adjusted)
Qtr YTD 1 Yr 3 Yr 5 Yr 10 YrSince
Inception
Manager A 11.25 -1.04 -19.92 14.15 1.57 5.72 0.01
Equity Sectors
Portfolio Date: 3/31/2012
Basic Materials
Consumer Cyclical
Financial Services
Real Estate
Consumer Defensive
Healthcare
Utilities
Communication Services
Energy
Industrials
Technology
6.76
9.12
3.75
0.00
5.53
12.09
1.78
0.96
2.83
26.94
30.25
Top Ten Holdings
Portfolio Date: 3/31/2012
Style Box SectorPortfolio
Weighting %Motorola Solutions, Inc.Intuitive Surgical, Inc.Fastenal CompanyEdenred SAWeight Watchers International, Inc.Mead Johnson Nutrition CompanyLinkedIn CorpVerisk Analytics, Inc.MSCI, Inc.Yandex NV
É Technology 4.32É Healthcare 3.93É Industrials 3.84Ì Industrials 3.66Ì Consumer Cyclical 2.96É Consumer Defensive 2.81Ì Technology 2.76Ì Industrials 2.75Ì Industrials 2.69Ì Technology 2.38
Base Currency US Dollar
Manager A

Manager A As of 5/31/2012
Investment Strategy
The investment seeks capital appreciation. The fund normally invests primarily in common stocks. It invests in securities of companies whose value the advisor believes is not fully recognized by the public. The fund invests in domestic and foreign issuers. It invests in either "growth" stocks or "value" stocks or both. The fund uses fundamental analysis of factors such as each issuer's financial condition and industry position, as well as market and economic conditions to select investments.
Calendar Year Returns
YTD 2011 2010 2009 2008 2007Manager AS&P 500 TRRussell 2000 TR USDUS OE Large Growth
8.385.16
6.473.37
-2.56
-0.14
15.40
2.11
35.22-4.18
-40.90
16.93
13.16
15.0626.85
29.2326.4627.17
-37.16-37.00-33.79
19.785.49
-1.57
Trailing Returns
YTD 1 year 3 years 5 years 10 years 15 yearsManager AS&P 500 TRRussell 2000 TR USDUS OE Large Growth
8.385.163.37
2.05-0.41-8.88
6.47
15.6814.9216.47
-3.26
2.41
13.71
-0.92-0.73-0.16
7.464.14
3.335.94
8.23
3.86
4.806.09
Manager A - Performance
Inv Bmk1 Bmk2
Return
Best Month
Worst Month
Up Period Percent
Longest Up-Streak Return
Longest Down-Streak Return
2.41
10.19
-15.84
55.00
29.88
-35.99
-0.92
10.93
-16.79
55.00
31.57
-16.26
-0.73
15.46
-20.80
56.67
56.80
-25.10
Growth of Initial $1000
11/2007 5/2008 11/2008 5/2009 11/2009 5/2010 11/2010 5/2011 11/2011 5/2012360.0
440.0
520.0
600.0
680.0
760.0
840.0
920.0
1,000.0
1,080.0
1,160.01,240.0
Manager A S&P 500 TR Russell 2000 TR USDUS OE Large Growth
Risk
Std DevDownsideDeviation
SharpeRatio
SortinoRatio
MaxDrawdown
# ofMonths
Recovery #of
Months
Manager A
S&P 500 TR
Russell 2000 TR USD
US OE Large Growth
17.81
19.14
24.82
3.80
0.00
5.90
0.17
0.00
0.06
0.24
0.00
0.08
-46.34
-50.95
-52.89
36.00 36.00
37.00 37.00
24.00 24.00
20.22 2.95 0.05 -50.230.07
Risk-Reward
Time Period: 6/1/2007 to 5/31/2012
Ret
urn
Std Dev0.0 10.0 20.0 30.0 40.0 50.0 60.0 70.0
-12.0
-8.0
-4.0
0.0
4.0
8.0
12.0
16.0
Manager A S&P 500 TR Russell 2000 TR USDUS OE Large Growth
Excess Returns (R2000)
Time Period: 6/1/2007 to 5/31/2012
Rolling Window: 3 Years 1 Month shift
Exc
ess
Ret
urn 06 09 12
2011
03 06 09 12
2012
03-10.0
-5.0
0.0
5.0
Manager A
Excess Returns (SP500)
Time Period: 6/1/2007 to 5/31/2012
Rolling Window: 3 Years 1 Month shift
Exc
ess
Ret
urn 06 09 12
2011
03 06 09 12
2012
03-2.5
0.0
2.5
5.0
Manager A
Monthly Performance (%) Net of Fees
Jan Feb Mar Apr May Jun Jul Aug Sep Oct Nov Dec Year
2012
2011
2010
2009
2008
2007
5.03
0.59
-4.58
-5.66
-9.51
2.16
5.49
4.12
2.85
-7.30
-0.33
-2.10
3.76
0.20
5.57
6.97
-1.56
1.39
-0.12
2.70
1.66
6.24
5.31
3.48
-5.62
-1.60
-6.58
6.29
3.30
4.10
-1.58
-3.25
0.02
-4.91
-0.21
0.38
4.89
6.02
-4.14
-0.84
-4.91
-2.82
1.78
-0.77
1.83
-7.43
10.10
5.56
-9.62
6.12
10.19
4.15
-1.16
-15.84
5.01
-0.67
1.10
5.48
-6.99
-2.73
-1.08
3.95
2.97
1.65
0.37
-0.14
16.93
29.23
-37.16
19.78
Manager A - Risk
Inv SP500 R2000
Alpha
Beta
R2
Tracking Error
Correlation
3.07
0.89
90.83
5.83
0.95
0.00
1.00
100.00
0.00
1.00
1.44
1.23
89.86
9.06
0.95
Drawdown
11/2007 5/2008 11/2008 5/2009 11/2009 5/2010 11/2010 5/2011 11/2011 5/2012-60.0
-50.0
-40.0
-30.0
-20.0
-10.0
0.0
Manager A S&P 500 TR Russell 2000 TR USDUS OE Large Growth
Source: Morningstar Direct

Manager A
Manager A Opera�ons
Incep�on Date
Minimum Investment
Annual Report Net Expense Ra�o
Management Fee
Region of Sale
11/6/1929
2,500.00
1.09
0.90
United States
Manager A Snapshot
Base Currency
Morningstar Category
Morningstar Ra�ng Overall
Morningstar Ins�tu�onal Category
Equity Style Box (Long)
US Dollar
US OE Large Growth
ÙÙÙ
Large Valua�onSensi�ve Growth
È
Note for Manager A
Note Text Disclosure Informa�on Custom Text Disclosure Informa�on Note Text Disclosure Informa�on Custom Text
Disclosure Informa�on Note Text Disclosure Informa�on Custom Text Disclosure Informa�on Note Text Disclosure
Informa�on Custom Text Disclosure Informa�on Note Text Disclosure Informa�on Custom Text Disclosure Informa�on Note
Text Disclosure Informa�on Custom Text Disclosure Informa�on Custom Text Disclosure Informa�on Custom Text
Disclosure Informa�on Custom Text Disclosure Informa�on Custom Text Disclosure Informa�on Custom Text Disclosure
Informa�on Custom Text Disclosure Informa�on Custom Text Disclosure Info
Style Box
Mic
roSm
all
Mid
Larg
eG
ian
t
DeepVal CoreVal Core CoreGrth HighGrth
Cumula�ve Performance* Growth of $100,000
1997 1999 2001 2003 2005 2007 2009 201164,000.0
82,000.0
100,000.0
118,000.0
136,000.0
154,000.0
172,000.0
190,000.0
208,000.0
226,000.0
244,000.0
262,000.0
Manager A 190,544.4
*The growth of $100,000 graph is based on a cumula�ve and average annual total return basis. This growth in value is hypothe�cal and represents investment of $100,000 since 1/01/03. Returns reflect the
reinvestment of income, dividends and capital gains, if any, as well as all fees and expenses. Please see the disclosures on the reverse side under the heading "Performance Disclosures" for more important
informa�on.
Investment Strategy
The investment seeks reasonable longterm capital
apprecia�on with a prudent approach to protec�on of capital
from undue risks. The fund normally invests in a managed mix
of equity and debt securi�es with 95% of assets invested in
equity securi�es and 45% of its assets in debt or fixed income
securi�es under normal circumstances. The fixed income
securi�es the fund invests in will generally have a maturity of
20 days to more than 20 years and may be of any credit
quality. Up to 15% of the fund's total assets may be invested
in securi�es issued by companies within a single industry. It
may invest in securi�es of U.S. and foreign issuers.
Manager Biography
A. Smith
Smith is por�olio manager with ABC Investments, Inc. instrumental in helping
launch the firm in 1995. Previously, he spent 15 years as the head of the por�olio
management group for XYZ Company. Smith also served as president with RST
Investments from 1985 to 1989. He began his career in 1975 as an economist with
RST Company.
Smith holds the Chartered Financial Analyst designa�on.
2003 2004 2005 2007 2008 2009 2010 2011
Return 39.74 10.92 14.63 38.49 28.21 15.87 15.99 16.94
Source: Morningstar Direct

Manager A
Custom Text Disclosure Informa�on Custom Text Disclosure Informa�on Custom Text Disclosure Informa�on Custom Text Disclosure
Informa�on Custom Text Disclosure Informa�on Custom Text Disclosure Informa�on Custom Text Disclosure Informa�on Custom Text
Disclosure Informa�on Custom Text Disclosure Informa�on Custom Text Disclosure Informa�on Custom Text Disclosure Informa�on Custom
Text Disclosure Informa�on Custom Text Disclosure Informa�on Custom Text Disclosure Informa�on Custom Text Disclosure Informa�on
Custom Text Disclosure Informa�on Custom Text Disclosure Informa�on Custom Text Disclosure Informa�on Custom Text Disclosure Info
Strategy Characteris�cs *
Por�olio Characteris�cs
# of Holdings
Average Market Cap (mil)
Current Div Yld
LT Earn Growth
24
28,526.40
1.48
12.63
Alpha
Beta
Std Dev
R2
Sharpe Ra�o
Downside Devia�on
2.70
0.86
20.69
61.81
0.14
8.38
Sector Weigh�ng Rela�ve to Benchmark
Consumer Discre�onary
Consumer Staples
Energy
Financials
Health Care
Industrials
Informa�on Technology
Materials
Telecommunica�on Services
U�li�es
15.0 10.0 5.0 0.0 5.0 10.0
RiskReward 5 Year
Re
turn
Std Dev
0.0 4.0 8.0 12.0 16.0 20.0 24.0 28.0
1.0
0.0
1.0
2.0
3.0
RiskReward 3 Year
Re
turn
Std Dev
0.0 4.0 8.0 12.0 16.0 20.0 24.0 28.0
0.0
3.0
6.0
9.0
12.0
15.0
18.0
5 YR
Reward
Risk
2.11
20.69
3 YR
Reward
Risk
3.74
19.23
Top 10 Holdings
Por�olio
Weigh�ng %
US Treasury Note 0.375%
Altria Grp 9.95%
US Treasury Note 0.75%
Ci�group Inc
Morgan Stanley
Whirlpool Corpora�on
Delta Air Lines Inc
Tata Motors, Ltd. ADR
Na�onal Oilwell Varco, Inc.
Nike, Inc. Class B
11.26
7.68
7.51
7.08
5.75
5.34
5.24
5.20
5.04
5.02
QTD YTD 1 year 3 year 5 year 7 Year
ReturnGross
Net
3.2116.03 16.03 4.87 5.4224.69
QTD YTD 1 Year 3 Year 5 Year 7 Year
Manager A
Russell 1000 Growth TR USD
US SA Large Growth
5.38
10.61
16.94 16.94
2.64 2.64
3.74
18.02
2.11
2.50
4.29
3.81
9.54 1.02 1.02 15.52 1.99 4.02
Principal Risk
Foreign Securi�es, Loss of money, Not FDIC insured,
Market/Market Vola�lity, High Yield Securi�es, Industry
and Sector Inves�ng, Other, Fixed Income Securi�es
Source: Morningstar Direct

Manager A As of 5/31/2012
1 The top ten holdings list does not reflect the investment of cash reserves and cash collateral received in securities lending transactions in one or more of Russell's money market funds.
Greatest Impact (-)
Holdings Contribution
BP Plc
ING Groep N.V.
Total SA
Standard Chartered PLC
Barclays PLC
-0.30
-0.29
-0.27
-0.22
-0.21
Greatest Impact (+)
Holdings Contribution
Seven & i Holdings Co., Ltd.
Canadian National Railway Co
Lawson, Inc.
Copa Holdings SA Class A
SXC Health Solutions Corporation
0.09
0.05
0.04
0.03
0.03
Strategy
The investment seeks to provide long-term capital growth. The fund invests principally in equity securities, including common stocks and preferred stocks, issued by companies incorporated in developed markets outside the U.S. and in depositary receipts. It has a non-fundamental policy to invest, under normal circumstances, at least 80% of the value of its net assets in companies that are located in countries (other than the U.S.) with developed markets or that are economically tied to such countries. The fund's securities are denominated principally in foreign currencies and are typically held outside the U.S.
Top 10 fund holdings
Portfolio Date: 3/31/2012 Benchmark: Russell Developed xUS LC NR USD
PortfolioWeighting %
Index %
Russell U.S. Cash Management FundFtse 100 Index Futures (Uk)Topix Index FuturesNestle SACac 40 Index FuturesCanon, Inc.Euro Stoxx 50 Index Futures (Emu)Novartis AGBP PlcTotal SA
5.802.242.231.411.351.261.171.161.080.95
1.67
0.41
1.140.92
Characteristics - most recent quarter
Portfolio Date: 3/31/2012
Fund
RussellDev
ex-USLC Net
Total Market Value (Bil)P/E RatioP/B RatioAverage Market Cap (Bil)% Emerging Markets
5.2712.631.56
26.496.48
12,249.3011.401.36
25.800.15
Sector weightings (%)10.0
11.08.6
8.911.2
9.4
11.112.312.5
12.510.2
12.7
11.810.6
14.4
9.87.5
9.2
16.823.5
19.1
16.522.1
18.8
10.54.7
6.5
6.55.15.1
2.23.9
2.5
0.0 5.0 10.0 15.0 20.0 25.0 30.0
Energy
Materials
Industrials
Consumer Discretionary
Consumer Staples
Healthcare
Financials
Financials ex REITs
Information Technology
Telecom Services
Utilities
Manager A Russell Developed xUS LC NR USD US OE Foreign Large Blend
Allocation of fund assets
Mic
roSm
all
Mid
Larg
eG
iant
Deep-Val Core-Val Core Core-Grth High-Grth
Manager A 3/31/2012 Russell Developed xUS LC NR USD 4/30/2012 US OE Foreign Large Blend 4/30/2012
Characteristics - previous quarter
Portfolio Date: 12/31/2011
Fund
RussellDev
ex-USLC Net
Total Market Value (Bil)P/E RatioP/B RatioAverage Market Cap (Bil)% Emerging Markets
4.8111.731.39
24.435.84
11,148.2611.081.26
24.150.17
Performance
3 month YTD 1 year 3 years 5 years 10 years
Manager A
Russell Developed xUS LC NR USD
MSCI EAFE NR USD -13.62 -3.79 -20.48 3.40 -7.34 4.01
4.74-6.644.04-20.82-3.75-13.69
2.17-21.56-3.62-13.14
Advisors listed are current as of June 30, 2011. XYZ has the right to engage or terminate an advisor at any time and without notice. Manager A is an investment fund of the XYZ Company; it is not a mutual fund. Performance is shown gross of fees. Fees will reduce the overall performance of the fund. Indexes are unmanaged and cannot be invested in directly. Past performance is not indiative of future results.
Source: Morningstar Direct

Manager A As of 5/31/2012
Region exposure relative to peer group
Peer Group (5-95%): Open End Funds - U.S. - Foreign Large Blend
Top Quartile 2nd Quartile 3rd Quartile Bottom Quartile
Americas % Asia dev % Asia emrg % Greater Europe %0.0
7.5
15.0
22.5
30.0
37.5
45.0
52.5
60.0
67.5
75.0
Manager A Russell Developed xUS LC NR USD US OE Foreign Large Blend
Morningstar style box
Portfolio Date: 3/31/2012
27.3 28.5 33.0
4.6 2.2 3.8
0.4 0.0 0.1
Large
Mid
Sm
all
Value Blend Growth
Market Cap %
Market Cap Giant 53.4
Market Cap Large 35.1
Market Cap Mid 10.4
Market Cap Small 0.7
Market Cap Micro 0.5
Fund style weights
Time Period: 6/1/2011 to 3/31/2012
0.0
10.0
20.0
30.0
40.0
50.0
60.0
70.0
80.0
90.0
100.0
6/2011 7/2011 8/2011 9/2011 10/2011 11/2011 12/2011 1/2012 2/2012 3/2012
Value % Core % Growth %
Country weightings (%)5.1
10.82.6
1.90.0
2.9
8.68.1
8.9
7.97.6
8.3
1.42.6
3.0
2.42.1
1.6
15.717.4
16.6
5.72.1
3.0
2.32.3
1.8
1.22.9
2.0
8.16.8
8.1
20.719.3
20.1
3.11.8
1.8
0.0 5.4 10.9 16.3
Canada
China
France
Germany
Hong Kong
Italy
Japan
Netherlands
Spain
Sweden
Switzerland
United Kingdom
United States
Manager A Russell Developed xUS LC NR USD US OE Foreign Large Blend
Advisors listed are current as of June 30, 2011. XYZ has the right to engage or terminate an advisor at any time and without notice. Manager A is an investment fund of the XYZ Company; it is not a mutual fund. Performance is shown gross of fees. Fees will reduce the overall performance of the fund. Indexes are unmanaged and cannot be invested in directly. Past performance is not indiative of future results.
Source: Morningstar Direct

Sample Investment Analysis
Fund Characteris�cs
Morningstar Category
Morningstar Ra�ng Overall
Incep�on Date
Expense Ra�o
Fund Size (Mil)
Firm Name
Web Address
US OE Large Growth
ÙÙÙÙ5/17/1967
0.92
73,006.85
Fidelity Investments
www.fidelity.com
Equity Sectors
Equity Econ Sector Basic Materials %
Equity Econ Sector Consumer Cyclical %
Equity Econ Sector Financial Services %
Equity Econ Sector Real Estate %
Equity Econ Sector Consumer Defensive %
Equity Econ Sector Healthcare %
Equity Econ Sector U�li�es %
Equity Econ Sector Communica�on Services %
Equity Econ Sector Energy %
Equity Econ Sector Industrials %
Equity Econ Sector Technology %
6.09
20.94
10.23
0.26
9.85
8.38
0.00
1.04
8.96
5.56
28.70
3 Year Risk Sta�s�cs
Fund Benchmark
Std Dev
Informa�on Ra�o (geo)
Sharpe Ra�o
Alpha
Beta
R2
Ba�ng Average
Up Capture Ra�o
Down Capture Ra�o
Max Gain
Max Drawdown
18.01
100
16.20
0.70
33
87
92
86.21
14.43
100
100
99.34
15.31
1.01
0.00
1.00
100
0.92
0.99
0.88
96
Asset Alloca�on
Asset Alloc US Equity %
Asset Alloc NonUS Equity %
Asset Alloc US Bond %
Asset Alloc NonUS Bond %
Asset Alloc Cash %
80.02
14.74
0.17
0.01
4.85
5 Year Risk-Reward
Time Period: 1/1/2007 to 12/31/2011
Re
turn
Std Dev0.0 4.0 8.0 12.0 16.0 20.0 24.0 28.0
4.0
2.0
0.0
2.0
4.0
6.0
Sample Investment Russell 1000 Growth TR USD US OE Large Growth
3 Year Risk-Reward
Time Period: 1/1/2009 to 12/31/2011
Re
turn
Std Dev0.0 4.0 8.0 12.0 16.0 20.0 24.0 28.0
0.0
4.0
8.0
12.0
16.0
20.0
24.0
28.0
Sample Investment Russell 1000 Growth TR USD US OE Large Growth
Investment Growth
Time Period: 1/1/2007 to 12/31/2011
6/2007 12/2007 6/2008 12/2008 6/2009 12/2009 6/2010 12/2010 6/2011 12/20114,400.0
5,200.0
6,000.0
6,800.0
7,600.0
8,400.0
9,200.0
10,000.0
10,800.0
11,600.0
12,400.0
13,200.0
Sample Investment Russell 1000 Growth TR USD US OE Large Growth
3 Year Rolling Returns Rela�ve to Peer Group
Peer Group (595%): Open End Funds U.S. Large Growth
Exc
ess
Re
turn
(g
eo
)
2011 2010 2009 2008 2007 2006 2005 2004 2003 200220.0
15.0
10.0
5.0
0.0
5.0
10.0
15.0
20.0
25.030.0
Sample Investment
Source: Morningstar Direct

Manager A
Investment Growth
Time Period: 6/1/2007 to 5/31/2012
11/2007 5/2008 11/2008 5/2009 11/2009 5/2010 11/2010 5/2011 11/2011 5/201240.0
47.5
55.0
62.5
70.0
77.5
85.0
92.5
100.0
107.5
115.0
122.5
Manager A S&P 500 TR US OE Large Growth
Performance Relative to Peer Group
Peer Group (5-95%): Open End Funds - U.S. - Large Growth
Ret
urn
1 Wk 1 Mo 3 Mo 6 Mo 9 Mo YTD 1 year 3 years-12.0
-10.0
-8.0
-6.0
-4.0
-2.0
0.0
2.0
4.0
6.0
8.0
10.0
12.0
14.0
16.0
18.020.0
Manager A S&P 500 TR US OE Large Growth
Trailing Returns
Data Point: Return Peer Group: Open End Funds - U.S. - Large Growth
1 Wk 1 Mo 3 Mo 6 Mo 9 Mo YTD 1 Yr 3 Yr
Manager A
S&P 500 TR
US OE Large Growth
Average
5th Percentile
25th Percentile
50th Percentile
-7.37
-5.62
-6.67
-7.20
-4.92
-2.37
-3.76
-4.71
5.23
9.04
6.90
5.29
6.53
11.74
9.00
7.03
6.46
10.14
8.08
6.57
-3.18
4.12
-0.21
-2.78
13.97
19.28
15.49
13.81
-6.01 -3.53 6.23 9.32 5.16
-5.62 -2.18 7.21 8.62 8.38
-7.37 -4.92
2.05
5.26 6.57 6.47 -3.26 13.71
-0.41
15.68
14.92
Market Performance
Time Period: 6/1/2007 to 5/31/2012
BestMonth
WorstMonth
BestQuarter
WorstQuarter
UpCapture
Ratio
DownCapture
RatioR2
Manager A
S&P 500 TR
US OE Large Growth
10.93 -16.79 15.93 -21.94 100.00 100.00
11.78 -17.55
85.5397.51-20.4314.96-15.8410.19
100.00
90.83
107.45 104.0815.80 -23.31 95.14
Returns
Ret
urn
1 Wk 1 Mo 3 Mo 6 Mo 9 Mo YTD 1 Yr 3 Yr-8.0
-6.0
-4.0
-2.0
0.0
2.0
4.0
6.0
8.0
10.0
12.0
14.016.0
Manager A S&P 500 TR US OE Large Growth
Source: Morningstar Direct

Manager A
Risk
Time Period: 6/1/2007 to 5/31/2012
Return Std DevDownsideDeviation
Alpha Beta R2Sharpe
Ratio(arith)
TrackingError
Manager A
S&P 500 TR
US OE Large Growth
2.41
-0.92
17.81
19.14
3.80
0.00
3.07
0.00
-0.16 20.22
0.89
1.00
90.83
100.00
0.09
-0.09
5.83
0.00
2.95 0.98 1.03 95.14 -0.05 4.51
Risk-Reward
Time Period: 6/1/2007 to 5/31/2012
Ret
urn
Std Dev
0.0 10.0 20.0 30.0 40.0 50.0 60.0 70.0
-12.0
-8.0
-4.0
0.0
4.0
8.0
12.0
16.0 Manager A
S&P 500 TR
US OE Large Growth
Portfolio Statistics
Inv Bmk1 Cat Avg
Equity Style Box (Long)
Average Market Cap (mil) (Long)
P/E Ratio (TTM) (Long)
P/B Ratio (TTM) (Long)
P/S Ratio (TTM) (Long)
P/C Ratio (TTM) (Long)
Debt to Capital % (trailing) (Long)
ROA % (TTM) (Long)
ROE % (TTM) (Long)
È
52,449.34
14.03
2.05
1.26
8.59
35.88
9.37
22.62
É
43,257.13
18.65
3.09
2.34
13.58
27.09
12.36
24.65
É
48,903.50
18.22
3.54
2.00
12.34
26.57
12.34
25.07
Rolling Excess Return
Time Period: 6/1/2007 to 5/31/2012
Rolling Window: 3 Years 1 Month shift
1st to 25th Percentile 26th Percentile to Median 51st to 75th Percentile 76th to 100th Percentile
Exc
ess
Ret
urn
06 07 08 09 10 11 12
2011
01 02 03 04 05 06 07 08 09 10 11 12
2012
01 02 03 04 05100.00
75.00
50.00
25.00
0.00
Manager A S&P 500 TR US OE Large Growth
Rolling Sharpe
Time Period: 6/1/2007 to 5/31/2012
Rolling Window: 3 Years 1 Month shift
Top Quartile 2nd Quartile 3rd Quartile Bottom Quartile
Sha
rpe
Rat
io
05 06 07 08 09 10 11 12
2011
01 02 03 04 05 06 07 08 09 10 11 12
2012
01 02 03 04 05-0.75
0.00
0.75
1.50
2.25
Manager A S&P 500 TR US OE Large Growth
Source: Morningstar Direct

Manager A
Attribution/Contribution
Time Period: 3/1/2012 to 5/31/2012
PortfolioWeights
BenchmarkWeights
PortfolioReturn
BenchmarkReturn
PortoflioContribution
BenchmarkContribution
WeightingEffect
SelectionEffect
ActiveReturn
Consumer Discretionary
Consumer Staples
Energy
Financials
Health Care
Industrials
Information Technology
Materials
Telecommunication Services
Utilities
Cash
Attribution Total
Bond
Other
Missing Performance
Total
22.02 11.00 3.83 -0.01 0.84 0.00 0.39 0.84 1.23
7.81 10.80 4.17 2.57 0.33 0.28 -0.17 0.11 -0.06
7.20 11.50 -19.08 -14.03 -1.43 -1.67 0.44 -0.38 0.06
10.40 14.59 -1.47 -4.67 -0.20 -0.68 0.03 0.36 0.38
8.43 11.38 -0.24 0.36 -0.02 0.05 -0.11 -0.05 -0.16
4.56 10.60 -2.13 -5.91 -0.09 -0.64 0.14 0.17 0.31
29.75 20.31 -2.20 -4.80 -0.62 -0.97 -0.12 0.78 0.66
4.01 3.49 -18.33 -8.27 -0.82 -0.29 -0.04 -0.49 -0.53
0.20 2.80 -13.43 9.42 -0.02 0.26 -0.35 -0.03 -0.38
0.13 3.41 1.62 3.83 0.00 0.13 -0.25 0.00 -0.25
4.01 0.11 0.01 0.01 0.00 0.00 0.23 0.00 0.23
98.51 99.98 -2.04 -3.53 -2.04 -3.53 0.20 1.30 1.50
0.17 0.00
0.08 0.00
1.24 0.02
100.00 100.00 -2.04 -3.53
Relative Weights
Information Technology
Consumer Discretionary
Financials
Health Care
Consumer Staples
Energy
Industrials
Cash
Materials
Telecommunication Services
Utilities
0.0 7.5 15.0 22.5 30.0
Relative Return
-22.5 -15.0 -7.5 0.0 7.5
Weighting Effect
-0.5 -0.3 0.0 0.3 0.5
Selection Effect
-0.5 0.0 0.5 1.0
Active Return
-0.8 0.0 0.8 1.5
Source: Morningstar Direct

Manager A
Weighting Effects
Time Period: 3/1/2012 to 5/31/2012
Underperform Outperform Overw
eigh
tU
nd
erweig
ht
Rel
ativ
e W
eigh
t
Relative Return
12.00
6.00
0.00
-6.00
-12.00-15.00 -12.00 -9.00 -6.00 -3.00 0.00 3.00 6.00 9.00 12.00 15.00
5
4
3 21
5
4
3
2
1
Best Weighting Weight +/- Return +/- Effect1 Energy -4.15 -10.50 0.442 Consumer Discretionary 11.34 3.52 0.393 Cash 3.96 3.54 0.234 Industrials -5.98 -2.38 0.145 Financials -4.06 -1.14 0.03
Worst Weighting Weight +/- Return +/- Effect1 Telecommunication Services -2.60 12.95 -0.352 Utilities -3.29 7.36 -0.253 Consumer Staples -2.88 6.10 -0.174 Information Technology 9.85 -1.26 -0.125 Health Care -2.77 3.90 -0.11
GICS Sectors
Portfolio Date: 4/30/2012
Energy % Materials % Industrials %Consumer
Discretionary %ConsumerStaples %
Healthcare % Financials %Information
Technology %Telecom
Services %Utilities %
Manager A
S&P 500 TR
US OE Large Growth
6.94 3.89 4.65 23.95 8.40 9.53 11.41 30.99 0.13 0.11
11.22 3.45 10.51 11.22 10.85 11.39 14.68 20.29 2.91 3.50
8.39 3.10 10.77 20.72 5.66 12.57 4.72 33.33 0.42 0.31
Source: Morningstar Direct

Manager A
Top Holdings
Portfolio Date: 4/30/2012
Style Box SectorPortfolio
Weighting %
Apple, Inc.
Google, Inc. Class A
Berkshire Hathaway Inc Class A
McDonald's Corporation
Coca-Cola Co
Wells Fargo & Co
Noble Energy Inc
TJX Companies
Walt Disney Co
Nike, Inc. Class B
É Hardware 9.13
É Telecommunications 4.36
È Financial Services 2.99
É Consumer Services 2.68
É Consumer Goods 2.57
È Financial Services 2.21
É Energy 2.05
È Consumer Services 1.83
É Media 1.72
É Consumer Goods 1.44
Equity Sectors (GICS)
Portfolio Date: 4/30/2012
%Energy % 6.9Materials % 3.9Industrials % 4.6Consumer Discretionary % 23.9Consumer Staples % 8.4Healthcare % 9.5Financials % 11.4Information Technology % 31.0Telecom Services % 0.1Utilities % 0.1Total 100.0
Holdings-Based Style
Mic
roS
mal
lM
idLa
rge
Gia
nt
Deep-Val Core-Val Core Core-Grth High-Grth
Manager A 4/30/2012 S&P 500 TR 5/31/2012 US OE Large Growth4/30/2012
Equity Sectors Shift (GICS)
Time Period: 6/1/2005 to 4/30/2012
0.0
10.0
20.0
30.0
40.0
50.0
60.0
70.0
80.0
90.0100.0
2005 2006 2007 2008 2009 2010 2011 2012
Energy % Materials % Industrials % Consumer Discretionary % Consumer Staples % Healthcare % Financials % Information Technology % Telecom Services % Utilities %
Source: Morningstar Direct

Manager A
Drawdown
Time Period: 6/1/2002 to 5/31/2012
2002 2003 2004 2005 2006 2007 2008 2009 2010 2011 2012-55.0
-50.0
-45.0
-40.0
-35.0
-30.0
-25.0
-20.0
-15.0
-10.0
-5.0
0.0
Manager A S&P 500 TR US OE Large Growth
Drawdown
Time Period: 6/1/2007 to 5/31/2012
MaxDrawdown
MaxDrawdown #
ofPeriods
MaxDrawdown
PeakDate
MaxDrawdown
ValleyDate
Omega
Manager A
S&P 500 TR
US OE Large Growth -50.23 16.00 11/1/2007 2/28/2009
-46.34
-50.95
16.00
16.00
11/1/2007
11/1/2007
2/28/2009
2/28/2009
1.07
0.93
0.96
Source: Morningstar Direct

Mutual Fund Evaluation
As of 5/31/2012 Equity
Performance data quoted represents past performance which is no guarantee of future results. Investment return and principal value will fluctuate so that an investor's shares, when redeemed may be worth more or less than their original cost. Current performance may be lower or higher than what is stated. For current to the most recent month end performance and after tax returns, visit XYZ.com or call 1-800-000-0000.
For Class A Shares, load figures reflect the maximum sales charge of 4.8% for fixed income funds and 5.5% for equity funds (except that returns for Short-Term Income Fund and Short-Intermediate Duration Municipal Trust reflect the maximum 1% sales charge, returns for Government Ultrashort Duration Fund, Municipal Ultrashort Fund, and Ultrashort Bond Fund reflect the maximum 2% sales charge, and returns for California Intermediate Municipal Trust reflect the maximum 3% sales charge). For other share classes, load figures reflect the maximum sales charge of 1% for Class G Shares and the maximum contingent deferred sales charge of 5.8% for Class B Shares, 1% for Class C Shares, and 1% for Class F Shares. If shares of the High Yield funds are redeemed or exchanged within 90 days of purchase, a 2% redemption fee will be charged. If shares of the International Equity funds are redeemed or exchanged within 30 days of purchase, a 2% redemption will be charged. The redemption fee will be paid to the fund.
Morningstar ratings are based on risk-adjusted total return. The overall rating is derived from a weighted average of the fund's three-, five-, and ten- year average annual retuns, as applicable.
For each fund with at least a three-year history, Morningstar calculates a Morningstar Rating TM based on a Morningstar Risk-Adjusted Return measure that accounts for variation in a fund's monthly performance (including the effects of sales charges, loads, and redemption fees), placing more emphasis on downward variations and rewarding consistent performance. The top 10% of funds in each category receive 5 stars, the next 22.5% receive 4 stars, the next 35% receive 3 stars, the next 22.5% receive 2 stars and the bottom 10% receive 1 star. (Each share class is counted as a fraction of one fund within this scale and rated separately, which may cause slight variations in the distribution percentages.) The Overall Morningstar Rating for a fund is derived from a weighted-average of the performance figures associated with its 3-,5- and 10-year (if applicable) Morningstar Rating metrics. Ratings are for the share classes indicated; other classes may have different performance characteristics.
Returns % (No Load)
1 YearTotal
Return(%)
5 YearTotal
Return(%)
10 YearTotal
Return(%)
InceptionTotal
Return(%)
InceptionCumulative
Return(%)
InceptionDate
Manager A
S&P 500 TR
US OE Large Growth
-0.41 -0.92 4.14 10.05 1/30/1970
-6.50 1.41 5.41 8.49 83,248.37 11/6/1929
-3.18 0.25 4.03 12/1/1925
Returns % (Load Adjusted)
1 YearTotal
Return(%)
5 YearTotal
Return(%)
10 YearTotal
Return(%)
InceptionTotal
Return(%)
InceptionDate
Manager A
S&P 500 TR
US OE Large Growth
1/30/1970
-6.50 1.41 5.41 8.49 11/6/1929
-4.41 0.05 3.93 12/1/1925
Ratings
MorningstarRating
Numberof Funds
in Cat
MorningstarRating 3
Yr
Numberof Funds
in 3Yr Cat
MorningstarRating 5
Yr
Numberof Funds
in 5Yr Cat
MorningstarRating10 Yr
Numberof Funds
in 10Yr Cat
Manager AS&P 500 TRUS OE Large Growth
ÙÙÙ 1,797 Ù 1,520 ÙÙÙÙ 1,311 ÙÙÙÙ 854
ÙÙÙ ÙÙÙ ÙÙÙ ÙÙÙ
Page 1
Source: Morningstar Direct

Mutual Fund Evaluation
As of 5/31/2012 Equity
Portfolio Statistics
ProspectusNet
ExpenseRatio
PortfolioDate
MPTBenchmark
Alpha 3Yr
Beta 3 Yr R2 3 YrSharpeRatio 3
Yr
InfoRatio 3
Yr
TurnoverRatio %
AverageMarket
Cap
P/ERatio
(TTM)
P/BRatio
(TTM)Developed % Emerging %
12 MoYield
Manager A
S&P 500 TR
US OE Large Growth
1.09 3/31/2012 S&P 500 TR -7.66 1.07 77.65 0.44 -0.85 404.00 28,526.40 14.98 1.57 92.90 7.10 0.27
5/31/2012 0.94 52,449.34 14.03 2.05 100.00 0.00
1.31 4/30/2012 S&P 500 TR -1.79 1.08 93.49 0.81 -0.28 64.27 48,903.50 18.22 3.54 98.58 1.42
Sources : Company Database, Morningstar DirectMorningstar ratings are based on risk-adjusted total return.
The overall rating is derived from a weighted average of the fund's three-, five-, and ten-year average annual returns, as applicable
Expenses reported are after waivers/reimbursements. Total Returns don't reflect sales charges.Sales charges are waived for trust department retirement plans and institutional investors. If reflected, such changes would reduce the performance quoted.
This material has been prepared by XYZ specifically forxxxxxxxxxxxxxxxxx and may not be reproduced or used as sales literature.
It is not complete without the appropriate disclosure attached.
Performance
TickerMorningstar
Category
YTDTotal
Return(%)
YTDMstar %
CatRank
1 YearTotal
Return(%)
1 YearMstar %
CatRank
3 YearTotal
Return(%)
3 YearMstar %
CatRank
5 YearTotal
Return(%)
5 YearMstar %
CatRank
10 YearTotal
Return(%)
10 YearMstar %
CatRank
MorningstarRatingOverall
Manager A
S&P 500 TR
US OE Large Growth
LOMMX US OE Large Growth 6.30 54 -6.50 78 7.04 98 1.41 31 5.41 17 ÙÙÙ
SPYZ 5.16 -0.41 14.92 -0.92 4.14
Large Growth 6.46 -3.18 13.95 0.25 4.03 ÙÙÙ
Page 2
Source: Morningstar Direct

Mutual Fund Evaluation
As of 5/31/2012 Equity
Load-waived (LW) ratings do not reflect sales charge and redemption fees. Load-waived ratings should only be considered by investors who are not subject to a front-end sales charge. These ratings are calculated according to the methodology for the Morningstar Rating for funds, and they supplement the ratings for the original A share class, which reflects the maximum front load.
An investment in money market funds is neither insured nor guaranteed by the Federal Deposit Insurance Corporation or any other government agency. Although money market funds seek to preserve the value of your investment at $1.00 per share, it is possible to lose money by investing in these funds
The 7-day net annualized yield is based on the average net income per share for the seven days ended on the date of calculation and the offering price on that date. Yield quotations for money market funds more closely reflect the current earnings of the fund than the total return quotation.
Any performance information reported for periods prior to the fund's inception date is extended performance as calculated by Morningstar, Inc., and is based upon the performance of an older class of shares of the fund. If the expenses of the older class are lower, the performance has been adjusted to reflect the higher expenses of the newer class. This extended performance is not calculated according to the SEC standards and may not be used with the public in sales literature or advertising.
Copyright 2012 Morningstar, Inc. All rights Reserved. The information contained herein: (1) is proprietary to Morningstar and/or its content providers; (2) may not be copied or distributed; and (3) is not warranted to be accurate, complete or timely. Neither Morningstar nor its content providers are responsible for any damages or losses arising from any use of this information. Past performance is no guarantee of future results.
Performance for some of these funds may have been lower in the absence of temporary expense waivers or reimbursements. Please consult the prospectuses for more information.
Some of these funds may offer separate classes of shares, which will have different performance due to differences in charges and expenses. Consult your investment representative for information on these classes.
The information contained herein has been obtained from sources deemed to be reliable but neither its accuracy nor completeness is guaranteed.
The attached is being provided to you at your request for specific information and may not be representative of the funds' performance during different market conditions Moreover because of differences in factors such as portfolio funds conditions. Moreover, composition, investment objectives, management policies, fund fees and expenses, the attached information, by itself, might not permit you to make a complete comparison of the funds. Please consult the prospectuses for a discussion of these differences and consider them carefully when comparing performance.
Mutual funds are not bank deposits or obligations, are not guaranteed by any bank, and are not insured or guaranteed by the U.S. government, the FDIC, the Federal Reserve Board, or any other government agency. Investment in mutual funds involves investment risk, including possible loss of principal.
Total return represents the change in the value of an investment after reinvesting all income and capital gains. See the prospectus for other fees and expenses that apply to a continued investment in the Fund.
Total Returns less than one year are cumulative. All other returns are average annual total returns unless otherwise indicated.
Performance shown is before-tax.
Morningstar category identifies funds based on their actual investment styles as measured by their underlying portfolio holdings over the past three years. If the fund is less than three years old, the category is based on the life of the fund.
Page 3
Source: Morningstar Direct

Attribution and Holdings Analysis
Cumulative Attribution EffectsTime Period: 1/1/2012 to 5/31/2012
Portfolio: Manager A Benchmark: S&P 500 TR
GICS Sector- Cumulative Attribution Effects
Cumulative Allocation EffectCumulative Selection EffectCumulative Active Return
Attribution EffectsAllocation EffectSelection EffectActive Return
Attribution Effect %16.00
12.00
8.00
4.00
0.00
-4.00
-8.00
6.00
3.00
0.00
-3.00
1-31-2012 2-29-2012 3-31-2012 4-30-2012 5-31-2012
Attribution/Contribution
Time Period: 1/1/2012 to 5/31/2012
Portfolio: Manager A Benchmark: S&P 500 TR
PortfolioWeights
BenchmarkWeights
PortfolioRescaledWeights
BenchmarkRescaledWeights
PortfolioReturn
BenchmarkReturn
PortfolioContribution
BenchmarkContribution
AllocationEffect
SelectionEffect
ActiveReturn
Consumer Discretionary
Consumer Staples
Energy
Financials
Health Care
Industrials
Information Technology
Materials
Telecommunication Services
Utilities
Attribution Total
Total
44.39 10.90 44.39 10.92 11.90 10.87 5.23 1.16 1.95 0.52 2.48
14.69 10.97 14.69 10.98 27.81 4.67 4.17 0.54 0.01 3.32 3.33
7.70 11.75 7.70 11.72 -13.94 -7.57 -1.17 -0.90 0.57 -0.46 0.11
13.13 14.32 13.13 14.33 17.36 8.21 2.34 1.10 0.00 1.18 1.18
0.00 11.54 0.00 11.51 4.82 0.00 0.58 0.04 0.00 0.04
3.65 10.69 3.65 10.70 5.15 3.45 0.21 0.37 0.14 0.04 0.18
14.29 19.92 14.29 19.94 42.65 10.06 5.51 1.91 -0.33 4.17 3.84
2.16 3.54 2.16 3.54 11.04 1.63 0.25 0.06 0.06 0.21 0.27
0.00 2.82 0.00 2.82 10.36 0.00 0.31 -0.18 0.00 -0.18
0.00 3.55 0.00 3.54 0.77 0.00 0.03 0.16 0.00 0.16
100.00 100.00 100.00 100.00 16.55 5.15 16.55 5.15 2.41 8.98 11.40
100.00 100.00 16.55 5.15
Source: Morningstar Direct

Attribution and Holdings Analysis
Allocation EffectsTime Period: 1/1/2012 to 5/31/2012
Portfolio: Manager A Benchmark: S&P 500 TR
Underperform Outperform Overw
eig
ht
Un
derw
eig
ht
Rel
ativ
e W
eight
Relative Return
40.00
20.00
0.00
-20.00
-40.00-15.00 -12.00 -9.00 -6.00 -3.00 0.00 3.00 6.00 9.00 12.00 15.00
4
32
1
5
432
1
Best Weighting Weight +/- Return +/- Effect1 Consumer Discretionary 33.48 5.72 1.952 Energy -4.02 -12.72 0.573 Utilities -3.54 -4.38 0.164 Industrials -7.06 -1.70 0.145 Materials -1.38 -3.52 0.06
Worst Weighting Weight +/- Return +/- Effect1 Information Technology -5.66 4.91 -0.332 Telecommunication Services -2.82 5.21 -0.183 Financials -1.20 3.06 0.004 Consumer Staples 3.71 -0.48 0.01
Selection EffectsTime Period: 1/1/2012 to 5/31/2012
Portfolio: Manager A Benchmark: S&P 500 TR
Underperform Outperform Overw
eig
ht
Un
derw
eig
ht
Rel
ativ
e W
eight
Relative Return
16.00
8.00
0.00
-8.00
-16.00-35.00 -28.00 -21.00 -14.00 -7.00 0.00 7.00 14.00 21.00 28.00 35.00
109
87
6
54
32
1
10
9
8
7
6 5 4
3
2
1
Best Selections GICS Sector Weight +/- Return +/- Effect1 Apple, Inc. Information Technology 11.47 32.59 3.362 Whole Foods Market, ... Consumer Staples 14.55 23.14 3.293 McDonald's Corporation Consumer Discretionary -3.38 -20.50 0.764 American Express Co Financials 5.91 10.99 0.645 Starbucks Corporation Consumer Discretionary 6.73 9.22 0.596 U.S. Bancorp Financials 6.39 7.50 0.467 Procter & Gamble Co Consumer Staples -1.99 -9.77 0.218 Amazon.com Inc Consumer Discretionary 1.77 12.13 0.209 Google, Inc. Class A Information Technology -0.92 -20.13 0.2010 Monsanto Company Materials 1.95 9.41 0.19
Worst Selections GICS Sector Weight +/- Return +/- Effect1 Ralph Lauren Corp Consumer Discretionary 11.39 -2.98 -0.292 Walt Disney Co Consumer Discretionary -2.46 11.02 -0.283 Comcast Corp Class A Consumer Discretionary -2.53 11.72 -0.274 Murphy Oil Corporation Energy 3.26 -7.92 -0.255 BP PLC ADR Energy 4.38 -5.18 -0.216 Las Vegas Sands Corp Consumer Discretionary 11.95 -2.32 -0.207 TJX Companies Consumer Discretionary -0.93 21.78 -0.208 Priceline.com, Inc. Consumer Discretionary -1.03 22.86 -0.199 Home Depot, Inc. Consumer Discretionary -2.43 7.92 -0.1910 Bank of America Corp... Financials -0.60 24.33 -0.12
Source: Morningstar Direct

Attribution and Holdings Analysis
Attribution Detail
Time Period: 1/1/2012 to 5/31/2012
Benchmark: S&P 500 TR
Allo
cation E
ffec
t
GICS Sector
ConsumerDiscretionary
ConsumerStaples
Energy Financials HealthCare
Industrials InformationTechnology
Materials TelecommunicationServices
Utilities-0.60
-0.40
-0.20
0.00
0.20
0.40
0.60
0.80
1.00
1.20
1.40
1.60
1.802.00
Manager A Manager B Manager C
Attribution Summary - Scatter Plot
Time Period: 1/1/2012 to 5/31/2012
Benchmark: S&P 500 TR
Sel
ection E
ffec
t
Allocation Effect
-1.00 0.00 1.00 2.00
-3.00
0.00
3.00
6.00
9.00
12.00
Manager A Manager B Manager C
Attribution Summary
Time Period: 1/1/2012 to 5/31/2012
Benchmark: S&P 500 TR
AllocationEffect
SelectionEffect
ActiveReturn
Manager A
Manager B
Manager C
2.41 8.98 11.40
-0.23 -0.54 -0.77
0.00 -1.45 -1.45
Highest/Lowest
Time Period: 1/1/2012 to 5/31/2012
Portfolio: Manager A
Groupings WeightsRelativeWeights
RescaledWeights
RelativeRescaledWeights
ReturnRelativeReturn
ContributionRelative
ContributionAllocation
EffectSelection
EffectActiveReturn
Information Technology
Consumer Discretionary
Consumer Staples
Financials
Materials
Industrials
Utilities
Health Care
Telecommunication Services
Energy
14.29 -5.64 14.29 -5.66 42.65 32.59 5.51 3.61 -0.33 4.17 3.84
44.39 33.49 44.39 33.48 11.90 1.03 5.23 4.07 1.95 0.52 2.48
14.69 3.72 14.69 3.71 27.81 23.14 4.17 3.63 0.01 3.32 3.33
13.13 -1.19 13.13 -1.20 17.36 9.15 2.34 1.24 0.00 1.18 1.18
2.16 -1.38 2.16 -1.38 11.04 9.41 0.25 0.19 0.06 0.21 0.27
3.65 -7.05 3.65 -7.06 5.15 1.69 0.21 -0.16 0.14 0.04 0.18
0.00 -2.82 0.00 -2.82 0.00 -0.31 -0.18 0.00 -0.18
0.00 -11.54 0.00 -11.51 0.00 -0.58 0.04 0.00 0.04
0.00 -3.55 0.00 -3.54 0.00 -0.03 0.16 0.00 0.16
7.70 -4.05 7.70 -4.02 -13.94 -6.37 -1.17 -0.27 0.57 -0.46 0.11
Source: Morningstar Direct

Attribution and Holdings Analysis
Manager B - Top Holdings
Portfolio Date: 3/31/2012
PortfolioWeighting %
JPMorgan Chase & CoPhilip Morris International, Inc.News Corp Class BWells Fargo & CoU.S. BancorpEl Paso CorporationTime Warner IncInternational Business Machines CorpTime Warner Cable Inc Class AExxon Mobil Corporation
3.973.613.143.052.842.762.712.642.572.43
Manager A - Top Holdings
Portfolio Date: 5/31/2012
PortfolioWeighting %
Whole Foods Market, Inc.
Apple, Inc.
Ralph Lauren Corp
Las Vegas Sands Corp
Starbucks Corporation
U.S. Bancorp
Starwood Hotels & Resorts Worldwide Inc
American Express Co
Amazon.com Inc
BP PLC ADR
16.46
15.83
10.65
10.51
8.52
7.06
6.93
6.51
4.44
3.55
Manager B - Equity Sectors (GICS)
Portfolio Date: 3/31/2012
%
Energy 13.9
Materials 3.2
Industrials 9.0
Consumer Discretionary 16.5
Consumer Staples 11.9
Healthcare 7.1
Financials 22.8
Information Technology 9.5
Telecom Services 3.9
Utilities 2.1
Total 100.0
Manager A - Equity Sectors (GICS)
Portfolio Date: 5/31/2012
%
Energy 6.2
Materials 2.1
Industrials 3.6
Consumer Discretionary 42.2
Consumer Staples 16.5
Healthcare 0.0
Financials 13.6
Information Technology 15.8
Telecom Services 0.0
Utilities 0.0
Total 100.0
Holdings-Based Style Trail
Mic
roSm
all
Mid
Larg
eG
iant
Deep-Val Core-Val Core Core-Grth High-Grth
Manager A Manager B Manager C
S&P 500 TR
Manager C - Top Holdings
Portfolio Date: 3/31/2012
PortfolioWeighting %
Chevron Corp
General Electric Co
Pfizer Inc
JPMorgan Chase & Co
Wells Fargo & Co
Exxon Mobil Corporation
Procter & Gamble Co
AT&T Inc
Johnson & Johnson
Cisco Systems Inc
4.37
3.81
3.75
3.73
3.45
3.34
3.18
3.10
2.73
2.66
Manager C - Equity Sectors (GICS)
Portfolio Date: 3/31/2012
%Energy 12.5Materials 2.0Industrials 7.9Consumer Discretionary 9.9Consumer Staples 8.5Healthcare 14.1Financials 25.2Information Technology 10.2Telecom Services 5.7Utilities 3.9Total 100.0
Valuations
18.7
13.9
13.0
14.0
4.0
1.9
1.6 2.0
1.9
1.3
1.1 1.3
14.9
8.5
7.3 8.6
0.0
10.0
20.0
30.0
P/E Ratio (TTM) (Long)
P/B Ratio (TTM) (Long)
P/S Ratio (TTM) (Long)
P/C Ratio (TTM) (Long)
Manager A Manager B Manager CS&P 500 TR
Source: Morningstar Direct

Manager A Por�olio Analysis
Top Holdings
Por�olio
Weigh�ng %
Samsung Electronics Co Ltd GDR
America Movil, S.A.B. de C.V. ADR
Companhia de Bebidas das Americas Ambev ADR
Taiwan Semiconductor Manufacturing
Hon Hai Precision Ind. Co., Ltd.
Arcelik A.S.
Sberbank of Russia OJSC ADR
Vale SA ADR
LUKOIL Oil Company JSC ADR
CocaCola Femsa, S.A.B. de C.V. ADR
3.92
2.55
2.51
2.39
2.14
2.14
1.95
1.84
1.82
1.82
Characteris�cs
Inv Bmk1
Average Market Cap (mil)
Dividend Yield
P/E Ra�o (TTM)
LT Earn Growth
P/C Ra�o (TTM)
P/B Ra�o (TTM)
P/S Ra�o (TTM)
Net Margin % (trailing)
Debt to Capital % (trailing)
ROE % (TTM)
19,467.92
2.46
12.09
11.67
9.08
2.17
1.83
21.41
21.63
23.45
18,193.87
3.38
11.12
13.88
7.20
1.57
1.14
17.79
23.73
17.97
Composi�on
# of Holdings (Long)
# of Stock Holdings (Long)
Cash %
US Equity %
NonUS Equity %
% Asset in Top 10 Holdings
Morningstar Ra�ng Overall
81
77
0.00
0.00
95.58
23.07
ÙÙÙÙ
Equity Sectors (GICS)
%
Consumer Discre�onary % 5.7
Consumer Staples % 13.2
Energy % 12.7
Financials % 22.9
Healthcare % 4.8
Industrials % 8.3
Informa�on Technology % 17.0
Materials % 8.5
Telecom Services % 7.0
U�li�es % 0.0
A�ribu�on Total
A�ribu�on Total
Alloca�on Effect
Selec�on Effect
Ac�ve Return
1.13
3.87
5.00
Holdings-Based Style
Mic
roS
ma
llM
idLa
rge
Gia
nt
DeepVal CoreVal Core CoreGrth HighGrth
Top 10 Holding Contributors
Holdings Return Contribu�on
Arcelik A.S.
Tencent Holdings Ltd.
Samsung Electronics Co Ltd GDR
Grupo Financiero Banorte SAB de CV
Siam Commercial Bank Public Company Limited
Taiwan Semiconductor Manufacturing
CocaCola Femsa, S.A.B. de C.V. ADR
Ambuja Cements Ltd.
Ecopetrol S.A. ADR
Sberbank of Russia OJSC ADR
73.37 1.15
70.11 1.00
30.71 0.95
88.05 0.82
55.33 0.74
25.99 0.64
37.90 0.58
33.34 0.55
33.27 0.51
22.51 0.49
Bo�om 10 Holding Contributors
Holdings Return Contribu�on
ANTA Sports Products Ltd.
Vale S.A. ADR
United Tractors Tbk
Itau Unibanco Holding SA ADR
Wumart Stores, Inc. H Shares
Impala Pla�num Holdings
Petroleo Brasileiro SA Petrobras ADR
Gazprom OAO ADR
Millicom Interna�onal Cellular SA DR
Vale S.A. ADR
29.81 0.30
14.84 0.27
24.50 0.24
16.10 0.22
27.41 0.22
17.77 0.16
5.89 0.14
1.77 0.12
6.30 0.12
11.80 0.08
Sector Contribu�on
Groupings Return Contribu�on
Financials
Informa�on Technology
Consumer Staples
Energy
Health Care
Consumer Discre�onary
Telecommunica�on Services
Industrials
Materials
U�li�es
20.83 4.28
24.19 4.08
13.67 2.14
13.05 1.67
31.48 1.13
15.59 1.11
10.87 1.00
15.64 0.93
7.32 0.67
0.00
As of 9/30/2012 iShares MSCI Emerging Markets Index Page 1 of 11

Manager A Por�olio Analysis
Manager A - Equity Regional Exposure
Time Period: 9/1/1999 to 6/30/2012
0.0
10.0
20.0
30.0
40.0
50.0
60.0
70.0
80.0
90.0
100.0
2000 2001 2002 2003 2004 2005 2006 2007 2008 2009 2010 2011 2012
North America % La�n America % United Kingdom %
Europe dev % Europe emrg % Africa/Middle East %
Australasia % Japan % Asia dev %
Asia emrg %
Manager A - Equity Market Capitaliza�on
Time Period: 9/1/1999 to 6/30/2012
0.0
10.0
20.0
30.0
40.0
50.0
60.0
70.0
80.0
90.0
100.0
2000 2001 2002 2003 2004 2005 2006 2007 2008 2009 2010 2011 2012
Giant % Large % Mid %
Small % Micro %
As of 9/30/2012 iShares MSCI Emerging Markets Index Page 2 of 11

Manager A Por�olio Analysis
A�ribu�on/Contribu�on Summary
Time Period: 1/1/2012 to 9/30/2012
Por�olio
Weights
Por�olio
Return
Por�olio
Contribu�on
Benchmark
Weights
Benchmark
Return
Benchmark
Contribu�on
Alloca�on
Effect
Selec�on
Effect
Ac�ve
Return
Consumer Discre�onary
Consumer Staples
Energy
Financials
Health Care
Industrials
Informa�on Technology
Materials
Telecommunica�on Services
U�li�es
Unclassified
Cash
A�ribu�on Total
Bond
Other
Missing Performance
Total
6.56 15.59 1.11 8.13 12.50 1.07 0.14 0.31 0.17
13.81 13.67 2.14 7.12 17.12 1.29 0.22 0.28 0.06
12.59 13.05 1.67 11.83 5.96 0.77 0.03 0.94 0.91
20.17 20.83 4.28 23.43 14.20 3.49 0.37 1.63 1.26
4.22 31.48 1.13 1.10 23.34 0.27 0.61 0.08 0.69
6.80 15.64 0.93 6.55 11.97 0.83 0.16 0.28 0.12
16.10 24.19 4.08 13.38 21.18 2.84 0.37 0.41 0.79
7.37 7.32 0.67 11.96 1.99 0.25 0.33 0.67 1.00
7.77 10.87 1.00 7.32 12.84 1.03 0.02 0.17 0.19
0.00 0.00 3.22 4.70 0.16 0.27 0.00 0.27
0.00 0.00 0.02 20.99 0.01 0.01 0.00 0.01
0.00 0.00 0.21 0.07 0.00 0.05 0.00 0.05
95.38 17.00 17.00 94.28 12.01 12.01 1.13 3.87 5.00
2.27 0.00
1.87 2.78
0.49 2.95
100.00 17.00 100.00 12.01
Selec�on Effect
0.5 0.0 0.5 1.0 1.5 2.0
1.6
0.9
0.7
0.4
0.3
0.3
0.1
0.2
0.3
Ac�ve Return
0.5 0.0 0.5 1.0 1.5
1.3
1.0
0.9
0.8
0.7
0.3
0.2
0.1
0.0
0.1
0.2
Alloca�on Effect
Health Care
Informa�on Technology
Materials
U�li�es
Consumer Staples
Cash
Telecommunica�on Services
Energy
Consumer Discre�onary
Industrials
Financials
0.6 0.4 0.2 0.0 0.2 0.4 0.6 0.8
0.6
0.4
0.3
0.3
0.2
0.0
0.0
0.0
0.1
0.2
0.4
As of 9/30/2012 iShares MSCI Emerging Markets Index Page 3 of 11

Manager A Por�olio Analysis
Allocation Effects
Underperform Outperform
Overw
eight
Un
derw
eight
Rel
ativ
e W
eigh
t
Relative Return
8.00
4.00
0.00
-4.00
-8.00-20.00 -16.00 -12.00 -8.00 -4.00 0.00 4.00 8.00 12.00 16.00 20.00
43
2
1
5
4
3
21
Best Weighting Weight +/- Return +/- Effect
1 Health Care 3.26 19.47 0.61
2 Information Technology 2.69 12.18 0.37
3 Materials -4.96 -4.68 0.33
4 Utilities -3.42 -7.30 0.27
5 Consumer Staples 6.92 1.66 0.22
Worst Weighting Weight +/- Return +/- Effect
1 Financials -3.72 8.82 -0.37
2 Consumer Discretionary -1.74 3.59 -0.14
3 Telecommunication Services 0.39 -1.13 -0.02
4 Unclassified -0.02 8.99 -0.01
As of 9/30/2012 iShares MSCI Emerging Markets Index Page 4 of 11

Manager A Por�olio Analysis
Selec�on Effects
Underperform Outperform
Ov
erw
eig
ht
Un
de
rwe
igh
tR
ela
�ve
We
igh
t
Rela�ve Return
3.00
1.50
0.00
1.50
3.00100.00 80.00 60.00 40.00 20.00 0.00 20.00 40.00 60.00 80.00 100.00
15
141312
11
10
9
87
65
4
3
2
1
1514
1312
11
1098
7
65 4
3
2 1
Best Selec�ons GICS Sector Weight +/ Return +/ Effect
1 Arcelik A.S. Consumer Discre�on... 2.53 60.87 1.14
2 Ambuja Cements Ltd. Materials 2.62 31.34 0.79
3 Grupo Financiero Ban... Financials 1.31 73.86 0.70
4 Siam Commercial Ban...Financials 1.78 41.13 0.63
5 Ecopetrol S.A. ADR Energy 1.65 27.31 0.46
6 Semen Gresik (Perser... Materials 2.04 20.49 0.39
7 Grupo Aeroportuario ... Industrials 0.86 51.89 0.37
8 Copa Holdings SA Cla... Industrials 1.23 30.04 0.35
9 Axis Bank Ltd. Financials 1.40 29.58 0.32
10 Transne�' AK OAO Energy 1.07 21.47 0.29
11 Sociedad Quimica Y ... Materials 2.24 12.93 0.28
12 LUKOIL Oil Company J... Energy 1.89 14.61 0.27
13 Sberbank of Russia OJ...Financials 2.21 8.32 0.26
14 HDFC Bank Ltd ADR Financials 0.90 29.79 0.25
15 Zenith Bank Plc Financials 0.54 8.50 0.24
Worst Selec�ons GICS Sector Weight +/ Return +/ Effect
1 Vale S.A. ADR Materials 2.39 16.84 0.51
2 Itau Unibanco Holdin... Financials 1.36 30.29 0.50
3 Bank Bradesco ADR Financials 2.13 16.67 0.42
4 ANTA Sports Products...Consumer Discre�on... 0.62 42.31 0.41
5 Millicom Interna�ona... Telecommunica�on S... 1.60 19.14 0.37
6 Petroleo Brasileiro SA... Energy 1.79 11.85 0.28
7 Impala Pla�num Hold... Materials 0.94 19.77 0.27
8 Baidu, Inc. ADR Informa�on Technology 1.23 20.82 0.26
9 United Tractors Tbk Industrials 0.61 36.47 0.26
10 Astra Interna�onal Tbk Consumer Discre�on... 1.42 16.09 0.24
11 Bank Rakyat Indonesi... Financials 1.89 8.00 0.22
12 Hankook Tire Worldw... Consumer Discre�on... 0.75 17.21 0.19
13 Wumart Stores, Inc. H...Consumer Staples 0.29 44.54 0.18
14 Synnex Technology In... Informa�on Technology 0.29 22.61 0.18
15 Banco Santander Chil... Financials 1.18 14.70 0.17
As of 9/30/2012 iShares MSCI Emerging Markets Index Page 5 of 11

Manager A Por�olio Analysis
Trailing Returns
As of Date: 9/30/2012
YTD 1 year 3 years 5 years 7 years 10 yearsSince
Incep�on
Manager A
iShares MSCI Emerging Markets Index
US OE Diversified Emerging Mkts
16.72
11.70
24.74
17.47
8.73
4.94
0.45
0.91
9.37
8.39
18.47 15.86
11.36 16.44 4.54 2.85 7.02 15.10 10.59
Investment Growth
Time Period: 1/1/1999 to 9/30/2012
2000 2002 2004 2006 2008 2010 201250.0%
0.0%
50.0%
100.0%
150.0%
200.0%
250.0%
300.0%
350.0%
400.0%
450.0%
500.0%
550.0%
600.0%
650.0%
700.0%
750.0%
Manager A MSCI EM NR USD US OE Diversified Emerging Mkts
As of 9/30/2012 iShares MSCI Emerging Markets Index Page 6 of 11

Manager A Por�olio Analysis
Drawdown
Time Period: 12/1/1998 to 9/30/2012
2000 2002 2004 2006 2008 2010 201265.0
60.0
55.0
50.0
45.0
40.0
35.0
30.0
25.0
20.0
15.0
10.0
5.0
0.0
Manager A MSCI EM NR USD
Drawdown
Time Period: 10/1/2009 to 9/30/2012
Average
Drawdown
Max
Drawdown #
of
Periods
Max
Drawdown
Peak
Date
Max
Drawdown
Valley
Date
Average
Drawdown
Up
Capture
Ra�o
Down
Capture
Ra�o
Overall
Capture
Ra�o
Manager A
MSCI EM NR USD
5
5
5/1/2011
5/1/2011
9/30/2011
9/30/2011
14.49 14.49
16.81 16.81
96.05
98.02
82.87
95.42
1.16
1.03
As of 9/30/2012 iShares MSCI Emerging Markets Index Page 7 of 11
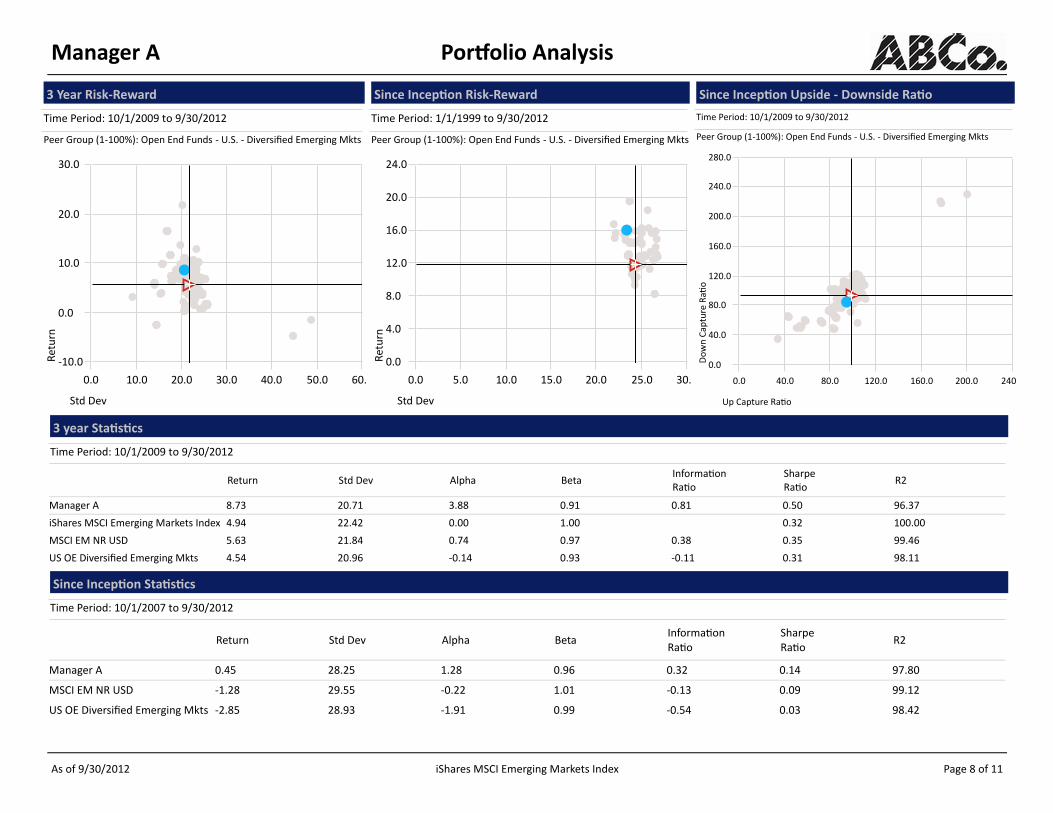
Manager A Por�olio Analysis
3 Year Risk-Reward
Time Period: 10/1/2009 to 9/30/2012
Peer Group (1100%): Open End Funds U.S. Diversified Emerging Mkts
Re
turn
Std Dev
0.0 10.0 20.0 30.0 40.0 50.0 60.0
10.0
0.0
10.0
20.0
30.0
Since Incep�on Risk-Reward
Time Period: 1/1/1999 to 9/30/2012
Peer Group (1100%): Open End Funds U.S. Diversified Emerging Mkts
Re
turn
Std Dev
0.0 5.0 10.0 15.0 20.0 25.0 30.0
0.0
4.0
8.0
12.0
16.0
20.0
24.0
Since Incep�on Upside - Downside Ra�o
Time Period: 10/1/2009 to 9/30/2012
Peer Group (1100%): Open End Funds U.S. Diversified Emerging Mkts
Do
wn
Ca
ptu
re R
a�
o
Up Capture Ra�o
0.0 40.0 80.0 120.0 160.0 200.0 240.0
0.0
40.0
80.0
120.0
160.0
200.0
240.0
280.0
3 year Sta�s�cs
Time Period: 10/1/2009 to 9/30/2012
Return Std Dev Alpha BetaInforma�on
Ra�o
Sharpe
Ra�oR2
Manager A
iShares MSCI Emerging Markets Index
MSCI EM NR USD
US OE Diversified Emerging Mkts
8.73
4.94
5.63
20.71
22.42
21.84
3.88
0.00
0.74
0.91
1.00
0.97
0.81
0.38
0.50
0.32
0.35
96.37
100.00
99.46
4.54 0.14 0.93 0.11 0.31 98.1120.96
Since Incep�on Sta�s�cs
Time Period: 10/1/2007 to 9/30/2012
Return Std Dev Alpha BetaInforma�on
Ra�o
Sharpe
Ra�oR2
Manager A
MSCI EM NR USD
US OE Diversified Emerging Mkts
0.45
1.28
28.25
29.55
1.28
0.22
2.85 28.93
0.96
1.01
0.32
0.13
0.14
0.09
97.80
99.12
1.91 0.99 0.54 0.03 98.42
As of 9/30/2012 iShares MSCI Emerging Markets Index Page 8 of 11

Manager A Por�olio Analysis
Performance Rela�ve to Peer Group
Peer Group (1100%): Open End Funds U.S. Diversified Emerging Mkts
Re
turn
37.5
30.0
22.5
15.0
7.5
YTD 1 year 3 years 5 years 7 years 10 years
0.0
7.5
15.0
22.5
30.0
37.5
45.0
52.5
Manager A iShares MSCI Emerging Markets Index MSCI EM NR USD
Rolling 36 Month Peer Group Performance
1st to 25th Percen�le 26th to Median 51st to 75th Percen�le 76th to 100th Percen�le
Re
turn
12 03 06 09 12
2003
03 06 09 12
2004
03 06 09 12
2005
03 06 09 12
2006
03 06 09 12
2007
03 06 09 12
2008
03 06 09 12
2009
03 06 09 12
2010
03 06 09 12
2011
03 06 09 12
2012
03 06 09
100.0
75.0
50.0
25.0
0.0
Manager A iShares MSCI Emerging Markets Index MSCI EM NR USD
As of 9/30/2012 iShares MSCI Emerging Markets Index Page 9 of 11

Manager A Por�olio Analysis
Performance Rela�ve to Peer Group
Peer Group (1100%): Open End Funds U.S. Diversified Emerging Mkts
Sh
arp
e R
a�
o (
ge
o)
1.0
0.5
0.0
0.5
1.0
YTD 1 year 3 years 5 years 7 years 10 years
1.5
2.0
2.5
3.0
3.5
Manager A iShares MSCI Emerging Markets Index MSCI EM NR USD
Rolling 36 Month Peer Group Performance
1st to 25th Percen�le 26th to Median 51st to 75th Percen�le 76th to 100th Percen�le
Sh
arp
e R
a�
o (
ge
o)
12 03 06 09 12
2003
03 06 09 12
2004
03 06 09 12
2005
03 06 09 12
2006
03 06 09 12
2007
03 06 09 12
2008
03 06 09 12
2009
03 06 09 12
2010
03 06 09 12
2011
03 06 09 12
2012
03 06 09
100.0
75.0
50.0
25.0
0.0
Manager A iShares MSCI Emerging Markets Index MSCI EM NR USD
As of 9/30/2012 iShares MSCI Emerging Markets Index Page 10 of 11

Manager A Por�olio Analysis
Performance Rela�ve to Peer Group
Peer Group (1100%): Open End Funds U.S. Diversified Emerging Mkts
Info
rma
�o
n R
a�
o (
ge
o)
3.0
2.3
1.5
0.8
0.0
YTD 1 year 3 years 5 years 7 years 10 years
0.8
1.5
2.3
3.0
3.8
4.5
5.3
6.0
6.8
Manager A MSCI EM NR USD
Rolling 36 Month Peer Group Performance
1st to 25th Percen�le 26th to Median 51st to 75th Percen�le 76th to 100th Percen�le
Info
rma
�o
n R
a�
o (
ge
o)
06 09 12
2007
03 06 09 12
2008
03 06 09 12
2009
03 06 09 12
2010
03 06 09 12
2011
03 06 09 12
2012
03 06 09
100.0
75.0
50.0
25.0
0.0
Manager A iShares MSCI Emerging Markets Index MSCI EM NR USD
As of 9/30/2012 iShares MSCI Emerging Markets Index Page 11 of 11