presentation on electric traction on indian railways- changing perspectives & issues
DESCRIPTION
PRESENTATION ON ELECTRIC TRACTION ON INDIAN RAILWAYS- CHANGING PERSPECTIVES & ISSUES. Ghanshyam Singh CELE/NR. SOME HISTORICAL FACTS. First Electrification - Mumbai – Kurla, 15 RKms in 1925 at 1500 V Electrified RKms prior - 388 - PowerPoint PPT PresentationTRANSCRIPT
PRESENTATION
ON
ELECTRIC TRACTION ON INDIAN RAILWAYS-
CHANGING PERSPECTIVES & ISSUES
Ghanshyam Singh CELE/NR

SOME HISTORICAL FACTS • First Electrification - Mumbai – Kurla, 15 RKms
in 1925 at 1500 V
• Electrified RKms prior - 388 to independence
• SNCF design adopted - 1957
• First Section at 3000 - Howrah-Burdhwan in 1958 volts DC
• First section electrified - Rajkharswan - Dongaposi on 25 kV AC in 1960
• Present electrification - 17450 RKms

Cumulative Progress of Railway Electrification on IR
388 529 745
24233237
41804723 4918
6440
9252
10809
13517
16001
17450
0
2000
4000
6000
8000
10000
12000
14000
16000
18000
1925-47 1961-66
(3rd Plan)
1974-
78(5th
Plan)
1985-90
(7th Plan)
1997-2002
(9th Plan)
Cumulative Progress (RKm)

CURRENT PLANS FOR ELECTRIFICATION
•Sanctioned work of electrification in various stages of progress
1362 RKms
•Works anticipated sanction during 2006-07
950 RKms
•Anticipated electrification projects during XI plan
3048 RKms
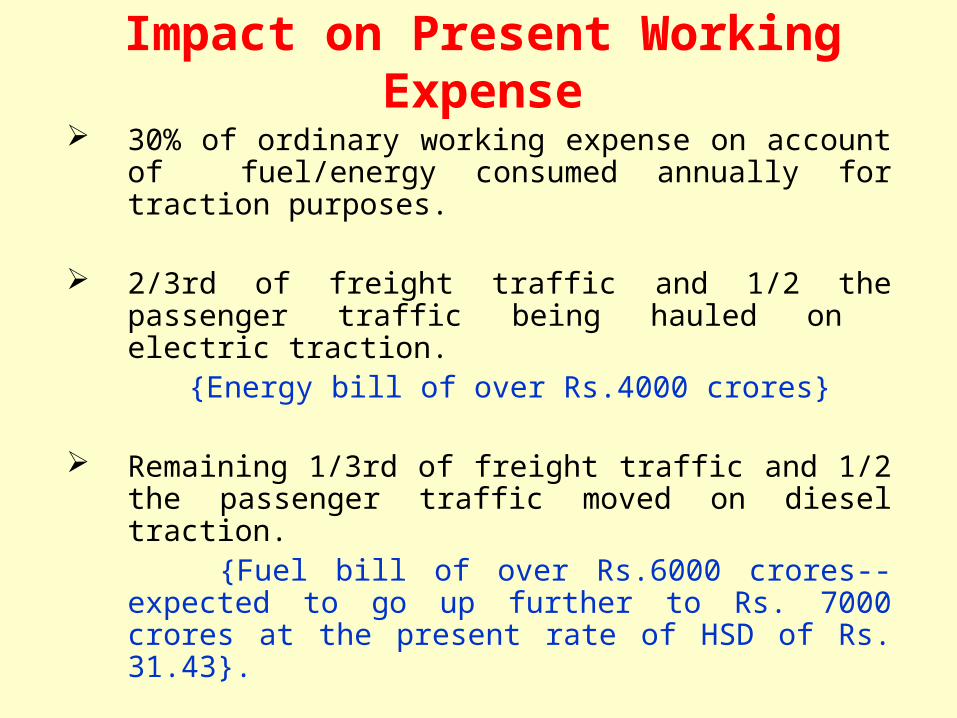
Impact on Present Working Expense
30% of ordinary working expense on account of fuel/energy consumed annually for traction purposes.
2/3rd of freight traffic and 1/2 the passenger traffic being hauled on electric traction.
{Energy bill of over Rs.4000 crores}
Remaining 1/3rd of freight traffic and 1/2 the passenger traffic moved on diesel traction.
{Fuel bill of over Rs.6000 crores-- expected to go up further to Rs. 7000 crores at the present rate of HSD of Rs. 31.43}.

Impact on Present Working Expense (Contd.)
Electrification of 17450 Route Kilometers (RKms).
Past total outlay Rs.5890 crores.
Present traffic hauled by electric traction, if hauled by
diesel traction---additional cost Rs. 3800 crores annually
Investment of about Rs.6000 crores till now towards
electrification resulting in a saving of Rs.3800 crores
annually
Instrumental towards the surplus generated presently
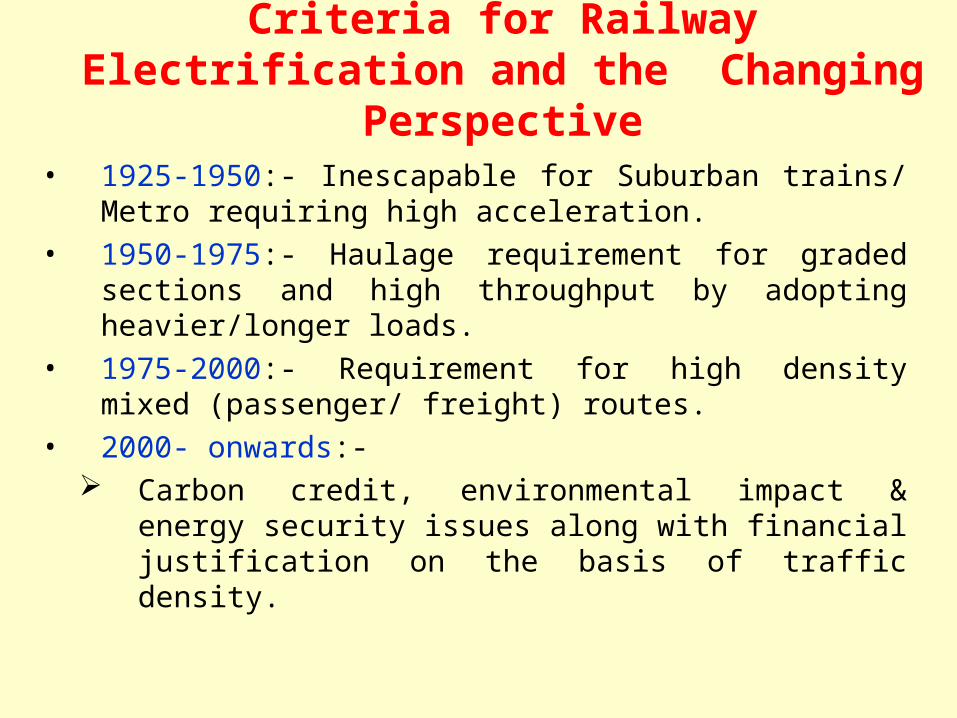
Criteria for Railway Electrification and the Changing Perspective
• 1925-1950:- Inescapable for Suburban trains/ Metro requiring high acceleration.
• 1950-1975:- Haulage requirement for graded sections and high throughput by adopting heavier/longer loads.
• 1975-2000:- Requirement for high density mixed (passenger/ freight) routes.
• 2000- onwards:- Carbon credit, environmental impact & energy
security issues along with financial justification on the basis of traffic density.
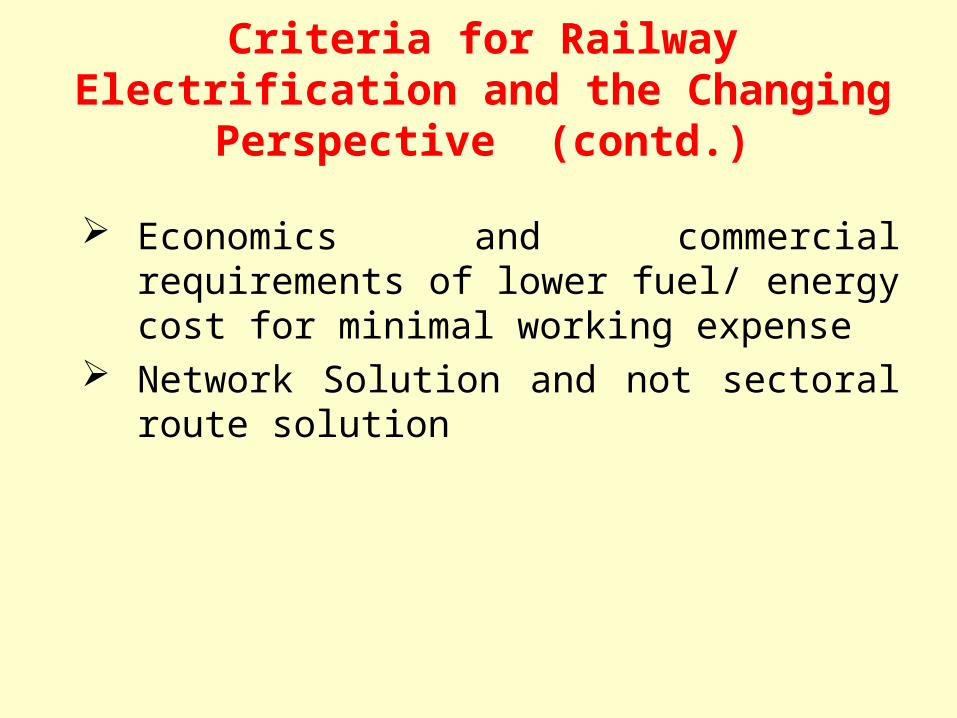
Criteria for Railway Electrification and the Changing Perspective (contd.)
Economics and commercial requirements of lower fuel/ energy cost for minimal working expense
Network Solution and not sectoral route solution

Network Planning
1. Backbone Network:-• Golden Quadrilateral (present)• Dedicated Freight corridor (future)
2. Other Networks:-• Other routes connecting major production and
consumption and export gateways. • Missing links and spurs in the existing electrified
network
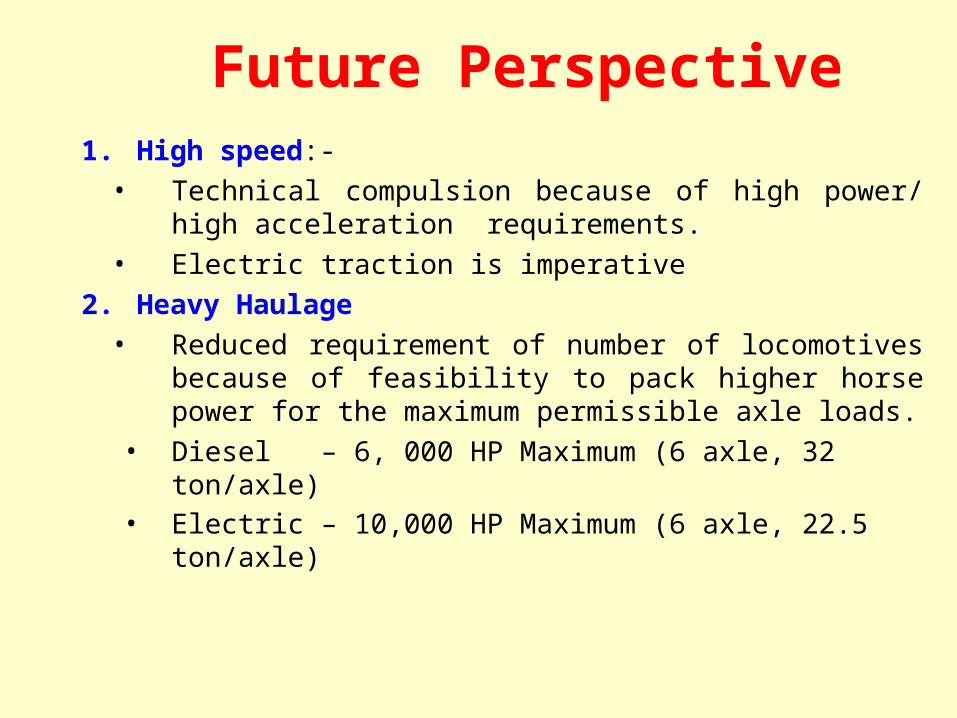
Future Perspective1. High speed:-
• Technical compulsion because of high power/ high acceleration requirements.
• Electric traction is imperative
2. Heavy Haulage• Reduced requirement of number of locomotives
because of feasibility to pack higher horse power for the maximum permissible axle loads.
• Diesel – 6, 000 HP Maximum (6 axle, 32 ton/axle) • Electric – 10,000 HP Maximum (6 axle, 22.5
ton/axle)

Perceived Limitations/issues of Electric Traction
LIMITATIONS/ISSUES COMMENTS
Double Stack Container(DSC) not feasible under wire. No where in the world DSC is operated on Electric traction
OHE designs have no limitation. US Rail Road & Chinese Rly are already operating DSC under wire.
Change of traction created on the route after electrification affecting flow of traffic at jns. where it can not be done under the shadow of other activities (crew change, cleaning, catering, parcel)
Electrification on a route primarily for major streams, traction change for minor streams can be addressed by adopting network electrification approach within the limits of viability.
Shunting on unwired lines and last mile access to accident and breakdown sites
Adoption of dual traction/ battery operated locomotives as shunters in electrified territory.
Additional time required for restoration of OHE after accident
Can be minimized to the time required for Tower Wagon checking.
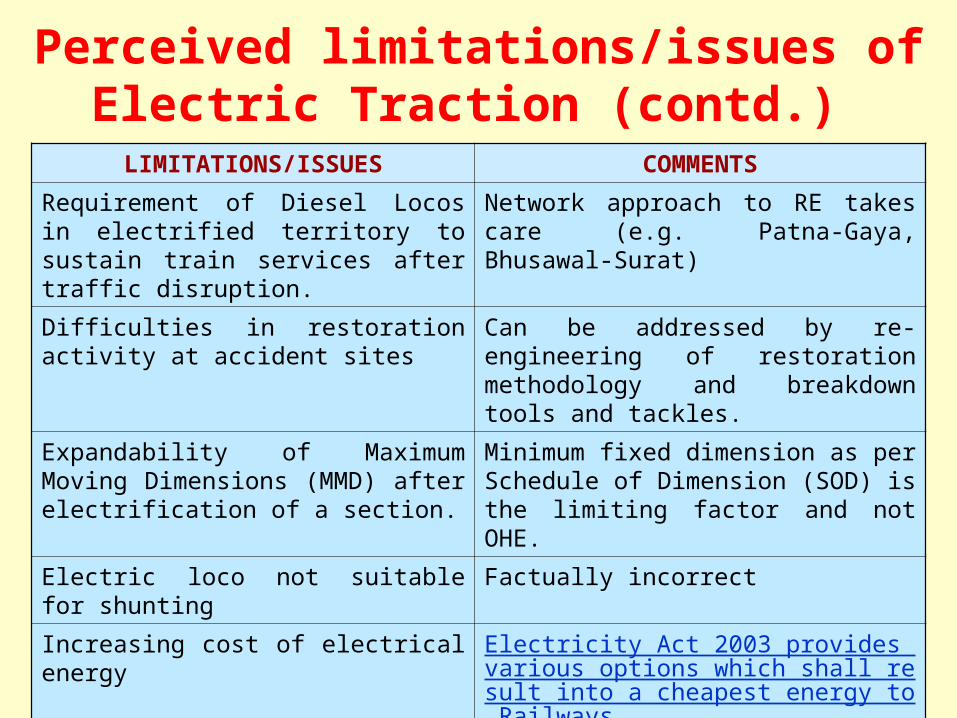
LIMITATIONS/ISSUES COMMENTS
Requirement of Diesel Locos in electrified territory to sustain train services after traffic disruption.
Network approach to RE takes care (e.g. Patna-Gaya, Bhusawal-Surat)
Difficulties in restoration activity at accident sites
Can be addressed by re-engineering of restoration methodology and breakdown tools and tackles.
Expandability of Maximum Moving Dimensions (MMD) after electrification of a section.
Minimum fixed dimension as per Schedule of Dimension (SOD) is the limiting factor and not OHE.
Electric loco not suitable for shunting Factually incorrect
Increasing cost of electrical energy Electricity Act 2003 provides various options which shall result into a cheapest energy to Railways.
Perceived limitations/issues of Electric Traction (contd.)

LIMITATIONS/ISSUES COMMENTS
Availability of Energy Electrical –
•Average shortage of 8% and peaking shortage of 11% (against 30% in the past)
•will be bridged with initiatives taken in the power sector.
Diesel-
•Shortage of 70%
•being met by imports
•Depleting global resources.
•Global developments (war etc.)
•Exorbitant rise in Green House Gases in atmosphere
Any Other ??????????????? Technology knows no limitation.
Perceived limitations/issues of Electric Traction (contd.)
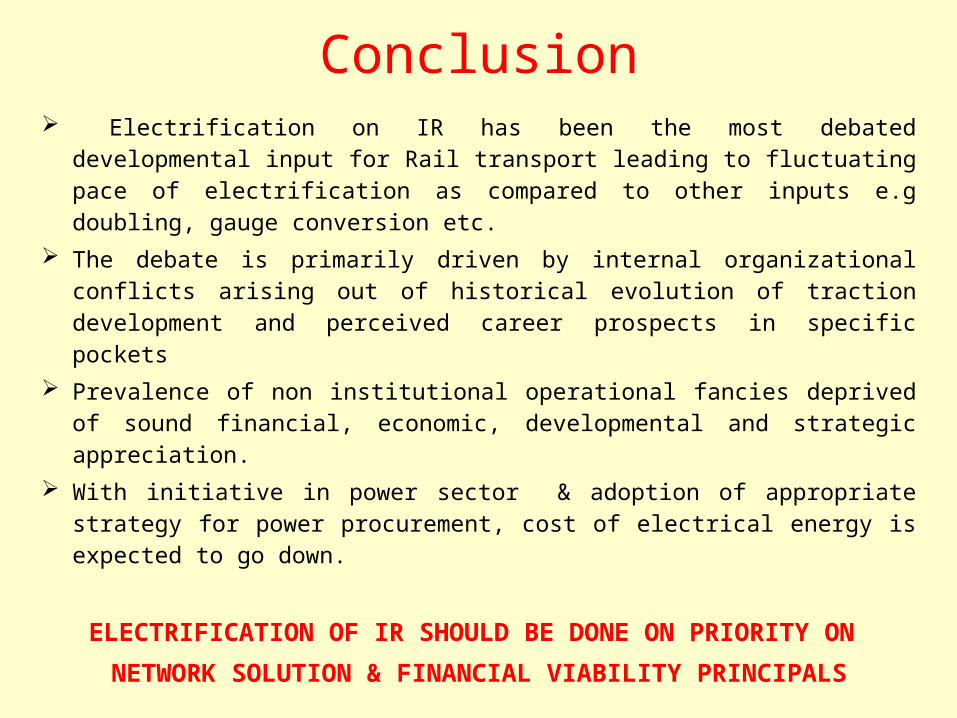
Conclusion Electrification on IR has been the most debated developmental input
for Rail transport leading to fluctuating pace of electrification as compared to other inputs e.g doubling, gauge conversion etc.
The debate is primarily driven by internal organizational conflicts arising out of historical evolution of traction development and perceived career prospects in specific pockets
Prevalence of non institutional operational fancies deprived of sound financial, economic, developmental and strategic appreciation.
With initiative in power sector & adoption of appropriate strategy for power procurement, cost of electrical energy is expected to go down.
ELECTRIFICATION OF IR SHOULD BE DONE ON PRIORITY ON
NETWORK SOLUTION & FINANCIAL VIABILITY PRINCIPALS


Strategies which needs to be looked into & evaluated for adoption on IR
Creation of Energy Management Organization
Creation of PSU as Distribution licensee
Captive Generation Plan
Deemed Captive & Distributed Generation
Power Purchased from IPP/PTC through Open Access
Power Purchase through State Utility(present model)
Representations before SERCs
& Appellate tribunals for reasonable tariffs
Power purchase from central generating units.
Demand side management

TREND OF AVERAGE UNIT RATE
0255075
100125150175200225250275300325350375400425450
1970
-71
1972
-73
1974
-75
1976
-77
1978
-79
1980
-81
1982
-83
1984
-85
1986
-87
1988
-89
1990
-91
1992
-93
1994
-95
1996
-97
1998
-99
2000
-01
2002
-03
2004
-05
Average unit rate (paise)

Creation of Energy Management Organization
• Creation of Dedicated Energy Management Cell at
Divisional, Zonal & Board’s level .
• Objectives of the organizationAnalysis of consumption pattern and exercise control
over consumption & quality of power consumed.Evaluate various options of purchase of cheaper energy.Analysis of ARR/tariff orders of State Utilities.Filling objections.suggestions to SERCs.Filing appeal with Appellate Tribunal.Regulate contract demand with distribution licensee as
per consumption pattern & anticipated traffic.Energy conservation measure.
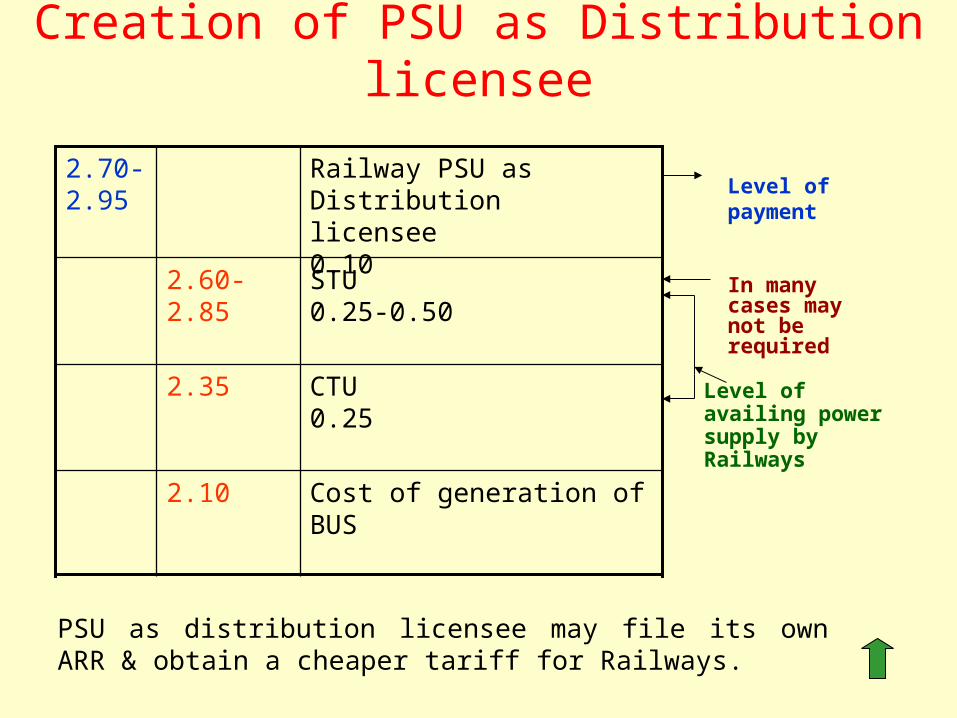
Creation of PSU as Distribution licensee
Cost of generation of BUS2.10
CTU 0.25
2.35
STU0.25-0.50
2.60-2.85
Railway PSU as Distribution licensee0.10
2.70-2.95
Level of payment
In many cases may not be required
Level of availing power supply by Railways
PSU as distribution licensee may file its own ARR & obtain a cheaper tariff for Railways.

Captive Generation Plan Indian Railways may install its own captive generation plant
Cost of generation
2.10
Level of availing power supply by Railways
CTU0.25
2.35
STU0.25-0.50
2.60-2.85
Level at which payments to be made by Railways
2.60-2.85
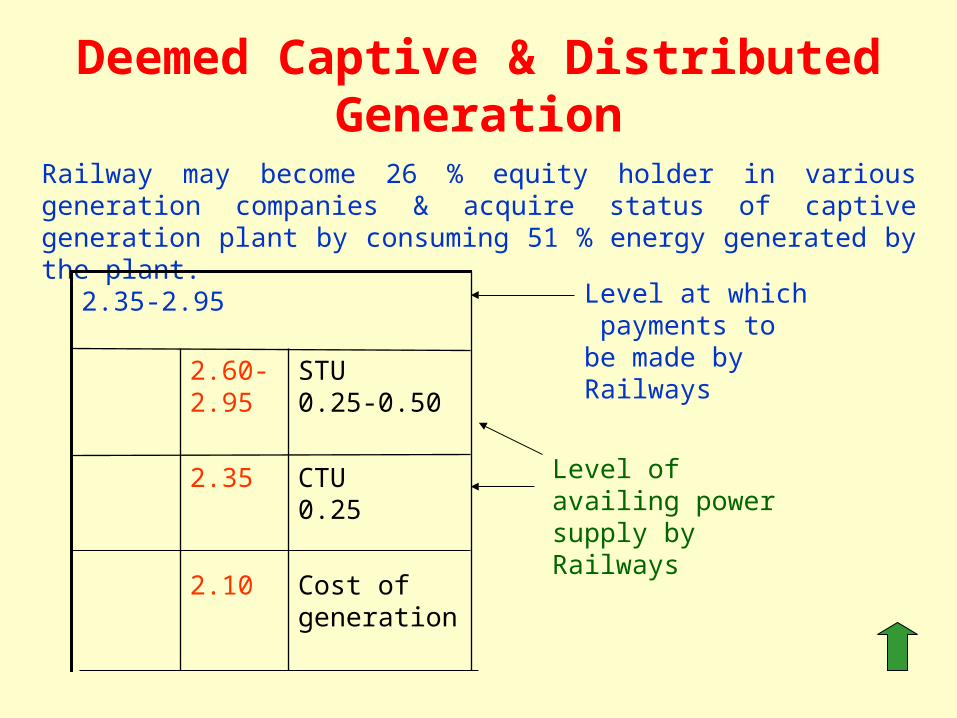
Deemed Captive & Distributed Generation
Railway may become 26 % equity holder in various generation companies & acquire status of captive generation plant by consuming 51 % energy generated by the plant.
Cost of generation
2.10
Level of availing power supply by Railways
CTU0.25
2.35
STU0.25-0.50
2.60-2.95
Level at which payments to be made by Railways
2.35-2.95
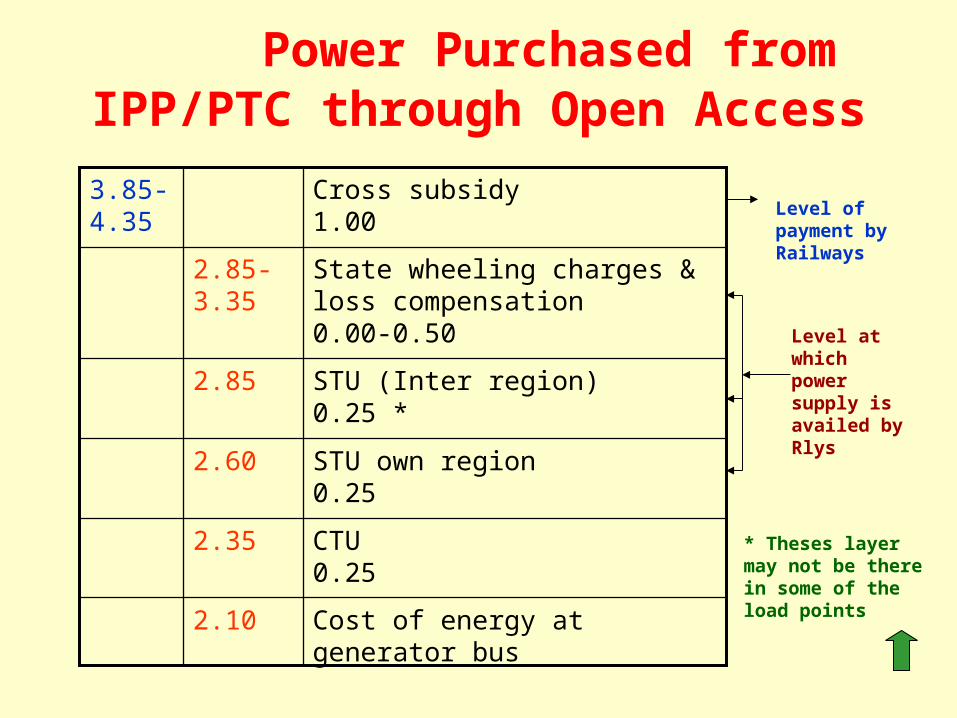
Power Purchased from IPP/PTC through Open Access
Cost of energy at generator bus2.10
CTU0.25
2.35
STU own region0.25
2.60
STU (Inter region)0.25 *
2.85
State wheeling charges & loss compensation 0.00-0.50
2.85-3.35
Cross subsidy1.00
3.85-4.35
Level of payment by Railways
Level at which power supply is availed by Rlys
* Theses layer may not be there in some of the load points

Power Purchase through State Utility ( Present model)
Cost of purchase by utility1.95
1.95
CTU (PGCIL)(Wheeling charges+loss compensation)0.25
2.20
STU (Wheeling + loss compensation)0.25
2.45
O & M+Distribution loss+ inefficiency0.75
3.20
Surcharge (Cross subsidy to other consumers)1.02
4.22Payment is made by Railways
Level at which power supply is availed by Railways

Representations before SERCs & Appellate tribunals for reasonable tariffs
• Regular representation to SERCs in a professional way • Following table showing the trend of average unit cost as a
result of regular representation to SERCs
2000-01 2001-02 2002-03 2003-04 2004-05
428 427 428 428 421

POWER PROCURED THROUGH CENTRAL GENERATING UNITS
Level at which payment is made
Level at which power supply is availed by Railways
3.66 To NTPC as extra surcharge as per commitment
0.50
3.16 Surcharge by state utility
0.46
2.70 Rly network-Wheeling+ loss compensation
0.25
2.45 CTU (PGCIL)
0.25
2.20 Cost of power from NTPC
2.20

Demand Side Management
• Correct estimation of contract demand.
• On line monitoring of actual maximum demand.
• Ensuring high load factor.
• Load balancing through transfer of sections between
feeding zones.
• Installation of power factor correction equipment.
• Real time on line coordination with Traffic.