presentation - mdi and the mdi and the national toxics ... · chemical company, huntsman...
TRANSCRIPT

MDI and theMDI and theNational Toxics InventoryNational Toxics Inventory
Adams Mark HotelDenver, Colorado
May 3, 2001
10th Annual Emission Inventory10th Annual Emission InventoryConferenceConference
Bill RobertBASF, Diisocyanates Panel
Scott SchangLatham & Watkins

2
Diisocyanates PanelDiisocyanates Panel
• The Diisocyanates Panel is a self-fundedpanel of the American Chemistry Councilthat represents the major manufacturersof diisocyanates, including MDI.
• Members of the Panel are BASFCorporation, Bayer Corporation, The DowChemical Company, HuntsmanPolyurethanes, and Lyondell ChemicalCompany.

3
Methylene DiphenylMethylene DiphenylDiisocyanateDiisocyanate• MDI is widely used in the production of
rigid polyurethane foams: applianceinsulation, automobile parts, spray foam.
• MDI is used to a lesser extent in theproduction of coatings, adhesives,sealants, and elastomers, as well as inwood binding facilities to form polyurea.

4
General OverviewGeneral Overview
• EPA and Diisocyanates Panel workedtogether to update the 1996 NTI to moreaccurately identify the number offacilities emitting MDI and to moreaccurately estimate MDI emissions.
• Number of MDI-emitting facilitiesincreased 400% while nationwide MDIemissions decreased 75%.
5
National Toxics InventoryNational Toxics Inventory
• Created in 1993 as part of National AirToxics Assessment to measure HAPemission reductions and evaluate HAPrisk reduction efforts.
• NTI designed to be model-readyinventory that would be updated everythree years.
6
NTI Data SourcesNTI Data Sources
• Five primary sources of data for 1996 NTI:– State and local HAP inventories
– EPA MACT data
– EPA TRI data
– EPA mobile source emission estimates
– Emission factors and activity data

7
MDI Emissions on 1996 NTIMDI Emissions on 1996 NTI
• The 1996 NTI estimated MDI emissionsat 129 tons, with some facilities emittingas much as 26 tons.
• 248 facilities were listed as emitting MDI.
• No emissions were listed for severalindustrial states.
8
MDI Has Many IsomersMDI Has Many Isomers
• The HAP at issue is methylene diphenyldiisocyanate (4,4’ MDI). Many facilitiesuse polymeric MDI, which has varyingamounts of 4,4’ MDI as a component.
• The data presented reflect predominantly4,4’-MDI emissions. Correction factorswere used to account for polymeric MDIemissions.

9
MDI Emissions Are Extremely LowMDI Emissions Are Extremely Low
• MDI reacts very quickly when formingpolyurethane, and virtually all MDI isreacted.
• MDI has a very low vapor pressure(1 x 10⁻⁵ mm Hg @ 20oC) (5 x 10⁻⁵ mmHG @ 40oC) and is not readily emittedfrom handling and storage activities.

10
Estimating MDI Emissions:Estimating MDI Emissions:Notebook MethodNotebook Method
• Industry developed a Notebook providinga method for calculating MDI emissions in1991.
• The MDI Emission Notebook method wasapproved by EPA in 1994.
• Industry initiated outreach efforts toeducate customers that MDI emissionsgenerally do not equal MDI usage.
11
Monitoring MDI EmissionsMonitoring MDI Emissions
• Until recently, EPA’s Conditional Method23 was only method available forsampling MDI emissions.
• Costs roughly $25,000-30,000 per stack.
• Resulted in little sampling being done.
• Sampling that was done showedemissions consistent with the MDIEmissions Notebook method.

12
MDI Method DevelopmentMDI Method Development
• Richard Ode, Bayer Corp., developedConditional Method 31, which uses 13mm filters with 1,2 pyridyl piperazine.
• EPA reviewed and approved the testmethod.
• Allowed verification of Notebook method.
• Costs $5,000-7,000 per facility to use.
• Data are biased high.
13
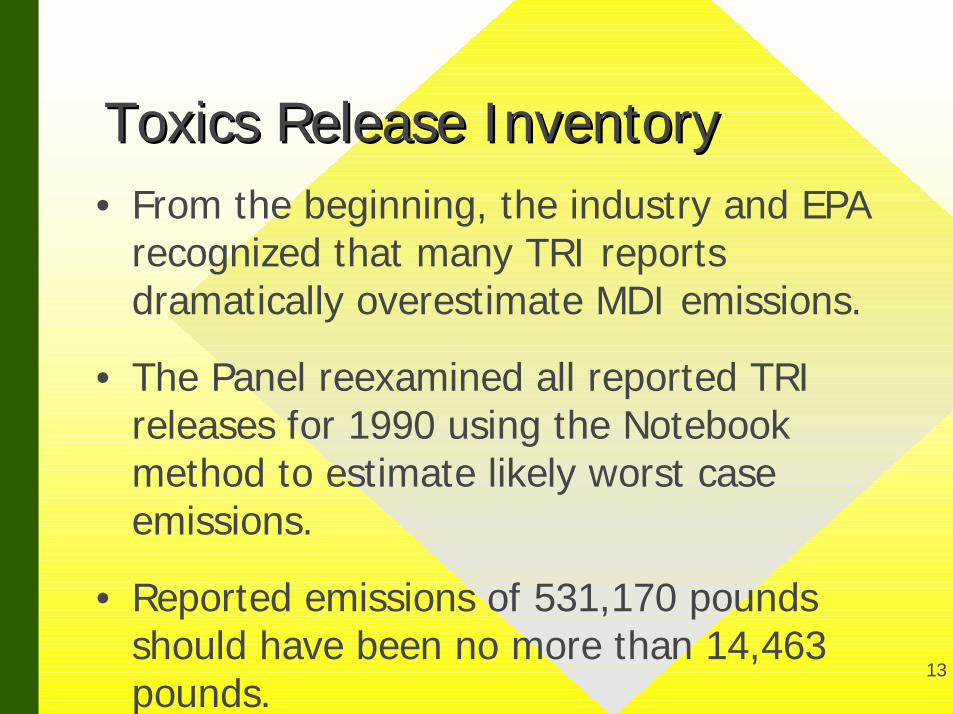
Toxics Release InventoryToxics Release Inventory• From the beginning, the industry and EPA
recognized that many TRI reportsdramatically overestimate MDI emissions.
• The Panel reexamined all reported TRIreleases for 1990 using the Notebookmethod to estimate likely worst caseemissions.
• Reported emissions of 531,170 poundsshould have been no more than 14,463pounds.
14
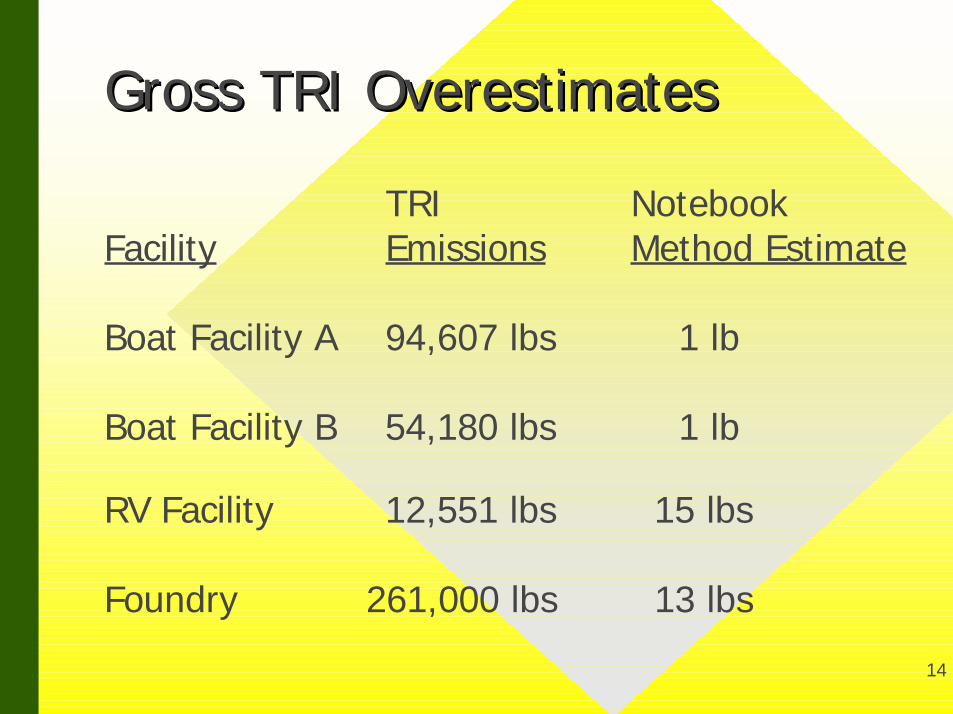
Gross TRI OverestimatesGross TRI Overestimates
TRI NotebookFacility Emissions Method Estimate
Boat Facility A 94,607 lbs 1 lb
Boat Facility B 54,180 lbs 1 lb
RV Facility 12,551 lbs 15 lbs
Foundry 261,000 lbs 13 lbs
15
Goal: Make NTI MDI DataGoal: Make NTI MDI DataMore AccurateMore Accurate
• Just as with the TRI, the NTI greatlyoverstated many facilities’ emissions.
• Many facilities that appeared in TRI werenot listed on the NTI.

16
Not All MDI FacilitiesNot All MDI FacilitiesWere Identified on the NTIWere Identified on the NTI• The NTI data for MDI came solely from
state emission inventories, which weresubmitted by only 36 states.
• Beginning in 1994, TRI required MDIreleases to be reported as part of a“diisocyanates” category withoutspecifying CASRNs.
• When the TRI was searched for facilitiesemitting MDI based on the MDI CASRN,none was found.
17
Identification of FacilitiesIdentification of Facilities
• The Panel examined the 1993 TRIreports of MDI releases and furtheranalyzed the 1996 TRI releases toidentify facilities likely emitting MDI thatwere not listed on the NTI.
• This increased the number of MDI-emitting facilities on the 1996 NTI from248 to 1,088.

18
Reviewing NTI MDI EmissionsReviewing NTI MDI Emissions
• Multi-Step Process:– Create source categories
– Estimate reasonable worst-case emissionsfor each category
– Conduct sampling to validate
– Re-adjust source category estimate, ifneeded
– Use most reliable/reasonable emissionestimate for NTI
19
Creation of Source CategoriesCreation of Source Categories
• The universe of facilities emitting MDIwas divided into 30 source categoriesbased on their SIC Code and selectivecontacts with facilities to confirm theirmethod of MDI usage.
• The Panel also relied on membercompanies’ expertise with regard tocustomer facilities.

20
Categories of MDI EmittersCategories of MDI EmittersAir filter Foundry
Appliance LaminatorAppliance - truck Mobile home
Auto OilBoat Packaging
Coating - adhesive ProducersCoating - elastomeric Rebond
Coating - other RecreationCoating - sealant RepackagersCoating - TPU Shoe soleCustom molder Spandex
Door Specialty producerElectronics Tire fill
Filter devices Water heaterFoam Producer Wood binders

21
30 Categories, But Only 330 Categories, But Only 3Types of ProcessesTypes of Processes• Enclosed
• Open
• Specialty

22
Enclosed ProcessesEnclosed Processes
• Enclosed Process: MDI or PMDI isinjected, poured, or sprayed into acavity, mold, or other enclosed space andexpands to fill space.
• Examples: appliance, auto, boat, custommolder, door, foundry, laminator, mobilehome, lubricant, rebond, recreation, shoesole, water heater, wood binder.

23
Open ProcessesOpen Processes
• Open Processes: MDI or PMDI isinjected, poured, sprayed or coated ontoa surface that is exposed to theatmosphere.
• Example: adhesives, air filter, coating,electronic, foundry, packaging, sprayfoaming, sealants.

24
Specialty ApplicationsSpecialty Applications• Miscellaneous applications use neither
open nor closed processes, such as woodbinders and spandex.
• Difficult to apply Notebook estimationmethod to such applications.

25
Source Category EmissionSource Category EmissionEstimatesEstimates• Using the API Notebook method and
conservative assumptions, reasonableworst-case emissions estimates for eachtype of process were created.
• Under this method, fugitive emissionestimates were based on the assumptionthat MDI is present throughout the areain a uniform concentration, which is farmore conservative than actualobservations.

26
Category Emissions Based on NotebookCategory Emissions Based on NotebookCategory
Estimated Emissions of Highest EmittingSource in Category (lbs./yr)
Air filter 15Appliance 21Appliance - truck 9Auto 15Boat 9Coating - adhesive 15Coating - elastomeric 15Coating - other 15Coating - sealant 15Coating - TPU 15Custom molder 9Door 4Electronics 15Filter devices 9Foam producer 21Foundry 13Laminator 17Mobile home 15Oil 9Packaging 15Producers N/ARebond 70Recreation 15Repackagers N/AShoe sole 15Spandex 15Specialty producer 10Tire fill 4Water heater 17Wood binders N/A

27
MDI Emissions MonitoringMDI Emissions Monitoring
• The Panel monitored MDI emissions fromrepresentative facilities to validate andbetter quantify emissions estimatesobtained using the Notebook method.
• Roy Weston, Inc., which collaboratedwith the Panel in developing CM-31,conducted the monitoring.

28
Facilities MonitoredFacilities Monitored
• The Panel monitored 66 stacks at 18facilities nationwide representing 13different applications.
• Types of facilities monitored account formore than 95% of MDI emissions.
• CM-31 was used as a lower costscreening method that wouldoverestimate emissions.

29
Enclosed Process Facility A Facility B Facility CAppliance 9**
Appliance -Trucks 3.3**Auto 3.6Door 0.4**
Laminator 0.13** 2.9**Rebond 0.19**Foundry 18.5** 40.7**
Open ProcessAdhesive 1.2**Air Filter 0.4
AGRI-Fiber Particleboard 71 108 126Spray Foaming 1.5**
Special ProcessBelt Manufacturing 1368 6911
Spandex 1.3**
** Below Equipment Detection Limit
Annual Stack EmissionsAnnual Stack Emissions(lbs./year/line)(lbs./year/line)
30
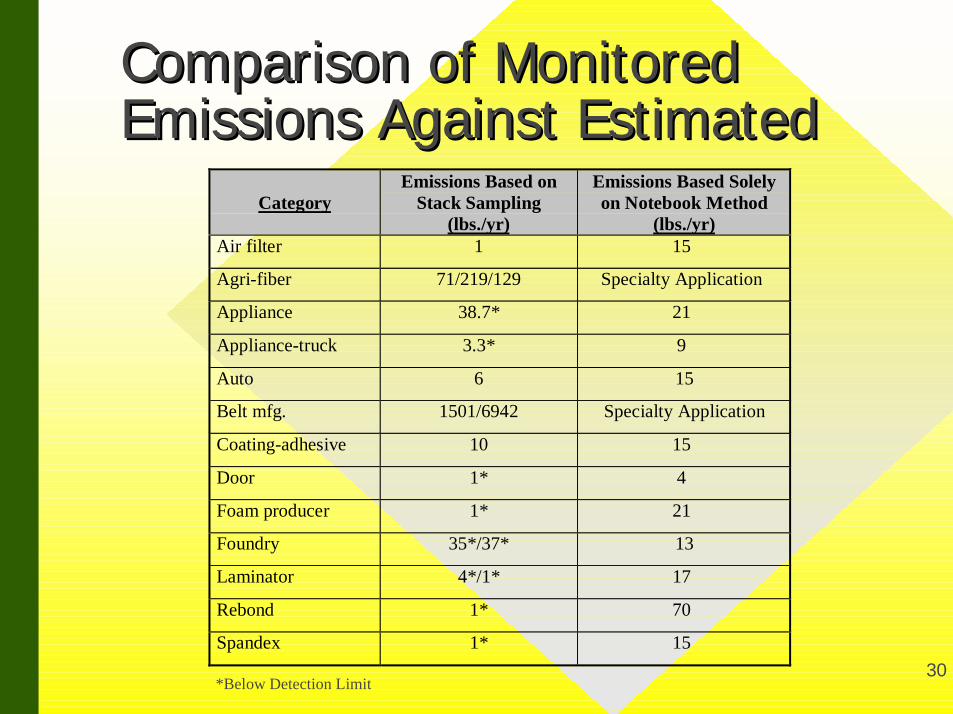
Comparison of MonitoredComparison of MonitoredEmissions Against EstimatedEmissions Against Estimated
CategoryEmissions Based on
Stack Sampling(lbs./yr)
Emissions Based Solelyon Notebook Method
(lbs./yr)Air filter 1 15
Agri-fiber 71/219/129 Specialty Application
Appliance 38.7* 21
Appliance-truck 3.3* 9
Auto 6 15
Belt mfg. 1501/6942 Specialty Application
Coating-adhesive 10 15
Door 1* 4
Foam producer 1* 21
Foundry 35*/37* 13
Laminator 4*/1* 17
Rebond 1* 70
Spandex 1* 15
*Below Detection Limit
31
Revision of NTIRevision of NTI
• The NTI, TRI, and source category valueswere compared.
• Due to the history of significantoverreporting, the TRI or source categoryestimate was used if the NTI valueappeared to be a significant overestimate.
• Thus, even with revision, the NTI stilllikely greatly overstates MDI emissions.

32
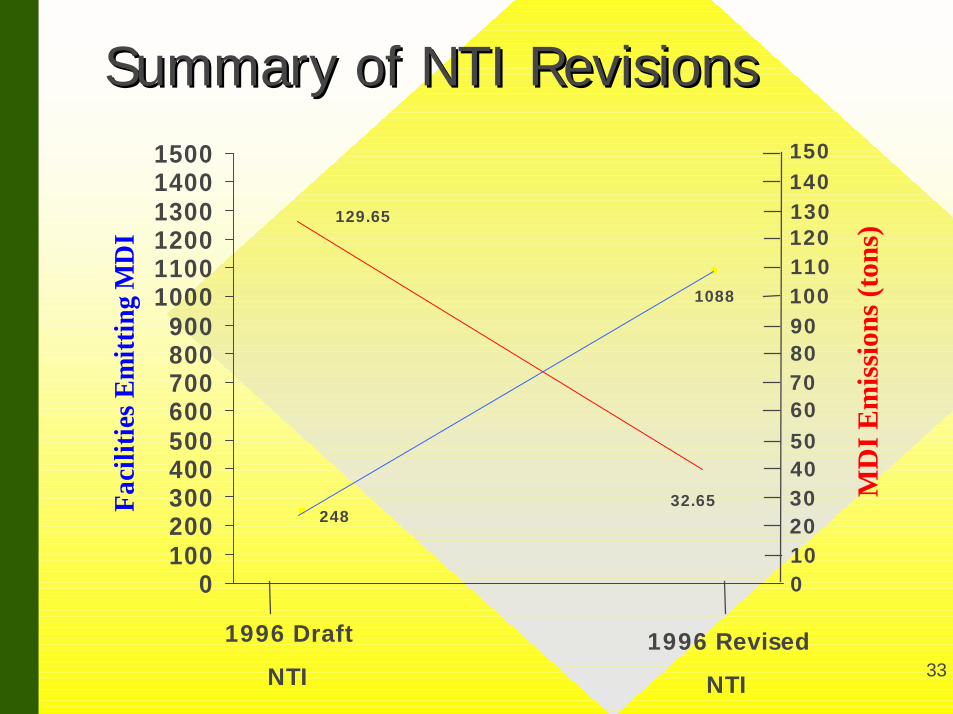
Effect on NTIEffect on NTI
• Total MDI emissions reported on thedraft 1996 NTI fell from 129.24 tons to9.20 tons based upon modifications to139 of 248 facilities’ emissions.
• MDI emissions for 840 facilities wereadded to the draft 1996 NTI. Emissionsfor these facilities fell from 265.53 tonson the TRI to 23.45 tons on the NTI.
33
0100200300400500600700800900
100011001200130014001500
Faci
litie
s Em
ittin
g M
DI
129.65
1088
24832.65
Summary of NTI RevisionsSummary of NTI Revisions
MD
I Em
issi
ons (
tons
)
1996 Draft
NTI1996 Revised
NTI
1501401301201101009080706050403020100
34
ConclusionsConclusions
• Cooperation between industry andregulators can result in more accurate,though still highly conservative,inventories.
• Involvement by state and local agenciesis imperative to obtaining accurate,complete inventories.
• Outreach efforts to facilities need to becontinued.